Insight into the Degradation of Two Benzophenone-Type UV Filters by the UV/H2O2 Advanced Oxidation Process


Abstract
:1. Introduction
2. Materials and Methods
2.1. Chemicals and Reagents
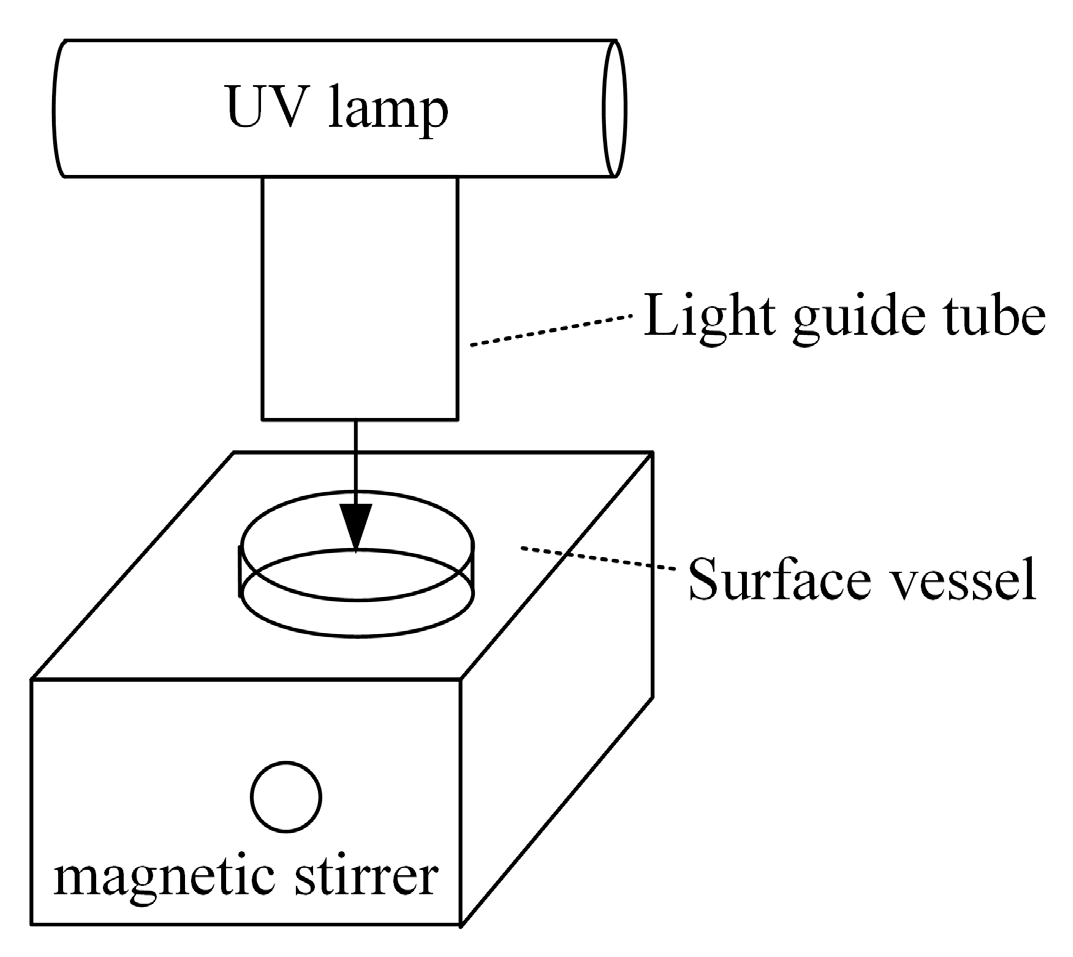
2.2. Photoreactor and Experimental Tests
2.3. Compounds Determination
2.4. Degradation Products Identification
2.5. CCD Experimental Design and RSM Analysis
3. Results and Discussion
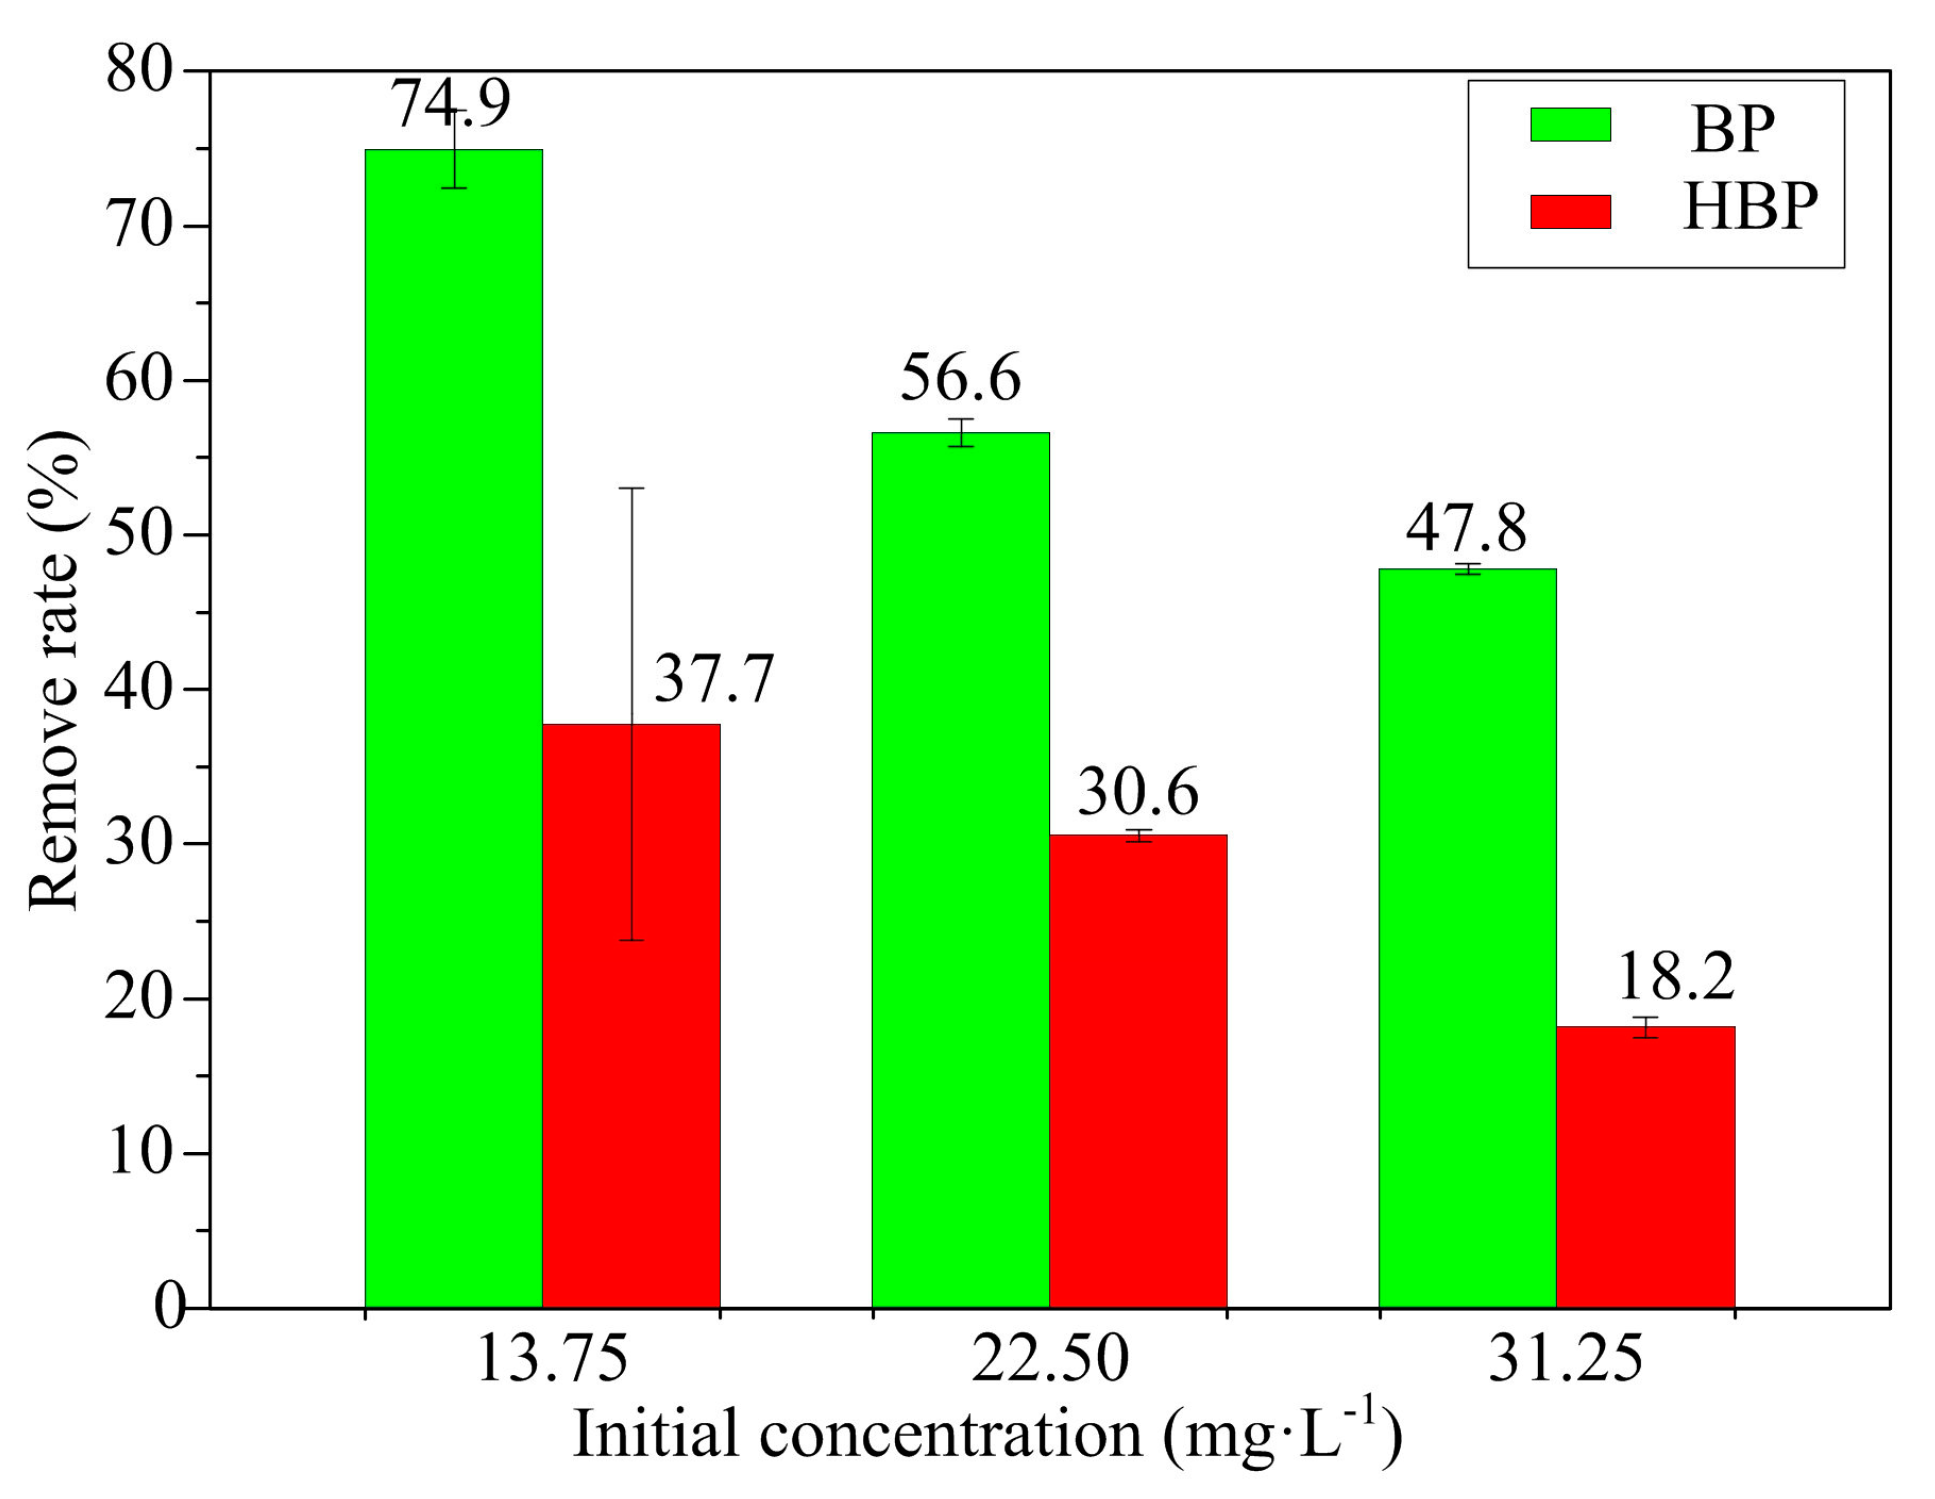
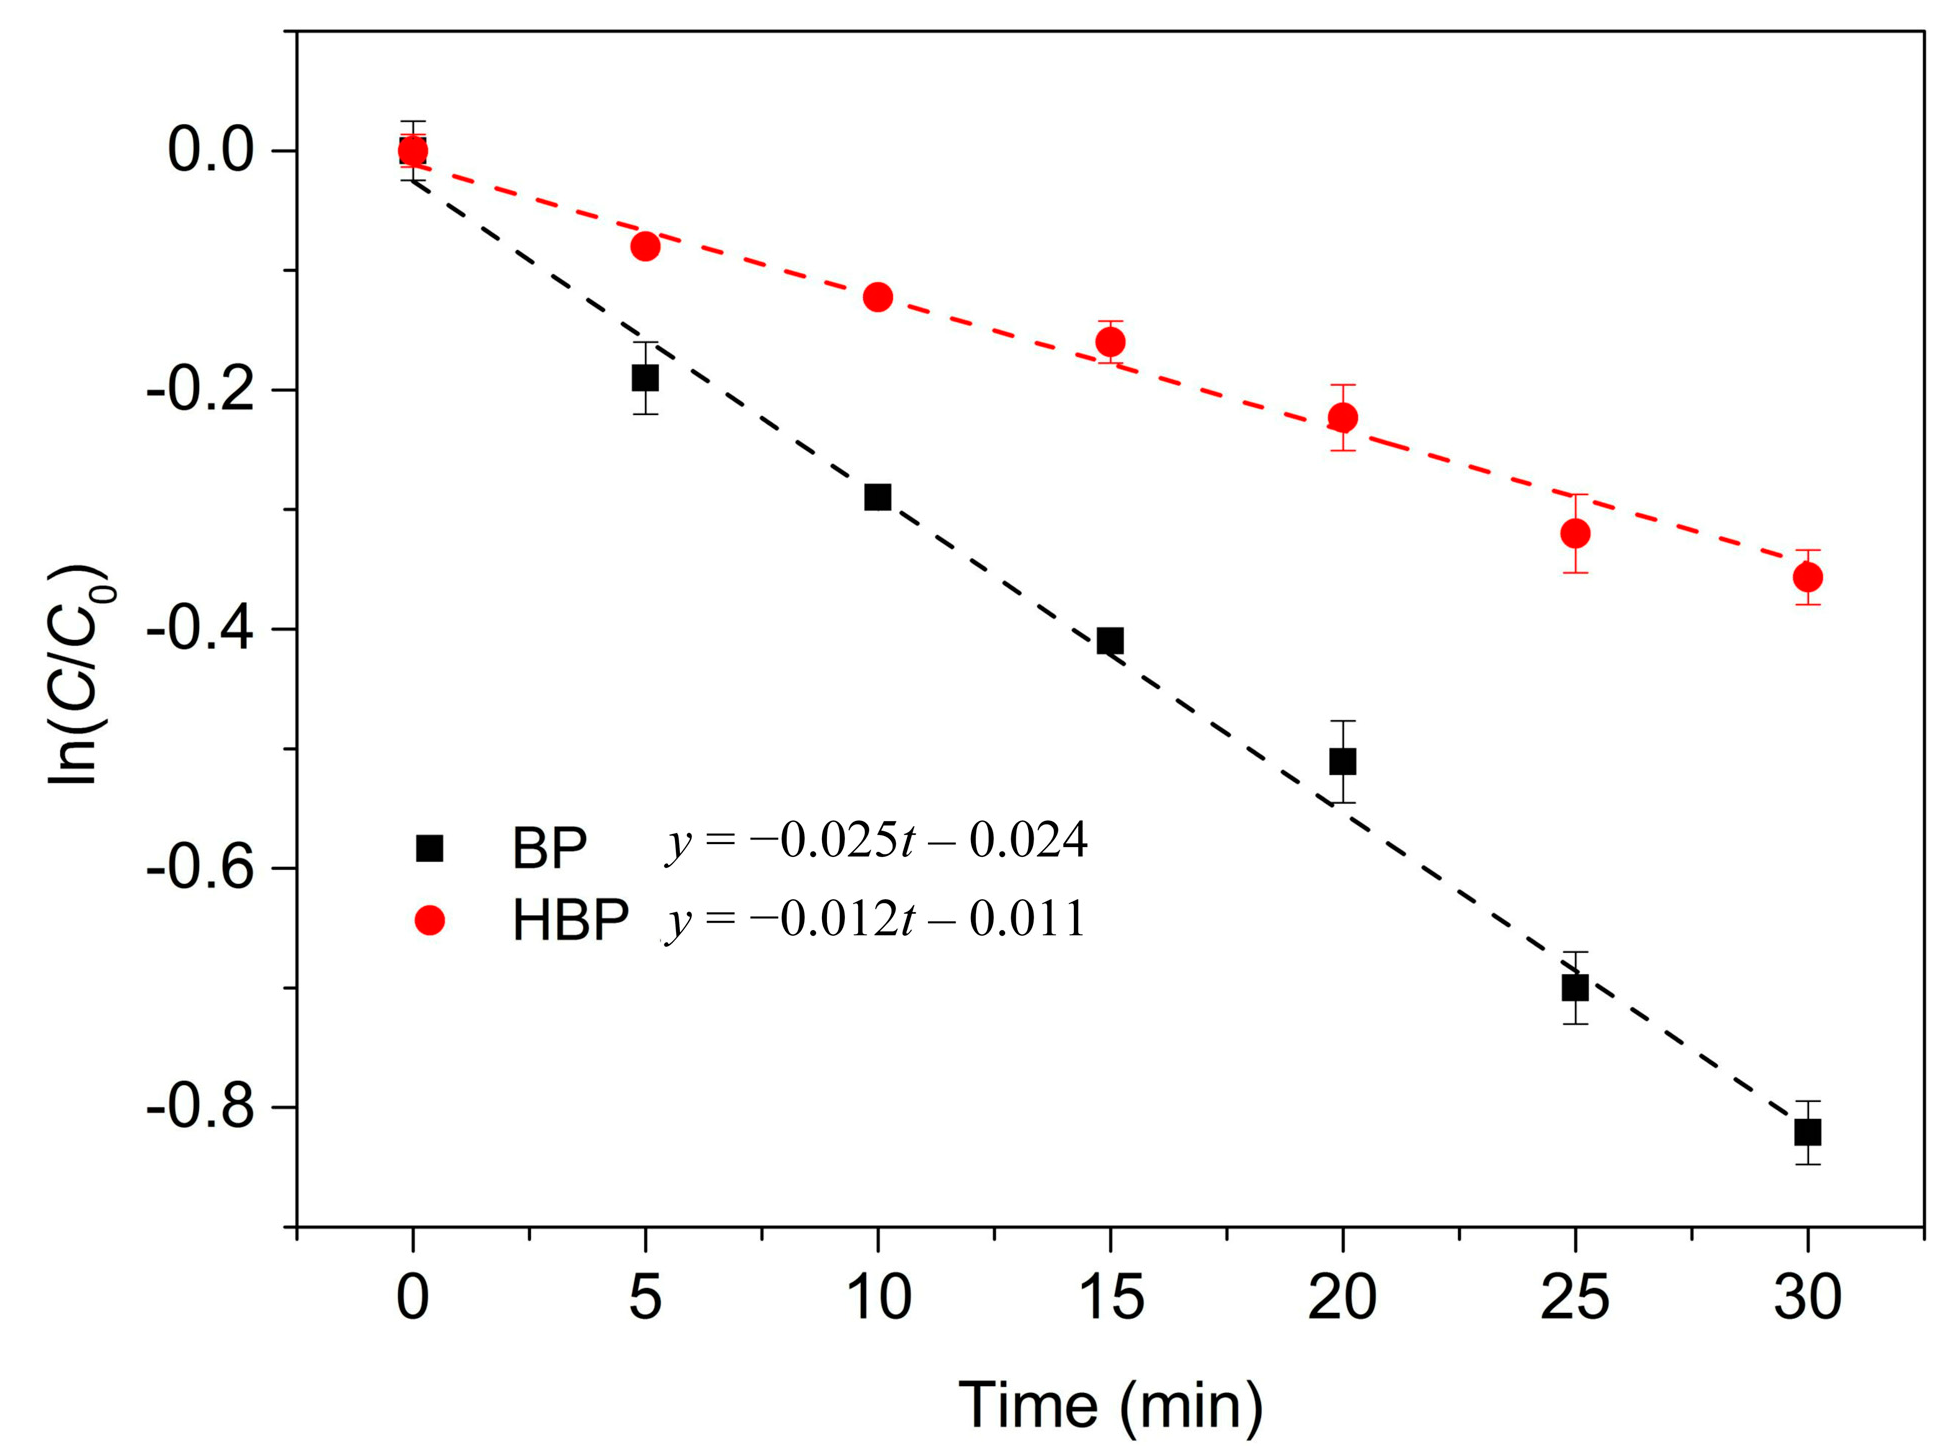
3.1. BP and HBP Degradation by the UV/H2O2 Process
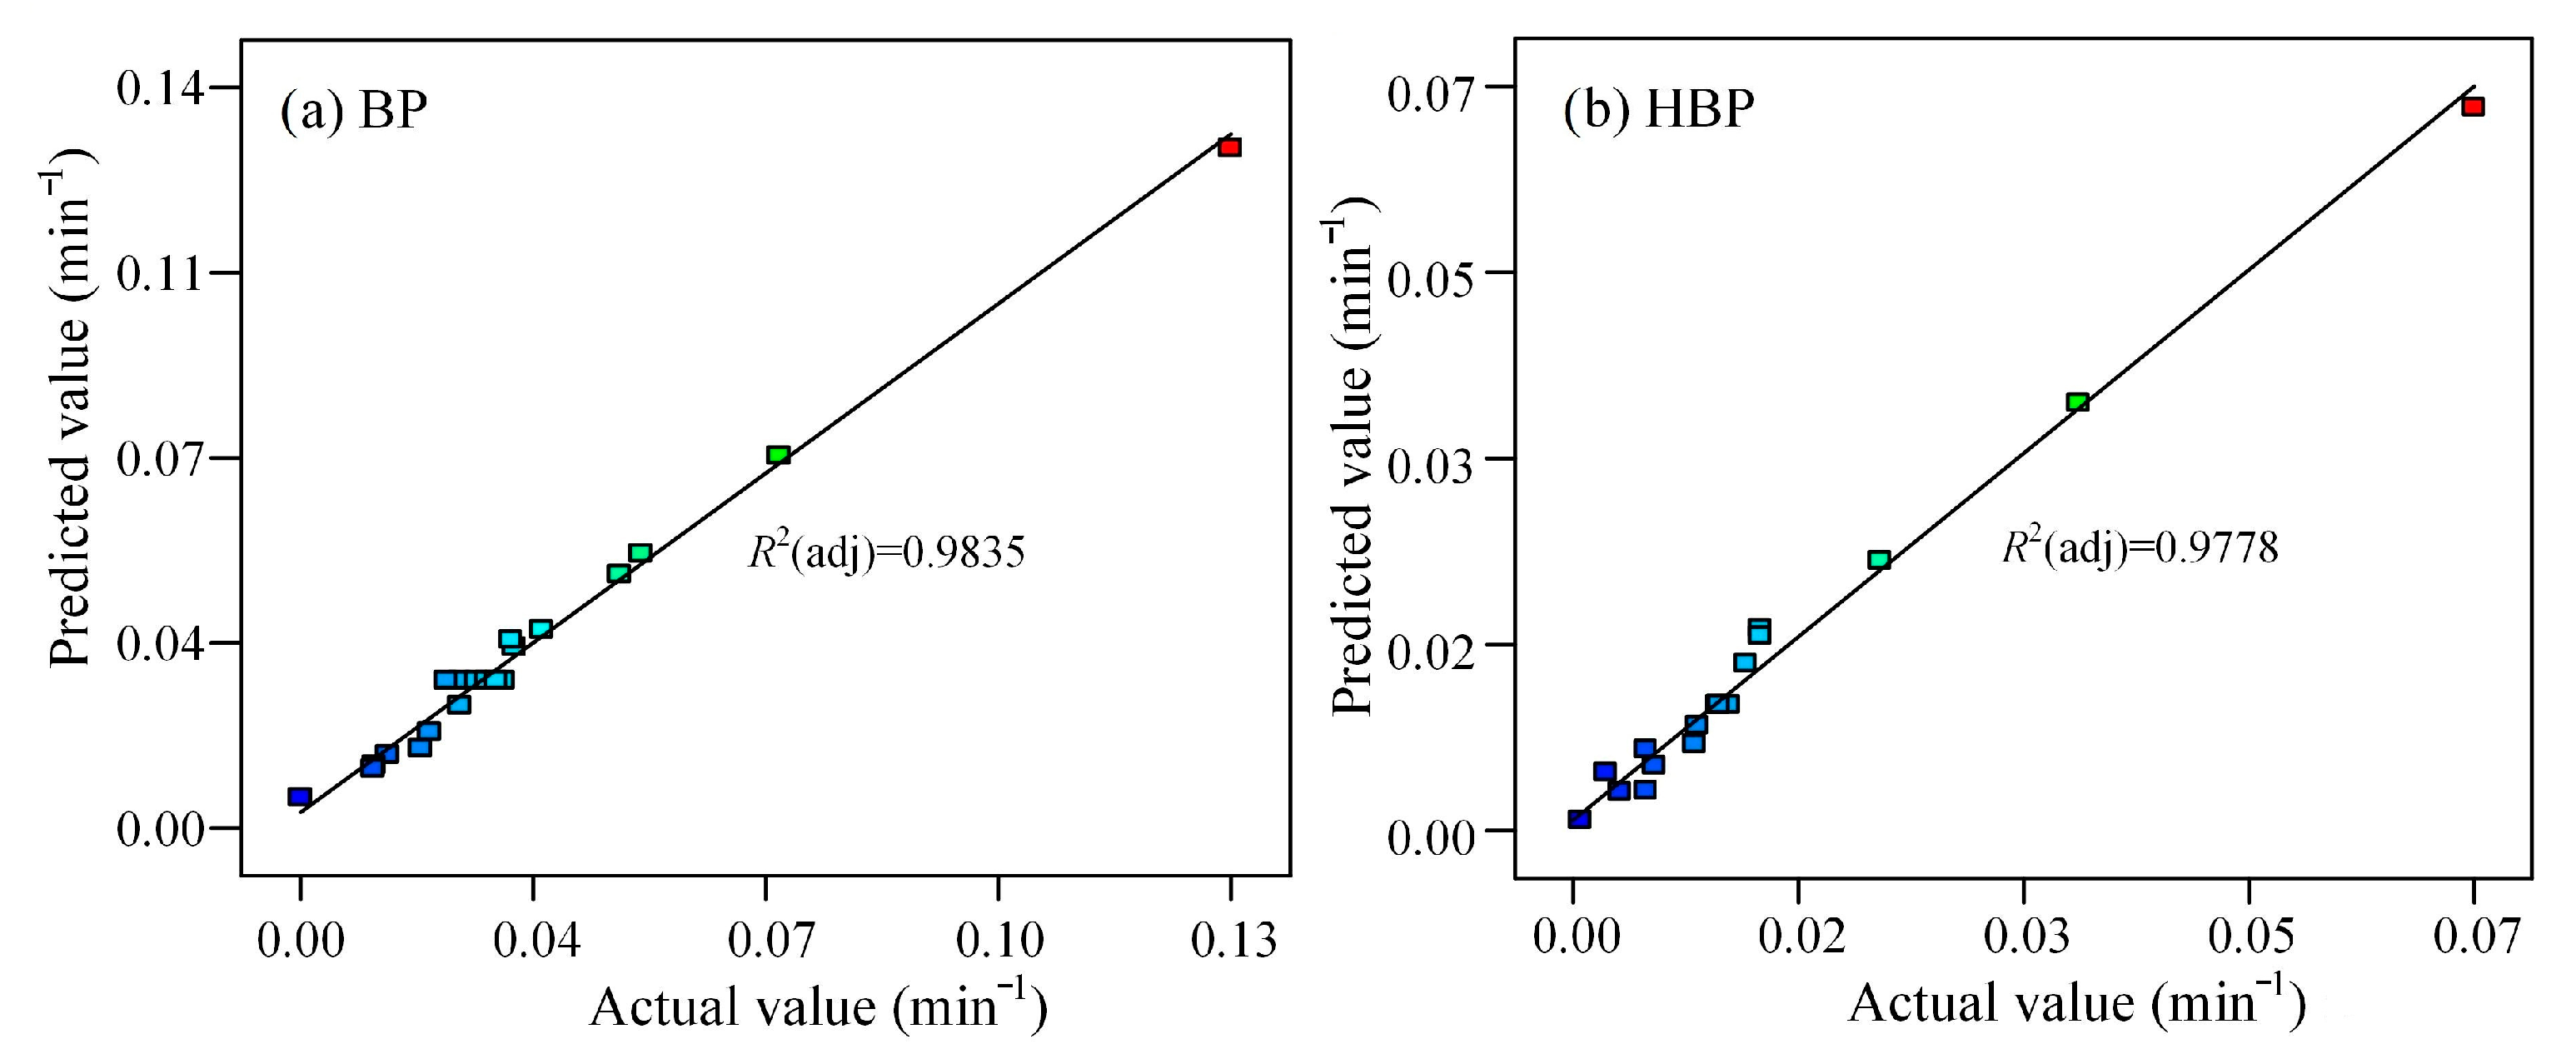
3.2. Established RSM Model and Its Validation
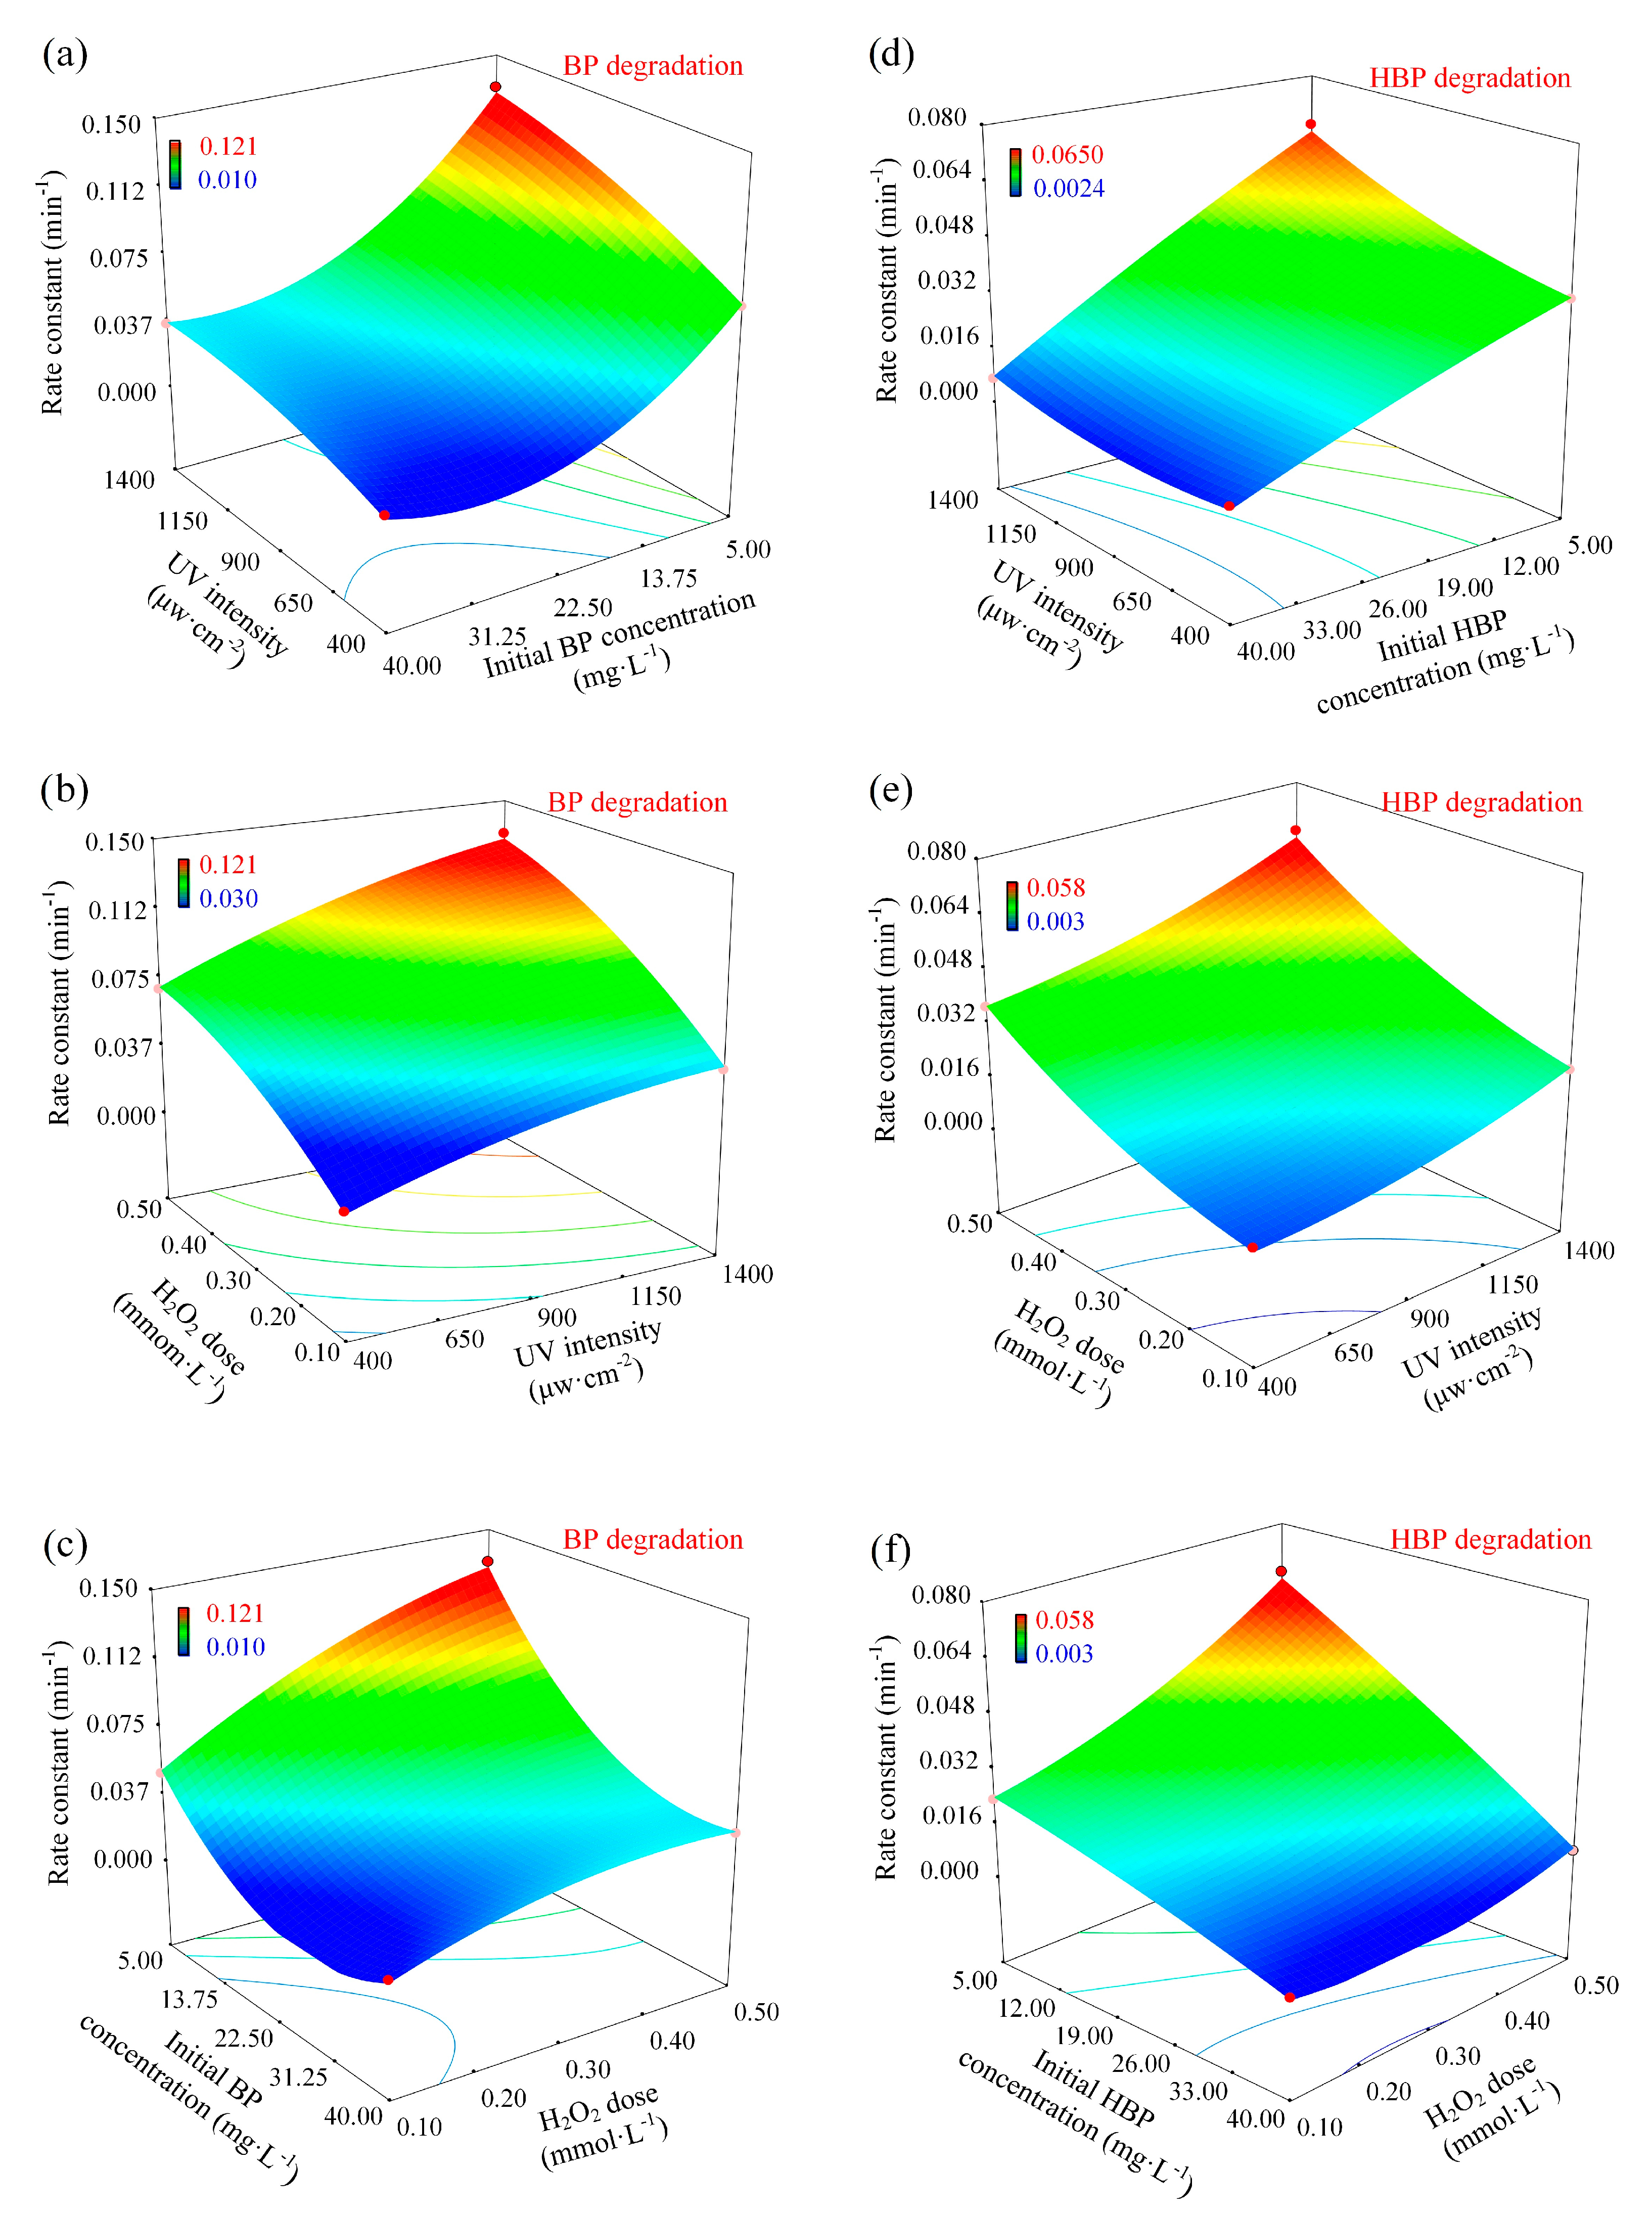
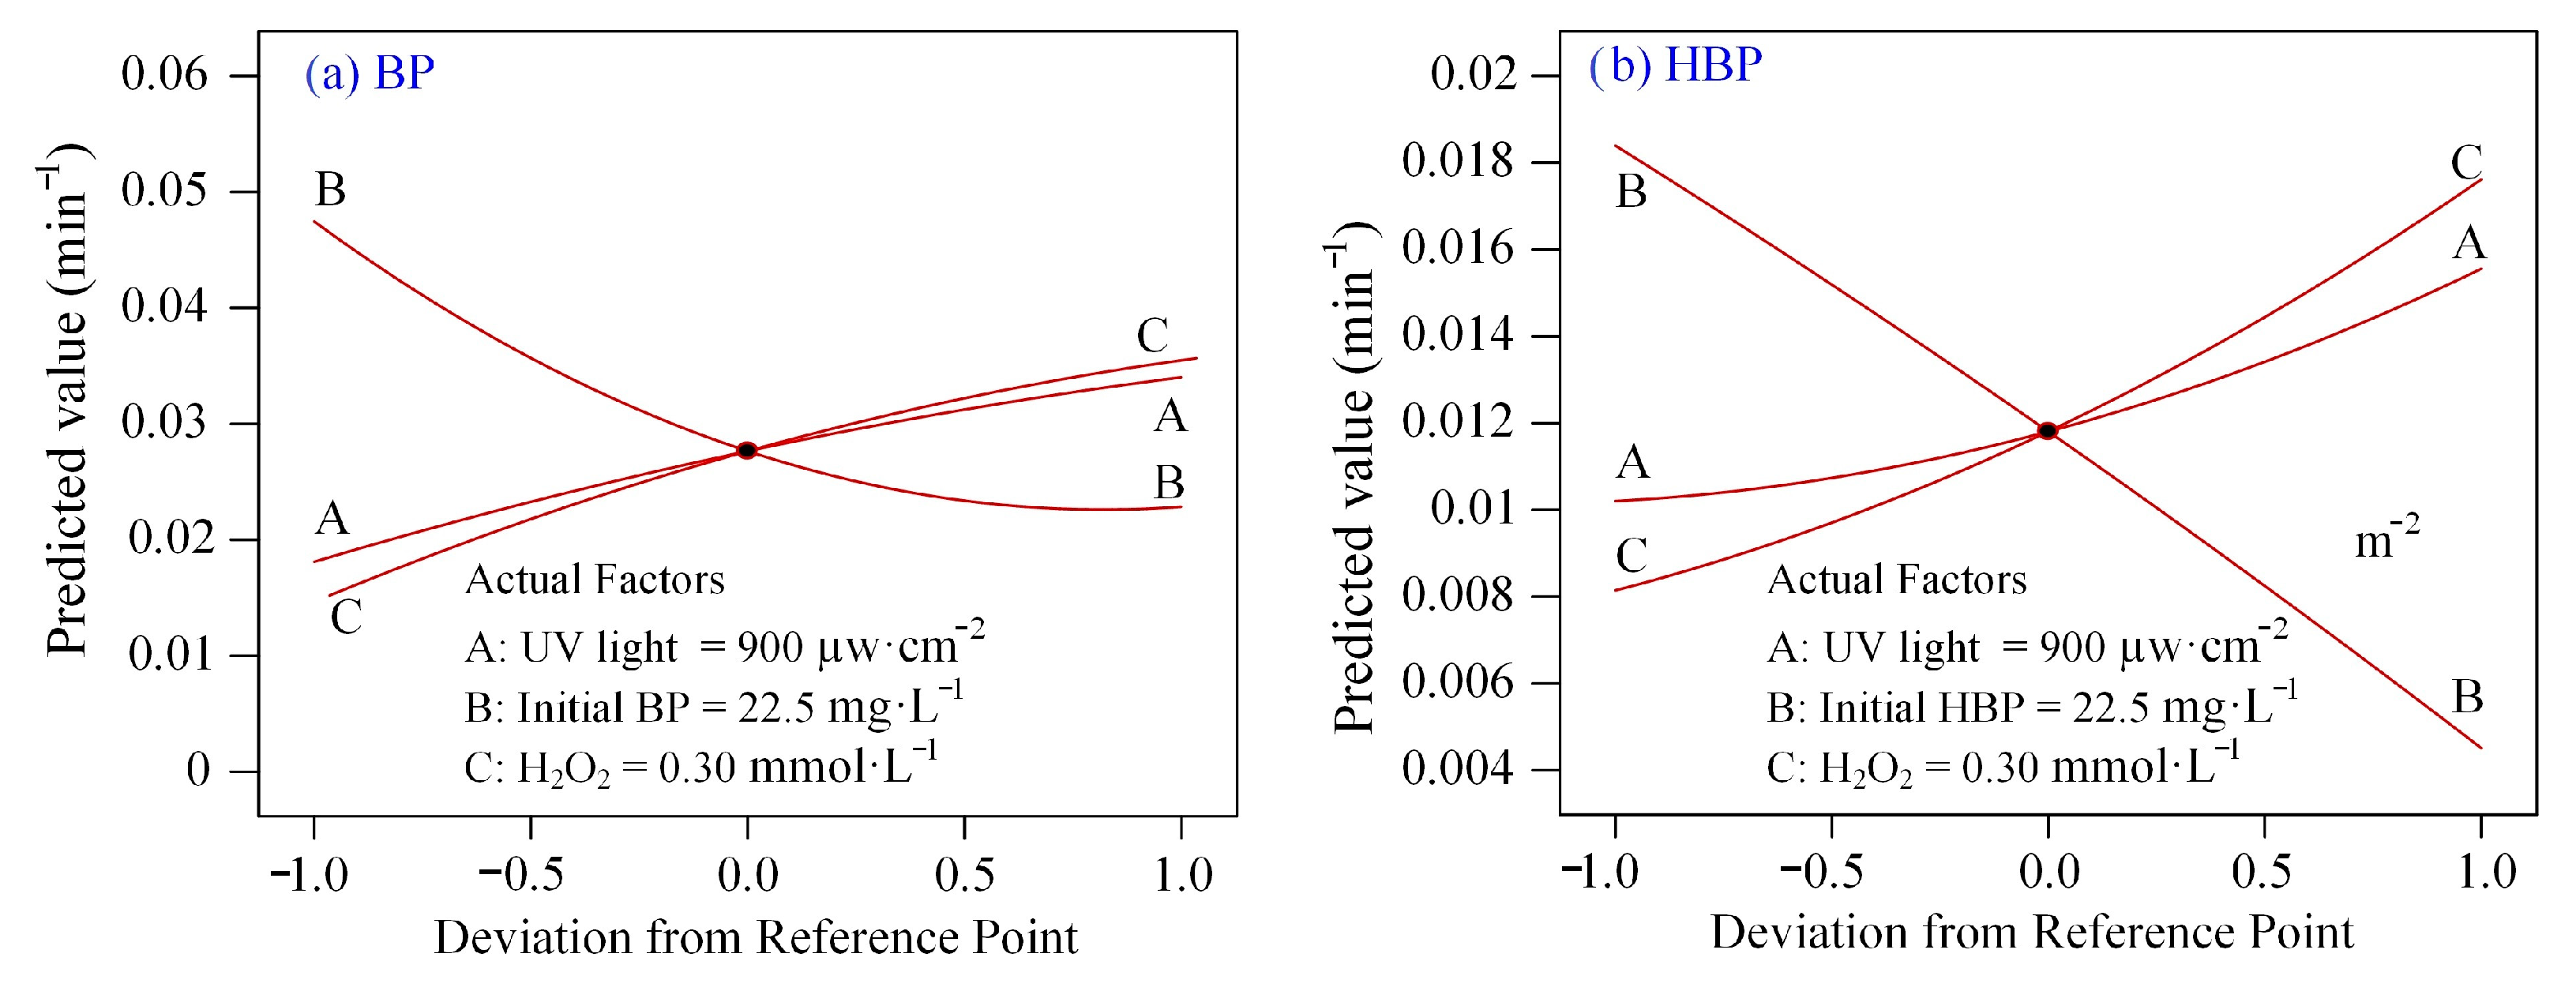
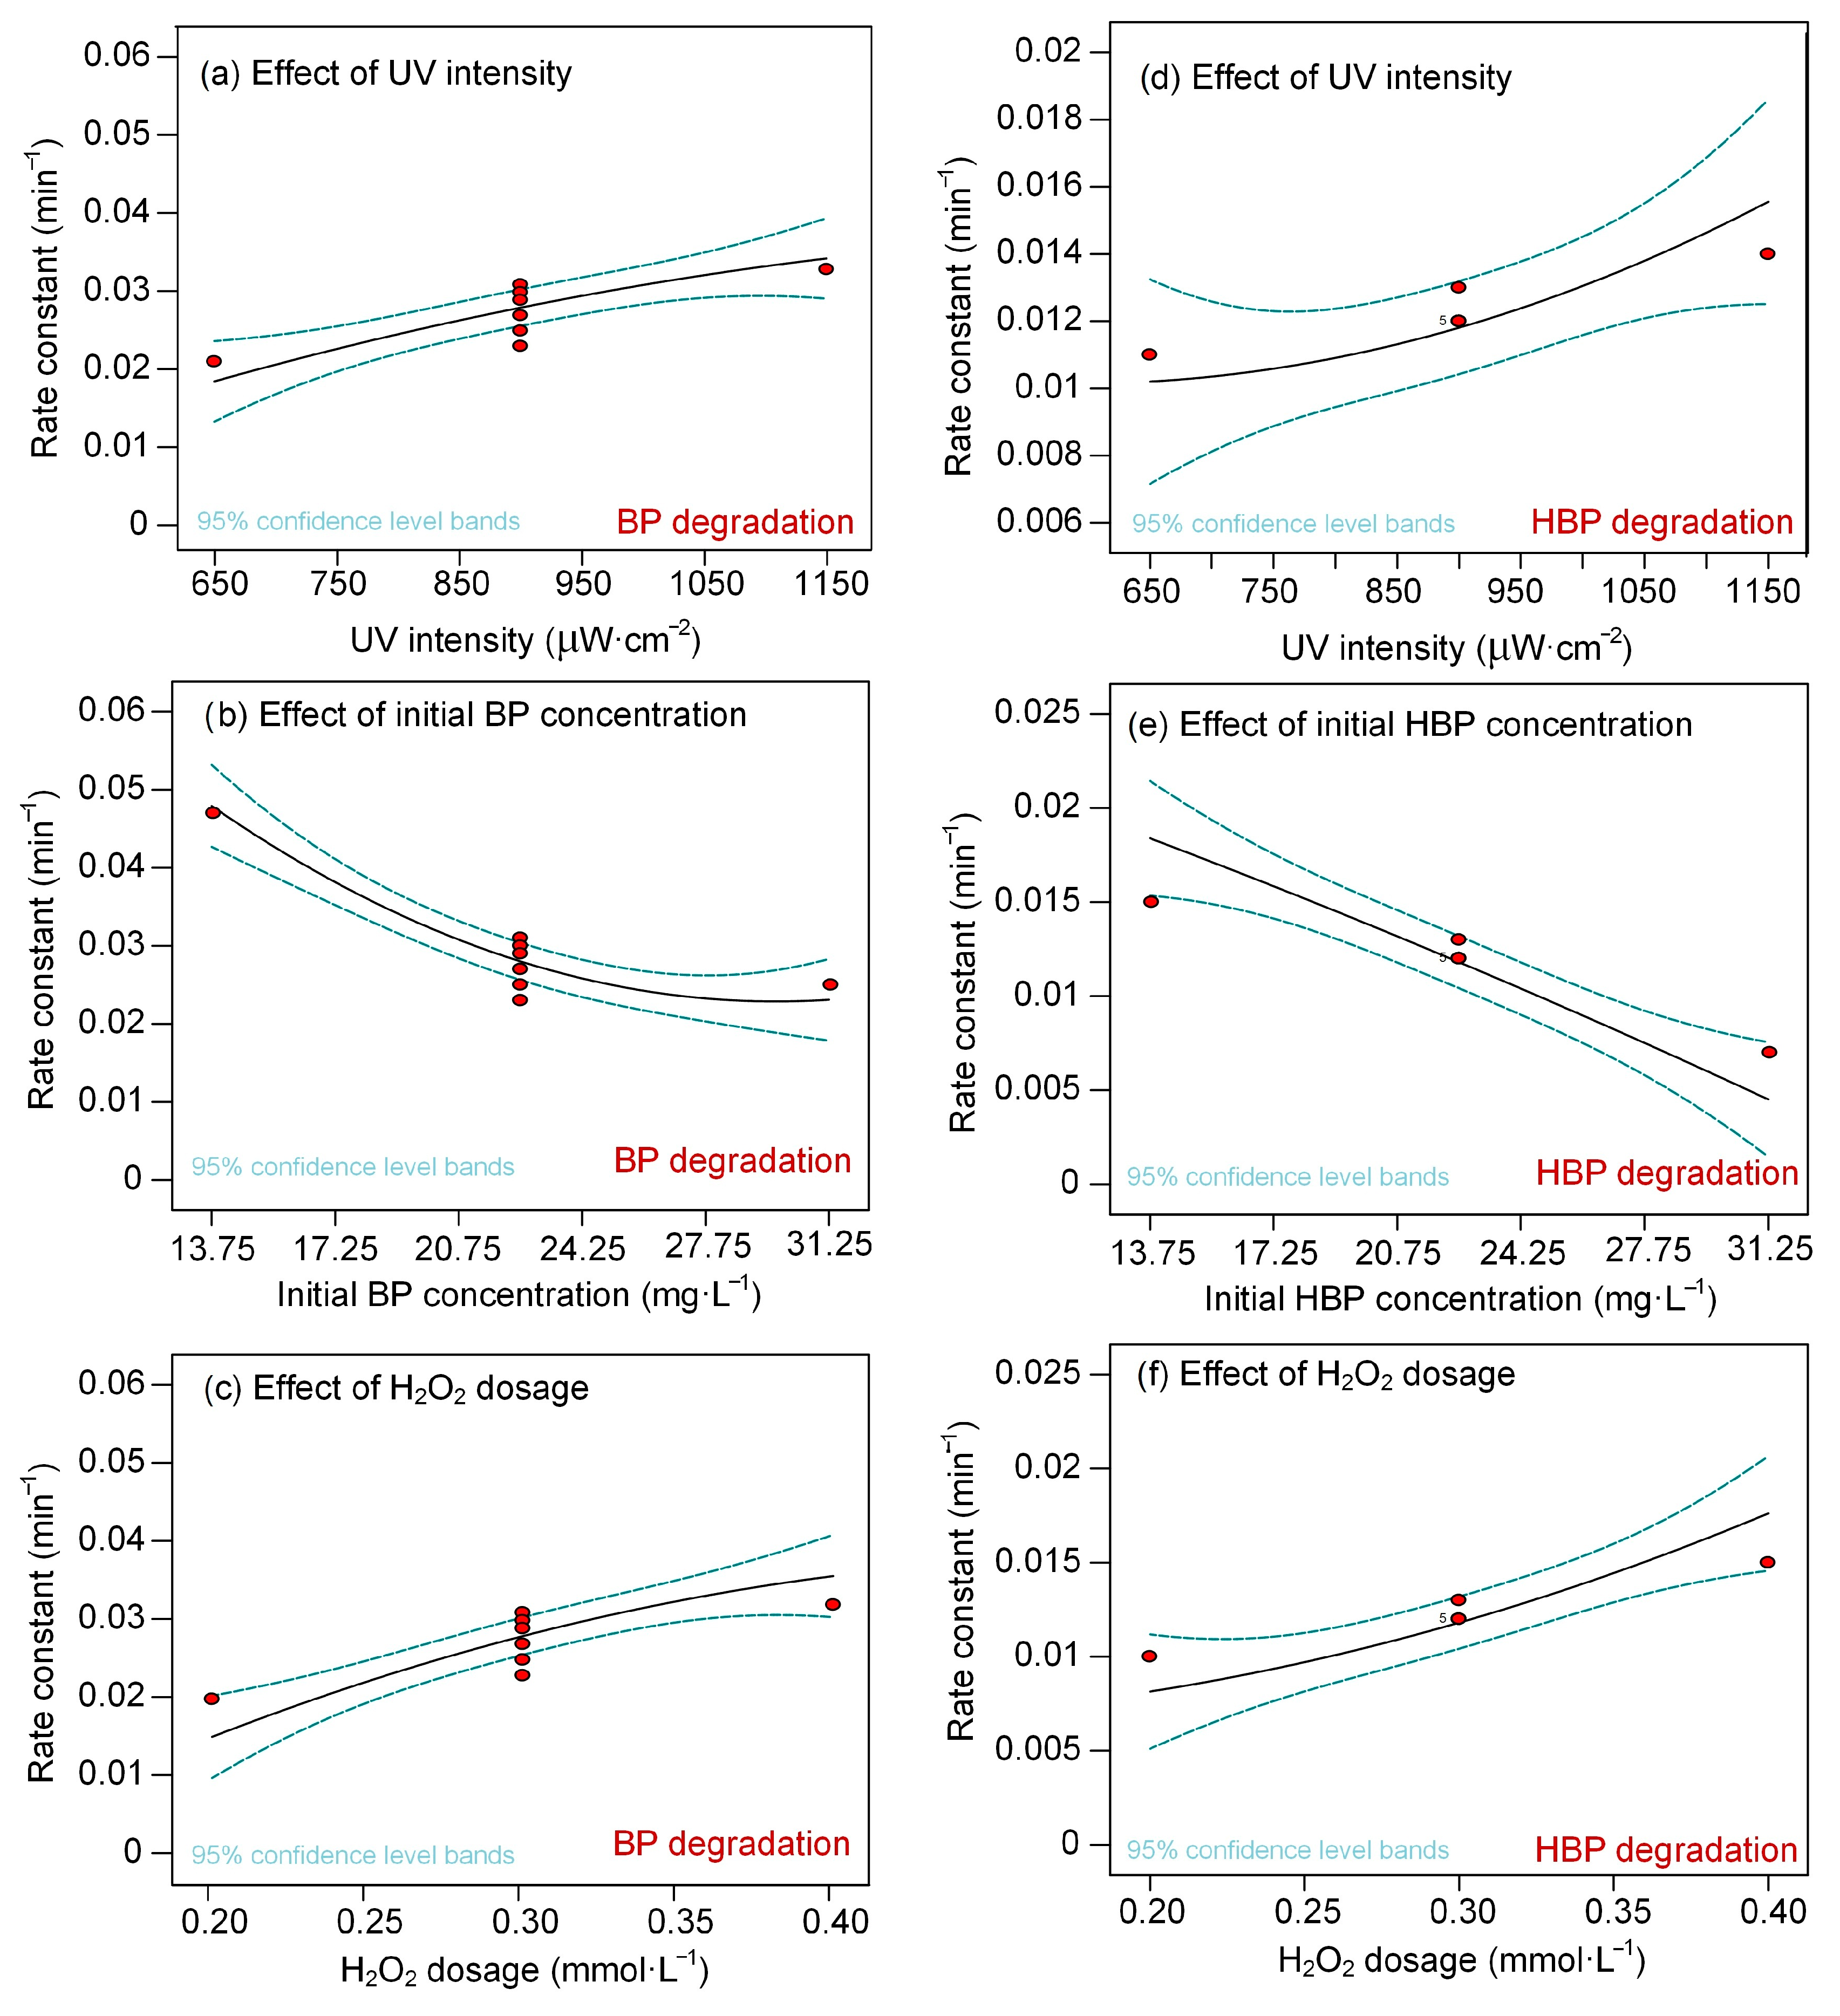
3.3. Analysis of the Response Surface Models
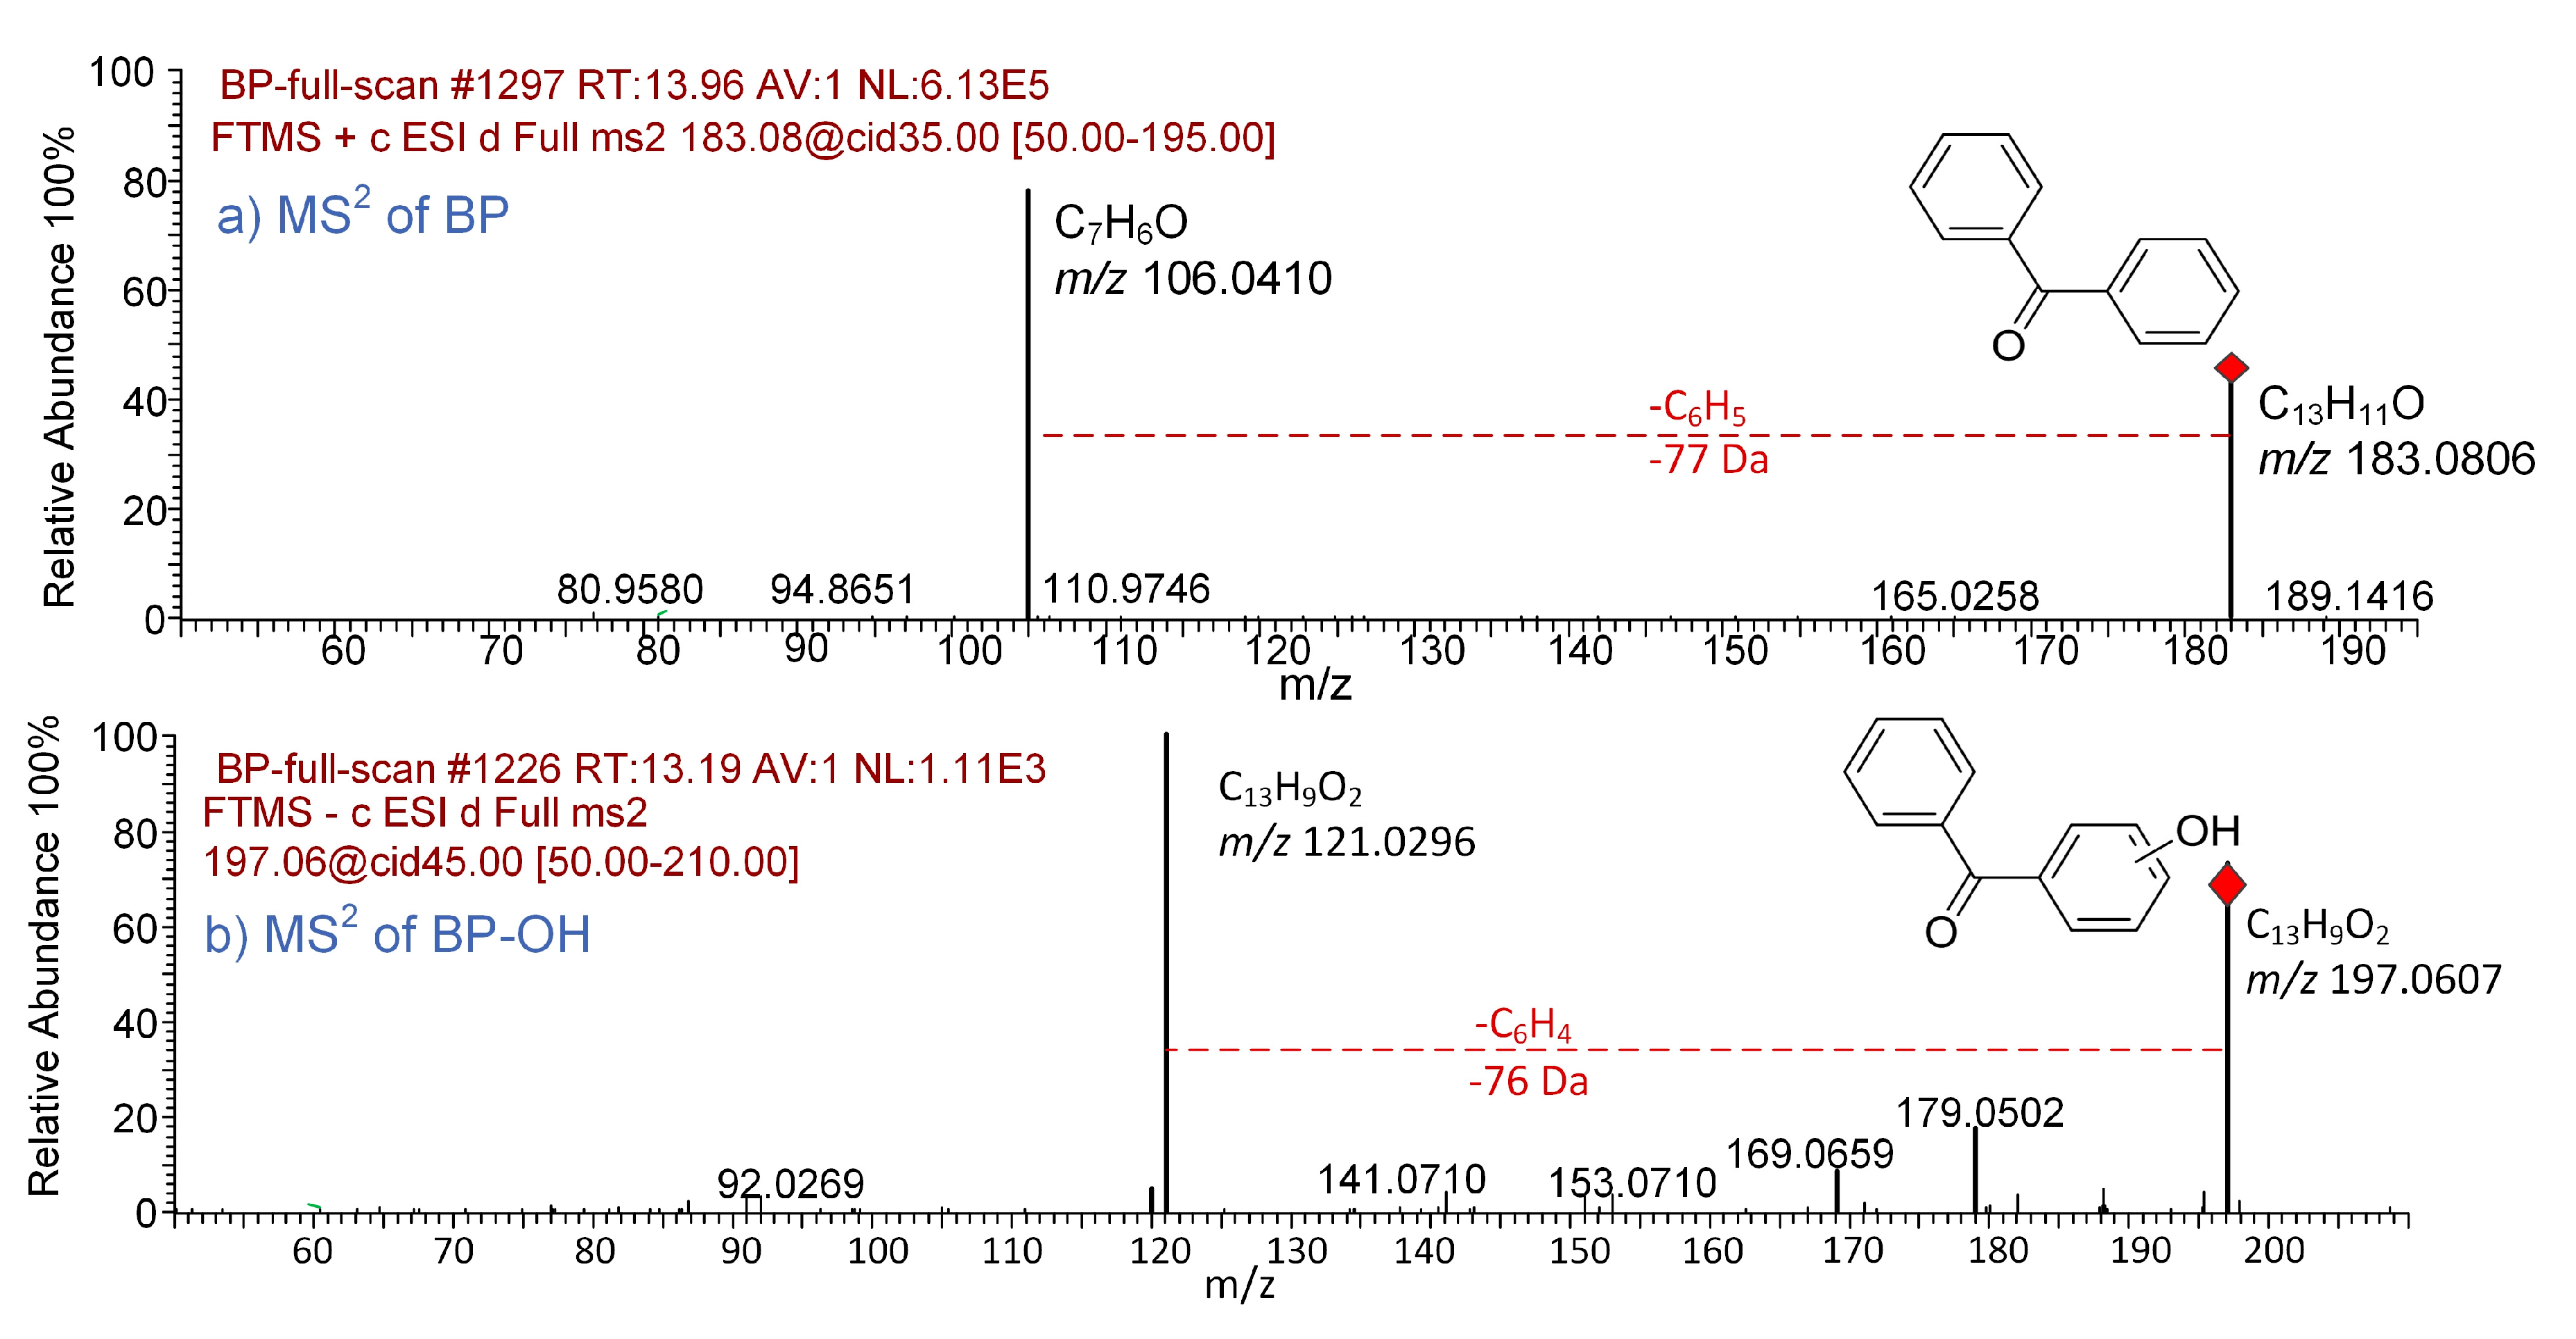
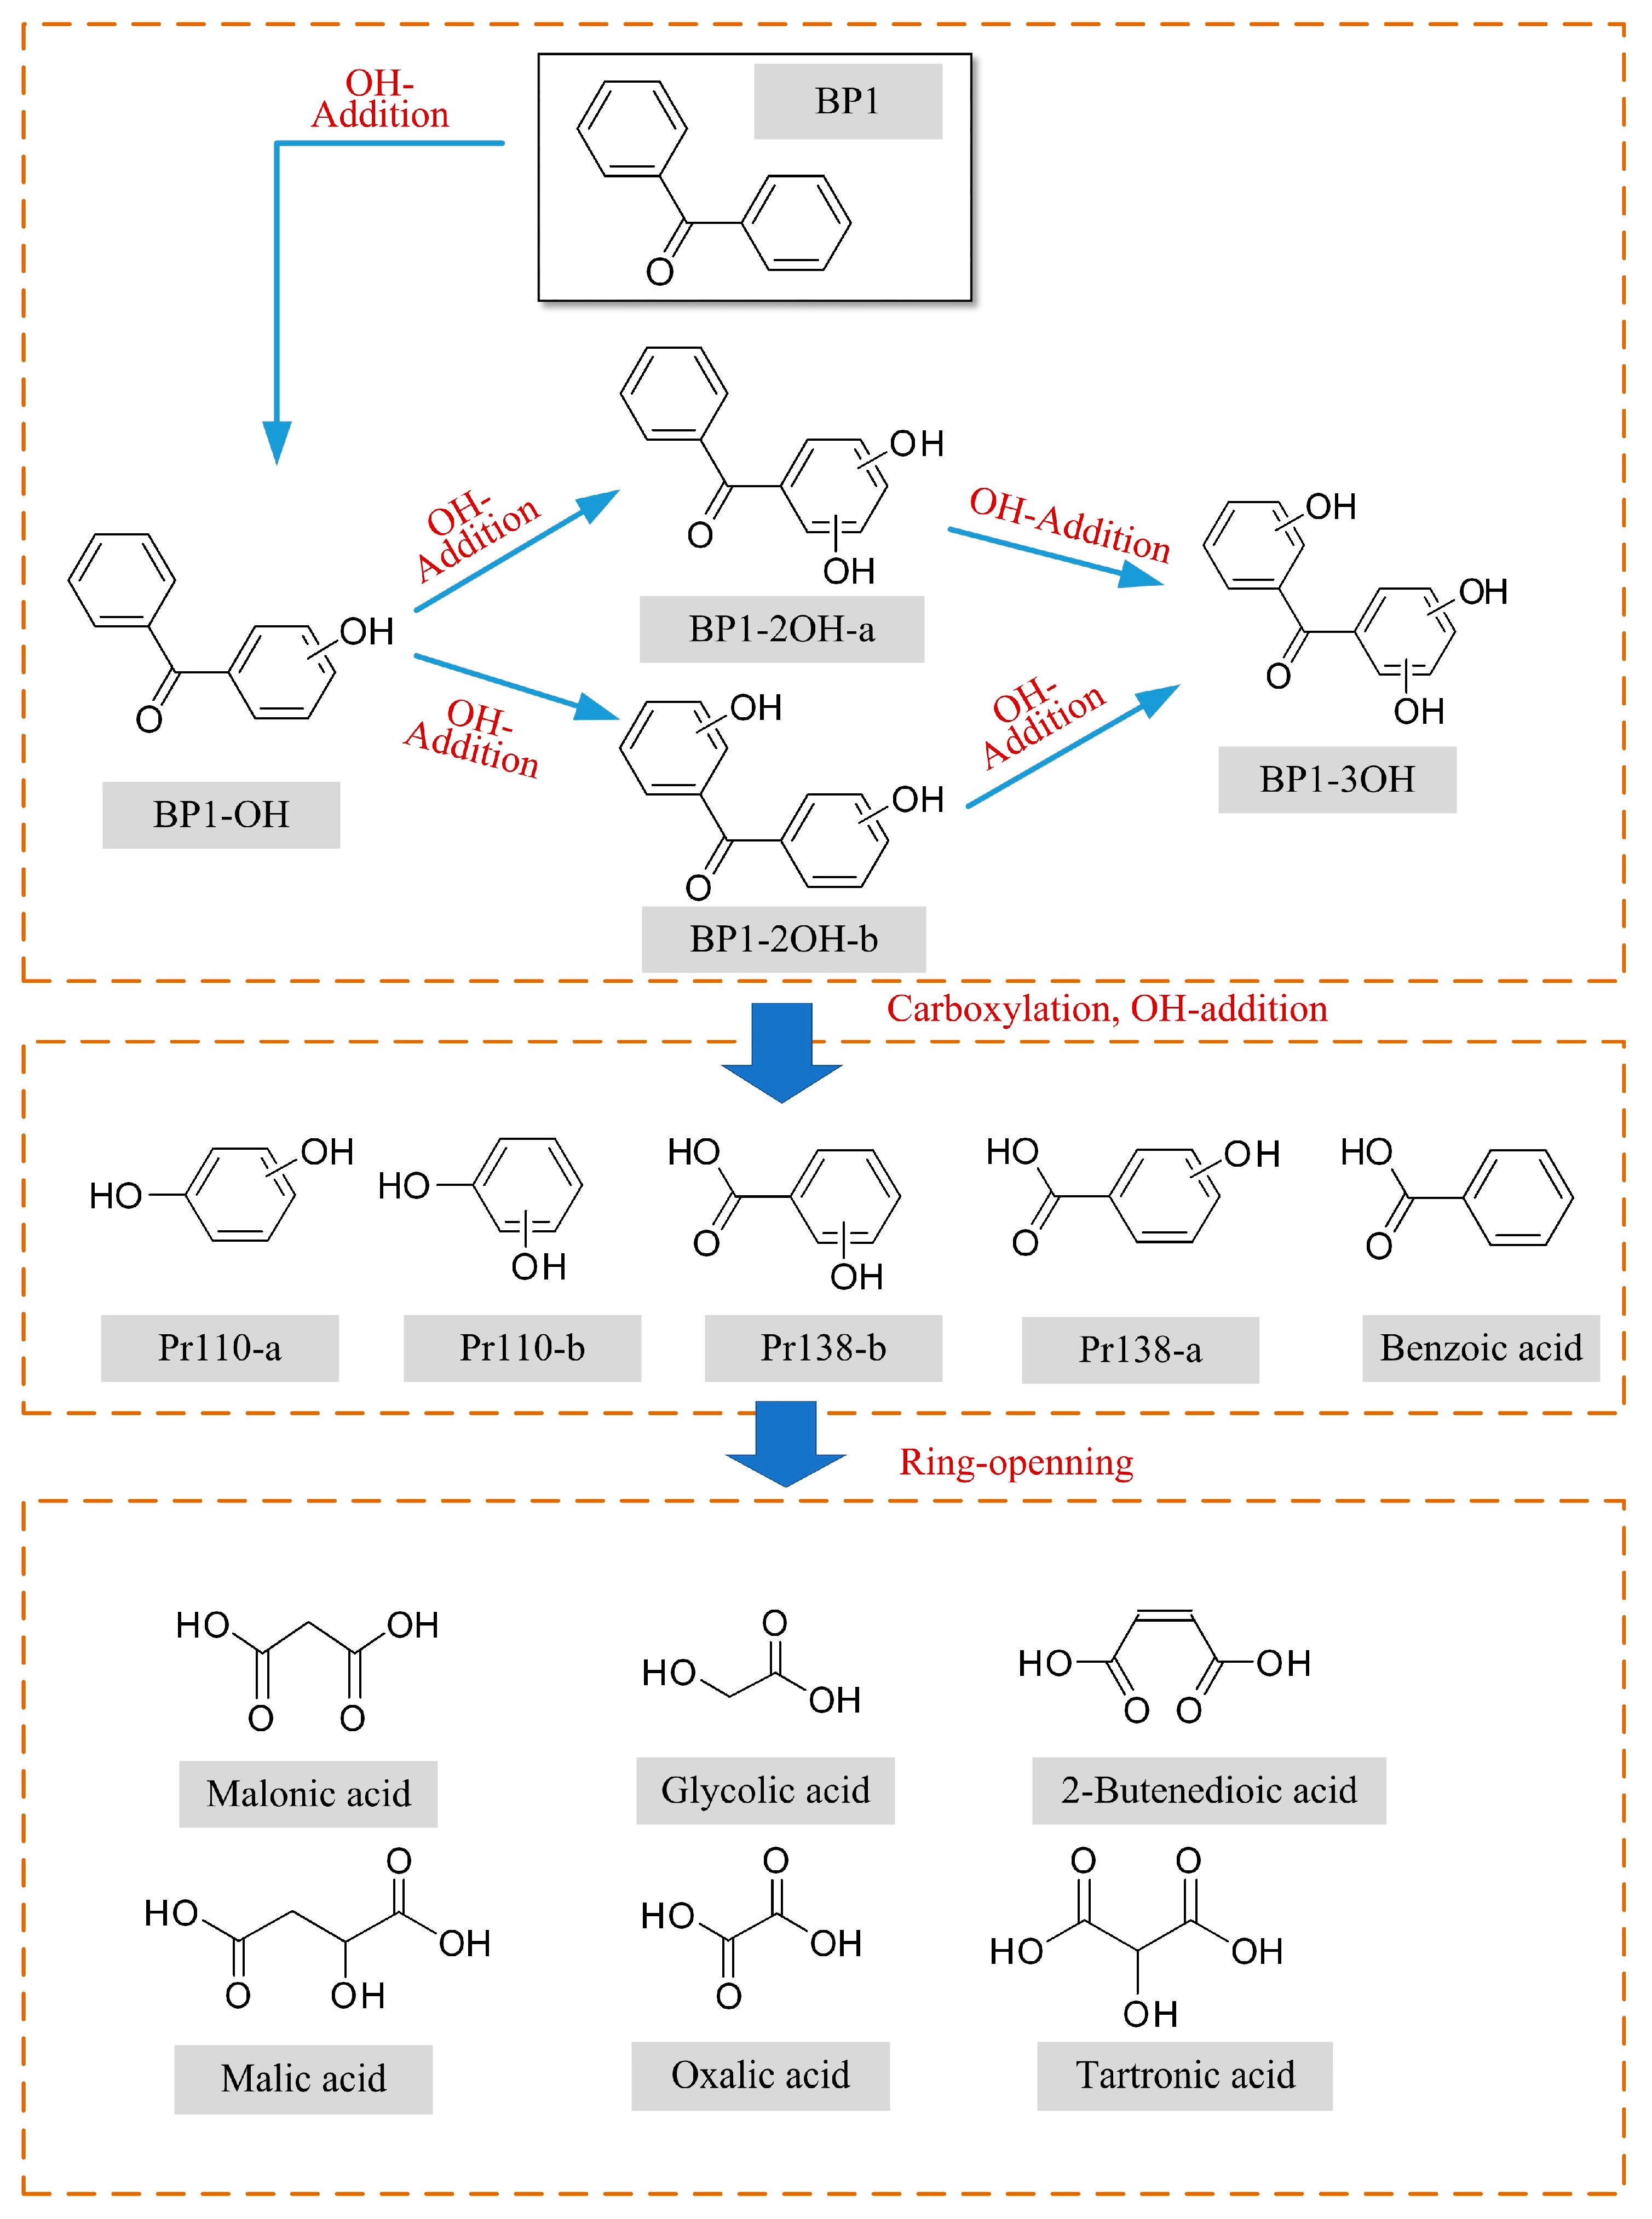
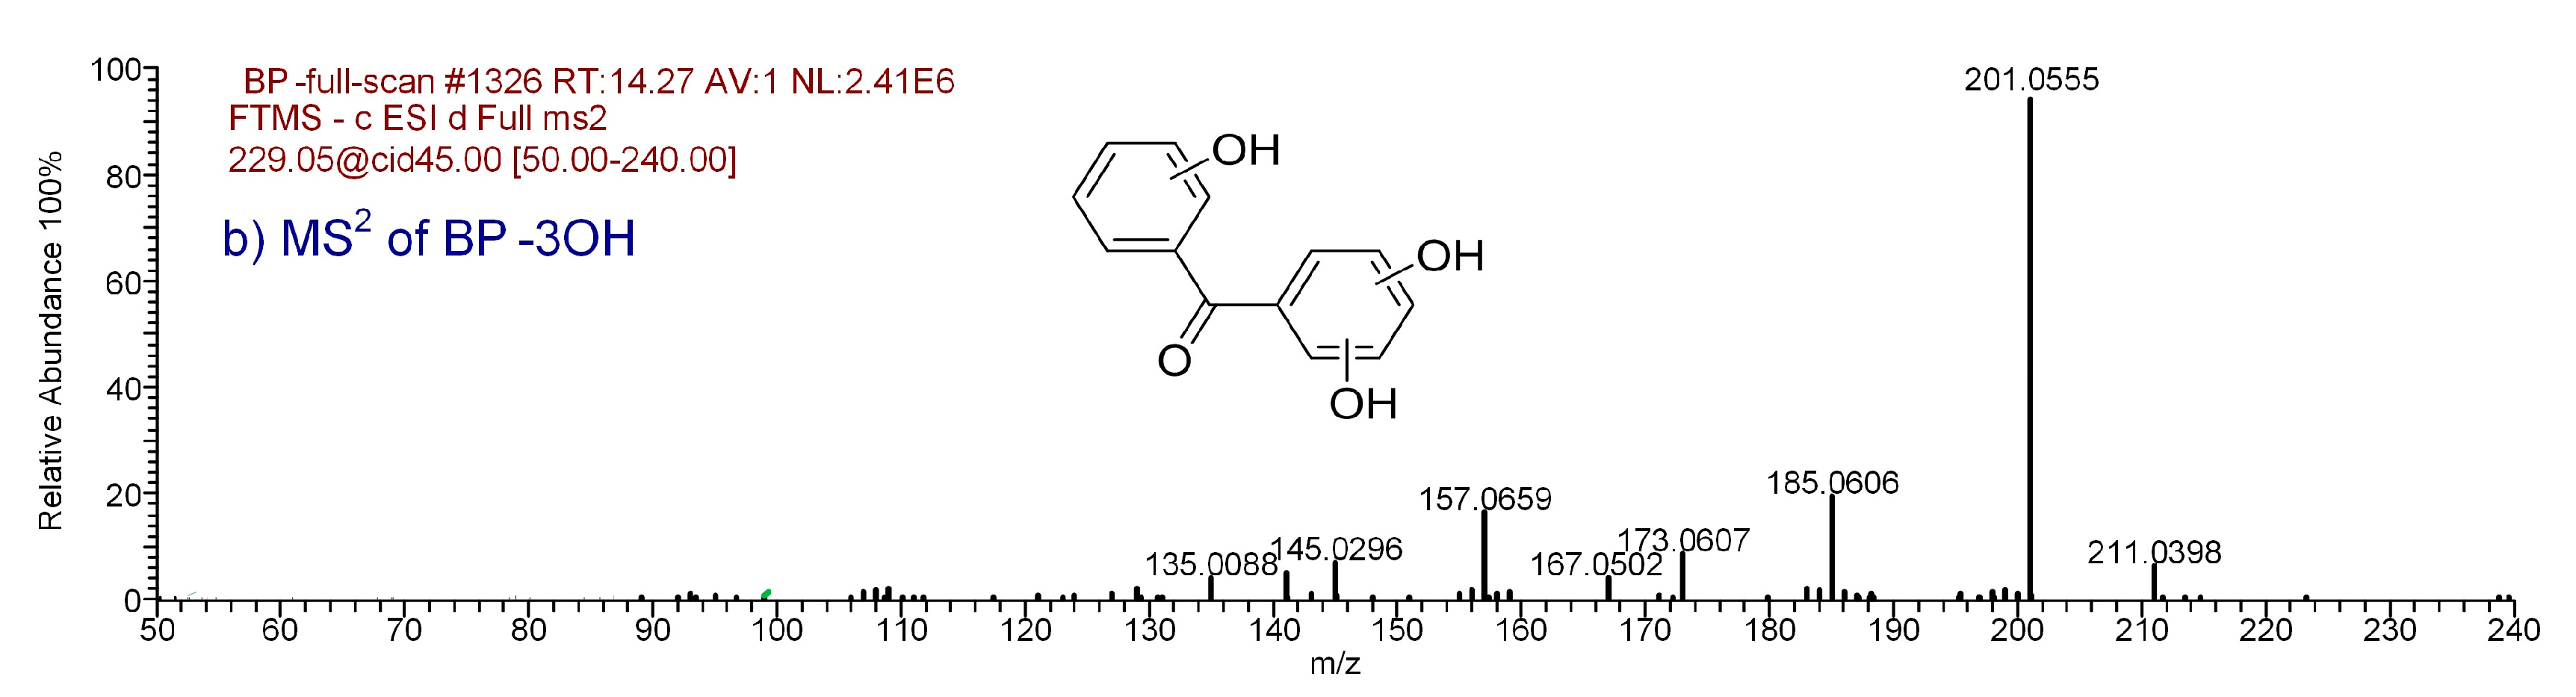
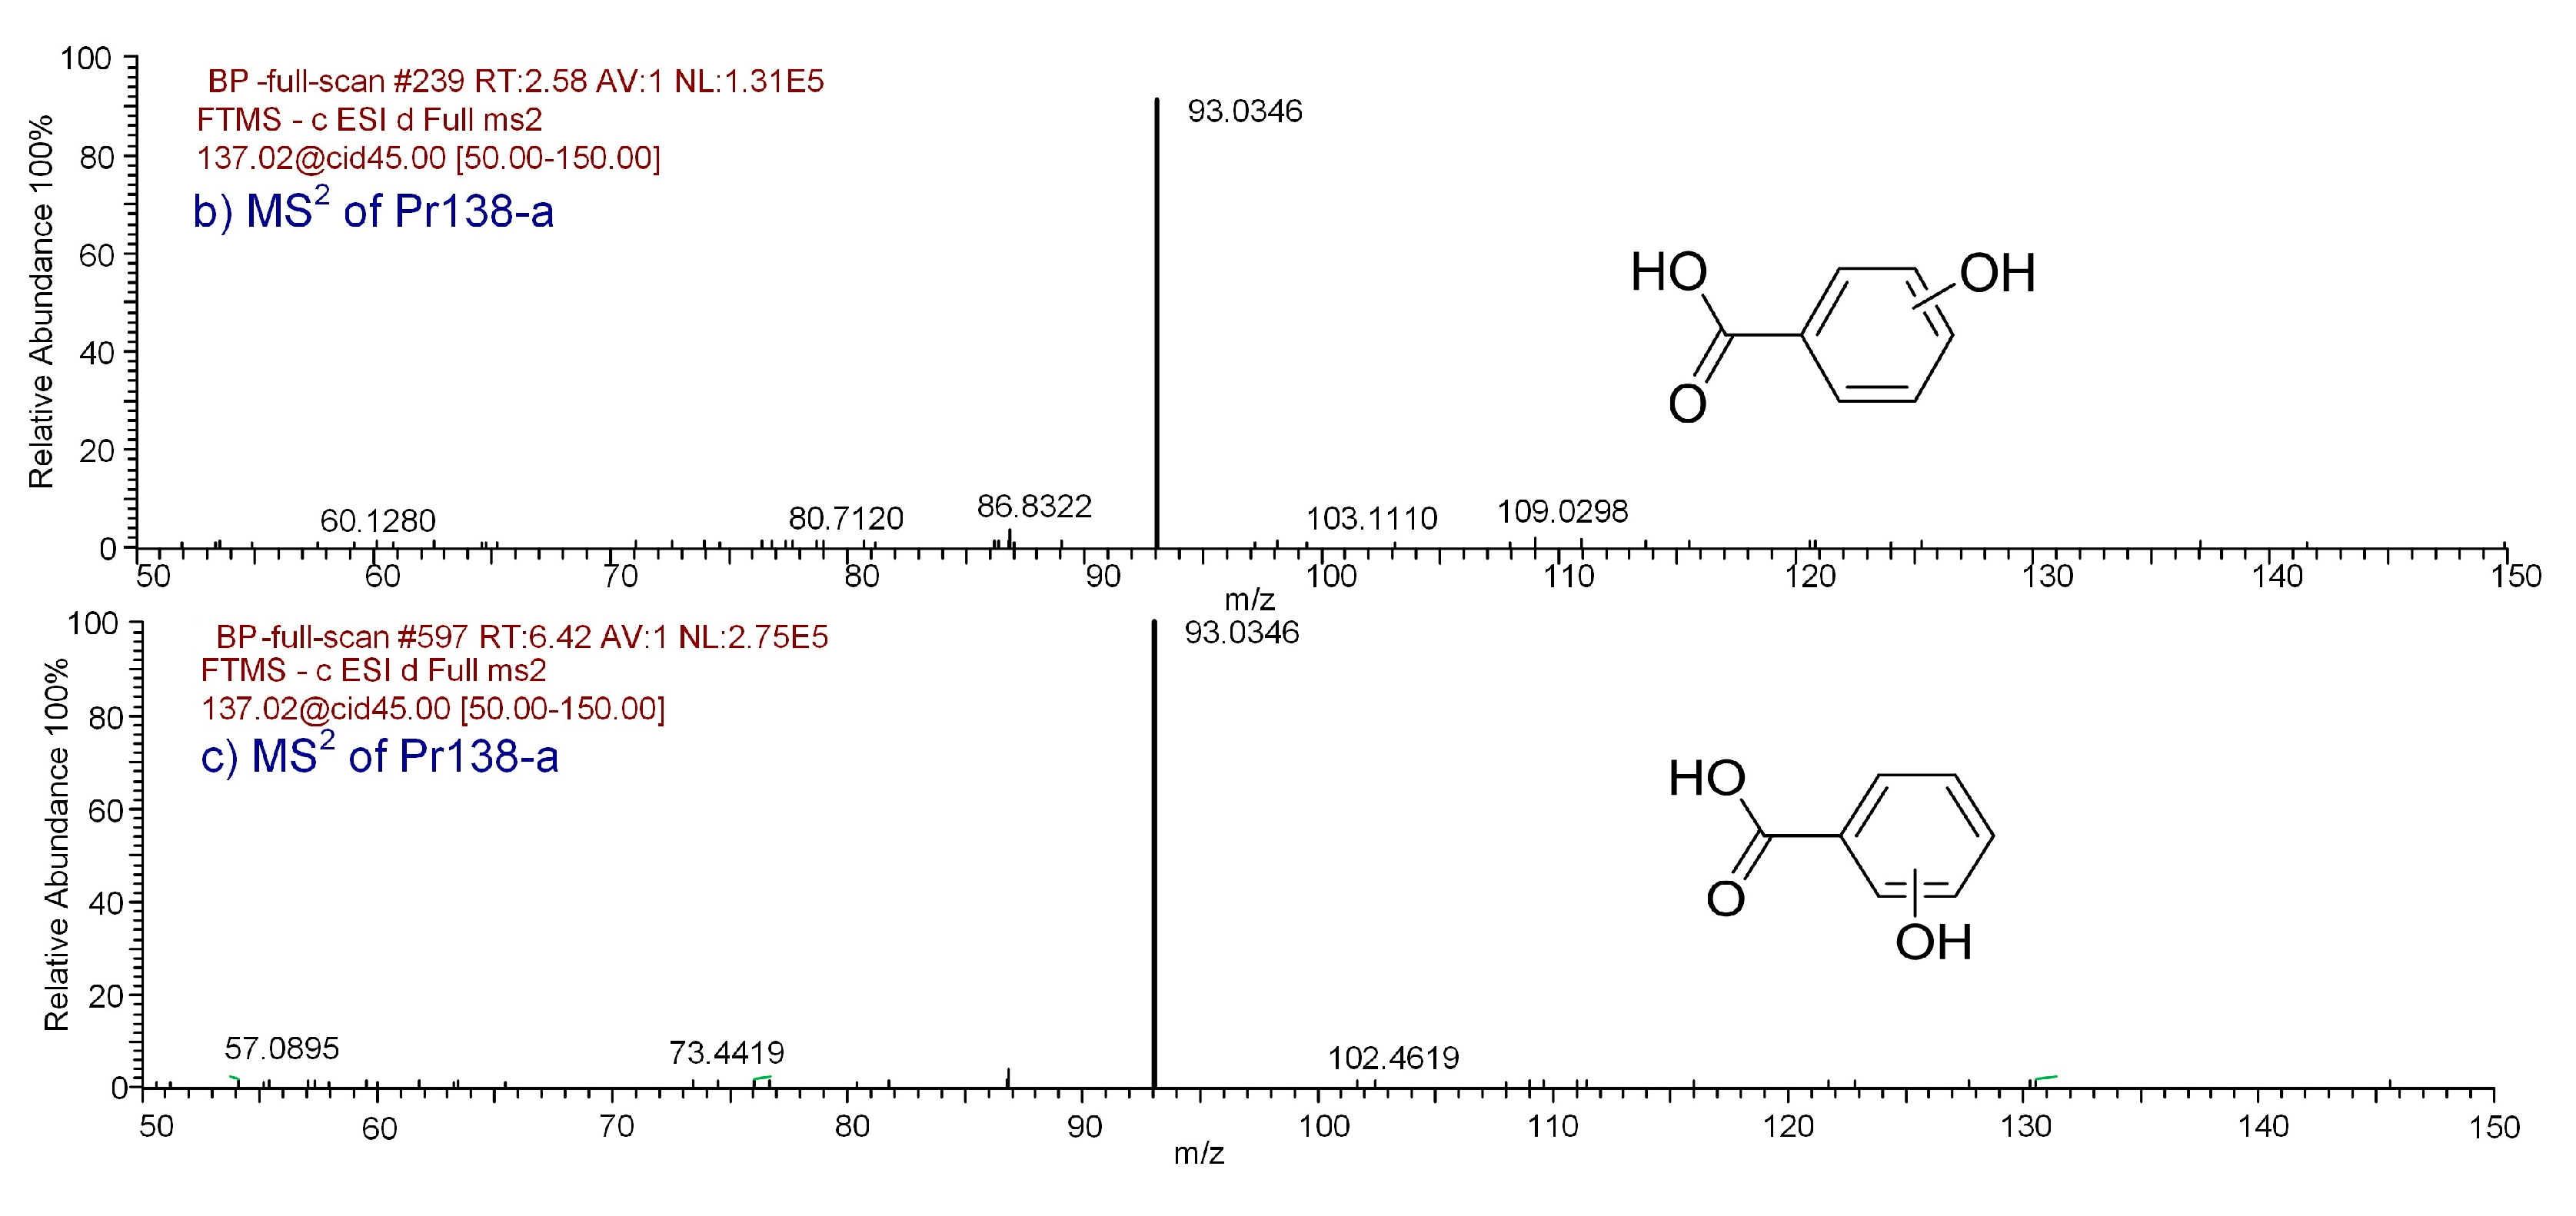
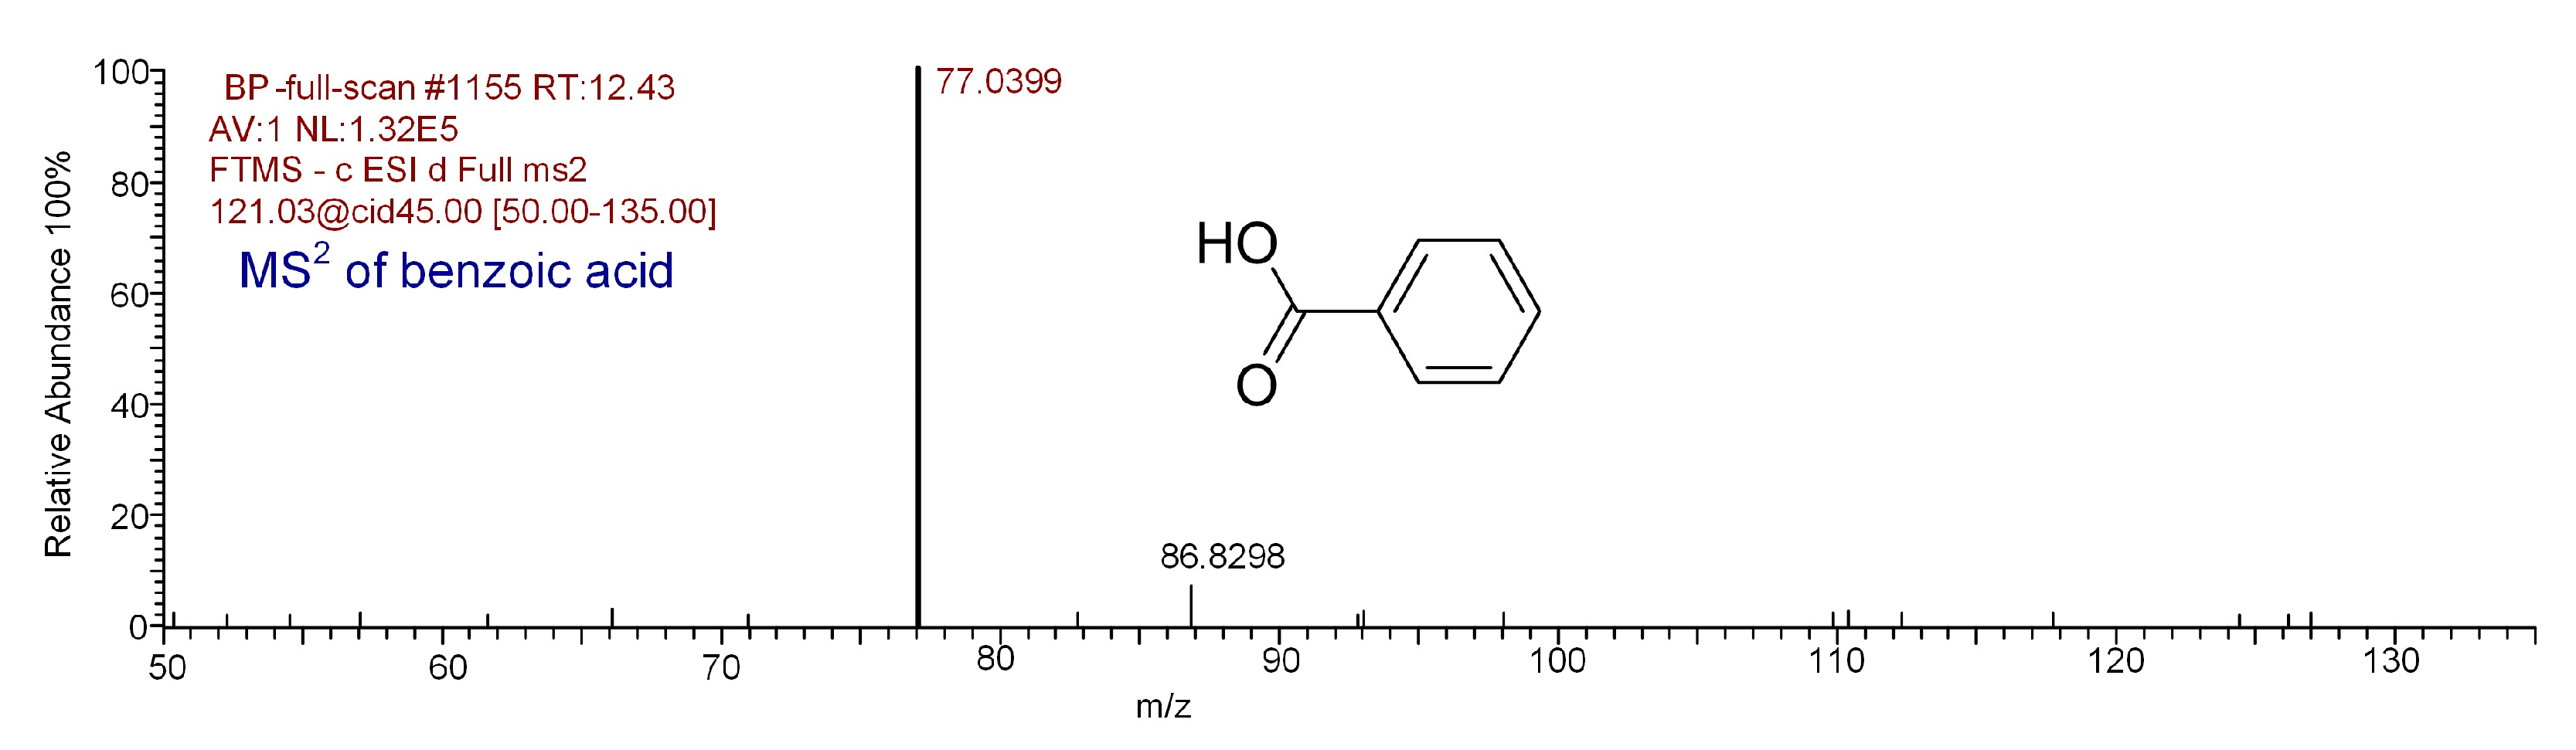
3.4. Degradation Mechanism of BP
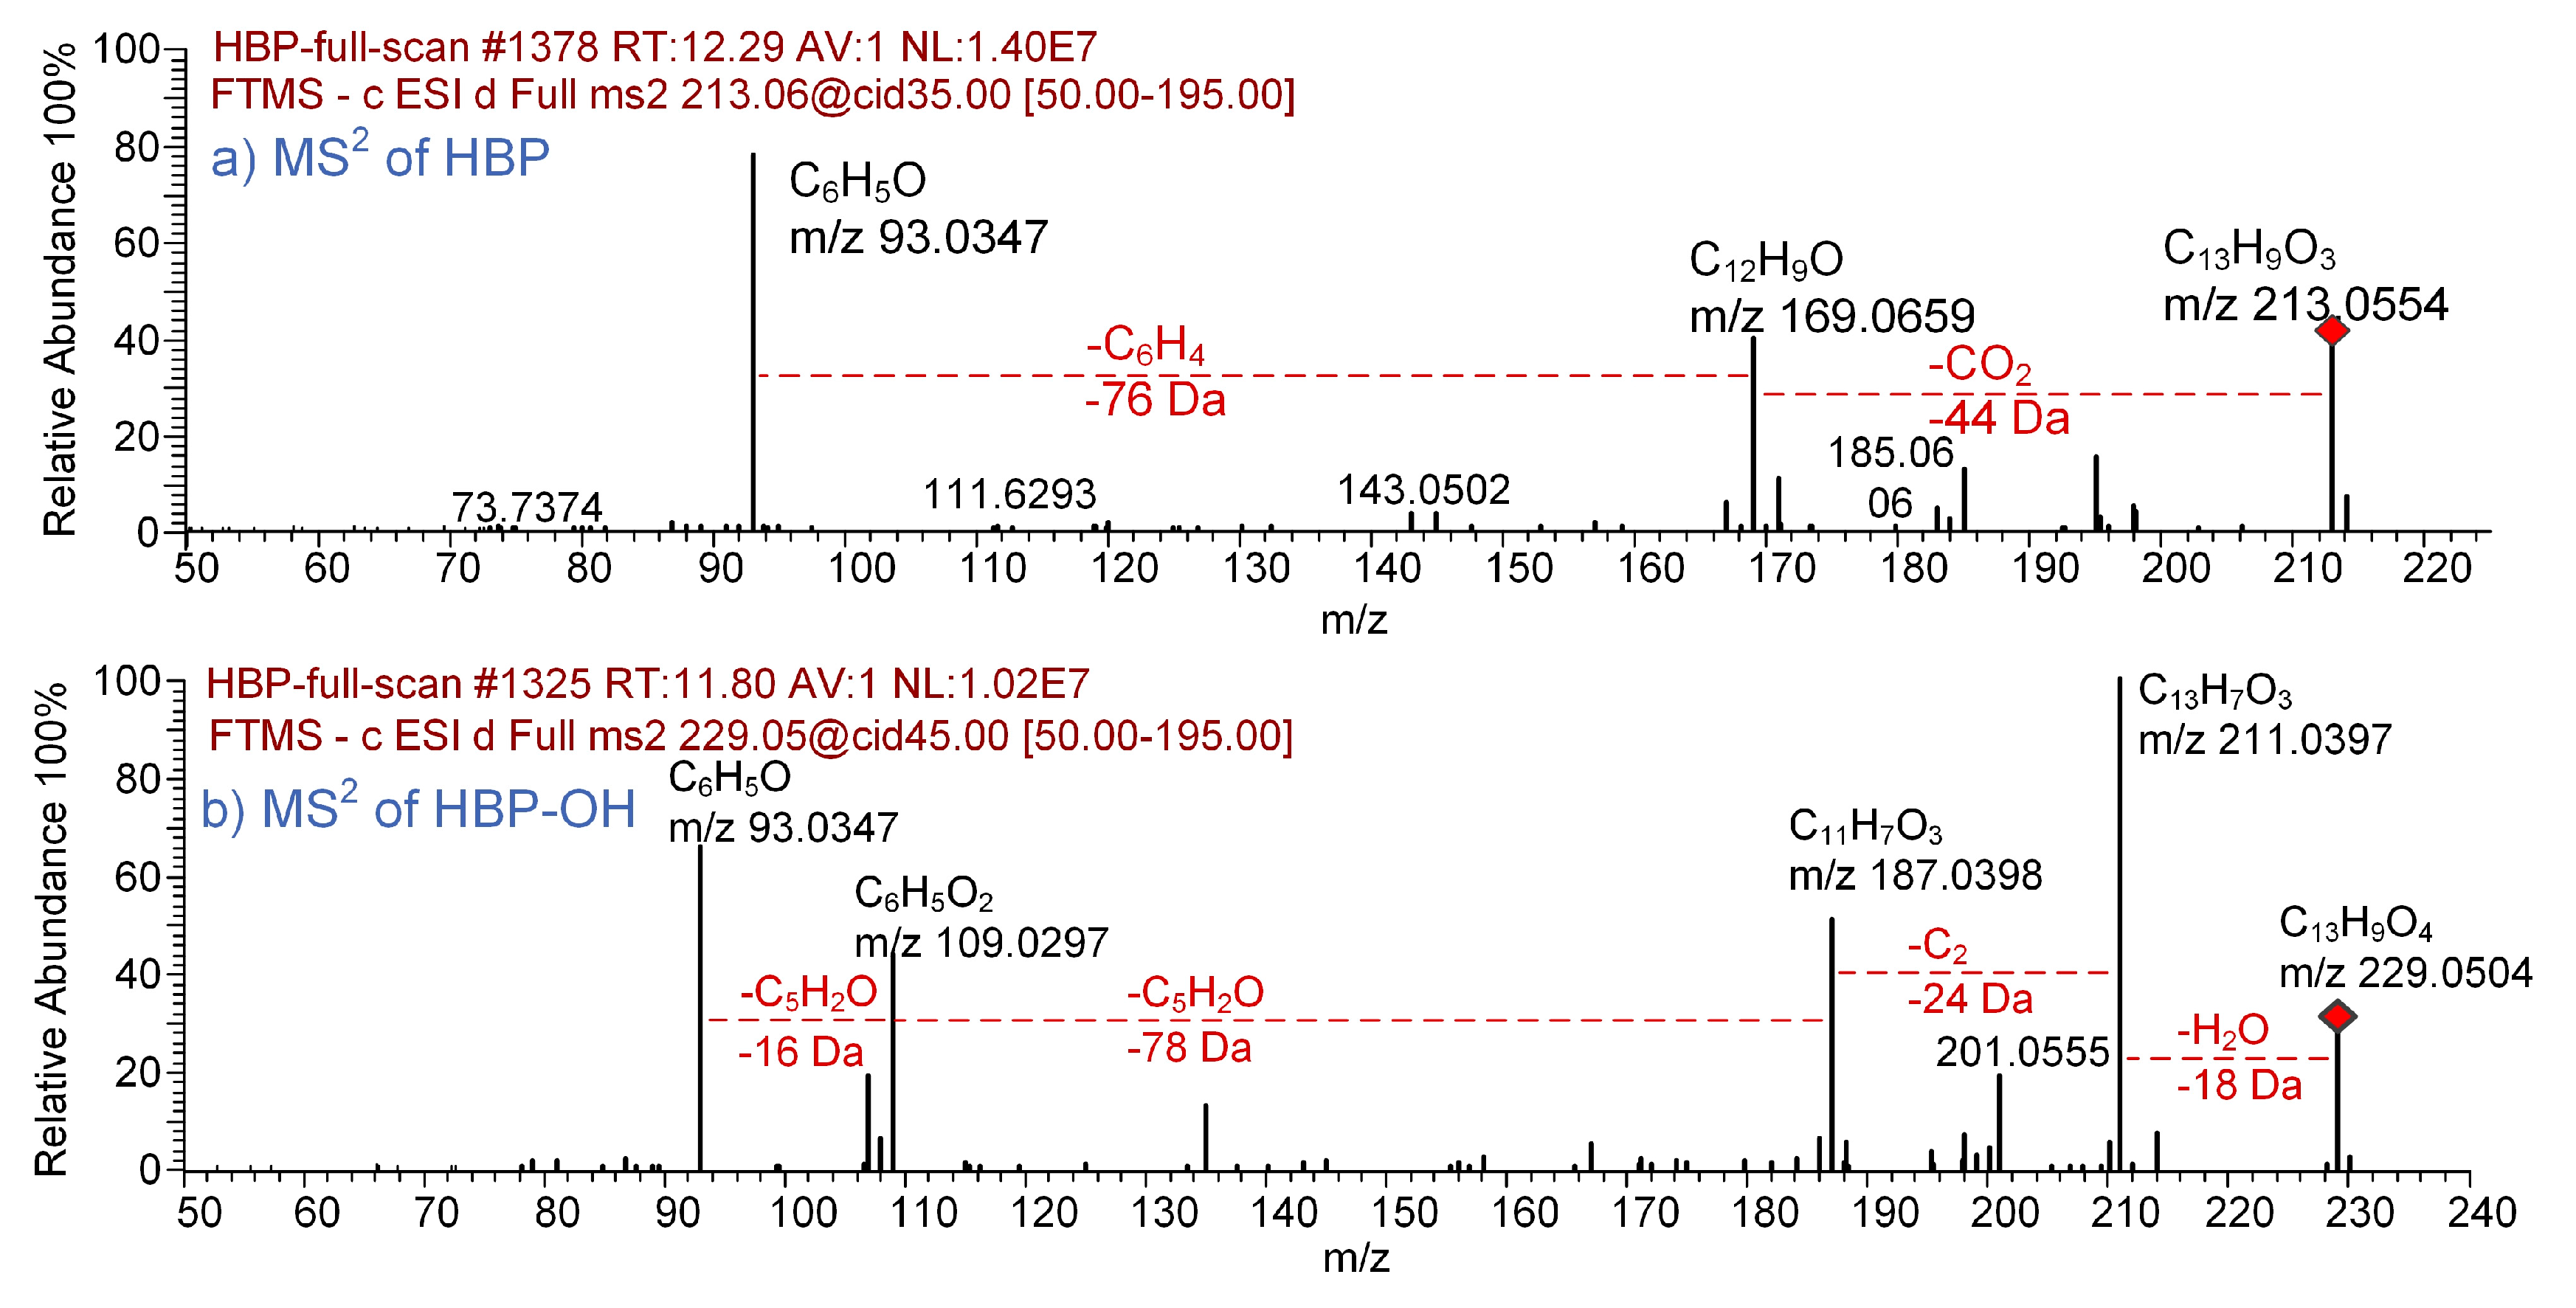
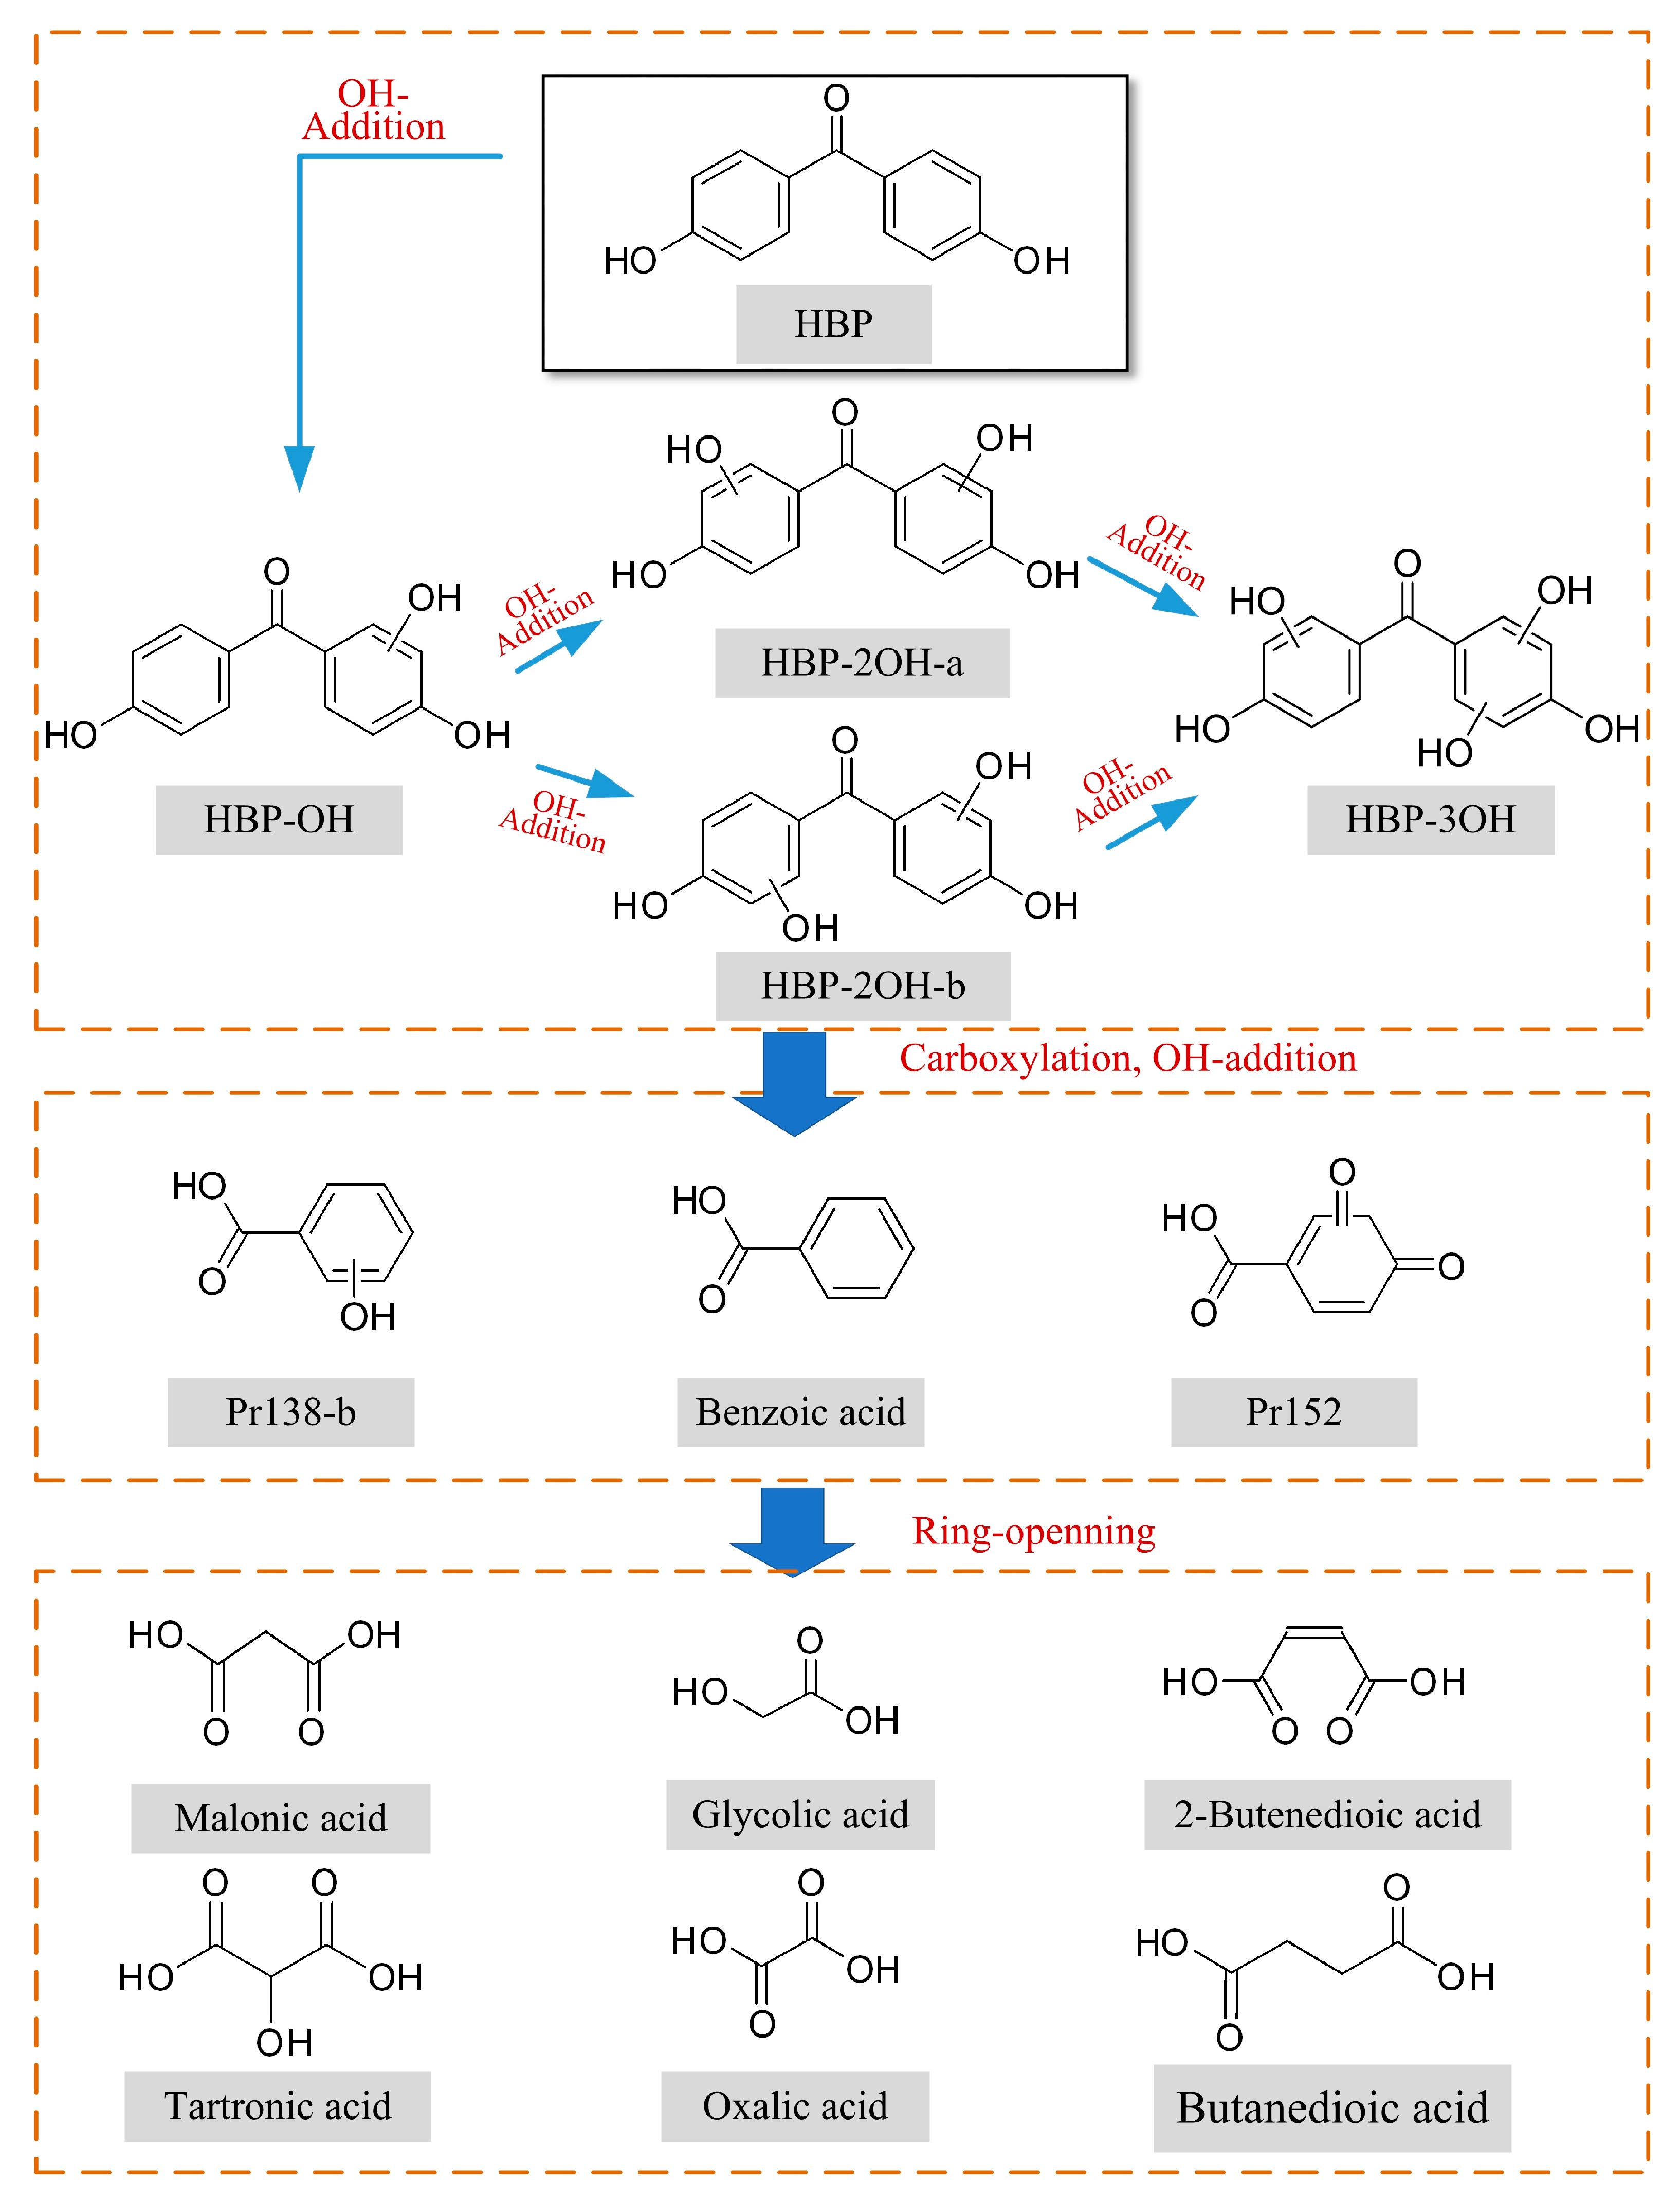
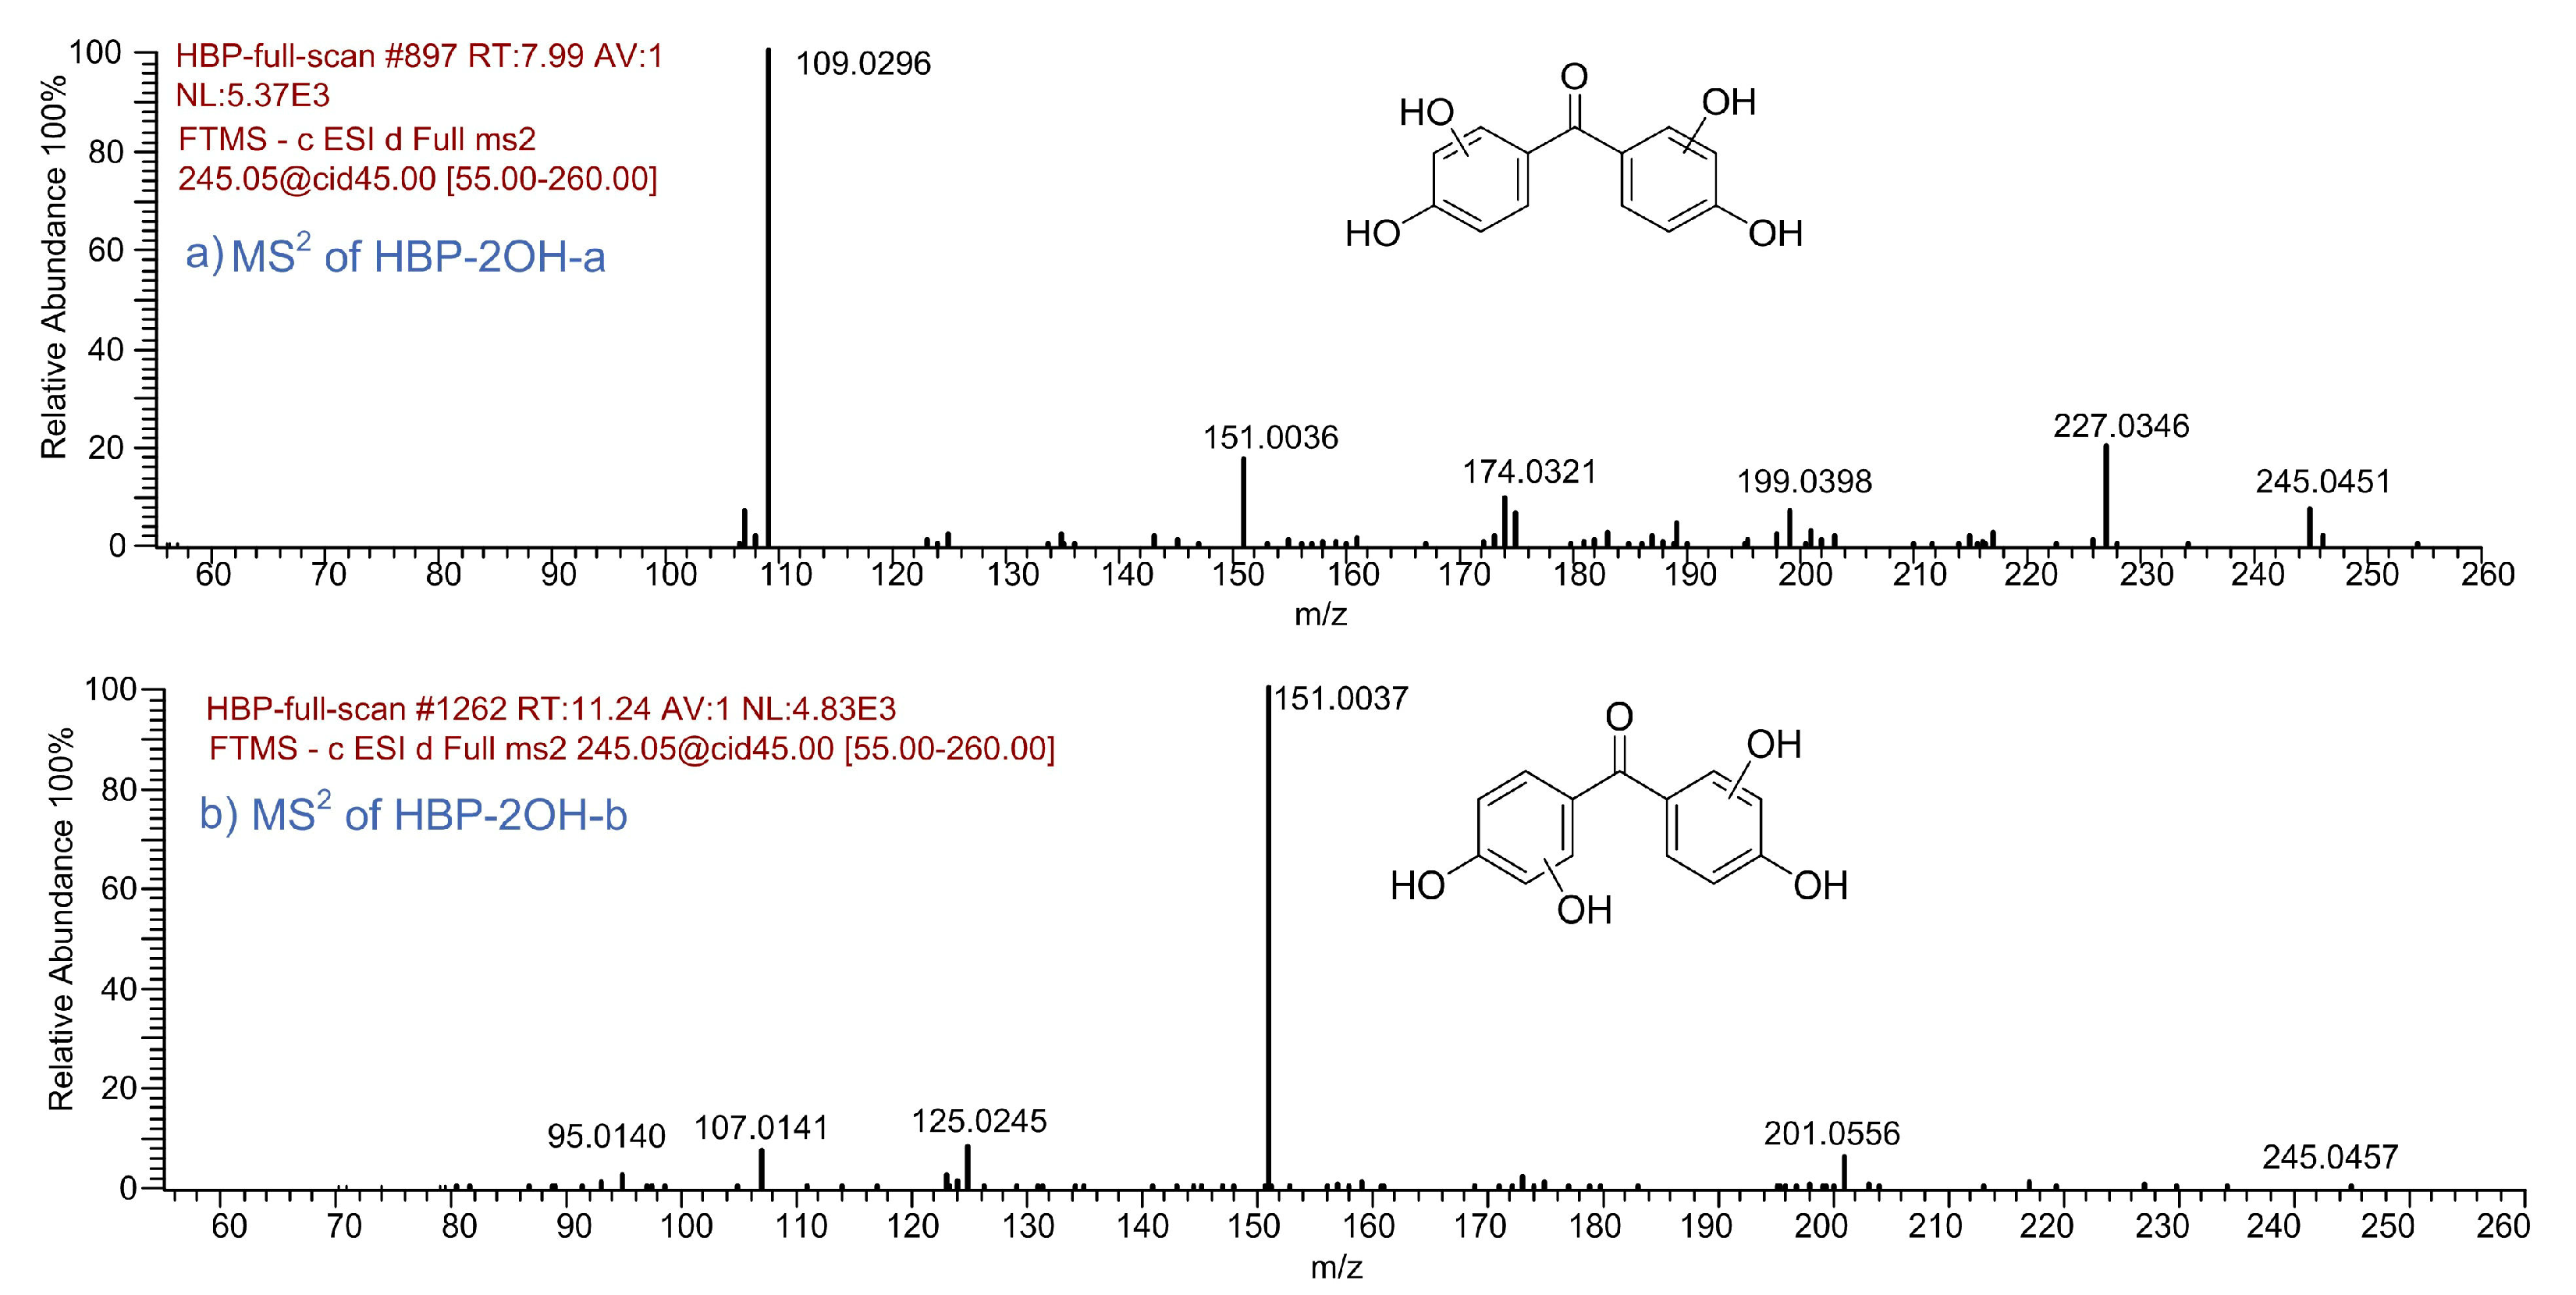
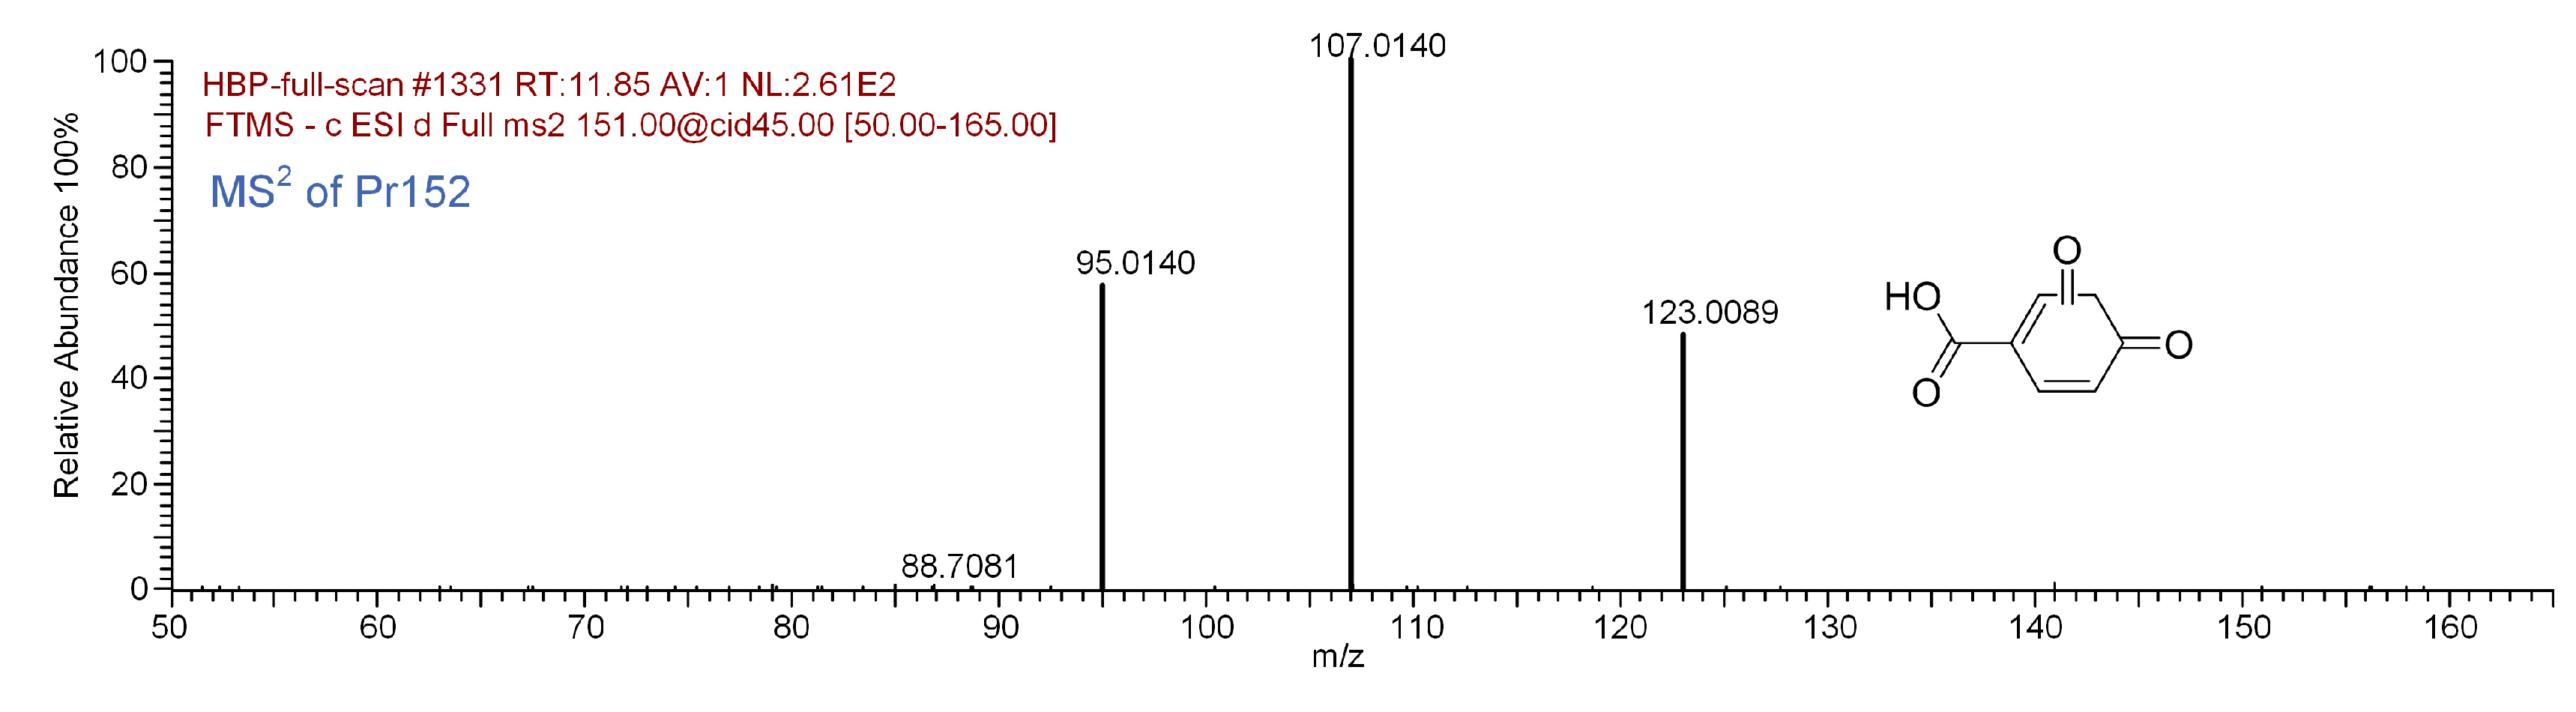
3.5. Degradation Mechanism of HBP
4. Conclusions
- The built RSM model is in accordance with the experimental results and helps to elucidate the reaction factors. For both processes, the initial contaminant concentration (exerting a negative effect) were the most important factors controlling the degradation, followed by H2O2 dose and UV intensity (exerting positive effects).
- A total of 15 BP and 13 HBP degradation products were detected. There exist hydroxylated products during the BP and HBP degradation, including mono-hydroxylated, di-hydroxylated, and tri-hydroxylated degradation products. OH radical irritated reactions, including hydroxylation, carboxylation, and ring cleavage, result in the degradation of BP and HBP to CO2 and H2O.
- The research provides support for the future application of UV/H2O2 advanced oxidation processes for the treatment of wastewater containing benzophenone-type UV filters.
Author Contributions
Funding
Acknowledgments
Conflicts of Interest
Appendix A


References
- Kim, K.Y.; Ekpeghere, K.I.; Jeong, H.-J.; Oh, J.-E. Effects of the summer holiday season on UV filter and illicit drug concentrations in the Korean wastewater system and aquatic environment. Environ. Pollut. 2017, 227, 587–595. [Google Scholar] [CrossRef] [PubMed]
- Molins-Delgado, D.; Máñez, M.; Andreu, A.; Hiraldo, F.; Eljarrat, E.; Barceló, D.; Díaz-Cruz, M.S. A potential new threat to wild life: presence of UV Filters in bird eggs from a preserved area. Environ. Sci. Technol. 2017, 51, 10983–10990. [Google Scholar] [CrossRef] [PubMed]
- Giokas, D.L.; Salvador, A.; Chisvert, A. UV filters: From sunscreens to human body and the environment. TrAC Trends Anal. Chem. 2007, 26, 360–374. [Google Scholar] [CrossRef]
- Chai, Q.; Zhang, S.; Wang, X.; Yang, H.; Xie, Y.F. Effect of bromide on the transformation and genotoxicity of octyl-dimethyl-p-aminobenzoic acid during chlorination. J. Hazard. Mater. 2017, 324, 626–633. [Google Scholar] [CrossRef] [PubMed]
- Fent, K.; Zenker, A.; Rapp, M. Widespread occurrence of estrogenic UV-filters in aquatic ecosystems in Switzerland. Environ. Pollut. 2010, 158, 1817–1824. [Google Scholar] [CrossRef] [PubMed]
- Burnett, M.E.; Wang, S. Current sunscreen controversies: A critical review. Photodermatol. Photoimmunol. Photomed. 2011, 27, 58–67. [Google Scholar] [CrossRef] [PubMed]
- Du, Y.; Wang, W.-Q.; Pei, Z.-T.; Ahmad, F.; Xu, R.-R.; Zhang, Y.-M.; Sun, L.-W. Acute toxicity and ecological risk assessment of benzophenone-3 (BP-3) and benzophenone-4 (BP-4) in ultraviolet (UV)-filters. Int. J. Environ. Res. Public Health 2017, 14, 1414. [Google Scholar] [CrossRef] [PubMed]
- Caliman, F.A.; Gavrilescu, M. Pharmaceuticals, personal care products and endocrine disrupting agents in the environment-a review. CLEAN-Soil Air Water 2009, 37, 277–303. [Google Scholar] [CrossRef]
- Rodil, R.; Quintana, J.B.; Concha-Grana, E.; Lopez-Mahia, P.; Muniategui-Lorenzo, S.; Prada-Rodriguez, D. Emerging pollutants in sewage, surface and drinking water in Galicia (NW Spain). Chemosphere 2012, 86, 1040–1049. [Google Scholar] [CrossRef] [PubMed]
- Langford, K.H.; Reid, M.J.; Fjeld, E.; Øxnevad, S.; Thomas, K.V. Environmental occurrence and risk of organic UV filters and stabilizers in multiple matrices in Norway. Environ. Int. 2015, 80, 1–7. [Google Scholar] [CrossRef] [PubMed]
- Ramos, S.; Homem, V.; Alves, A.; Santos, L. Advances in analytical methods and occurrence of organic UV-filters in the environment—A review. Sci. Total Environ. 2015, 526, 278–311. [Google Scholar] [CrossRef] [PubMed]
- Ekpeghere, K.I.; Kim, U.J.; O, S.H.; Kim, H.Y.; Oh, J.E. Distribution and seasonal occurrence of UV filters in rivers and wastewater treatment plants in Korea. Sci. Total Environ. 2016, 542, 121–128. [Google Scholar] [CrossRef] [PubMed]
- Negreira, N.; Rodriguez, I.; Ramil, M.; Rubi, E.; Cela, R. Sensitive determination of salicylate and benzophenone type UV filters in water samples using solid-phase microextraction, derivatization and gas chromatography tandem mass spectrometry. Anal. Chim. Acta. 2009, 638, 36–44. [Google Scholar] [CrossRef] [PubMed]
- Joss, A.; Siegrist, H.; Ternes, T.A. Are we about to upgrade wastewater treatment for removing organic micropollutants? Water Sci. Technol. 2008, 57, 251–255. [Google Scholar] [CrossRef] [PubMed]
- Milh, H.; Van Eyck, K.; Dewil, R. Degradation of 4-chlorophenol by microwave-enhanced advanced oxidation processes: Kinetics and influential process parameters. Water 2018, 10, 247. [Google Scholar] [CrossRef]
- Fang, J.; Liu, J.; Shang, C.; Fan, C. Degradation investigation of selected taste and odor compounds by a UV/Chlorine advanced oxidation process. Int. J. Environ. Res. Public Health 2018, 15, 284. [Google Scholar] [CrossRef] [PubMed]
- Lanzafame, G.; Sarakha, M.; Fabbri, D.; Vione, D. Degradation of methyl 2-aminobenzoate (methyl anthranilate) by H2O2/UV: Effect of inorganic anions and derived radicals. Molecules 2017, 22, 619. [Google Scholar] [CrossRef] [PubMed]
- Kudlek, E. Decomposition of contaminants of emerging concern in advanced oxidation processes. Water 2018, 10, 955. [Google Scholar] [CrossRef]
- He, X.; Zhang, G.; de la Cruz, A.A.; O′Shea, K.E.; Dionysiou, D.D. Degradation mechanism of Cyanobacterial toxin cylindrospermopsin by hydroxyl radicals in homogeneous UV/H2O2 process. Environ. Sci. Technol. 2014, 48, 4495–4504. [Google Scholar] [CrossRef] [PubMed]
- Kim, I.Y.; Kim, M.K.; Yoon, Y.; Im, J.K.; Zoh, K.D. Kinetics and degradation mechanism of clofibric acid and diclofenac in UV photolysis and UV/H2O2 reaction. Desalin. Water Treat. 2014, 52, 6211–6218. [Google Scholar] [CrossRef]
- Jung, Y.J.; Kim, W.G.; Yoon, Y.; Kang, J.-W.; Hong, Y.M.; Kim, H.W. Removal of amoxicillin by UV and UV/H2O2 processes. Sci. Total Environ. 2012, 4, 160–167. [Google Scholar] [CrossRef] [PubMed]
- Collivignarelli, M.; Pedrazzani, R.; Sorlini, S.; Abbà, A.; Bertanza, G. H2O2 based oxidation processes for the treatment of real high strength aqueous wastes. Sustainability 2017, 9, 244. [Google Scholar] [CrossRef]
- Jang, H.-H.; Seo, G.-T.; Jeong, D.-W. Advanced oxidation processes and nanofiltration to reduce the color and chemical oxygen demand of waste soy sauce. Sustainability 2018, 10, 2929. [Google Scholar] [CrossRef]
- Rott, E.; Kuch, B.; Lange, C.; Richter, P.; Kugele, A.; Minke, R. Removal of emerging contaminants and estrogenic activity from wastewater treatment plant effluent with UV/Chlorine and UV/H2O2 advanced oxidation treatment at pilot scale. Int. J. Environ. Res. Public Health 2018, 15, 935. [Google Scholar] [CrossRef] [PubMed]
- Gago-Ferrero, P.; Díaz-Cruz, M.S.; Barceló, D. An overview of UV-absorbing compounds (organic UV filters) in aquatic biota. Anal. Bioanal. Chem. 2012, 404, 2597–2610. [Google Scholar] [CrossRef] [PubMed]
- Zhang, S.; Yang, X.; Chen, J.; Wei, X.; Xie, Q.; Wang, Y.; Luo, T. Aquatic environmental photochemical behavior of organic sunscreens. Chin. Sci. Bull. 2013, 58, 2989–3006. (In Chinese) [Google Scholar]
- Lu, S.; Long, F.; Lu, P.; Lei, B.; Jiang, Z.; Liu, G.; Zhang, J.; Ma, S.; Yu, Y. Benzophenone-UV filters in personal care products and urine of schoolchildren from Shenzhen, China: Exposure assessment and possible source. Sci. Total Environ. 2018, 640, 1214–1220. [Google Scholar] [CrossRef] [PubMed]
- Wang, L.; Kannan, K. Characteristic profiles of benzonphenone-3 and its derivatives in urine of children and adults from the United States and China. Environ. Sci. Technol. 2013, 47, 12532–12538. [Google Scholar] [CrossRef] [PubMed]
- Kim, S.; Choi, K. Occurrences, toxicities, and ecological risks of benzophenone-3, a common component of organic sunscreen products: A mini-review. Environ. Int. 2014, 70, 143–157. [Google Scholar] [CrossRef] [PubMed]
- Ramos, S.; Homem, V.; Alves, A.; Santos, L. A review of organic UV-filters in wastewater treatment plants. Environ. Int. 2016, 86, 24–44. [Google Scholar] [CrossRef] [PubMed]
- Gong, P.; Yuan, H.; Zhai, P.; Xue, Y.; Li, H.; Dong, W.; Mailhot, G. Investigation on the degradation of benzophenone-3 by UV/H2O2 in aqueous solution. Chem. Eng. J. 2015, 277, 97–103. [Google Scholar] [CrossRef]
- Hopkins, Z.R.; Snowberger, S.; Blaney, L. Ozonation of the oxybenzone, octinoxate, and octocrylene UV-filters: Reaction kinetics, absorbance characteristics, and transformation products. J. Hazard. Mater. 2017, 338, 23–32. [Google Scholar] [CrossRef] [PubMed]
- Gago-Ferrero, P.; Badia-Fabregat, M.; Olivares, A.; Piña, B.; Blánquez, P.; Vicent, T.; Caminal, G.; Díaz-Cruz, M.S.; Barceló, D. Evaluation of fungal- and photo-degradation as potential treatments for the removal of sunscreens BP3 and BP1. Sci. Total Environ. 2012, 427–428, 355–363. [Google Scholar] [CrossRef] [PubMed]
- Duirk, S.E.; Bridenstine, D.R.; Leslie, D.C. Reaction of benzophenone UV filters in the presence of aqueous chlorine: Kinetics and chloroform formation. Water Res. 2013, 47, 579–587. [Google Scholar] [CrossRef] [PubMed]
- Santos, A.J.M.; Miranda, M.S.; Esteves da Silva, J.C.G. The degradation products of UV filters in aqueous and chlorinated aqueous solutions. Water Res. 2012, 46, 3167–3176. [Google Scholar] [CrossRef] [PubMed]
- Pan, X.; Yan, L.; Li, C.; Qu, R.; Wang, Z. Degradation of UV-filter benzophenone-3 in aqueous solution using persulfate catalyzed by cobalt ferrite. Chem. Eng. J. 2017, 326, 1197–1209. [Google Scholar] [CrossRef]
- Pan, X.; Yan, L.; Qu, R.; Wang, Z. Degradation of the UV-filter benzophenone-3 in aqueous solution using persulfate activated by heat, metal ions and light. Chemosphere 2018, 196, 95–104. [Google Scholar] [CrossRef] [PubMed]
- Liu, H.; Sun, P.; He, Q.; Feng, M.; Liu, H.; Yang, S.; Wang, L.; Wang, Z. Ozonation of the UV filter benzophenone-4 in aquatic environments: Intermediates and pathways. Chemosphere 2016, 149, 76–83. [Google Scholar] [CrossRef] [PubMed]
- Negreira, N.; Rodríguez, I.; Rodil, R.; Cela, R. Assessment of benzophenone-4 reactivity with free chlorine by liquid chromatography quadrupole time-of-flight mass spectrometry. Anal. Chim. Acta 2012, 743, 101–110. [Google Scholar] [CrossRef] [PubMed]
- Peng, M.; Du, E.; Li, Z.; Li, D.; Li, H. Transformation and toxicity assessment of two UV filters using UV/H2O2 process. Sci. Total Environ. 2017, 603, 361–369. [Google Scholar] [CrossRef] [PubMed]
- Ahmed, M.B.; Johir, M.A.H.; Zhou, J.L.; Ngo, H.H.; Guo, W.; Sornalingam, K. Photolytic and photocatalytic degradation of organic UV filters in contaminated water. Curr. Opin. Green Sustain. Chem. 2017, 6, 85–92. [Google Scholar] [CrossRef]
- Murgolo, S.; Yargeau, V.; Gerbasi, R.; Visentin, F.; El Habra, N.; Ricco, G.; Lacchetti, I.; Carere, M.; Curri, M.L.; Mascolo, G. A new supported TiO2 film deposited on stainless steel for the photocatalytic degradation of contaminants of emerging concern. Chem. Eng. J. 2017, 318, 103–111. [Google Scholar] [CrossRef]
- Zúñiga-Benítez, H.; Peñuela, G.A. Application of solar photo-Fenton for benzophenone-type UV filters removal. J. Environ. Manag. 2018, 217, 929–938. [Google Scholar] [CrossRef] [PubMed]
- Esmaili-Hafshejani, J.; Nezamzadeh-Ejhieh, A. Increased photocatalytic activity of Zn(II)/Cu(II) oxides and sulfides by coupling and supporting them onto clinoptilolite nanoparticles in the degradation of benzophenone aqueous solution. J. Hazard. Mater. 2016, 316, 194–203. [Google Scholar] [CrossRef] [PubMed]
- Hou, Y.; Ma, J.; Sun, Z.; Yu, Y.; Zhao, L. Degradation of benzophenone in aqueous solution by Mn-Fe-K modified ceramic honeycomb-catalyzed ozonation. J. Environ. Sci. 2006, 18, 1065–1072. [Google Scholar] [CrossRef]
- Chen, D.-Y.; Guo, X.-F.; Wang, H.; Zhang, H.-S. The natural degradation of benzophenone at low concentration in aquatic environments. Water Sci. Technol. 2015, 72, 503–509. [Google Scholar] [CrossRef] [PubMed]
- Fujii, K.; Kikuchi, S. Degradation of Benzophenone, a Potential Xenoestrogen, by a Yeast Isolated from the Activated Sludge of a Sewage Treatment Plant in Hokkaido. World J. Microbiol. Biotechnol. 2005, 21, 1311–1315. [Google Scholar] [CrossRef]
- Du, E.-D.; Feng, X.-X.; Guo, Y.-Q.; Peng, M.-G.; Feng, H.-Q.; Wang, J.-L.; Zhang, S. Dimethyl phthalate degradation by uv/h2o2: combination of experimental methods and quantum chemical calculation. CLEAN-Soil Air Water 2015, 43, 811–821. [Google Scholar] [CrossRef]
- Ahmad, F.; Anwar, S.; Firdous, S.; Da-Chuan, Y.; Iqbal, S. Biodegradation of bispyribac sodium by a novel bacterial consortium BDAM: Optimization of degradation conditions using response surface methodology. J. Hazard. Mater. 2018, 349, 272–281. [Google Scholar] [CrossRef] [PubMed]
- Aslani, H.; Nasseri, S.; Nabizadeh, R.; Mesdaghinia, A.; Alimohammadi, M.; Nazmara, S. Haloacetic acids degradation by an efficient Ferrate/UV process: Byproduct analysis, kinetic study, and application of response surface methodology for modeling and optimization. J. Environ. Manage. 2017, 203, 218–228. [Google Scholar] [CrossRef] [PubMed]
- Rezaee, R.; Maleki, A.; Jafari, A.; Mazloomi, S.; Zandsalimi, Y.; Mahvi, A.H. Application of response surface methodology for optimization of natural organic matter degradation by UV/H2O2 advanced oxidation process. J. Environ. Health. Sci. 2014, 12, 67–75. [Google Scholar] [CrossRef] [PubMed]
- Jabeen, H.; Iqbal, S.; Anwar, S.; Parales, R.E. Optimization of profenofos degradation by a novel bacterial consortium PBAC using response surface methodology. Int. Biodeterior. Biodegrad. 2015, 100, 89–97. [Google Scholar] [CrossRef]
- Ng, K.H.; Cheng, Y.W.; Khan, M.R.; Cheng, C.K. Optimization of photocatalytic degradation of palm oil mill effluent in UV/ZnO system based on response surface methodology. J. Environ. Manag. 2016, 184, 487–493. [Google Scholar] [CrossRef] [PubMed]
- Kasiri, M.B.; Khataee, A.R. Photooxidative decolorization of two organic dyes with different chemical structures by UV/H2O2 process: Experimental design. Desalination 2011, 270, 151–159. [Google Scholar] [CrossRef]
- Fu, Y.; Li, G.; Wang, R.; Zhang, F.; Qin, M. Effect of the molecular structure of acylating agents on the regioselectivity of cellulosic hydroxyl groups in ionic liquid. Bioresources 2016, 12, 992–1006. [Google Scholar] [CrossRef]
- Li, H.; Gong, Y.; Huang, Q.; Zhang, H. Degradation of orange II by UV-assisted advanced fenton process: Response surface approach, degradation pathway, and biodegradability. Ind. Eng. Chem. Res. 2013, 52, 15560–15567. [Google Scholar] [CrossRef]
- Peng, M.; Li, H.; Kang, X.; Du, E.; Li, D. Photo-degradation ibuprofen by UV/H2O2 process: response surface analysis and degradation mechanism. Water Sci. Technol. 2017, 75, 2935–2951. [Google Scholar] [CrossRef] [PubMed]
- Zuorro, A.; Fidaleo, M.; Lavecchia, R. Response surface methodology (RSM) analysis of photodegradation of sulfonated diazo dye reactive green 19 by UV/H2O2 process. J. Environ. Manage. 2013, 127, 28–35. [Google Scholar] [CrossRef] [PubMed]
- Rauf, M.A.; Marzouki, N.; Körbahti, B.K. Photolytic decolorization of Rose Bengal by UV/H2O2 and data optimization using response surface method. J. Hazard. Mater. 2008, 159, 602–609. [Google Scholar] [CrossRef] [PubMed]
- Mao, F.; He, Y.; Gin, K. Evaluating the joint toxicity of two benzophenone-type UV filters on the green alga chlamydomonas reinhardtii with response surface methodology. Toxics 2018, 6, 8. [Google Scholar] [CrossRef] [PubMed]
- Jiang, Y.; Shang, Y.; Yu, S.; Liu, J. Dechlorination of hexachlorobenzene in contaminated soils using a nanometallic al/cao dispersion mixture: optimization through response surface methodology. Int. J. Environ. Res. Public Health 2018, 15, 872. [Google Scholar] [CrossRef] [PubMed]
- Mohammadian, N.; Ghoreishi, S.; Hafeziyeh, S.; Saeidi, S.; Dionysiou, D. Optimization of synthesis conditions of carbon nanotubes via ultrasonic-assisted floating catalyst deposition using response surface methodology. Nanomaterials 2018, 8, 316. [Google Scholar] [CrossRef] [PubMed]
- Gago-Ferrero, P.; Demeestere, K.; Silvia Díaz-Cruz, M.; Barceló, D. Ozonation and peroxone oxidation of benzophenone-3 in water: Effect of operational parameters and identification of intermediate products. Sci. Total Environ. 2013, 443, 209–217. [Google Scholar] [CrossRef] [PubMed]
- Gago-Ferrero, P.; Díaz-Cruz, M.S.; Barceló, D. Fast pressurized liquid extraction with in-cell purification and analysis by liquid chromatography tandem mass spectrometry for the determination of UV filters and their degradation products in sediments. Anal. Bioanal. Chem. 2011, 400, 2195–2204. [Google Scholar] [CrossRef] [PubMed]
- Li, X.; Wang, Y.; Yuan, S.; Li, Z.; Wang, B.; Huang, J.; Deng, S.; Yu, G. Degradation of the anti-inflammatory drug ibuprofen by electro-peroxone process. Water Res. 2014, 63, 81–93. [Google Scholar] [CrossRef] [PubMed]


| Properties | BP | HBP |
|---|---|---|
| Name | Benzophenone | 4,4′-dihydroxy-benzophenone |
| CAS Number | 119-61-9 | 611-99-4 |
| Molecular Formula | C13H10O | C13H10O3 |
| Molecular Weight | 182.2179 | 214.2167 |
| Partition coefficient (Log P) | 3.18 | 2.55 |
| Molar Refractivity | 56.0 ± 0.3 | 59.8 ± 0.3 |
| Chemical Structure |  |  |
| Run | UV Light x1 (µw·cm−2) | Initial Concentration x2 (mg·L−1) | H2O2 Concentration x3 (mmol·L−1) | First-Order Degradation Rate Constant (min−1) | |
|---|---|---|---|---|---|
| KBP (min−1) | KHBP (min−1) | ||||
| 1 | 1400 | 5.00 | 0.10 | 0.050 | 0.023 |
| 2 | 900 | 22.5 | 0.20 | 0.020 | 0.010 |
| 3 | 400 | 5.00 | 0.50 | 0.069 | 0.037 |
| 4 | 900 | 22.5 | 0.30 | 0.027 | 0.012 |
| 5 | 400 | 5.00 | 0.10 | 0.015 | 0.008 |
| 6 | 900 | 31.3 | 0.30 | 0.025 | 0.007 |
| 7 | 900 | 22.5 | 0.30 | 0.031 | 0.013 |
| 8 | 400 | 40.0 | 0.10 | 0.003 | 0.004 |
| 9 | 900 | 22.5 | 0.30 | 0.029 | 0.012 |
| 10 | 900 | 22.5 | 0.40 | 0.032 | 0.015 |
| 11 | 900 | 22.5 | 0.30 | 0.023 | 0.012 |
| 12 | 400 | 40.0 | 0.50 | 0.013 | 0.005 |
| 13 | 1150 | 22.5 | 0.30 | 0.033 | 0.014 |
| 14 | 900 | 22.5 | 0.30 | 0.030 | 0.012 |
| 15 | 650 | 22.5 | 0.30 | 0.021 | 0.011 |
| 16 | 1400 | 5.00 | 0.50 | 0.131 | 0.065 |
| 17 | 900 | 22.5 | 0.30 | 0.025 | 0.012 |
| 18 | 1400 | 40.0 | 0.50 | 0.036 | 0.008 |
| 19 | 1400 | 40.0 | 0.10 | 0.013 | 0.002 |
| 20 | 900 | 13.8 | 0.30 | 0.047 | 0.015 |
| Terms | BP | HBP | ||||||
|---|---|---|---|---|---|---|---|---|
| Sum of Squares | Mean Square | F-Value | P-Value | Sum of Squares | Mean Square | F-Value | P-Value | |
| Model | 1.412 × 10⁻³ | 1.549 × 10⁻³ | 127.01 | <0.0001 | 3.668 × 10⁻³ | 4.076 × 10⁻⁴ | 93.92 | <0.0001 |
| X1 | 2.194 × 10⁻³ | 2.194 × 10⁻³ | 179.87 | <0.0001 | 2.404 × 10⁻⁴ | 2.404 × 10⁻⁴ | 55.38 | <0.0001 |
| X2 | 5.223 × 10⁻³ | 5.223 × 10⁻³ | 428.25 | <0.0001 | 1.652 × 10⁻³ | 1.652 × 10⁻³ | 380.65 | <0.0001 |
| X3 | 3.582 × 10⁻³ | 3.582 × 10⁻³ | 293.74 | <0.0001 | 7.380 × 10⁻⁴ | 7.380 × 10⁻⁴ | 170.04 | <0.0001 |
| X1X2 | 5.072 × 10⁻⁴ | 5.072 × 10⁻⁴ | 41.59 | <0.0001 | 2.365 × 10⁻⁴ | 2.365 × 10⁻⁴ | 54.50 | <0.0001 |
| X1X3 | 2.030 × 10⁻⁴ | 2.030 × 10⁻⁴ | 16.65 | 0.0022 | 3.003 × 10⁻⁵ | 3.003 × 10⁻⁵ | 6.92 | 0.0251 |
| X2X3 | 1.303 × 10⁻³ | 1.303 × 10⁻³ | 106.84 | <0.0001 | 5.396 × 10⁻⁴ | 5.396 × 10⁻⁴ | 124.32 | <0.0001 |
| X12 | 8.762 × 10⁻⁶ | 8.762 × 10⁻⁶ | 0.72 | 0.4165 | 2.413 × 10⁻⁶ | 2.413 × 10⁻⁶ | 0.56 | 0.4731 |
| X22 | 1.742 × 10⁻⁴ | 1.742 × 10⁻⁴ | 14.28 | 0.0036 | 4.803 × 10⁻⁷ | 4.803 × 10⁻⁷ | 0.11 | 0.7462 |
| X32 | 1.962 × 10⁻⁵ | 1.962 × 10⁻⁵ | 1.61 | 0.2335 | 5.038 × 10⁻⁶ | 5.038 × 10⁻⁶ | 1.16 | 0.3066 |
| Lack of Fit | 7.843 × 10⁻⁵ | 1.569 × 10⁻⁵ | 1.65 | 0.2978 | 1.962 × 10⁻⁵ | 1.962 × 10⁻⁵ | 1.61 | 0.2335 |
| Code | Retention Time (min) | Molecular Formula | Molecular Ions | Structure | ||
|---|---|---|---|---|---|---|
| Theoretical m/z | Measured m/z | Δ ppm | ||||
| BP | 13.96 | C13H10O | 183.0804 * | 183.0806 | 1.10 |  |
| BP-OH | 13.19 | C13H10O2 | 197.0608 | 197.0608 | 0.25 |  |
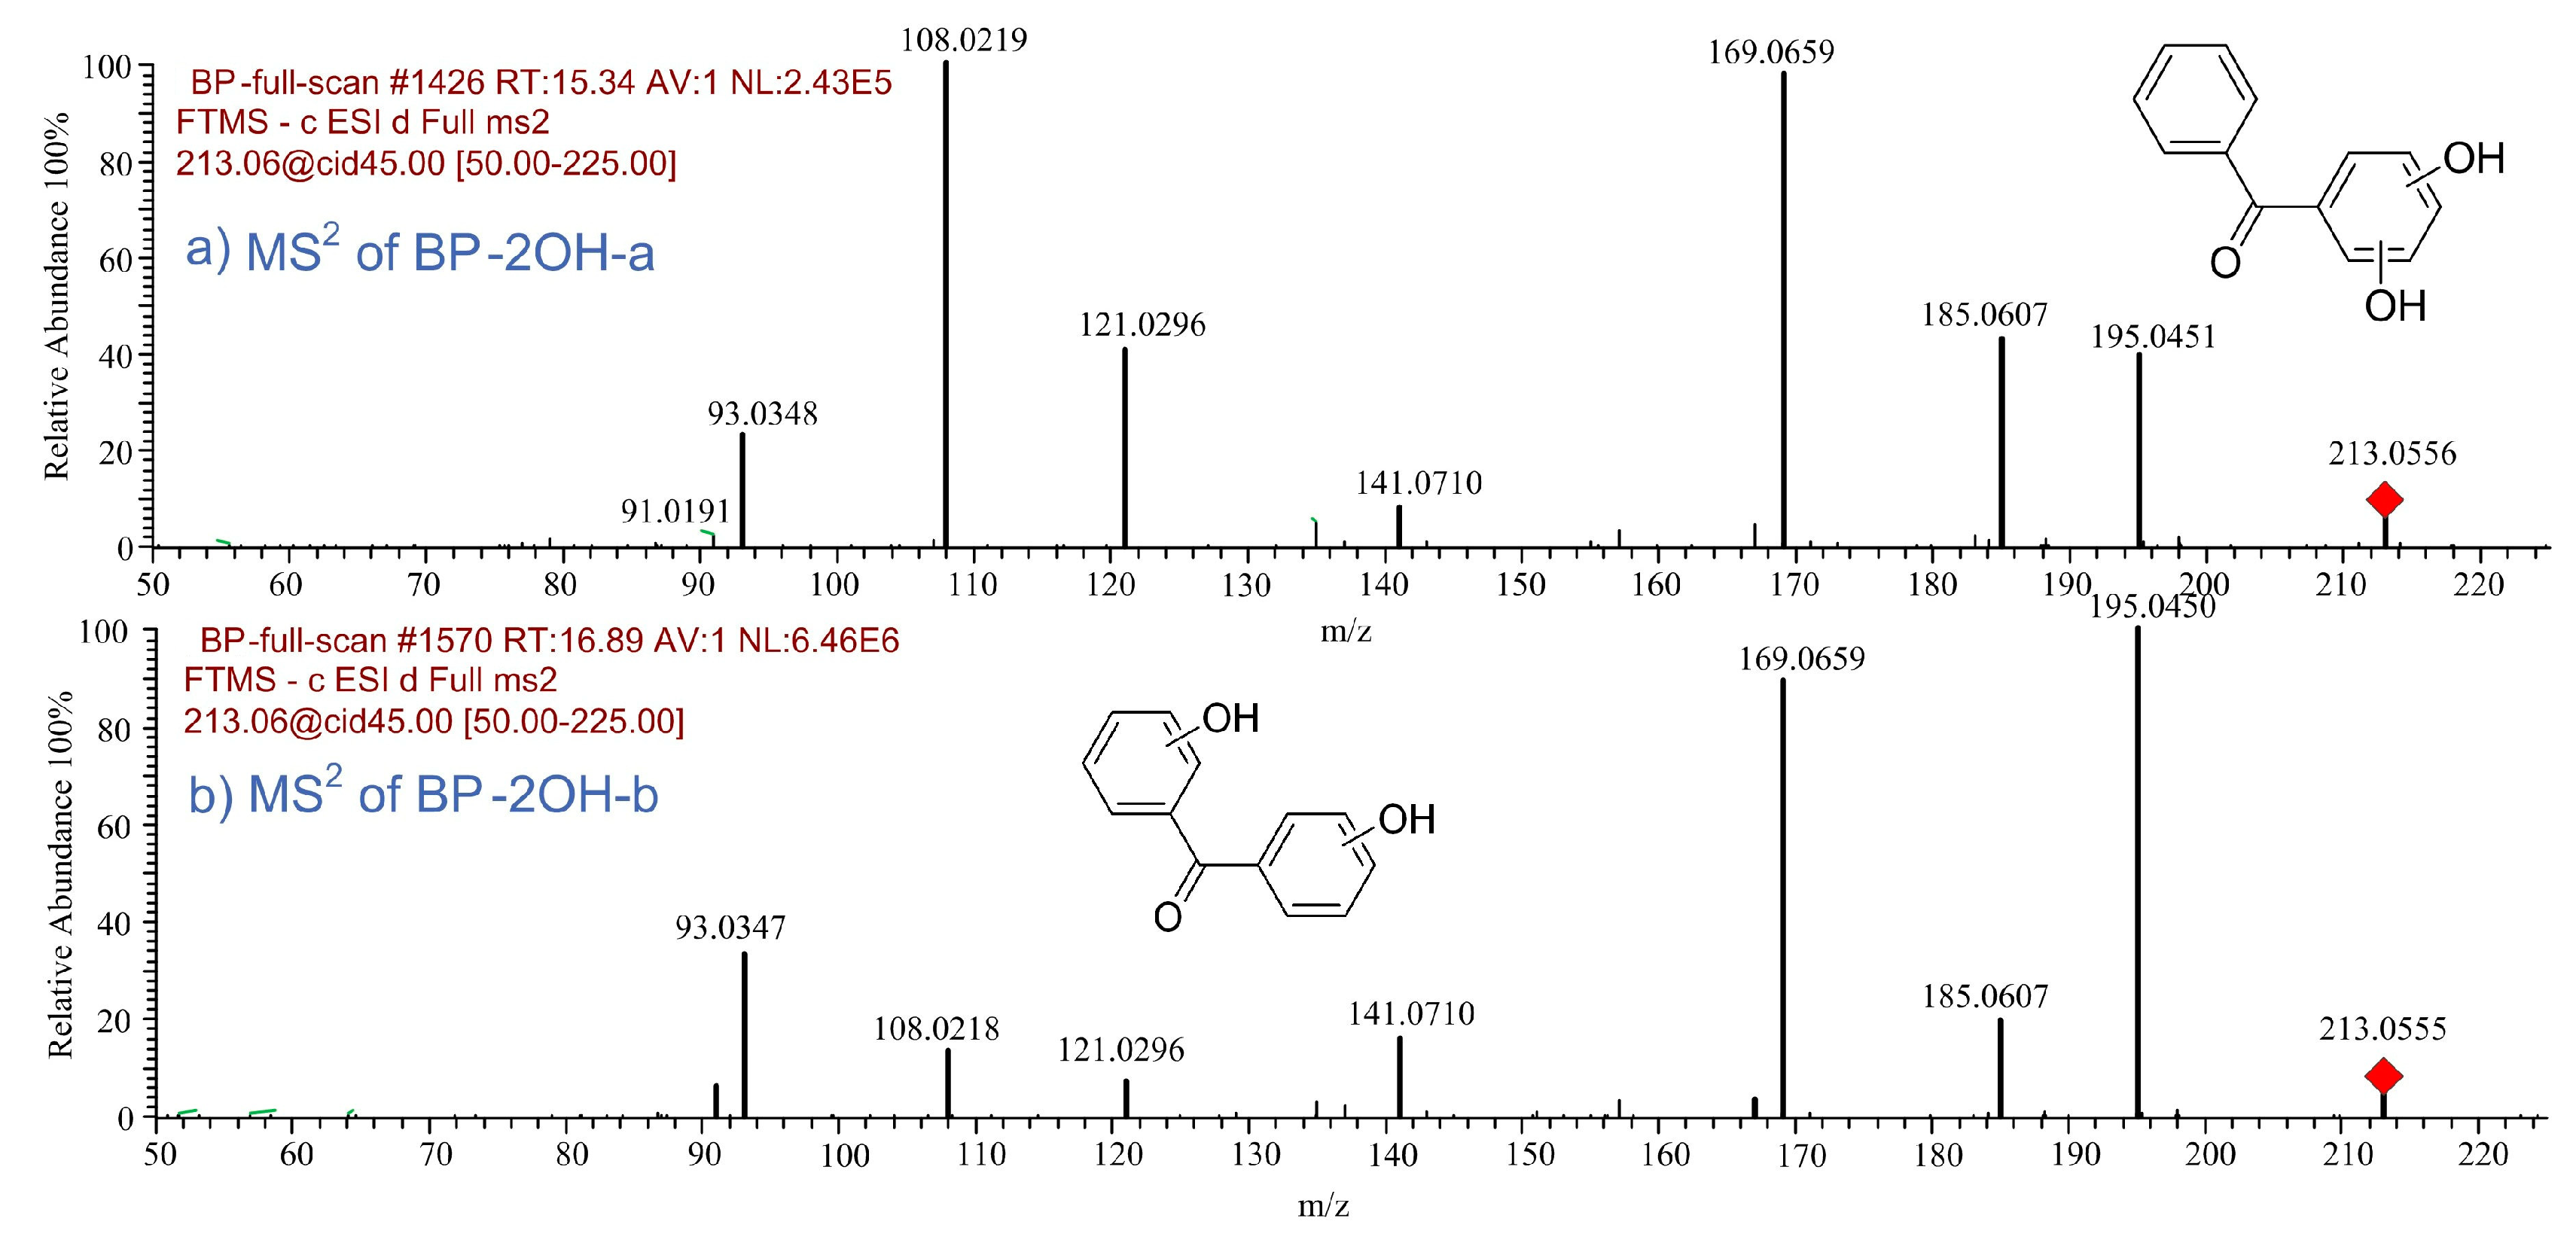
| BP-2OH-a | 15.34 | C13H10O3 | 213.0557 | 213.0556 | 0.47 |  |
| BP-2OH-b | 16.89 | C13H10O3 | 213.0557 | 213.0555 | 0.94 |  |
| BP-3OH | 14.27 | C13H10O4 | 229.0506 | 229.0505 | 0.44 | 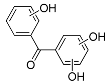 |
| Pr138-a | 2.58 | C7H6O3 | 137.0244 | 137.0244 | 0.18 |  |
| Pr138-b | 6.42 | C7H6O3 | 137.0244 | 137.0245 | 0.73 |  |
| Benzoic acid | 12.43 | C7H6O2 | 121.0295 | 121.0295 | 0.33 |  |
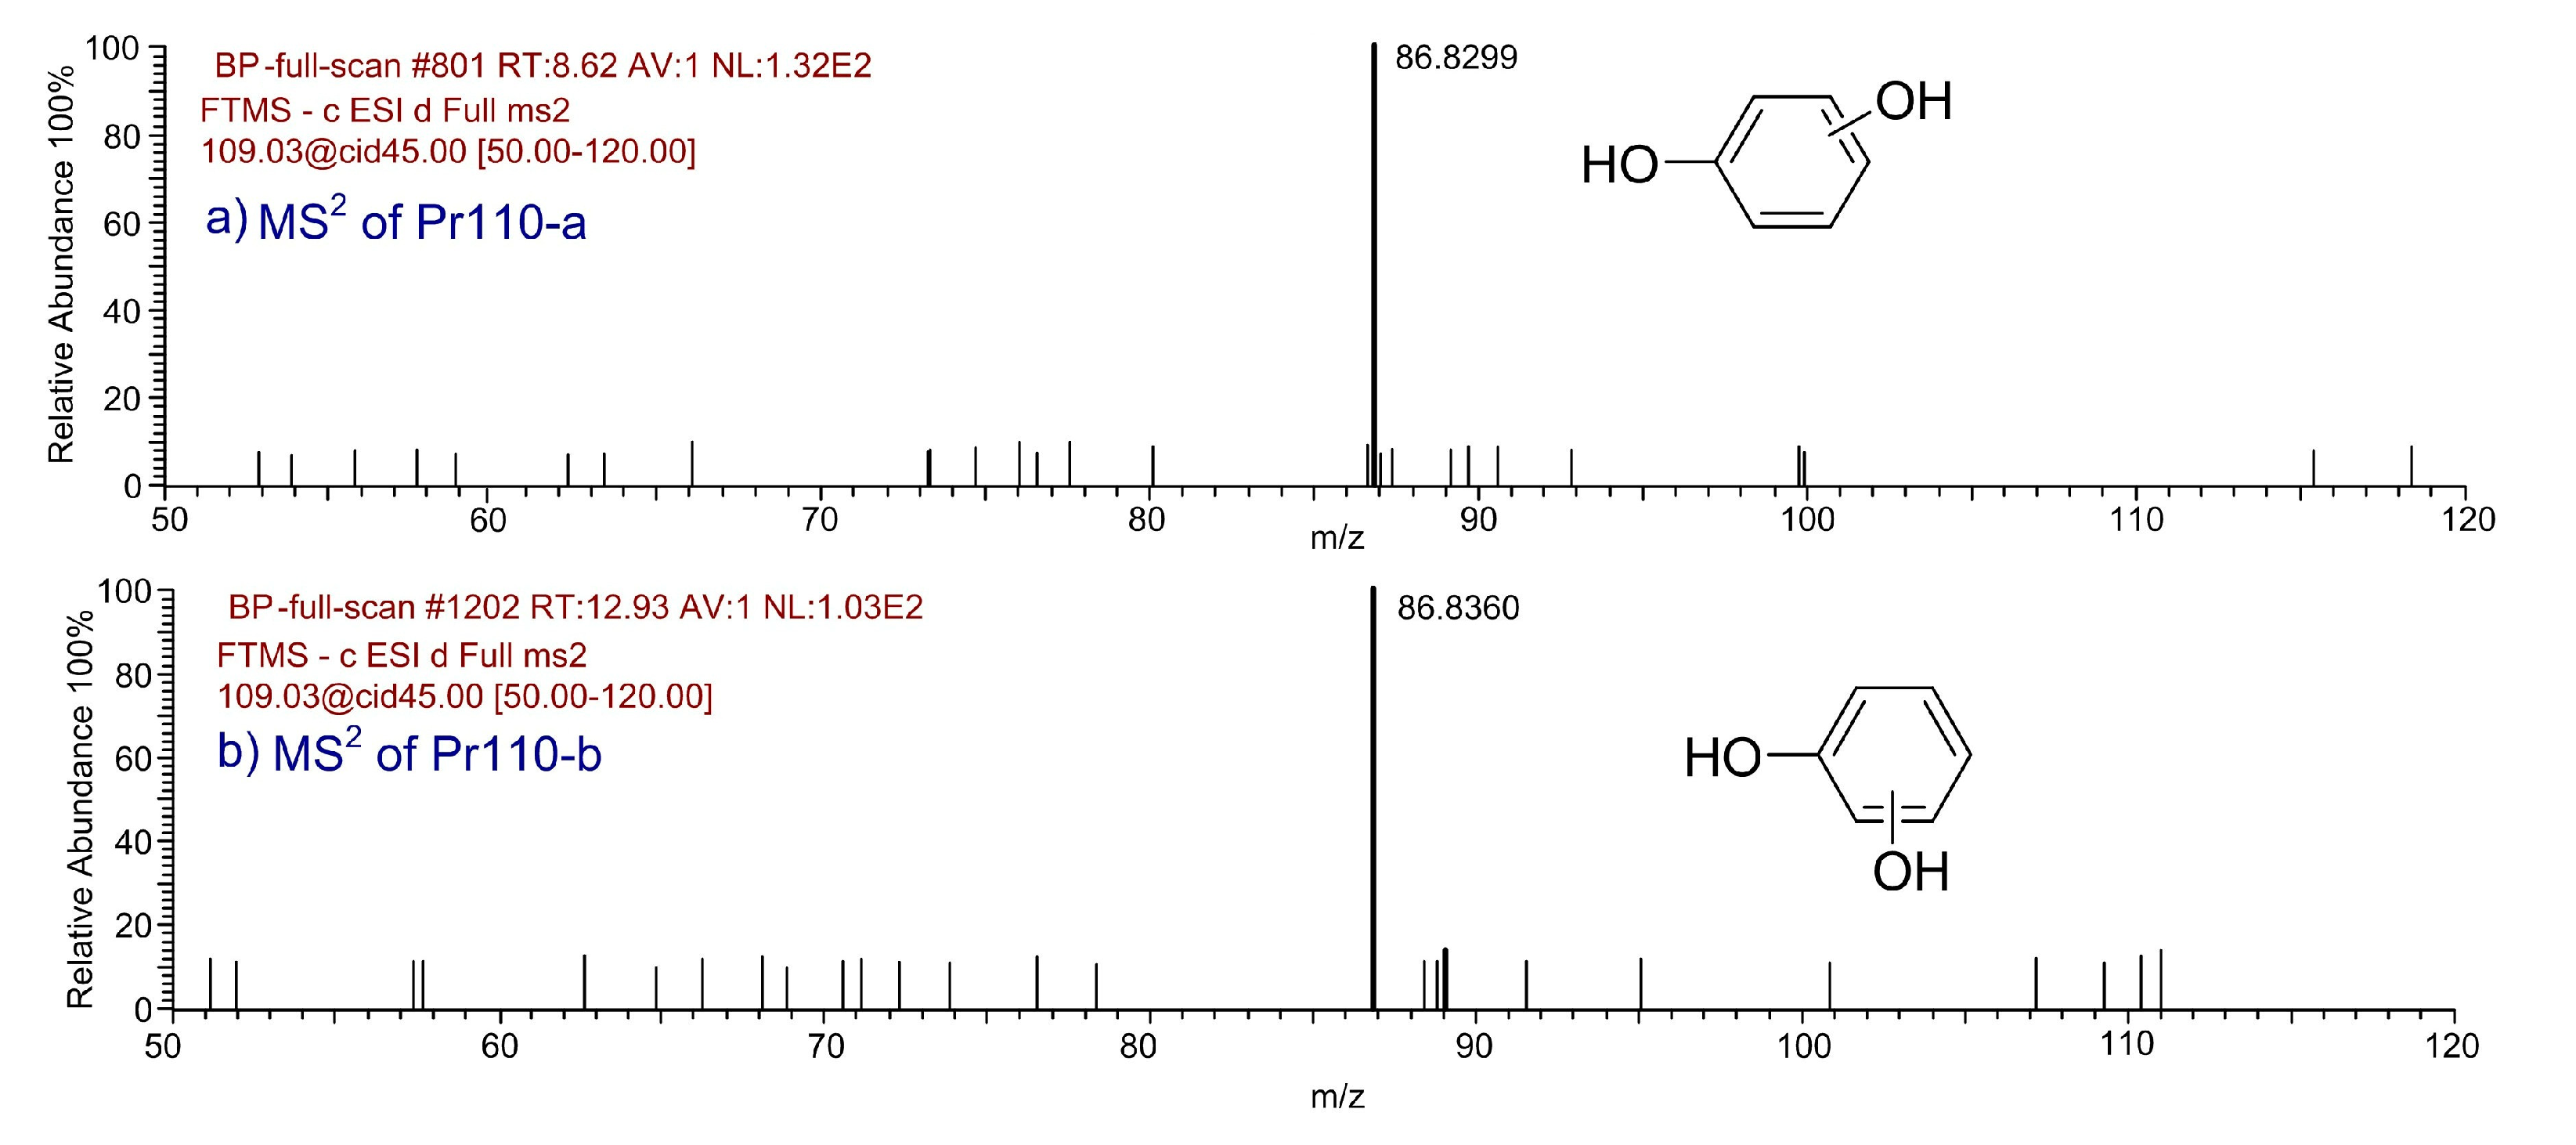
| Pr110-a | 8.62 | C6H6O2 | 109.0295 | 109.0296 | 0.91 |  |
| Pr110-b | 12.93 | C6H6O2 | 109.0295 | 109.0298 | 2.75 |  |
| Products | Molecular Weight | CAS Number | GC Retention Time (min) | Molecular Structure |
|---|---|---|---|---|
| Glycolic acid (2TMS *) | 220 | 33581-77-0 | 5.42 | 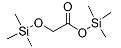 |
| Oxalic acid (2TMS) | 234 | 18294-04-7 | 5.81 | 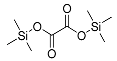 |
| Malonic acid (2TMS) | 248 | 18457-04-0 | 6.29 | 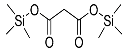 |
| 2-Butenedioic acid (2TMS) | 260 | 23508-82-9 | 6.91 | 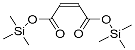 |
| Tartronic acid (3TMS) | 336 | 38165-93-4 | 7.40 | 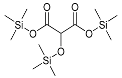 |
| Malic acid (3TMS) | 350 | 38166-11-9 | 7.92 | 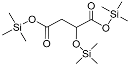 |
| Code | Retention Time (min) | Molecular Formula | Molecular Ions | Structure | ||
|---|---|---|---|---|---|---|
| Theoretical m/z | Measured m/z | Δ ppm | ||||
| HBP | 12.29 | C13H10O3 | 213.0557 | 213.0556 | 0.47 | 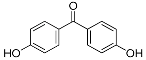 |
| HBP-OH | 11.80 | C13H10O4 | 229.0506 | 229.0504 | 0.87 |  |
| HBP-2OH-a | 7.99 | C13H10O5 | 245.0455 | 245.0455 | 0.06 | 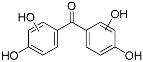 |
| HBP-2OH-b | 11.24 | C13H10O5 | 245.0455 | 245.0456 | 0.41 |  |
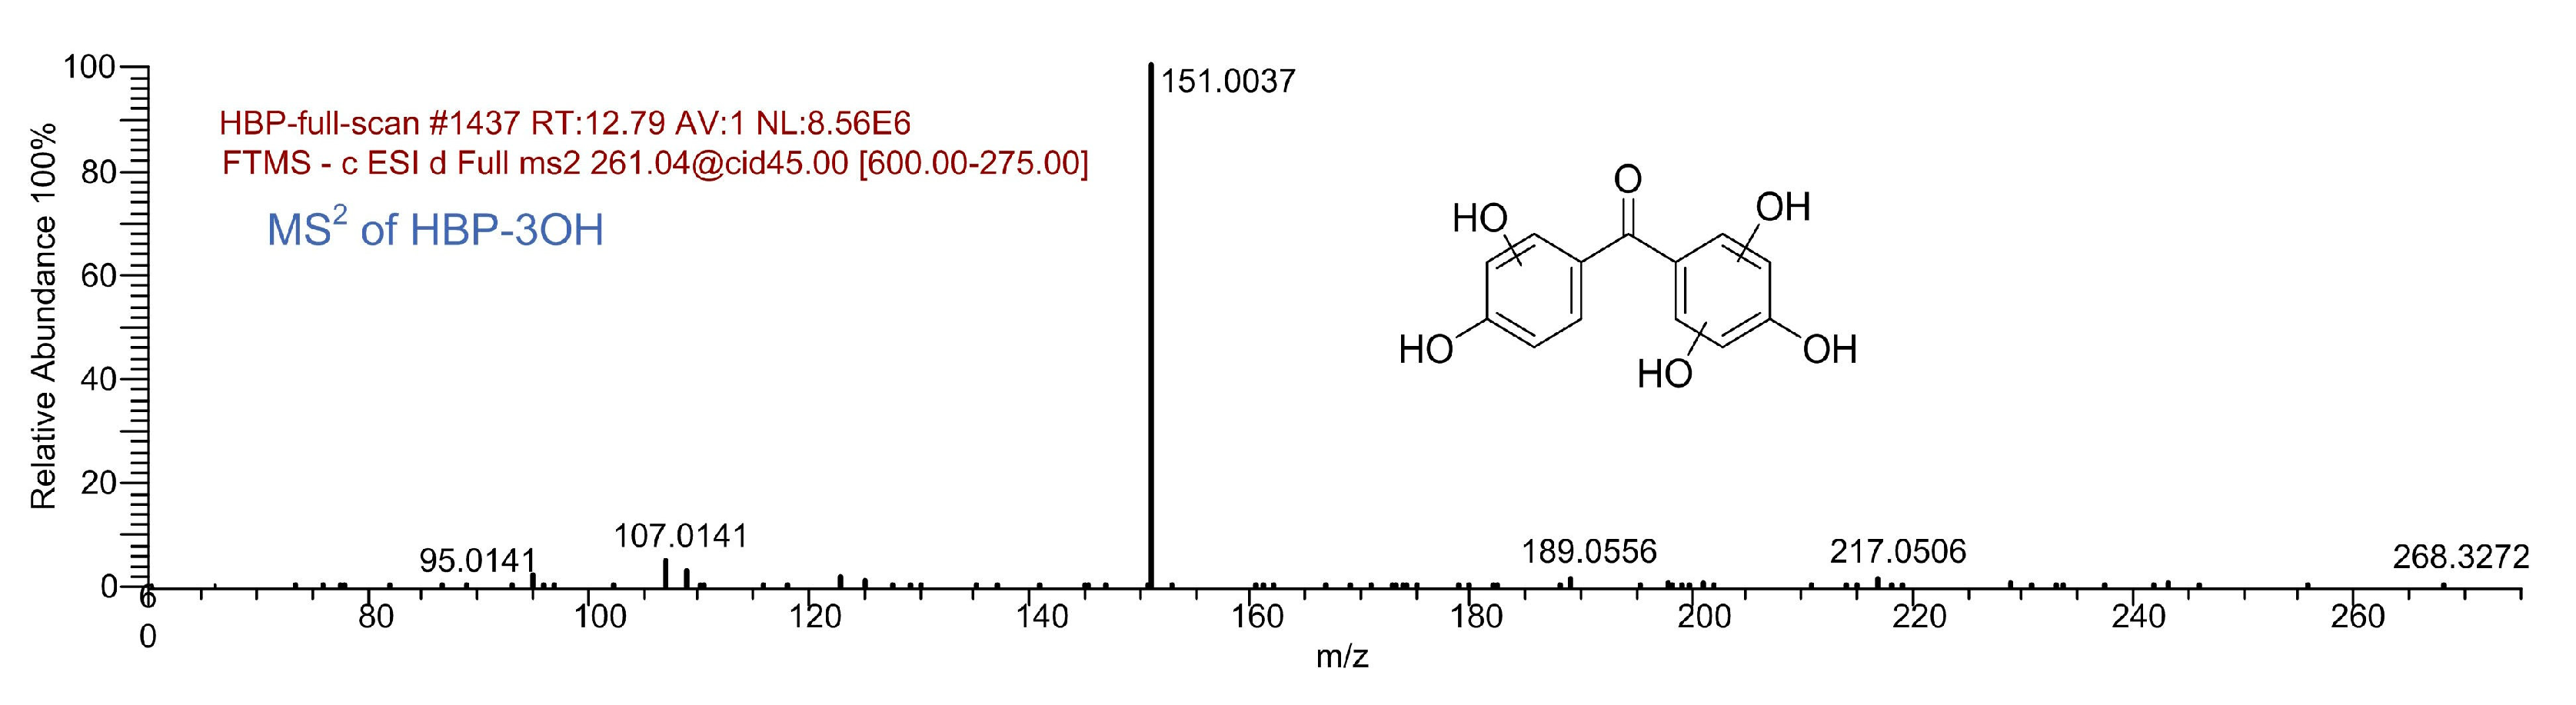
| HBP-3OH | 12.79 | C13H10O6 | 261.0405 | 261.0405 | 0.09 | 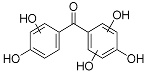 |
| Pr152 | 11.85 | C7H4O4 | 151.0037 | 151.0036 | 0.66 |  |
| Benzoic acid | 12.25 | C7H6O2 | 121.0295 | 121.0296 | 0.82 |  |
| Pr138-b | 7.38 | C7H6O3 | 137.0244 | 137.0245 | 0.73 |  |
| Products | Molecular Weight | CAS Number | GC Retention Time (min) | Molecular Structure |
|---|---|---|---|---|
| Glycolic acid (2TMS *) | 220 | 33581-77-0 | 5.43 | 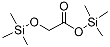 |
| Oxalic acid (2TMS) | 234 | 18294-04-7 | 5.33 |  |
| Malonic acid (2TMS) | 248 | 18457-04-0 | 6.29 | 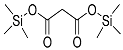 |
| 2-Butenedioic acid (2TMS) | 260 | 23508-82-9 | 6.91 |  |
| Butanedioic acid (2TMS) | 262 | 40309-57-7 | 6.94 |  |
| Tartronic acid (3TMS) | 336 | 38165-93-4 | 7.40 |  |
© 2018 by the authors. Licensee MDPI, Basel, Switzerland. This article is an open access article distributed under the terms and conditions of the Creative Commons Attribution (CC BY) license (http://creativecommons.org/licenses/by/4.0/).
Share and Cite
Du, E.; Li, J.; Zhou, S.; Li, M.; Liu, X.; Li, H. Insight into the Degradation of Two Benzophenone-Type UV Filters by the UV/H2O2 Advanced Oxidation Process. Water 2018, 10, 1238. https://doi.org/10.3390/w10091238
Du E, Li J, Zhou S, Li M, Liu X, Li H. Insight into the Degradation of Two Benzophenone-Type UV Filters by the UV/H2O2 Advanced Oxidation Process. Water. 2018; 10(9):1238. https://doi.org/10.3390/w10091238
Chicago/Turabian StyleDu, Erdeng, Jiaqi Li, Siqi Zhou, Miao Li, Xiang Liu, and Huajie Li. 2018. "Insight into the Degradation of Two Benzophenone-Type UV Filters by the UV/H2O2 Advanced Oxidation Process" Water 10, no. 9: 1238. https://doi.org/10.3390/w10091238
APA StyleDu, E., Li, J., Zhou, S., Li, M., Liu, X., & Li, H. (2018). Insight into the Degradation of Two Benzophenone-Type UV Filters by the UV/H2O2 Advanced Oxidation Process. Water, 10(9), 1238. https://doi.org/10.3390/w10091238