Article

Values and Preferences for Domestic Water Use: A Study from the Transboundary River Basin of Mékrou (West Africa)

by
Vasileios Markantonis
1,*,
Celine Dondeynaz
1,
Dionysis Latinopoulos
2,
Kostas Bithas
3,
Ioannis Trichakis
1,
Yèkambèssoun N’Tcha M’Po
4 and
Cesar Carmona Moreno
1
1
European Commission, Joint Research Centre, Via E. Fermi 2749, 21027 Ispra, Italy
2
School of Spatial Planning and Development, Aristotle University of Thessaloniki, GR-54124 Thessaloniki, Greece
3
Institute of Urban Environment & Human Resources, Department of Economic and Regional Development, Panteion University, 14 Aristotelous St., GR-17671 Kallithea, Athens, Greece
4
Institut National de l’Eau (INE), Université d’Abomey-Calavi (UAC), 01 BP 4521 Cotonou, Benin
*
Author to whom correspondence should be addressed.
Water 2018, 10(9), 1232; https://doi.org/10.3390/w10091232
Submission received: 26 July 2018 / Revised: 31 August 2018 / Accepted: 5 September 2018 / Published: 12 September 2018
(This article belongs to the Section Water Resources Management, Policy and Governance)

Abstract

:
Water is indispensable for human life and sufficient domestic use is considered as a regularity in the western world. The conditions are substantially different in African countries where poverty and lack of life-supporting services prevail. The provision of domestic water is an essential problem, which requires action. Τhe lack of sufficient funding for the development of infrastructure supports claims for citizen participation in related costs. However, can citizens pay and to what extend for sufficient water provision? The present study investigates a household’s willingness to pay for domestic water in the transboundary Mékrou River Basin in West Africa (Burkina Faso, Benin and Niger) and explores the payment for domestic water provision to poverty. The paper uses the results of a household survey that was undertaken in the Mekrou basin including a representative sample from all three countries. Based on this survey the paper presents basic socio-economic characteristics of the local population as well as qualitative water provision and management attributes. In the core of the econometric analysis the paper presents the results of the survey’s Contingent Valuation (CV) scenario estimating the households’ willingness to pay (WTP) for a domestic water provision. The households of the Mekrou basin are willing to pay 2.81 euro per month in average for a domestic water provision network but this is strongly related with the wealth of households. This finding although it may support the “user pays principle”, it also raises serious questions over the provision of water to poor households.

1. Introduction

At the turn of the new Millennium, more than 1 billion people lacked access to any form of sufficient water supply within 1 km of their home [1]. 15 years later, it is estimated that 663 million people still lacked access to safe water and billions remain without sanitation facilities [2]. The provision of reliable, sustained and safe water supply is high on the international and national agendas and in this context, the Millennium Development Goals have included a specific target of reducing by half the number of people without access to safe drinking water and basic sanitation [3]. The Sustainable Development Goal 6 further enhances the need to increase access to safe and adequate drinking water.
Several supply-driven interventions and investments may be determined and applied in areas where there is a need to improve domestic water supply services. Concerning the developing countries this need is associated with relatively high implementation costs, as well as with society’s low ability to pay for such improvements from public funds [4]. However, any water supply improvement program will only succeed if society desires it, is willing to pay for it in the long run and rewards policymakers for delivering it [5,6]. Therefore, as market is continuously extending to cover new shares of life in all countries, regardless the level of development, local residents’ willingness to pay for the necessary water supply investments is a critical decision factor for this kind of projects. Under certain conditions, the coverage of water costs by the user is the necessary condition for sustainable use [7].
Any evaluation concerning the domestic water supply services in the developing world should take into consideration not only the service level (i.e., the water volume used by households) but also other factors such as the quality of water, the accessibility—as determined by distance and/or time—as well as the reliability and the cost of water services. In order to better assess the average service level in a given region/country it is necessary to divide the domestic water use into different types of water use. White et al. [8] suggested three types of use: (a) consumption (e.g., drinking, cooking), (b) hygiene (e.g., basic needs for personal and domestic cleanliness) and (c) amenity use (e.g., lawn watering, car washing, etc.). In developing countries and particularly in low income areas, domestic use may also include the relatively small scale productive use (e.g., horticulture, animal watering, etc.) [9,10].
It is also interesting to note that previous evidence showed that water demand by households with private connections living in medium to large cities in developing countries is not very different from households in developed countries. In particular, according to the study of Nauges and Whittington [11] price elasticity for water demand lies in the range from −0.3 to −0.6. Income and education level are two important socio-economic characteristics that seem to be positively correlated with improved water sources in those areas [12,13,14,15]. In particular, income (or expenditure) elasticity of water demand was found to be quite low, usually lower than −0.3 [11]. Finally, household size is likely to negatively affect the per capita consumption, indicating either lower income households or/and a scale effect on the per capita water consumption.
On the other hand, there is little evidence so far concerning the domestic water supply demand in rural areas of developing countries, where water sources vary among households and water uses may comprise the productive ones. According to Thompson et al. [9], water consumption in households using off-plot water supplies are significantly influenced by economic factors and particularly by wealth factors. Poor households often suffer from poor water provision and associated sanitation and hygiene problems. For this reason, several poverty indices, usually applied in developing countries, incorporate some water-related indicators (e.g., [3,16,17,18]). Hence, better water supply can improve health and alleviate poverty, while inadequate provision of water-related services can undermine other policies/strategies for poverty alleviation. Despite the obvious relation between poverty and domestic water supply, there are a number of complex cause-effect relationships that are difficult to evaluate. In order to examine the link between poverty and domestic water services, it would be worthwhile: (a) to directly examine some relevant factors, such as the water availability, the access to safe water, the clean sanitation and the time taken to collect domestic water, or (b) to compare households’ welfare statuses in relation to water provision and use [16]. This study follows both approaches to examine the water-poverty relationship and its effect on people willingness to pay for improved domestic water services.
Evaluating domestic water use services in developing countries is a challenging task, mainly because of the lack of historical data, concerning a service that has never existed in a specific area. Many studies in developing countries focus on how to overcome this obstacle using different techniques, ranging from seemingly arbitrary or more educated guesses [8,19,20], but mainly focus on the actual price paid rather than the willingness to pay from the consumer’s point of view. There are, however, a number of studies, that have attempted to assess the willingness to pay (WTP) for improved water supply services in developing countries [21,22,23], with only a few of them focusing on rural areas. Namely, Whittington et al. [24] conducted a contingent valuation study in a village of Haiti, in order to estimate the potential social benefits (i.e., individuals’ WTP for improved water services) of a designed water supply project. Kaliba et al. [25] used a contingent valuation method in 30 villages in Central Tanzania in order to estimate the demand of local residents for improved water services. Bogale and Urgessa [26] employed a contingent valuation study in Haramaya District in Eastern Ethiopia in order to examine the willingness of rural households to pay for improved water service provision, as well as in order to identify the main determinants of this value. Arouna and Dabbert [27] also applied a double bounded dichotomous choice contingent valuation method that aimed to estimate households’ WTP to improve public water sources in rural Benin. It is interesting to note that most relevant studies indicate that WTP comprise a high percentage of income, often above 5% [28].
The objective of this paper is to estimate the WTP for improved water supply services and particularly, concerning the consumptive use of domestic water, in a transboundary rural area of the central West Africa (Mekrou River basin). To date there is no study applied at a transboundary rural area, examining the WTP of residents for improved water supply services in different countries. To evaluate this, a Contingent Valuation method was used. In addition, this study identifies and evaluates proportions and characteristics of the domestic water use in Mékrou River basin, as the economic status of the households has been approximated not exclusively by standard indexes such as income but with the inclusion of water-related standards of living, which can be treated as indirect wealth (income) constraints for water related WTP decisions. WTP values are therefore necessary but not sufficient to evaluate the holistic effect of environmental improvements.
The remainder of the paper is structured as follows. Section 2 describes the study area. This is followed by a description of the available data and the methodology used, that is, the structure and design of the contingent valuation survey (Section 3). Section 4 presents the results of the CV approach, presenting thus: (a) some qualitative results about domestic water use in the study area, (b) the key indicators of water-related poverty for the region and (c) the estimations of the econometric model employed in our empirical analysis. The paper concludes with a general discussion of the findings and the policy implications of this work.

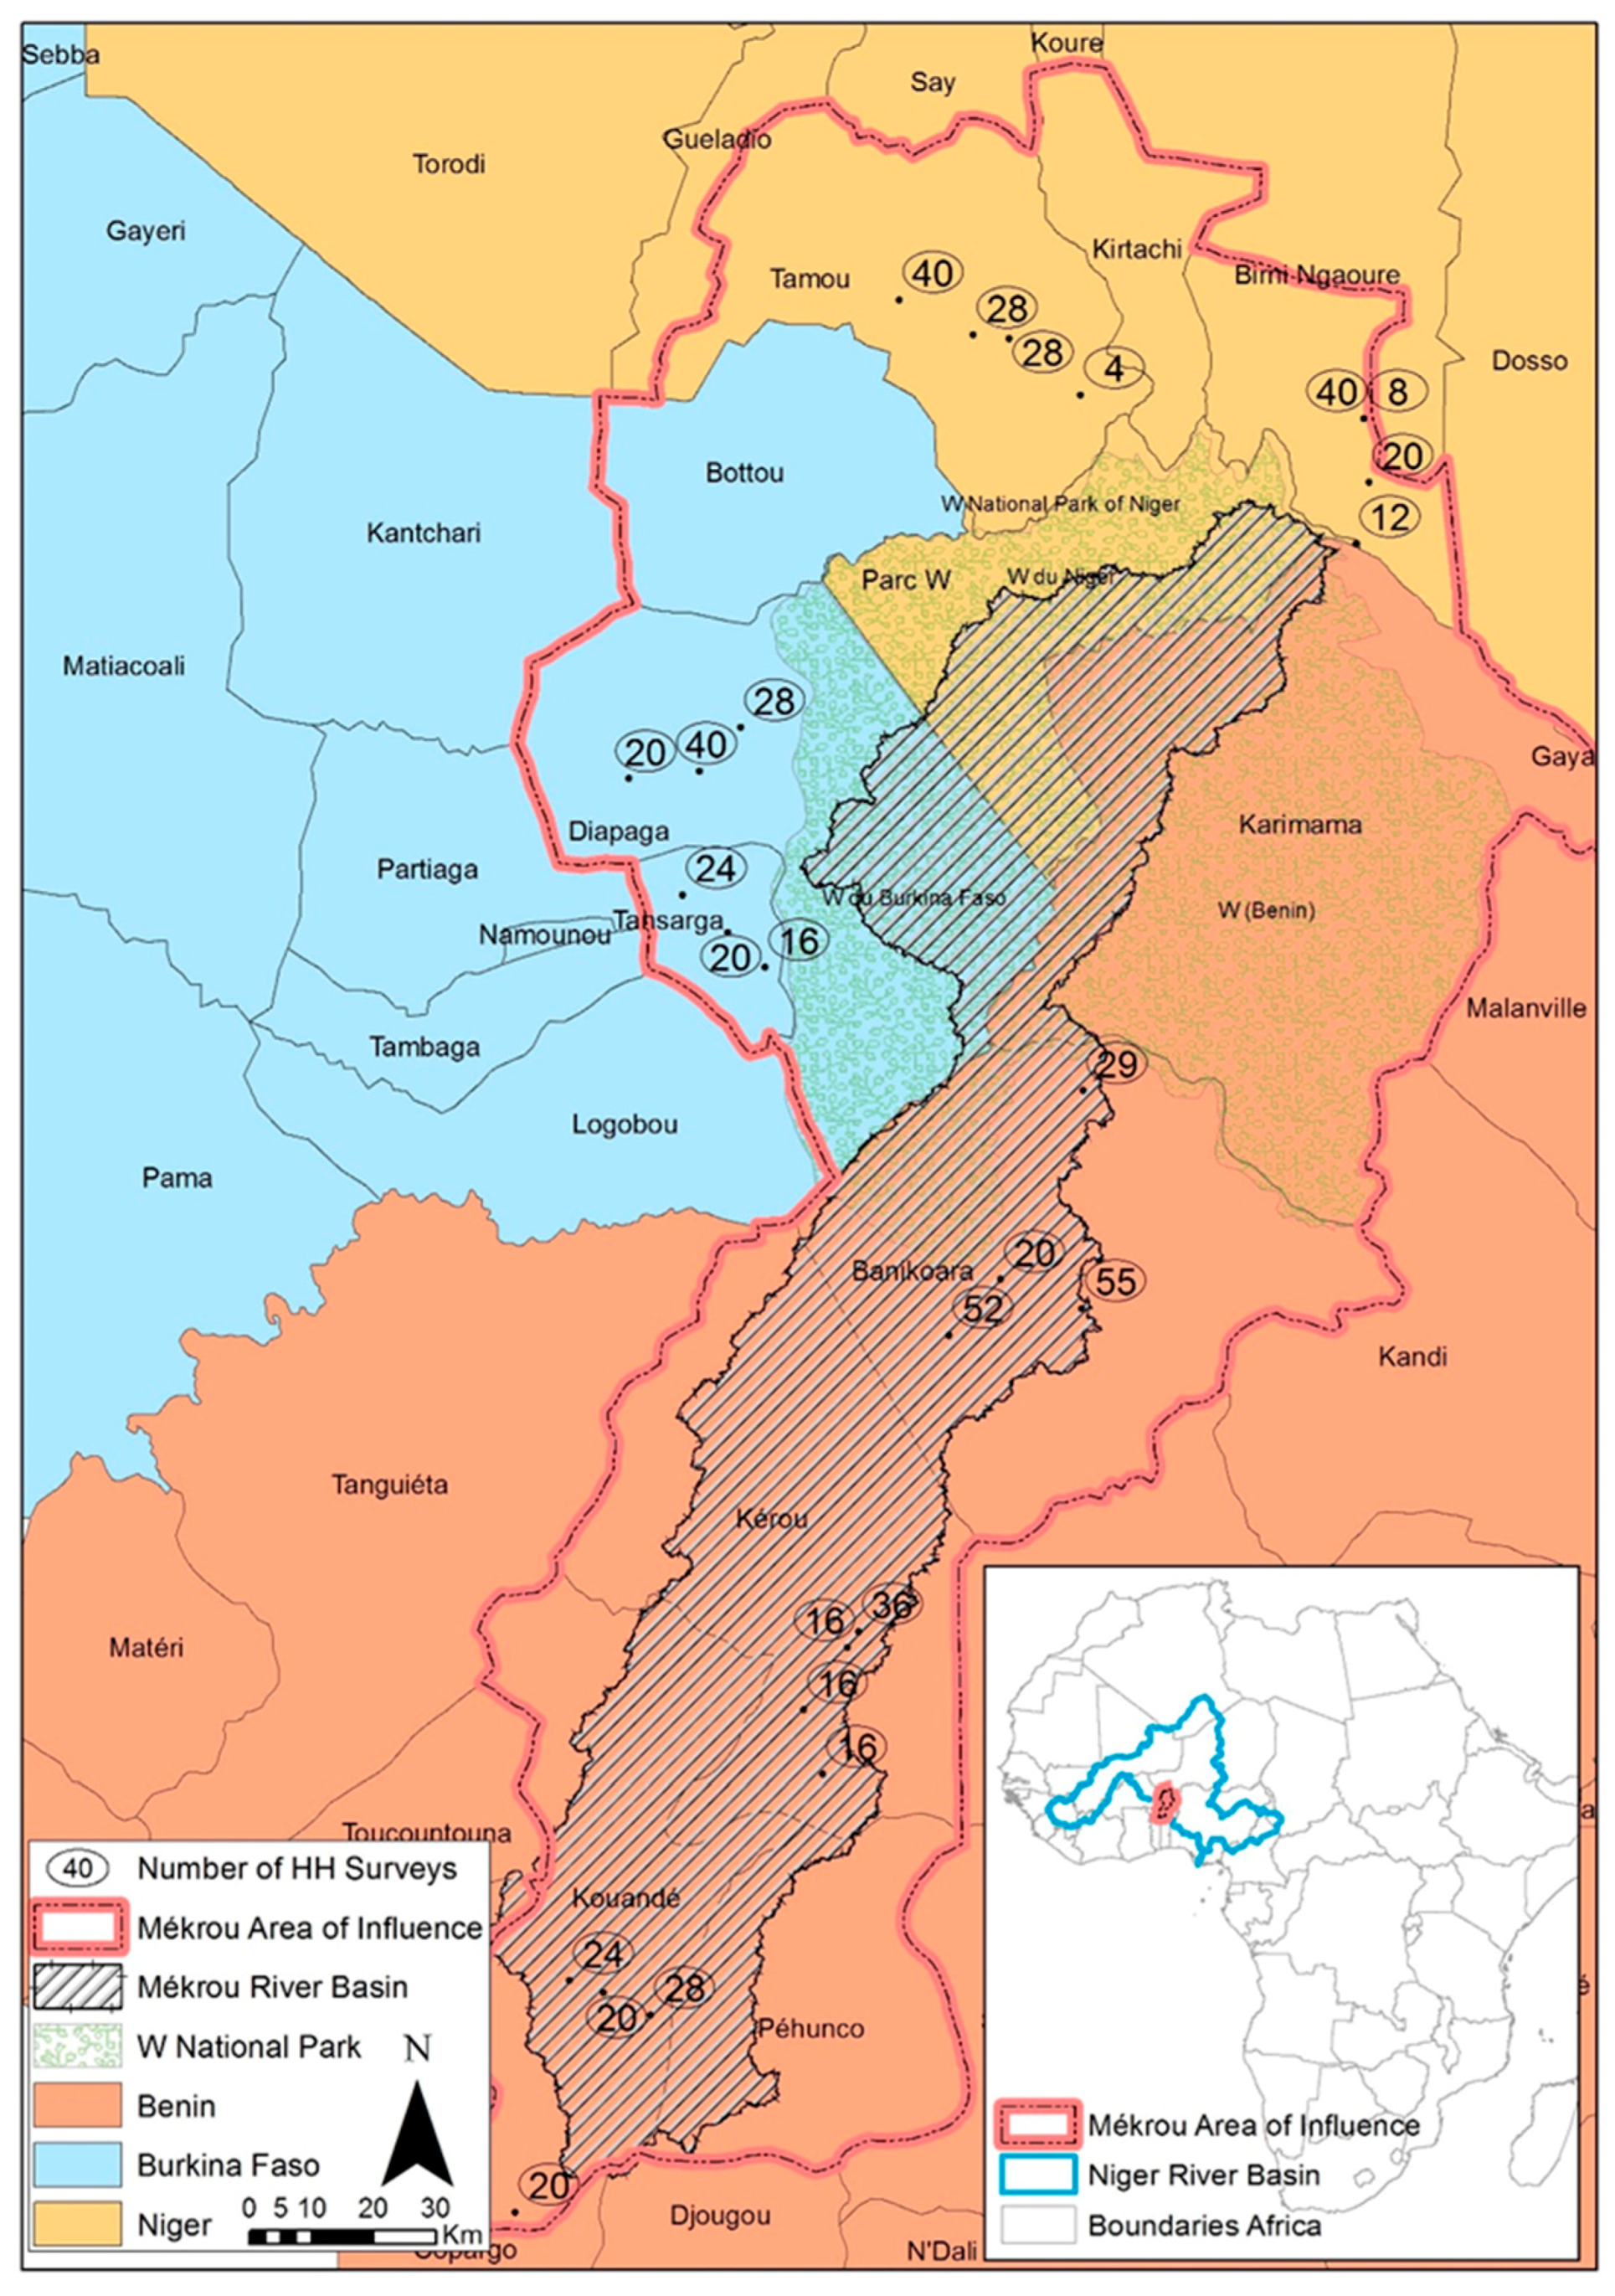
2. Study Area: The Mékrou River Basin

Mékrou is a sub-basin of the Niger River, covering an area of 10,635 km², about 3% of the total Niger Basin surface, crossing the borders of three countries: Benin (80% of the basin territory), Burkina Faso (10%) and Niger (10%). The population living in the Mekrou river basin and its area of influence is estimated around 1 million inhabitants, with an average growth of 3.8% per year [29]. Agriculture is the key sector of the economy in the three riparian countries and is critical for poverty alleviation and for food security. In the Mékrou River Basin, arable land is mainly used for food production and for cattle raising.
Vegetables, Maize, Manioc, Niebe and cotton are the dominant crops in the river basin. Rice production is concentrated in the in the confluence between Mekrou and Niger river. The cotton area is located mostly in Benin (in municipalities of Banikoara and Kerou) while Burkina Faso is where livestock breeding is most important. In fact, the northern part of the Mekrou river basin is affected by the seasonal “grande transhumance” of livestock coming from Burkina Faso and Niger to Benin during the dry season [29]. Transhumance transboundary paths exist but still the inadequate or inexistent signalisation/equipment of these paths often lead to conflicts between breeders and local farmers. In Benin, livestock is rather a complementary activity to crop production.
The water resources of the Mékrou River are used in several ways, such as domestic consumption, crop irrigation, animal production, fishing and fish farming and recreation. Due to water scarcity, local and transboundary conflicts often arise. Nevertheless, new transboundary cooperation approaches in water management are being established, which promote regional integration as growth driving.
The Mékrou River Basin also includes a very important transboundary natural park, the “W Park.” The W Park not only hosts unique examples of biological and geological processes but also includes natural areas that are critically important in terms of biodiversity and natural habitats. Water ecosystem services play an important role in the W Park.

3. Approach and Application of the Survey

The Contingent Valuation (CV) method, belonging to the stated preference methods, has been developed to value environmental goods that are not traded in markets [30] and is based on the assumption of standard economics that environmental assets and services can be treated identically to marketed goods for the purposes of valuation [31,32]. It is a survey-based approach that elicits people’s preferences directly, by using one of the following measures: willingness to pay (WTP) to obtain an environmental improvement or to avoid an environmental deterioration, or willingness to accept (WTA) compensation for relinquishing an environmental deterioration or to forgo an environmental improvement. CV presents to individuals a hypothetical market in which they have the opportunity to buy (WTP) or sell (WTA) the environmental good in question. People’s actions are contingent on the hypothetical situation described to them. Values, WTP or WTA, elicited through hypothetical market are assumed to be close to the value that would be revealed if an actual market existed [33,34]. A range of conceptual, empirical and practical issues is associated with the monetary estimations provided by CV. A great deal of dialogue addresses the use of CVM concerning possible biases, protest bids, free-riders and so forth [35]. However, CV remains the most mainstream economic method to estimate environmental goods and services, including water related services in developing countries.
The Mékrou River Basin study is based on the foundation of Contingent Valuation method. A household survey aimed at evaluating several water related issues, including ecosystem services, was designed in 2015 and conducted in early 2016 (February to April in cooperation with local universities from Benin, Niger and Burkina Faso). The information included in the household survey aims to retrieve opinions and preferences based on personal judgement. A main section of this survey was to estimate the value of improved domestic water supply services. After consultation with local partners from the three countries—a CV scenario securing domestic water provision has been developed. Households were asked to express their willingness to pay (a monthly fee) for ensuring 24 h access to good water quality (see Appendix A for the detailed questionnaire). As payment vehicle, a fee that will be collected by the local government bodies has been selected. Concerning the elicitation format of the payment question, an open-ended Payment Card (PC) approach was chosen, one of the most popular methods for eliciting WTP in environmental valuation. The respondents are presented with a series of ordered payment amounts, or bids and typically are asked to circle the maximum payment they would pay for the good under valuation. Before defining their maximum WTP value respondents have been asked if they would accept to contribute to the hypothetical valuation scenario, by simply stating “yes” or “no.” The main advantage of the PC approach, as compared to other methods, is that it can avoid “yea-saying,” where some respondents answer yes to any single bid amount presented to them [36]. In detail, the whole questionnaire is included in Appendix A.
The survey process resulted to the collection of 660 randomly surveyed questionnaires retrieved from the areas of the three countries (Benin, Burkina Faso and Niger) that are located in the Mékrou catchment (Figure 1). 332 questionnaires were collected in 16 villages from the municipalities (called “Communes” in French) of Banikoara, Kouande, Kerou, in Benin. 148 questionnaires were collected in 6 villages from the Communes of Diapaga and Tansarga in Burkina Faso, and 180 questionnaires were collected in 8 villages from the Communes of Falmey and Tamou in Niger. Regarding the surveying and sampling process, specific villages were selected to include a geographically representative sample of the river basin that belongs to the three countries (Benin, Burkina Faso and Niger). The selection process was designed to keep a balance between urban and rural settlements. The number of households proportionally represents the total population of the respective villages or towns selected, as well as it represents the country’s population within the basin. Since there were no available lists of households, the households were selected randomly based on their location in the village/town keeping a distance of five households between the interviewing ones. The survey was carried out by experts of the Joint Research Centre of the European Commission in cooperation with local universities from Benin, Niger and Burkina Faso. Interviews were conducted in person by a team of students supervised by a professor for each country. Before starting the survey, the students received training in which the questionnaire was thoroughly explained and discussed. Since the area is francophone, all the material used was written in French. The fact that the survey was conducted by students of local universities facilitated communication with the local population, overcoming possible language and cultural barriers. Prior to the conduction of the survey the survey country administrators have visited each selected village and informed the local authorities. This process secured the acceptance of the survey on the ground resulting to a 100% response rate. The detailed survey sample per village/country as well as the demographic and socioeconomic characteristics of the respondents are analytically presented in ANNEX A. The detailed Questionnaire (in French) is inserted in ANNEX B.
Following the data cleaning and validation of the survey, the information collected was processed through statistical analysis and econometric analysis. Regarding the later, the survey responses were analysed using descriptive statistics, aggregating data both at river basin and at country level. In this way, the findings were analysed at the river basin scale illustrating, at the same time, the differences among the three countries. Assessing consumptive use of water supply services, a thorough multi-variate regression among the stated value of domestic water supply and other covariates, such as socioeconomic characteristics of the population led to the construction of models that were used to identify the most significant variables that influence the value of domestic water provision services. Eventually, linear multivariate regression models were selected since they fitted the selected variables with a higher statistical performance. Moreover, in order to ensure coherence and readability of the models, only independent variables whose p-value was less than 0.05 were selected. Additionally, correlation was tested among the independent variables in order to avoid bias in the model due to collinearity among the selected variables.

4. Survey Analysis and Findings

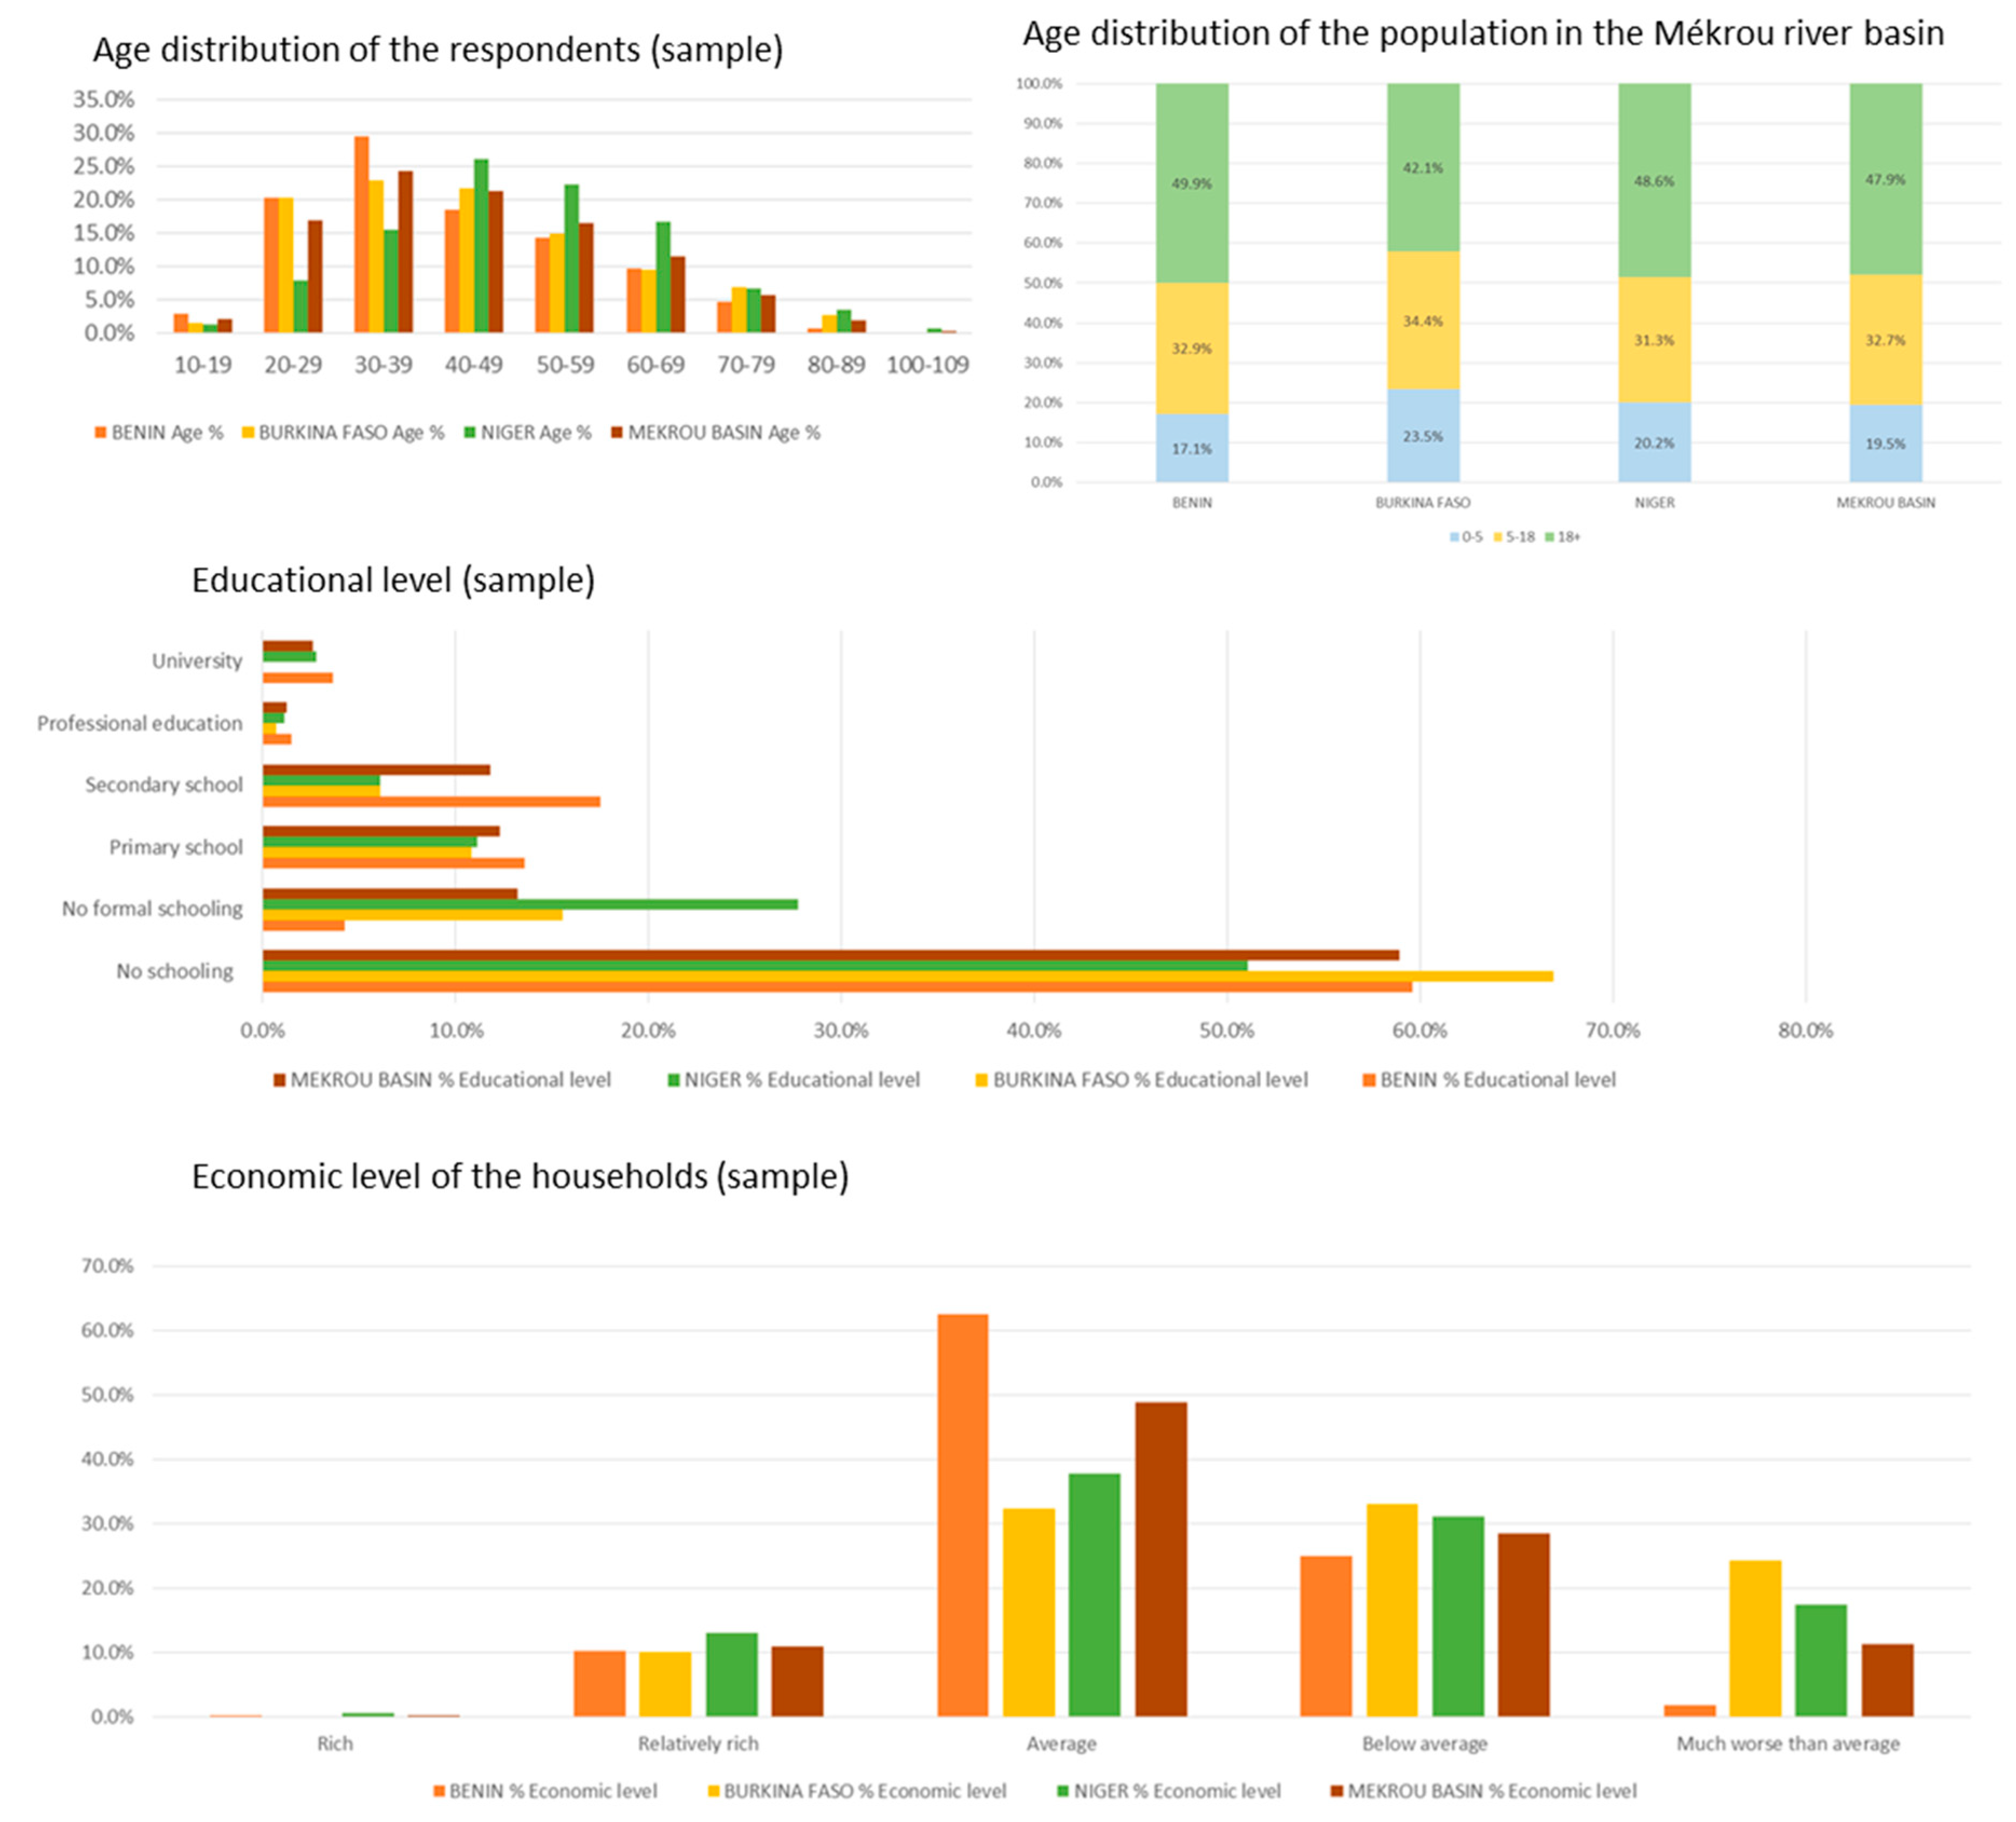
4.1. Sample Socio-Economic Characteristics

This section presents the main characteristics of the sample population including demographic features, income and living conditions (Figure 2). The majority of the respondents are from 20 to 59 years, with a decreasing rate from 60 to 109 years old. The youngest part of the population (below 20 years old) is also under represented because people under 18 years were excluded from the survey. The main difference between country samples is that the 40−49 age class is the most represented in Niger while for Burkina Faso and Benin, the 30−39 age class shows the highest rate. The age distribution of the Mékrou Basin population (survey estimation) reveals that the proportion of the younger part of the population (<18 years old) is similar in the three countries.
Regarding the educational level of the respondents, the majority never went to school at a rate of 59% in average in the Mékrou area, whereas only 12% in average went to primary school. The main difference is the relative high rate of respondents (17.5%) who went to high school in Benin, while in Burkina Faso and Niger, this rate reaches only 6%. Using an additional question to the household income, the respondents declared the level of their living conditions compared with the village population, where they are residents. More specific Beninese people with a rate of 62.5% considering themselves living according to the average village standards. In Burkina Faso and Niger, respectively 33% and 31% of the respondents were considering living in below average conditions.

4.2. Qualitative Evaluation of the Domestic Water Use

This section provides a qualitative evaluation of the domestic water use within the Mékrou river basin. In particular, it describes the domestic water use characteristics in the Mekrou basin such as connectivity and access to potable water, domestic water sources, expenses for potable water and means to improve water quality. It also describes the main households’ water related issues, according to the residents’ perceptions.
The access to piped water supply is very much below the national official averages (17.7% in Benin, 8.7% in Niger and 8% in Burkina Faso) that are already very low. In 2015, only 2.9% of the households in the Mekrou area of interest were connected to a water network (Table 1). Regarding, the bill paid by the few connected households, the average amount is higher in the Niger areas, with 11,000 FCFA paid in average, while the average amount is 4138 FCFA in Benin and only 2060 FCFA in Burkina Faso. The functioning of the water supply is considered as good in Niger and Burkina Faso with a functioning time above 17 h per day in Burkina and above 20 h per day in Niger. The water supply in Benin is more heterogeneous, with households getting supply from 1 h to 24 h per day (Table 1).
As shown in Table 2, the most common source of domestic water in the Mékrou basin are wells More than 37% of the respondents use tube-well or borehole and almost as much (36.5%) use traditional not protected wells. Although wells are the most common source of domestic water all over the basin, there are significant differences among the three countries. For example, in Benin, the percentage of people, who rely on traditional wells, is much higher (44.6%) and it is by far the highest in the basin. It is also the only country, where households have responded that they use surface water as a domestic water source, though in a small percentage (4.2%). In Burkina Faso, the vast majority (60.8%) relies on tube-well or borehole and another significant part (27.7%) on traditional wells. There is a slightly different picture in Niger, where the percentage of households getting water from public taps or standpipes is the highest in the whole basin (19.4%).
According to the FAO definition, one person has access to potable water if the distance of the source from that person’s house is less than 300 m. According to this definition, the majority of the respondents (59.8%) had stated that they have access to potable water (Table 3). In Burkina Faso however, less than one third of respondents (32.4%) answered that the water source lies within 300 m from their residence. It is also the country, with the higher households’ distance from their water source. Namely, the mean distance in Burkina Faso (712.44 m) is almost double the respective in the other two countries (375.25 m in Benin and 312.19 m in Niger). Benin presents the shortest distance to water source, most likely because of the number of people having a water source within their terrain. It is also the country with the highest percentage of people with access to potable water according to the FAO definition (68%).
Similar conclusions derive from the analysis of the responses on the time needed to go from the house to the water source and return to their house (Table 3). From the three countries, Niger is again the one with the most favourable responses. The vast majority (70.4%) reported that they need less than half an hour to get to the water source and return. If considering the number of people who can achieve that within one hour, the percentage raises to 92.7%. The situation in Benin looks better than in Burkina Faso, where the average time needed is almost 78 min corresponding to almost three times the average value of the other two countries (approx. 21 min Niger and 27 min in Benin).
Regarding water cleaning techniques, most of the people throughout the basin (89.07%) do not use any technique to improve the quality of the water (Table 4). This rate is even higher in Benin (93.05%) and below the average in Burkina Faso (87%) and Niger (82%). Out of the respondents who reported to use such a technique, the mostly used ones are those of: (a) filtering through linen, (b) adding bleach and (c) using water tablets.
Dirty water, is the main problem of domestic water provision (Table 5) being stated as the most frequent reply (39.1%) in the basin, except in Niger, where a higher percentage (37.2%) considers irregular water supply rather than dirty water (30.6%). In Burkina Faso, irregular water supply had the lowest percentage (14.9%) among the three countries. There is finally 28.6% of people throughout the basin, who consider that there is no issue with the water supply. In details, this percentage is slightly lower for Niger with a rate of 23.9% and higher for Benin (30%) and Burkina Faso (31.1%).
Daily water consumption and expenses per household are two important variants estimated with the household survey. The daily water consumption varies significantly between the countries (Table 6). The average consumption in Mékrou Basin (290.27 L) is quite similar to the consumption in the regions of Burkina Faso (286.39 L). On the other hand, Beninese’ households consume about 18% less than the study area average, whereas in Niger the consumption is 36% higher than Mékrou Basin average. Concerning the per capita water consumption, it was found about 21.5 L per day in the whole Mékrou basin. This estimate varies across countries, ranging from 19.5 L per day (Benin) up to 23.4 L. Per day (Burkina Faso). Table 6 also presents the household expenses for domestic water consumption. According to these results, the residents of Niger seem to have the highest expenses for domestic water, (mean value = 109.55 FCFA), which correspond to more than 30% higher costs than the basin-wide average. In contrast, Benin is the country with the lowest mean annual expenses (72 FCFA).
In regard to the main water provision problem, the local households state that the most important one (58.9%) is the “insufficient water during the dry period” (Table 7). This is a shared view across the basin, although this is perceived as more important in Benin (72%) than in Niger (47%) and Burkina Faso (44%). Another popular response in Burkina Faso was that the Mékrou River is too remote for domestic water supply (21%). In Niger and Benin, the number of water users was identified as an important problem. Less frequently identified problems included: poor water management or allocation practices (in all countries), broken pipes (in Burkina Faso and Niger) and deforestation leading to decreased underground reservoirs (mainly in Benin and to a lower degree in Niger). Finally, an interesting finding is that the “lack of transboundary cooperation” was the least popular answer.

4.3. Water-Poverty Relationship

This sub-section investigates the link between poverty and domestic water services directly, by examining some relevant factors, such as connection in the water network, sources of provided domestic water, distance and time to get the water and so forth. The focus is on relating households’ welfare statuses to their actual (domestic) water services. Towards this, the analysis explores water-poverty indicators, which are specific for the study area. A multinomial logistic model has been applied to predict household wealth status by a number of factors, including several water-related indicators. The dependent value of interest was household monthly income, which was converted into dollars of equivalent purchasing power parity (PPP) (constant 2014 prices). The monthly income was categorized into three groups with cut-off points at the 33rd and 67th percentiles of income: (a) less than $60 (poor households), (b) from $61 up to $220 (average income households) and (c) higher than $220 (higher income households). These categories were coded as follows: “0” = poor (lower income) households (reference category), “1” = average households and “2” = higher income households. The independent variable includes a total of 11 potential wealth/poverty related indicators (8 categorical variables and 3 covariates/continuous variables). It includes the following (domestic) water indicators: (a) Main water source (Improved/not improved), (b) Access to potable water (Yes/No), (b) Connection to water network (Yes/No), (c) Households with water supply problems (Yes/No), (d) Households with water quality problems (Yes/No), (e) Type of sanitation facilities (improved/not improved), (f) daily household consumption (litres), (g) distance (in meters) that separate the household from the main source of drinking water, (h) Connection to Electricity network (Yes/No).
A stepwise multinomial regression model, with a significance threshold of 0.05 for adding variables and an insignificance threshold of 0.1 for removing variables was used to select the potential wealth/poverty factors. The model will test each one of these factors and proceed by adding the next most significant factor until all the significant parameters are included in the model. The statistical analysis was conducted using the IBM-SPSS Statistics v. 20.0 statistical package (IBM Corporation, Somers, NY, USA). The following conclusions can be extracted from Table 8:
  • Poor households differ significantly from average (and higher income) households with respect to employment status of the respondent. Respondents who are employed are 2.5 time more likely to be in the “average income group” versus the “lower income group” (this probability is even higher −3.5 time more likely—when comparing the higher income group with the lower income group).
  • Households that are not connected with the electricity network are less likely to be in the average (and respectively in the higher) income group than in the lower income group.
  • Concerning the factors related to the domestic water services it is interesting to note that only two of them (access to safe drinking water and to basic sanitation) seem to differ significantly among income categories. Specifically, households with access to potable water (i.e., according to FAO definition) were found to be more likely in the average and higher income households than in the lower income ones. In addition, households with improved sanitation facilities are more likely to be in the upper two income categories rather than in the lower income category. Therefore, it can be concluded that all the other water-related factors are not identified as significant (robust) poverty factors indicating that households’ welfare in the study area cannot be clearly determined from other water factors than the ones mentioned above. This conclusion may be of some importance in the contingent valuation analysis that follows.

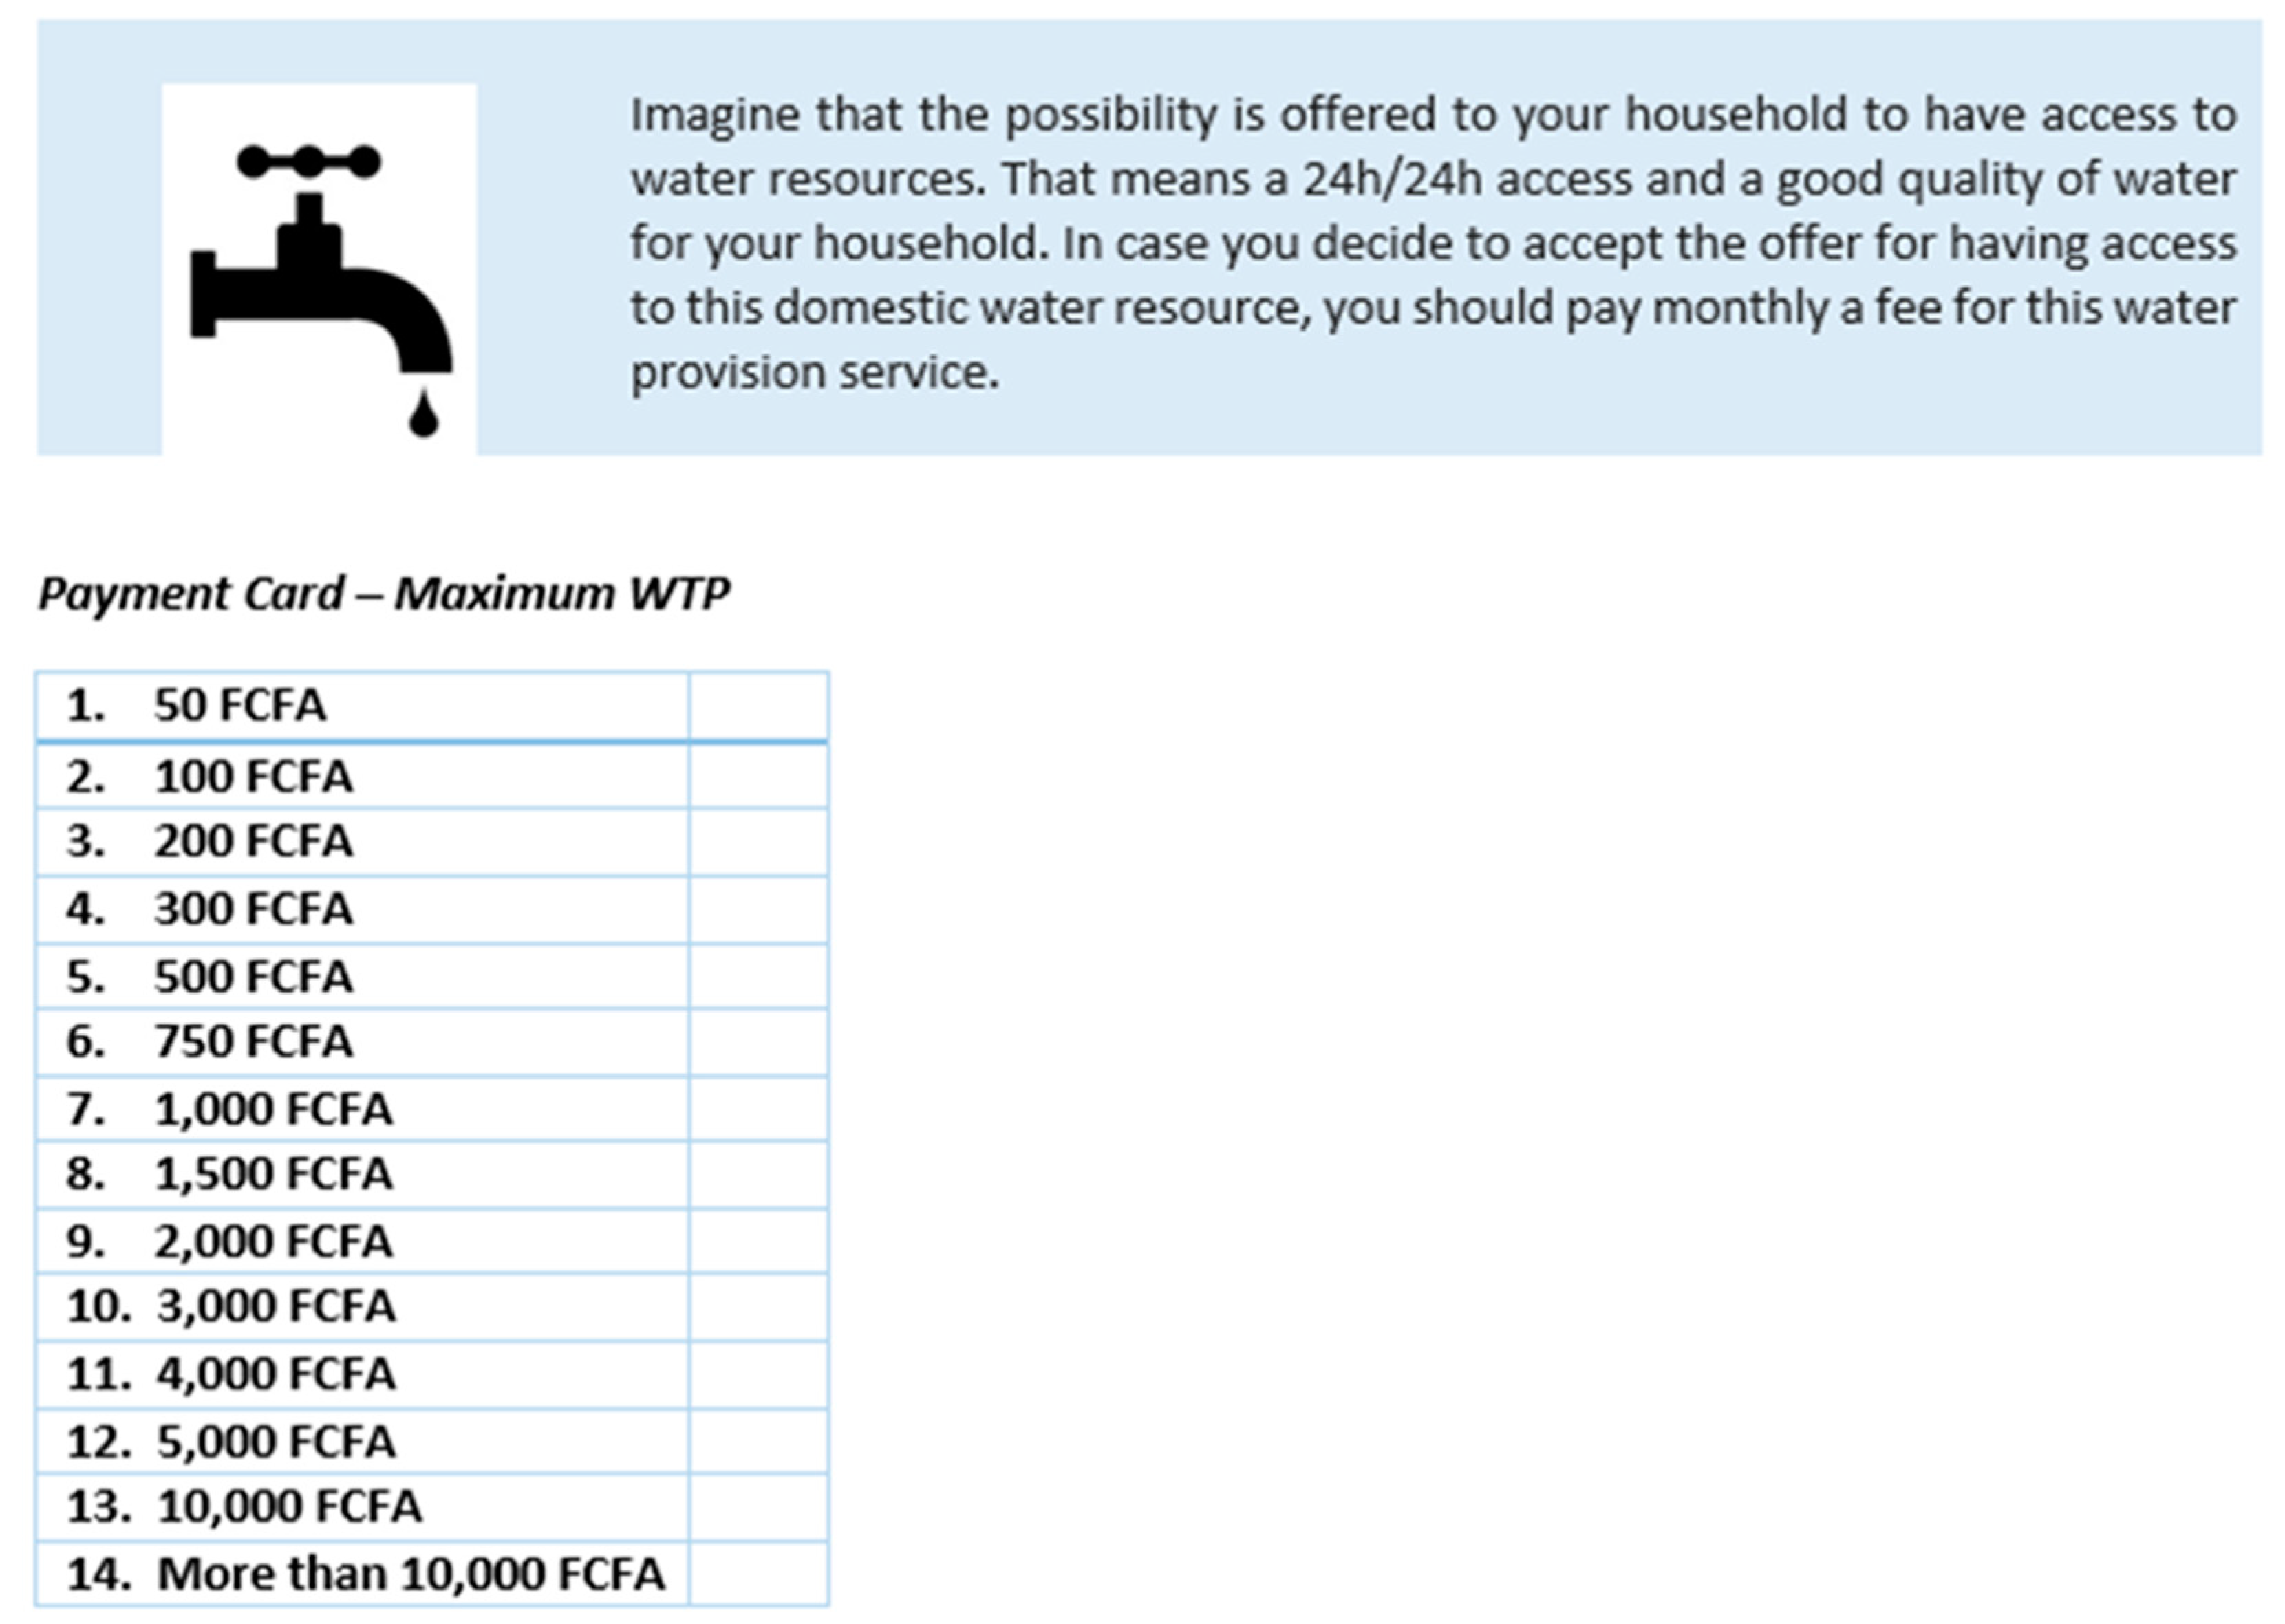
4.4. Contingent Valuation Scenario

Given the high importance of the domestic water use in Mékrou River Basin, the survey included a Contingent Valuation scenario for estimating the WTP value for domestic water provision network in Mékrou river basin. Under this scenario, the residents of the selected areas were asked to state their maximum (household) monthly fee for a 24 h/day domestic water provision service, by selecting specific payments from a payment card (Figure 3).
According to the results of this valuation scenario, it can be concluded that there is a wide consensus, throughout the basin, that people would be willing to pay to have sufficient and clean water for their household. More than 90% of respondents would be willing to pay for such commodity (Table 9), which is a very high percentage, especially for the case of low-income countries. When looking at the people who responded negatively to this question, the lowest rate is in Burkina Faso (5.4%). Benin shows a value similar to the basin average (7.5%), while in Niger 12% of respondents rejected the payment scenario. Analysing the negative responses, the majority of the respondents in all three countries stated insufficient financial resources as the main reason for rejecting the payment, while only a few of them stated that “the government should pay.” Protest votes (i.e., those who stated that the government and/or the wealthier households should pay for this project) were excluded from the sample since they indicate an opposition to the valuation scenario.
Following Cameron and Huppert [37], the response is interpreted not as an exact statement of WTP but rather as an indication that the WTP lies somewhere between the chosen value and the next larger value above it on the payment card. Therefore, the amount selected from the payment card by the respondents reflects the maximum bound of an interval into which the true WTP is to lie. The lower bound of this interval is the next lower amount on the payment card. For example, if a respondent selected maximum 500 FCFA, then the lower bound of his WTP is 300 FCFA.
The survey estimates that the average maximum WTP per household and per month is 2089 FCFA (3.18 euro), whereas the average minimum WTP is 1532 FCFA (2.34 euro) (Table 10). The maximum and minimum WTP amount is almost 10% higher in Burkina Faso and around 5% lower in Niger.
Additional to this statistical analysis of the maximum and minimum WTP for a 24/24 h water service, the aggregated WTP has been estimated for the whole Mékrou river basin. The computation takes into account the actual or most convenient population numbers of selected interviewed Communes. Such aggregate WTP estimations are revealing a macroeconomic calculation of the value of providing direct domestic drinking water network services, based on the assumption that the surveyed sample is representative of the actual population. The actual population of the surveyed Communes (Banikoara, Kérou, Kouandé, Tansarga, Diapaga, Tamou and Falmey) is of 547,668 inhabitants. From the analysis of the socioeconomic characteristics of Mékrou, inhabitants (survey estimates) the average number of persons per household is estimated at 13.49 persons. Based on these numbers and on the WTP estimations, an aggregated WTP can be computed for the whole Mékrou Basin, as well as for each country’s part in the Basin. Table 11 indicates a monthly aggregate WTP that lies between 94,822 € (lower bound estimate) and 129,296 € (upper bound estimate). This aggregate measure provides an indicative estimate of the money that could be mobilized from the population living in the river basin to setup/improve a water service.
However, it should be noted that the aggregated WTP values must be taken with caution as: (i) they do not represent actual market values and, (ii) these values reflect the preferences of the local population at a specific moment in time. On the other, as in most of the environmental valuation experiments, such estimates may provide a useful and indicative basis for local policy makers to implement measures and/or to encourage investments that will be able to improve the domestic water services.

4.5. The Determinants of WTP

There are two main statistical methods to calculate the WTP values elicited from a Payment Card. The first and simpler approach is to use Ordinary Least Squared estimation by assuming the independent variable (true WTP value) is the middle point of the interval. The second one is to use an interval regression, which is the more prevalent method with more flexible distribution assumption of WTP values in each interval [38], We used the second approach (Interval data model), on the basis of a generalized Tobit model (i.e., a censored model where each interval is taken as being censored on both sides) that employs a log-likelihood function. The Willingness to Pay responses were treated in a parametric model, where the WTP value chosen by each respondent (i) was specified as:
WTP i * = X i · β + ε i
where X i is a vector of explanatory variables and ε i is the error term following a normal distribution with mean zero and standard deviation σ. When considering the interval data model, the contribution of each response to the likelihood function is given by the probability that the latent WTP value falls within the chosen interval (lower bound of WTP-upper bound of WTP). Calculations were performed using GRETL (GNU Regression, Econometrics and Time-series Library, vers. 1.10) econometric software. Table 12 reports the estimation results for the whole sample (Mékrou Basin). On the 514 valid responses, a total of 18 true zero WTP values were treated as uncensored observations, 16 were considered as right censored (at 10.000 FCFA), while the remaining 480 were treated as interval observations.
Several independent variables from the survey have been initially selected that theoretically could influence the WTP of the respondents. After executing several regressions an interval regression model has been set up including those independent variables that have a high statistical significance (also including the two water-poverty indicators presented in Section 4.3). Therefore, WTP was specified as a function of monthly household income, access to water, connection to electricity, type of sanitation, education, family size (number of children) and country of origin. The results of the WTP regression model are presented in Table 12. The log likelihood χ2 statistic shows that, taken jointly the coefficients in the interval data model are significant at the 1% level.
In relation to the explanatory factors, household income was found, as expected, to have a significant and positive effect on willingness to pay. Connection to electricity and type of sanitation (improved or not improved type), which are both wealth indicators, were also found to have significant and positive effect on WTP. On the other hand, the main water-poverty indicator (as found in Section 4.3), that is, respondents’ access to water, was not found to have any statistically significant impact on people’s WTP. Highly educated respondents seem to have a higher WTP but significance (at the 10% level) is marginally not achieved. Additionally, a strong effect (as already described in Section 4.4Table 11) has been found between WTP and the country of respondents since the residents of Niger (keeping all other factors constant) are supposed to pay less than the residents of Benin, who in turn are supposed to pay less than the residents of Burkina Faso.
Based on this model and using the average values of the independent variables, the estimated WTP is 2.81 € per household per month (1850.2 FCFA), which is in line with the minimum and maximum WTP average of the sample values. Similar to the Aggregated WTP values in the previous section, the aggregated monthly WTP for the surveyed Communes of Mékrou Basin is 114,080 €.

5. Discussion and Conclusions

Currently, the domestic water in the Mékrou area originates mostly from not protected sources (37% of households are using tube-wells or boreholes and 36.5% traditional wells), while only 11.2% use protected dug wells. The vast majority of the households not only use unsafe sources but additionally they do not use (89%) any means to clean and hence improve, the domestic water. Only 5.2% filter it through linen, 2.1% add bleach and 1.8% use water tablets. This is a factor that often results to health related problems, with diarrhoea incidences in children up to five years old being among the most frequent ones (27.3% of them have faced diarrhoea during the past two weeks).
Furthermore, the access to the water sources often is problematic since they are mostly located outside the house or terrain (85.5%), with 59.8% of households having access to a domestic water source in a distance less than 300 m (32.4% in Burkina Faso). In average households are located 432.93 m away from the main domestic water source and their residents need in average 36 min to get the water (78 min in Burkina Faso). Regarding water consumption, the households consume in average 290 L of water per day corresponding to 21.5 L per person, whereas they pay in average 2543 FCFA per month.
39% of the residents consider colour and smell as the main domestic water problem, followed by irregular water supply (26%), while 29% of them consider that there is no problem in domestic water provision. In parallel 60% of the area’s residents denote that the insufficient water quantity during the rainy season is the main Mékrou water provision related issue. The majority of the households (more than 82%) do not have any sanitation facilities. Only 10.2% have a pit latrine with slab, 2.1% composting toilet and 1.8% ventilated improved pit latrine.
The households stated that they are willing to pay 1850.2 FCFA per month (2.81 €/month), which aggregates to a total of 114,080 €/month for securing 24 h/day sufficient water provision. The WTP is less than the actual payment for domestic water (Table 6) representing the income constraints to pay for drinking water. This result is coupled by the findings that the value of domestic water provision is significantly influenced by poverty. The low WTP for domestic water, often occurring in developing countries, highlights the challenges for cost efficient water infrastructure and the necessity of subsidies in funding water provision for poorest.
It should be noted that contrary to previous studies (e.g., [26]), WTP was not motivated by water-related factors (e.g., time spent to fetch water, water treatment practices, quality of water, expenditure on water) other than the type of sanitation. It is also important to note that WTP is not even sensitive to residents’ access to water, despite the fact that this indicator was found as the most important predictor of wealth/poverty in the study area. A possible explanation for this outcome is that income effect seems to dominate over the actual water services’ level. On the other hand, our results are in line with other studies (e.g., [24]) that underlined the importance of wealth factors on the WTP for better domestic water supply services.
This finding is of serious implication both in methodological and policy terms. First, the WTP values, although of significant importance for indicating certain welfare outcomes induced by improved water provision, cannot be the sole guide for designing effective policies to service basic needs of humans. Constrains imposed by income and wealth status requires a careful interpretation of WTP values to reflect the aggregate social welfare outcomes. Especially in conditions of extreme poverty WTP, values are seriously constrained and therefore, additional welfare considerations ought to be undertaken. Hence, the benefits to society arising from improved water facilities may be well above those reflected by the estimated WTP values. Within the monetary domain in conditions of extreme poverty, a reasonable interpretation is to consider the WTP values of above the average level of standards of life, as representative for the whole population.
Further regarding the methodological approach of this work, the household survey data analysis could provide an integrated assessment of domestic water use, especially in cases such the Mékrou River Basin, where access to reliable information is very limited. The survey approach could provide data at household level that could be used for a detailed qualitative and quantitative assessment of designing policies and infrastructure for domestic water. Potential limitations of the survey approach are mainly the information biases and misperceptions of personal opinions in a specific timeframe. To limit such misperceptions the survey should be periodically repeated to better validate the findings, a process that requires increased financial and human resources. In developing countries where information is limited, such an approach could integrate local characteristics and perceptions into sustainable domestic water policies that include the poorest part of the population.

Author Contributions

V.M., C.D., M.N. and C.C.M. designed the survey, applied the survey and collected the data. V.M., C.D., D.L. and K.B. analysed the data and performed the econometric analysis, V.M., D.L. K.B., G.T. and C.D. wrote the paper.

Funding

Funded by the European Commission, DG DEVCO Project “Water for Growth and Poverty Reduction in the Mékrou”.

Acknowledgments

This work is a part of the “Water for Growth and Poverty Reduction in the Mékrou” project funded by the European Commission. This project is jointly implemented by Joint Research Centre (JRC) and by the Global Water Partnership (GWP). The household survey referred to in this article was designed and implemented by the JRC and local universities from Benin, Niger and Burkina Faso. Karidia Sanon from the University of the Ouagadougou (Burkina Faso) was the head of the Burkina Faso team as well as the general coordinator of the three African field teams. Euloge Agbossou and Yèkambèssoun N’Tcha M’Po from the National Water Institute (INAE) coordinated the Benin team and Boureima Ousmane from the University Abdou Moumouni de Niamey was the head of the Niger team.

Conflicts of Interest

The authors declare no conflict of interest.

Appendix A

Sample and Population of the Survey Area
Population of the Mékrou Area of Interest
BeninBurkina FasoNigerTotal area
294,92179,632173,115547,668
Surveyed Sample (Households)
BeninBurkina FasoNigerTotal area
332148180660
Sample (number of households) by selected Communes
BeninBurkina FasoNiger
BanikoraraKérouKouandéDiapagaTansagraTamouBirni Ngaoure
1608092955310080
Population and Sample (number of households) by Selected Village/town
Banikoara
SampétoGbéniki (Kérémou)WangouwirouBanikoara (town)Total
Population1522786379928,40232,987
Sample29205252153
Kouande
Béket BouramèMekrougourouGoufanrouKouandé (town)Total
Population18762635183520,72327,069
Sample2027202592
Kérou
Koussou OuinraYakrigourouBipotokéKérou (town)Total
Population28422766287134,24642,725
Sample1619163687
Diapaga
MangouTyagaDiapaga (town)Total
Population1600113616,00018,736
Sample28204088
Tansagra
KotchariLadaTansarga (town)Total
Population102472014,00015,744
Sample20162460
Birni Ngaoure
BoumbaFono BirguiKotakiFlamey Djema (town)Total
Population1414560244744678888
Sample128204080
Tamou
TankouneDiney BangouFoulan WalagorouTamou (town)Total
Population82772426118273639
Sample2828440100
Socioeconomic Characteristics of the Surveyed Sample
Age (Sample Respondents)
Benin Burkina Faso Niger Total Area
MeanStdDevMeanStdDevMeanStdDevMeanStdDev
41.214.944.216.249.515.344.215.7
Age Distribution (Total Area Population Based on Survey Aggregation)
BeninBurkina FasoNigerTotal Area
0-517.10%23.50%20.20%19.50%
5-1832.90%34.40%31.30%32.70%
18+49.90%42.10%48.60%47.90%
Gender (Sample Respondents)
BeninBurkina FasoNigerTotal Area
Count%Count%Count%Count%
Male22668.1%9564.2%12971.7%45068.2%
Fenale10631.9%5335.8%5128.3%21031.8%
Education (Sample Respondents)
No schoolingNo formal schoolingPrimary schoolSecondary schoolProfessional educationUniversity
Count389878178817
%58.90%13.20%12.30%11.80%1.20%2.60%
Profession (Sample Respondents)
UnemployedSelf epmployedpublic employeeFarmerLivestock farmerOther
%7.70%18.90%2.30%50.10%15.90%5.10%
Household Income [FCFA per month] 1 euro = 656 FCFA (Sample Respondents)
0–25,00025,001–50,00050,001–75,00075,001–100,000more than 100,001I don’t know
Count2001007737414121
%30.50%15.20%11.70%5.60%18.60%18.40%

Appendix B

Questionnaire
Water 10 01232 i001
Water 10 01232 i002
Questionnaire No:
Date:
Lieu de collecte du questionnaire (pays): ________________________
Village: ____________________________________
Coordonnées GPS:
(x) Longitude: ________________________ (y) Latitude:________________________
Nom de l’enquêteur____________________________
Nom du superviseur____________________________
(A remplir avant de commencer le questionnaire)
Bonjour. Je m’appelle _______________________________________. Je travaille pour<___________>.
Nous effectuons une enquête sur les ménages vivant dans le bassin de la Mékrou. Cette enquête des ménages fait partie du Project de coopération “Mékrou,” a laquelle les gouvernements/autorités de gestion du Benin, du Niger et du Burkina Faso, participent en collaboration avec le partenariat de l’Eau (GWP) et le centre commun de recherche (CCR). Ce projet a pour objectif d’améliorer la planification et la gestion des eaux de la rivière Mékrou et ainsi, d’améliorer les conditions de vie de la population locale dans les 3 pays concernés par ce bassin versant. Les informations collectées à travers de ce questionnaire sont confidentielles seront uniquement utilisées par les analystes du projet Mékrou pour développer des plans de gestion plus efficaces sur ce bassin versant.
Les informations que nous collectons, nous aideront à mieux gérer la ressource en eau. Votre ménage a été sélectionné pour cette enquête. Nous voudrions vous poser quelques questions concernant votre foyer. Accepteriez-vous de répondre à nos questions, cela prend habituellement entre 90 et 120 min. Toutes les informations que vous nous communiquerez sont strictement confidentielles et ne seront pas transmises à quiconque à l’exception de l’équipe e d’enquête.
Vous n’êtes pas obligé de participer à cette enquête, cependant nous comptons vivement sur votre participation car votre opinion est très importante. De plus, si une question ne vous convient pas, dites-le moi et je passerai à la question suivante. Enfin, vous pouvez également interrompre l’interview à n’importe quel moment.
I: CARACTERISTIQUES SOCIO ECONOMIQUES
1.1: Caractéristiques Sociaux
1. Nom du pays  
2. Nom de la région  
3. Nom du département  
4. Nom de la commune  
5. Nom du Village  
6. Nom du quartier  
7. Nombre d’années de résidence dans ce village   
1. Localisation de votre foyer
2. Age du répondant: ______ ans
3. Sexe du répondant
1. Masculin
2. Feminin  
4. Situation:
1. Célibataire
2. Mari造 
3. Veuf/Veuve  
5. Lien avec le chef du foyer:
1. chef de foyer
2. Enfant du chef de foyer  
3. Epouse du chef de foyer  
4. Frère ou sœur du chef de foyer  
5. Père ou mère du chef de foyer  
6. Grand-père ou grand-mère du chef de foyer  
7. Petit-fils ou petite-fille du chef de foyer  
8. Cousin ou cousine du chef de foyer  
9. autre parenté  
10. sans lien de parenté  
6. Quel est votre niveau d’étude et/ou diplôme le plus élevé?
1. non scolarise
2. scolarisation non formelle  
3. Ecole primaire  
4. Lycée  
5. Formation professionnelle  
6. Université  
7. Quel est votre emploi? (plusieurs réponses possibles)
1. Sans emploi/mère au foyer
2. Auto-entrepreneur/Indépendant   
3. Employé public   
4. Employé dans le privé   
5. Ouvrier/specifier   
6. Agriculteur (céréalier/maraîcher)   
7. Eleveur   
8. Etudiant   
9. Retraité   
10. Autre, specifier:   
8. Listez le nombre de personnes inclus dans votre foyer par âge
1. Nombre total de personnes dans votre foyer
2. dont enfants de moins de 5 ans (strictement)  
3. dont enfants 5 ans et plus (moins de 18 ans)   
4. dont adultes (plus de 18 ans)  
1.2: Variables Économiques
9. Combien de personnes de votre foyer, vous inclus, a un revenu (quelque ’il soit)?
1. Nombre d’hommes ayant un revenu
2. Nombre de femmes ayant un revenu  
10. Indiquez la tranche de revenu qui correspond au REVENU MENSUEL TOTAL de tous les membres de votre foyer, vous inclus?
1. 0–25,000 FCFA par mois
2. 25,001–50,000 FCFA par mois  
3. 50,001–75,000 FCFA par mois  
4. 75,001–100,000 FCFA par mois  
5. 100,001–125,000 FCFA par mois  
6. 125,001–150,000 FCFA par mois  
7. 150,001–200,000 FCFA par mois  
8. 200,001–300,000 FCFA par mois  
9. 300,001–500,000 FCFA par mois  
10. 500,001–700,000 FCFA par mois  
11. 700,001–1,000,000 FCFA par mois  
12. Plus de 1,000,001 FCFA par mois  
13. Je ne sais pas  
11. Type de odgement actuel?
1. Appartement dans un immeuble, Studio
2. Chambre   
3. Case traditionnelle isolée ou dans une concession  
4. Maison individuelle de type traditionnel  
5. Maison moderne  
6. Autre  
12. Propriété de votre logement: (sélectionnez 1 option)—Montrez les options
1. Propriétaire
2. Location  
3. Logement chez un proche  
4. Logement fourni par l’employeur  
5. Usufruit, odgement gratuit  
6. Autre, préciser  
13. Votre foyer est-il connecté au réseau électrique?
1. Connecté au eseau électrique
2. Pas connecté au réseau électrique  
14. Si connecté, quel est le montant de la facture d’électricité du mois dernier (FCFA)?__________
15. Si connecté, nombre d’heures par jour pendant lesquelles vous avez eu de l’électricité?_______
16. Le foyer est-il connecté au réseau d’eau?
1. Connecté au eseau d’eau
2. Pas connecté au réseau d’eau  
17. Si connecté, quel est le montant de la facture d’eau du mois dernier (FCFA)?_________
18. Si connecté, nombre d’heures par jour pendant lesquelles vous avez accès à l’eau du réseau?_______
19. Comment caractérisez-vous le niveau économique de votre foyer en comparaison avec le niveau de vie de votre village?
1. Aisé/riche
2. Relativement aisé  
3. Moyen  
4. Moyenne basse  
5. Bien en dessous de la moyenne  
III-Usage de l’eau par les ménages
20. D’où provient principalement l’eau que boivent les membres de votre foyer? (1 reponse)
Sources d’approvisionnement améliorées en eau
1. Eau du robinet dans le domicile  
2. Eau du robinet dans la cour ou sur la parcelle  
3. Borne-fontaine/fontaine  
4. Puits tubé/puits foré = forage  
5. Puits creusé protégé = puit cimente  
6. Source protégée  
7. Citerne d’eau de pluie  
Sources d’approvisionnement non améliorées en eau
8. Puits non protégé = puit traditionnel  
9. Source non protégée  
10. Charrette avec petite citerne/tonneau  
11. Eau en bouteille  
12. Camion-citerne  
13. Eau de surface (rivière, réservoir, lac, étang, ruisseau, canal, canal d’irrigation)  
14. Autre. Préciser  
21. Où se situe cette source d’approvisionnement d’eau?
1. Dans votre logement
2. Dans votre parcelle  
3. Ailleurs  
22. Quelle est la distance (en mètres) qui sépare votre maison de la principale source d’approvisionnement en eau de boisson?
Distance en mètres
2. Je ne sais pas   
23. Combien de temps faut-il pour s’y rendre, avoir de l’eau et revenir?
Temps en minutes
2. Je ne sais pas   
24. Habituellement, faites-vous quelque chose pour rendre l’eau plus saine à boire?
1. Non, je ne fais rien du tout
2. Oui, la faire bouillir   
3. Oui, ajouter de l’eau de javel/chlore  
4. Oui, utiliser l’aquatabs  
5. Oui, la filtrer à travers un linge  
6. Oui, utiliser un filtre (céramique/sable/composite/etc.)  
7. Oui, désinfection solaire   
8. Oui, la laisser reposer   
9. Autre, Préciser.  
25. Quels sont les problèmes rencontrés en termes d’approvisionnement en eau? (plusieurs réponses pecifie)
1. Eau sale/de basse qualité (en termes de goût, couleur, odeur…)
2. Irrégularité de l’approvisionnement  
3. Autre, pecifier:___________________________________________   
4. Pas de problème  
26. Pouvez-vous donner une estimation de la consommation journalière en eau de votre foyer tous usages confondus (boisson, hygiène, cuisine… etc.)?
Consommation journalière en eau (en litres)
2. Je ne sais pas   
27. Pouvez-vous donner une estimation de ce que coûte votre consommation journalière en eau de votre foyer, tous usages confondus (boisson, hygiène, cuisine… etc.)?
Coût des dépenses pour la consommation journalière en eau (en FCFA)
2. Je ne sais pas   
28. Quel type de toilettes les membres de votre foyer utilisent-ils habituellement? (1 reponse)
Installations d’assainissement améliorées
1. Chasse d’eau raccordée—tout à l’égout  
2. Chasse d’eau raccordée—fosse septique  
3. Chasse d’eau raccordée—latrines à fosse  
4. Chasse d’eau raccordée—autre chose   
5. Fosse d’aisance améliorée et autoventilée  
6. Fosse d’aisance avec une dalle  
7. Latrines sèches (à compost)  
Installations d’assainissement non améliorées
8. Chasse d’eau sans raccordement  
9. Fosse d’aisance sans dalle ou fosse en plein air  
10. Latrines à seau  
11. Toilettes ou latrines suspendues  
12. Pas d’installations (brousse, champs)  
13. Autre. Préciser:  
29. Combien de ménages utilisent ces toilettes
1. Seulement mon foyer
2. 1 autre foyer/famille en plus du mien  
3. 2 à 5 foyers/familles en plus du mien  
4. Plus de 5 foyers/familles en plus du mien  
30. Selon vous, quel est le principal problème par rapport l’approvisionnement en eau dans le bassin versant de la rivière Mekrou?
1. Fuite/rupture de canalisations
2. Insuffisance d’eau pendant la saison sèche   
3. Déforestation qui réduit l’importance des réserves d’eau souterraines   
4. Le mode de gestion et d’allocation de l’eau   
5. Le nombre d’utilisateurs différents  
6. Le manque de coopération régionale  
7. Autre, spécifiez:  
Water 10 01232 i003Imaginez que vous maintenant avez la possibilité d’être raccordé au réseau d’eau. Cela signifie un accès 24 h/24 h à une eau de bonne qualité pour votre foyer. Ce raccordement est coûteux. Si vous décidez d’être raccordé au réseau, vous devrez alors payer chaque mois une facture pour ce service d’eau.
31. Dans ce cadre, seriez-vous d’accord pour être raccordé au réseau et ainsi, payer chaque mois une facture pour le service d’eau
1.
Oui
 2.
Non
 
32. Si vous avez répondu NON à la question 36, pouvez-vous indiquer la raison principale? (une seule réponse possible)
1. Je n’ai pas les ressources financières suffisantes pour régler une facture d’eau
2. Je pense que c’est au gouvernement de financer la fourniture en eau  
3. Je n’ai pas confiance dans les la qualité de l’eau distribue par le réseau  
4. Seulement les foyers aisés devraient s’acquitter d’une facture d’eau  
5. Autre raison (specifier):  
33. Si vous avez répondu OUI à la question 36, pourriez-vous indiquer le montant maximum par mois que vous seriez prêt à payer?
1. 50 FCFA
2. 100 FCFA  
3. 200 FCFA  
4. 300 FCFA  
5. 500 FCFA  
6. 750 FCFA  
7. 1000 FCFA  
8. 1500 FCFA  
9. 2000 FCFA  
10. 3000 FCFA  
11. 4000 FCFA  
12. 5000 FCFA  
13. 10,000 FCFA  
14. Plus de 10,000 FCFA  

References

  1. World Health Organization and UNICEF. Global Water Supply and Sanitation Assessment 2000 Report; World Health Organization and UNICEF: Geneva, Switzerland, 2000; p. 87. [Google Scholar]
  2. World Health Organization and UNICEF. Progress on Sanitation and Drinking Water: 2015 Update and MDG Assessment; World Health Organization and UNICEF: Geneva, Switzerland, 2015. [Google Scholar]
  3. Pérez-Foguet, A.; Garriga, R.G. Analyzing Water Poverty in Basins. Water Res. Manag. 2011, 25, 3595–3612. [Google Scholar] [CrossRef] [Green Version]
  4. Bithas, K. The sustainable residential water use: Sustainability, efficiency and social equity. The European experience. Ecol. Econ. 2008, 68, 221–229. [Google Scholar] [CrossRef]
  5. Bajpai, P.; Bhandari, L. Ensuring Access to Water in Households. Econ. Polit. Wkly. 2001, 36, 3774–3778. [Google Scholar]
  6. Latinopoulos, D. Using a choice experiment to estimate the social benefits from improved water supply services. J. Integr. Environ. Sci. 2014, 11, 187–204. [Google Scholar] [CrossRef] [Green Version]
  7. Bithas, K. The European policy on water use at the urban level in the context of the water framework directive. Effectiveness, appropriateness and efficiency. Eur. Plan. Stud. 2008, 16, 1293–1311. [Google Scholar] [CrossRef]
  8. White, G.F.; Bradley, D.J.; White, A.U. Drawers of Water, Domestic Water Use in East Africa. Bull. World Health Organ. 2002, 80, 63–73. [Google Scholar] [PubMed]
  9. Thompson, J.; Porras, I.T.; Tumwine, J.K.; Mujwahuzi, M.R.; Katui-Katua, M.; Johnstone, N.; Wood, L. Drawers of Water II: 30 Years of Change in Domestic Water Use & Environmental Health in East Africa—Summary; International Institute for Environment and Development (IIED): London, UK, 2001; ISBN 1904035981. [Google Scholar]
  10. Howard, G.; Bartram, J.; World Health Organization; Water, Sanitation and Health Team. Domestic Water Quantity, Service Level and Health/Guy Howard and Jamie Bartram; World Health Organization: Geneva, Switzerland, 2003. [Google Scholar]
  11. Nauges, C.; Whittington, D. Estimation of Water Demand in Developing Countries: An Overview. World Bank Res. Obs. 2010, 25, 263–294. [Google Scholar] [CrossRef]
  12. Madanat, S.; Humplick, F. A model of household choice of water supply systems in developing countries. Water Resour. Res. 1993, 29, 1353–1358. [Google Scholar] [CrossRef]
  13. Larson, B.; Minten, B.; Razafindralambo, R. Unravelling the linkages between the Millennium Development Goals for poverty, education, access to water and household water use in developing countries: Evidence from Madagascar. J. Dev. Stud. 2006, 42, 22–40. [Google Scholar] [CrossRef]
  14. Nauges, C.; Van Den Berg, C. Demand for piped and non-piped water supply services: Evidence from southwest Sri Lanka. Environ. Resour. Econ. 2009, 42, 535–549. [Google Scholar] [CrossRef]
  15. Briand, A.; Nauges, C.; Travers, M. Les déterminants du choix d’approvisionnement en eau des ménages de Dakar. Rev. Econ. Dev. 2009, 17, 83. [Google Scholar] [CrossRef]
  16. Sullivan, C. Calculating a Water Poverty Index. World Dev. 2002, 30, 1195–1210. [Google Scholar] [CrossRef]
  17. Manandhar, S.; Pandey, V.P.; Kazama, F. Application of Water Poverty Index (WPI) in Nepalese Context: A Case Study of Kali Gandaki River Basin (KGRB). Water Res. Manag. 2012, 26, 89–107. [Google Scholar] [CrossRef]
  18. Giné Garriga, R.; Pérez Foguet, A. Unravelling the Linkages Between Water, Sanitation, Hygiene and Rural Poverty: The WASH Poverty Index. Water Res. Manag. 2013, 27, 1501–1515. [Google Scholar] [CrossRef] [Green Version]
  19. Thompson, J.; Cairncross, S. Drawers of water: Assessing domestic water use in Africa. Bull. World Health Organ. 2002, 80, 61–73. [Google Scholar]
  20. Thompson, J.; Porras, I.T.; Katui-Katua, M.; Mujwahuzi, M.R.; Tumwine, J.K. Drawers of Water II: Assessing change in domestic water use in East Africa. Water Lines 2003, 22, 22–25. [Google Scholar] [CrossRef]
  21. Kinfe, G.E.; Berhanu, A. Valuing water supply service improvements in Addis Ababa. Ethiop. J. Econ. 2007, 16, 39–84. [Google Scholar]
  22. Tarfasa, S.; Brouwer, R. Estimation of the public benefits of urban water supply improvements in Ethiopia: A choice experiment. Appl. Econ. 2013, 45, 1099–1108. [Google Scholar] [CrossRef]
  23. Vásquez, W.F.; Mozumder, P.; Hernández-Arce, J.; Berrens, R.P. Willingness to pay for safe drinking water: Evidence from Parral, Mexico. J. Environ. Manag. 2009, 90, 3391–3400. [Google Scholar] [CrossRef] [PubMed]
  24. Whittington, D.; Briscoe, J.; Mu, X.; Barron, W. Estimating the Willingness to Pay for Water Services in Developing Countries: A Case Study of the Use of Contingent Valuation Surveys in Southern Haiti. Econ. Dev. Cult. Chang. 1990, 38, 293–311. [Google Scholar] [CrossRef]
  25. Kaliba, A.R.M.; Norman, D.W.; Chang, Y.-M. Willingness to pay to improve domestic water supply in rural areas of Central Tanzania: Implications for policy. Int. J. Sustain. Dev. World Ecol. 2003, 10, 119–132. [Google Scholar] [CrossRef]
  26. Bogale, A.; Urgessa, B. Households’ Willingness to Pay for Improved Rural Water Service Provision: Application of Contingent Valuation Method in Eastern Ethiopia. J. Hum. Ecol. 2012, 38, 145–154. [Google Scholar] [CrossRef]
  27. Arouna, A.; Dabbert, S. Estimating rural households’ willingness to pay for water supply improvements: A Benin case study using a semi-nonparametric bivariate probit approach. Water Int. 2012, 37, 293–304. [Google Scholar] [CrossRef]
  28. Abramson, A.; Becker, N.; Garb, Y.; Lazarovitch, N. Willingness to pay, borrow and work for rural water service improvements in developing countries. Water Res. 2011, 47. [Google Scholar] [CrossRef]
  29. Hydroconseil. Etude de la Situation de Référence et Acquisition de Données Concernant la Gestion Intégrée des Ressources en Eau du Bassin de la Mékrou; Hydroconceil: Chateauneuf-de-Gadagne, France, 2016. [Google Scholar]
  30. Birol, E.; Karousakis, K.; Koundouri, P. Using economic valuation techniques to inform water resources management: A survey and critical appraisal of available techniques and an application. Sci. Total Environ. 2006, 365, 105–122. [Google Scholar] [CrossRef] [PubMed]
  31. Spash, C.L.; Hanley, N. Preferences, information and biodiversity preservation. Ecol. Econ. 1995, 12, 191–208. [Google Scholar] [CrossRef] [Green Version]
  32. Kolstad, C.D.; Braden, J.B. Environmental Demand Theory. In Measuring the Demand for Environmental Quality; Braden, J.B., Kolstad, C.D., Eds.; Elsevier Science Pub. Co.: New York, NY, USA, 1991; pp. 17–39. [Google Scholar]
  33. Garrod, G.; Willis, K.G. Economic Valuation of the Environment; Edward Elgar Publishing: Cheltenham, UK, 1999. [Google Scholar]
  34. Mitchell, R.C.; Carson, R.T. Using Surveys to Value Public Goods: The Contingent Valuation Method; Resources for the Future: New York, NY, USA, 1989. [Google Scholar]
  35. Carson, R.T.; Flores, N.E.; Meade, N.F. Contingent valuation: Controversies and evidence. Environ. Res. Econ. 2001, 19, 173–210. [Google Scholar] [CrossRef]
  36. Blamey, R.K.; Bennett, J.W.; Morrison, M.D. Yea-Saying in Contingent Valuation Surveys. Land Econ. 1999, 75, 126–141. [Google Scholar] [CrossRef]
  37. Cameron, T.A.; Huppert, D.D. OLS versus ML estimation of non-market resource values with payment card interval data. J. Environ. Econ. Manag. 1989, 17, 230–246. [Google Scholar] [CrossRef]
  38. Yang, S.H.; Qing, P.; Hu, W.; Liu, Y. Using a Modified Payment Card Survey to Measure Chinese Consumers’ Willingness to Pay for Fair Trade Coffee: Considering Starting Points. Can. J. Agric. Econ. 2013, 61, 119–139. [Google Scholar] [CrossRef]
Figure 1. The Mékrou river basin and the household survey area.
Water 10 01232 g001
Figure 2. Main socioeconomic characteristics of the surveyed population.
Water 10 01232 g002
Figure 3. Hypothetical WTP scenario for the Domestic water provision.
Water 10 01232 g003
Table 1. Connection in the water network and actual payments.
BeninBurkina FasoNigerMékrou Basin
Water NetworkFreq%Freq%Freq%Freq%
Connected113.3%42.7%42.2%192.9%
Not Connected32196.7%14497.3%17697.8%64197.1%
Total332 148 180 660
Average Payment (FCFA/MONTH)4138 2060 11,000 4956
Table 2. Main sources of provided domestic water.
BeninBurkina FasoNigerMékrou Basin
Count%Count%Count%Count%
Private Tap61.8%21.4%21.1%101.5%
Piped water to yard/plot82.4%21.4%10.6%111.7%
Public tap/standpipe144.2%64.1%3519.4%558.3%
Tubewell/borehole8425.3%9060.8%7139.4%24537.1%
Protected dug well4914.8%74.7%1810.0%7411.2%
Protected spring10.3% 0.0% 0.0%10.2%
Unprotected dug well14844.6%4127.7%5228.9%24136.5%
Unprotected spring82.4% 0.0% 0.0%81.2%
Surface water (river, dam, lake etc.)144.2% 0.0% 0.0%142.1%
Other 0.0% 0.0%10.6%10.2%
Total332 148 180 660
Table 3. Distance and time to the water resource.
BeninBurkina FasoNigerMékrou Basin
Distance to the water resource (meters)
Mean375.25712.44312.19432.93
Standard Deviation670.26711.37368.65630.74
Time to go, get water & come back (minutes)
Mean26.9977.8620.3636.43
Standard Deviation38.6279.1319.0252.24
Table 4. Techniques used at the household to improve water quality.
Water Cleaning MeansBeninBurkina FasoNigerMékrou Basin
Count%Count%Count%Count%
1. No cleaning30893.05%13087.84%14982.78%58789.07%
2. Boiling30.91% 0.00% 0.00%30.46%
3. Adding bleach/chlorine92.72%10.68%42.22%142.12%
4. Using water tablets61.81%42.70%21.11%121.82%
5. Filtering it through linen20.60%117.43%2111.67%345.16%
6. Using a filter (ceramic/sand/composite etc.)00.00% 0.00%10.56%10.15%
7. Let it lay down20.60%21.35% 0.00%40.61%
8. Other10.30% 0.00%31.67%40.61%
Total331 148 180 659
Table 5. Main problem in the domestic water provision.
BeninBurkina FasoNigerMékrou Basin
Count%Count%Count%Count%
1. Dirty water (taste, colour and smell)15145.8%5134.5%5530.6%25739.1%
2. Irregular water supply8024.2%2214.9%6737.2%16925.7%
3. Other 0.0%2919.6%158.3%446.7%
4. No problem9930.0%4631.1%4323.9%18828.6%
Total330 148 180 658
Table 6. Daily household domestic water consumption and expenses (including all sources).
BeninBurkina FasoNigerMékrou Basin
Daily household domestic water consumption (L)
Mean239.12286.39387.82290.27
Standard Deviation331.06250.03785.01490.20
Average daily consumption per person 19.523.423.021.5
Daily household domestic water expenses (FCFA)
Mean727811083
Mean (€)0.110.120.170.13
Standard Deviation154.70191.95460.99278.87
Mean per month (FCFA)2195236433412543
Mean per month (euro)3.353.605.093.88
Mean price per litre (FCFA)0.300.270.280.29
Table 7. Main water provision related problem in the Mékrou Basin.
BeninBurkina FasoNigerMékrou Basin
Count%Count%Count%Count%
1. Busted/broken pipes 0.0%106.8%52.8%152.3%
2. Insufficient water during the dry season24072.3%6543.9%8446.7%38958.9%
3. Deforestation leading to decreased underground reservoirs216.3% 0.0%42.2%253.8%
4. Water management/allocation practices41.2%117.4%126.7%274.1%
5. Many water users206.0% 0.0%63.3%263.9%
6. Lack of transboundary cooperation30.9%74.7%52.8%152.3%
7. I don’t know339.9%2114.2%42.2%588.8%
8. Remoteness of the Mékrou River 0.0%3221.6%31.7%355.3%
9. Other61.8% 0.0%2111.7%274.1%
10. No problem 0.0% 0.0%2312.8%233.5%
11. No response51.5%21.4%137.2%203.0%
Total332 148 180 660
Table 8. Multinomial model results.
Household Income aBStd. ErrorWaldSig.Exp(B)
Average incomeIntercept1.1100.6602.8280.093
[Type of sanitation = 0]−0.8420.4613.3350.0680.431
[Electricity network = 0]−1.3320.35514.1020.0000.264
[Unemployed = 0]0.9190.4105.0130.0252.507
[Access to potable water = 0]−.9280.3666.4350.0110.395
Higher incomeIntercept0.6990.7490.8700.351
[Type of sanitation = 0]−1.4570.4689.7090.0020.233
[Electricity network = 0]−1.7180.37421.0460.0000.179
[Unemployed = 0]1.2560.5455.3080.0213.510
[Access to potable water = 0]−1.0370.4116.3820.0120.354
a The reference category is: 100 (lower income group).
Table 9. Are you willing to pay (WTP) for the hypothetical development of the Mékrou River (dmr) management Plan?
BeninBurkina FasoNigerMékrou Basin
Count%Count%Count%Count%
YES30692.2%13691.9%15787.2%59990.8%
NO257.5%85.4%2111.7%548.2%
No Response10.3%42.7%21.1%71.1%
Total332 148 180 660
Table 10. Willingness to pay: annual household maximum and minimum WTP for domestic water provision.
Mékrou BasinBeninBurkina FasoNiger
Upper-bound of WTP
Mean FCFA2089210023011885
Standard Deviation FCFA2506255126152313
Mean EURO3.183.203.512.87
Standard Deviation EURO3.823.893.993.53
Lower-bound WTP
Mean FCFA1532150517571392
Standard Deviation FCFA1975189422591861
Mean EURO2.342.292.682.12
Standard Deviation EURO3.012.893.442.84
Table 11. Aggregate WTP values for domestic water services in the selected mékrou area.
BeninBurkina FasoNigerMékrou Basin
Average household members12.2312.2416.8413.49
Population294,92179,632173,115547,668
lower bound of WTP (euro)55,28317,42521,82394,822
upper bound of WTP (euro)77,17122,81529,545129,296
Annual Max WTP (euro)926,046273,777354,5421,551,556
Table 12. WTP for domestic water drinking provision—interval regression model.
Number of valid obs = 514
Independent VariablesCoef.Std. Err.P > z
Monthly household income106.45 39.400.007
Access to water110.371278.360.692
Connection to electricity811.25 269.950.003
Type of sanitation522.06 312.030.094
Education123.30277.110.107
Number of children66.05 16.820.000
Benin −848.68 249.090.001
Niger−1024.51 296.560.001
_cons1279.95 267.440.000
Log likelihood−1698.57
Likelihood ration χ2 (8) test69.072
0left-censored observations
18uncensored observations
16right-censored observations
480interval observations

