Abstract
Waste/reclaimed irrigation water has been promoted due to water shortages in arid and semi-arid areas. However, this process may be one of the sources of phthalate esters (PAEs) in agricultural soils, and the potential risks of PAEs for soil ecosystems and human health have attracted considerable attention. A two-year (from October 2014 to October 2016) field experiment was conducted to assess the contamination risk of PAEs from reclaimed irrigation water in winter wheat (Triticum aestivum L.) and summer maize (Zea mays L.) fields on the North China Plain. Three types of irrigation water quality were arranged for each variety, including reclaimed water, groundwater, and a mixture of reclaimed water and groundwater (1:1, v/v). The results indicate that the concentrations of the 6 PAEs in topsoil ranged from 2.79 to 5.34 mg/kg at the time of crop harvest. There was no significant effect of reclaimed irrigation water on the concentrations of PAEs in the soil. Di-n-butyl phthalate (DnBP) and di (2-ethylhexyl) phthalate (DEHP) were the most abundant contaminants in all soil samples, accounting for 43.2%~68.7% and 27.1%~48.6%, respectively, of the 6 PAEs. The levels of dimethyl phthalate (DMP) and DnBP in all soil samples exceeded the allowable soil concentrations, but the levels were far below the recommended soil cleanup objectives. The grain yields of winter wheat and summer maize ranged from 4.35 to 7.1 t/ha and 1.03 to 6.46 t/ha, respectively. There were no significant effects of reclaimed water on the growth characteristics and grain yield of winter wheat (p > 0.05); however, the effect of reclaimed irrigation water on summer maize was influenced by climate. The concentrations of the 6 PAEs in wheat grain and maize grain ranged from 1.03 to 4.05 mg/kg and from 0.37 to 3.29 mg/kg, respectively. For the same variety, there was no significant difference in the concentrations of the 6 PAEs in cereal grains among different treatments (p > 0.05). DEHP and DnBP were the most abundant components in most crop samples, accounting for 31.6%~77.9% and 21.1%~64.7%, respectively, of the 6 PAEs. The concentrations of the PAEs, DnBP and DEHP in cereal grains were lower than those in the reference doses. The BCFs of the 6 PAEs and of each PAE in cereal grains were 0.43~1.25 and 0.33~35.75, respectively. The BCFs of butyl benzyl phthalate (BBP) were the highest (1.41~35.75), followed by DMP and DEHP. There were almost no significant differences in the BCFs of each PAE among the three treatments. The total carcinogenic risks of PAEs were 2.82 × 10⁻⁵ for adults and 1.81 × 10⁻⁵ for children. The total non-carcinogenic risks of PAEs were 3.37 × 10⁻¹ for adults and 7.98 × 10⁻¹ for children. DHEP was the dominant contributor to both risks, and the intake of cereals was the main exposure pathway for the two risks. In conclusion, there were no significant effects of reclaimed irrigation water on the concentrations of PAEs in soil and cereal grains compared with groundwater irrigation, and the human health risks were within the acceptable range. Long-term studies are needed to evaluate the long-term effects of reclaimed irrigation water on the contamination risk posed by PAEs.
1. Introduction
Phthalate esters (PAEs), usually called phthalic acid esters, are a group of organic compounds made by humans. PAEs are widely used in cosmetics, printing inks, personal care products, building materials, plasticizers, and lubricants. Di(2-ethylhexyl) phthalate (DEHP), di-n-octyl phthalate (DnOP), and butyl benzyl phthalate (BBP), high-molecular-weight phthalate compounds, are often used in the production of polyvinylchloride (PVC) plastic [1]; additionally, diethyl phthalate (DEP), dimethyl phthalate (DMP), and di-n-butyl phthalate (DnBP), which are low-molecular-weight phthalate compounds, are often used in cosmetics, varnishes, and coatings [2]. PAEs can be released into the environment directly or indirectly during the production and use of the products in which they are present, or they can be released after product disposal [3]. PAEs are suspected to be endocrine-disrupting chemicals and exhibit carcinogenic effects [4]. The United States Environmental Protection Agency has classified DMP, DEP, DEHP, DnBP, BBP and DnOP as priority environmental pollutants [5].
Soil is an important environmental medium for the accumulation and migration of PAEs. Moreover, PAEs can exist in the soil for a long time and can pass to crops and enter into food chains, posing a risk to environmental and human health [6]. The main sources of PAEs in agricultural soil-plant systems are plastic films (e.g., greenhouse films, mulching film), wastewater irrigation, sewage sludge, and atmospheric (wet and dry) deposition [7,8,9,10].
Many researchers have investigated the concentrations of PAEs in soils and crops sampled from different land-use types in urban, and industrialized areas, suburban areas, rural areas and villages. They found that the levels of PAEs in the soils of an electronics manufacturing area, urban soils, and suburban soils ranged from 8.63 to 171.64 mg/kg [11], 0.002 to 3.14 mg/kg (mean value of 1.14 mg/kg) [12], and 0.05 to 10.4 mg/kg (mean value of 0.32 mg/kg) [13], respectively. The highest concentrations of PAEs in the electronics manufacturing area were found in roadside soils followed by residential areas, farmland and non-cultivated areas. The higher concentrations in roadside soils might be due to contaminated runoff from vehicles and piping (e.g., electrical poles and lampposts), as well as the infrastructure around the electronics factory [11]. The highest values of PAEs in suburban areas were found in vegetable soil, followed by wasteland, farmland, and orchard soils [13]. Škrbić et al. (2016) [14] reported that the contents of PAEs in urban soil and street dust in Novi Sad ranged from 0.0002 to 4.82 mg/kg, and the two most dominant PAEs in the soil were DEHP (67%~96% of PAEs) and DnBP (2%~25% of PAEs). Sun et al. (2016a) [15] reported that the concentrations of PAEs in agricultural soils and vegetables from eastern China ranged from 0.11 to 5.56 mg/kg and 0.06 to 2.39 mg/kg, respectively. The levels of PAEs in soils might be a result of human activities, including industrial, commercial, municipal, and agricultural activities [11,12]. Generally, the concentrations of PAEs in soils of industrialized areas were the highest, followed by urban soil, and the lowest levels were found in suburban soil or rural/village soil. Tran et al. (2015) [16] also reported that the contents of PAEs in urban soils were the highest, followed by agricultural soil, rural soil, and forest soil in the area around Paris.
Some researchers have investigated the concentrations of PAEs in different types of planting patterns and management modes. The concentrations of PAEs in soil and vegetables under plastic film were 0.15~18.8 mg/kg and 0.51~7.16 mg/kg, respectively; the concentrations of PAEs in soil and vegetables in greenhouses ranged from 0.14 to 4.9 mg/kg and 0.15 to 6.94 mg/kg, respectively; the concentrations of PAEs in soils collected from film mulching fields and greenhouse fields were higher than those from fields where no film was used; the concentrations of PAEs in soil and radish that were amended with sludge were higher than those without sludge; and DEHP and DnBP were often the most abundant compounds [10,17,18,19,20,21,22,23,24].
Irrigation with wastewater and reclaimed water has been promoted in arid and semi-arid areas due to water shortages [25,26]. Nutrient elements in the water may promote crop growth [27]; however, there may be other substances, such as PAEs [7], that pose environmental risks. Zeng et al. (2008) [7] found that PAEs in soil increased after a long period of wastewater irrigation. Tan et al. (2016) [26] reported that significantly higher concentrations of PAEs were detected in agricultural soil that was irrigated with wastewater than in those irrigated with groundwater; furthermore, more PAEs were detected in cereal grains as the amount of wastewater irrigation increased. However, to our knowledge, the effect of reclaimed irrigation water on PAEs in soils and cereal grains has not been widely studied. Therefore, a two-year field experiment on a winter wheat (Triticum aestivum L.)/summer maize (Zea mays L.) rotation cropping system was conducted on the North China Plain (NCP) to (1) investigate the concentrations and compositions of PAEs in soils and cereal grains under irrigation treatments with different water quality; (2) analyze the PAE contamination levels of soils and cereal grains; and (3) determine the transfer ability of PAEs in the soil—plant system.
2. Materials and Methods
2.1. Site Description and Experimental Design
The experiment was carried out from October 2014 to October 2016 at the Yong Ledian Experimental Base for Water-Saving Irrigation Research, the Beijing Water Science and Technology Institute, Beijing, China (39°20′ N; 114°20′ E; 12 m above sea level) (Figure 1). During the last 50 years, the mean annual temperature was 11.0 °C~12.0 °C, the mean annual precipitation was 565 mm, and more than 70% of the precipitation occurred from June to August. The soil texture is predominantly silty loam soil (<0.002 mm, 7.0%; 0.002–0.05 mm, 54.7%; 0.05–2 mm, 38.3%). The groundwater table was monitored in an observation well located at the experimental base, it was approximately 8.0 m below the ground surface during the experimental year.
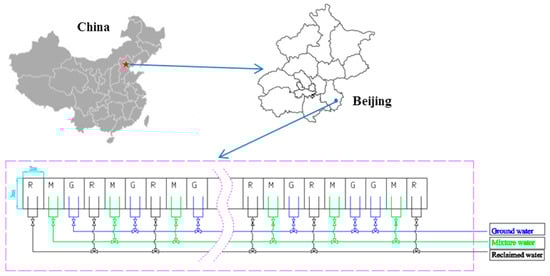
Figure 1.
The localization and scheme of the experiment.
In the experiment, crops of winter wheat (Triticum aestivum L.) and summer maize (Zea mays L.) were planted in measure-pits. Each measure-pit was 3 m × 2 m, and there was a compound geomembrane (with a depth of 1 m) on each side of the measure-pit to eliminate the effects from the side flow of water. The backfill was the same for all measure-pits; thus, the initial soil conditions were the same for all measure-pits. The winter wheat (Triticum aestivum L.) varieties were Jimai, Zhongmai, Shimai, Nongda, and Shifu (though Lunxuan was planted instead of Jimai in 2016). Winter wheat was generally planted in early October and harvested in mid-June of the following year. The summer maize (Zea mays L.) varieties were Jiyuan, Jingdan, Xinyu, Tianyumi, and Nianyumi. Summer maize was sown in late June after the winter wheat harvest and harvested in late September.
Three irrigation treatments were arranged for each variety, including irrigation with reclaimed water, groundwater, and a mixture of reclaimed water and groundwater (1:1, v/v), and these treatments were referred to as the R, G, and M treatments, respectively. Each treatment was replicated three times, and there were 45 plots in total. The 45 plots were laid out in a randomized complete block design. The reclaimed water was the secondary effluent from the Gaobeidian Sewage Treatment Plant, and the groundwater was collected from a local well. The concentrations of PAEs in the reclaimed water and groundwater were 2.63~3.43 μg/L and 2.01~2.03 μg/L, respectively. The reason for the similar concentrations of PAEs in the groundwater may be that the effluent of the Huangcun and Xiaohongmen Sewage Treatment Plant was discharged into ditches near our study area, and some of the effluent in the ditches may have gradually moved into the groundwater. The irrigation schedule (i.e., date and depth) was the same as that for the local field, and the date and depth for each irrigation event are shown in Table 1. Irrigation water was applied to each plot by using a plastic hose, and some components of the irrigation water are shown in Table 2.

Table 1.
The irrigation depth at each time point.
Table 2.
The quality of reclaimed water and groundwater.
In each crop growing season, the field managements were the same for each measure pit, except for the irrigation water quality. Urea (46.7% N) was applied at winter wheat planting and at the returning green stage, and the application rate was 416 kg/ha (194 kg/ha N) each time. For summer maize, urea was applied at the planting and jointing stage, and the application rates were 416 kg/ha (194 kg/ha N) and 300 kg/ha (140 kg/ha N), respectively. No other agrochemicals (such as other fertilizers, insecticides, fungicides, and herbicides) and no organic manures were applied at the experimental site. Weeds were removed by hand. Tillage was performed before winter wheat planting, and maize was planted by hand without tilling the soil.
2.2. Sampling and Measurements
2.2.1. Sampling
For each treatment, topsoil (0~20 cm) samples were collected from three locations (one location for each replicate) using soil augers at the time of winter wheat and summer maize harvest, and all soil samples were freeze-dried. At the time of crop (winter wheat and summer maize) harvest, cereal grain samples were selected within each experimental field and dried in a vacuum drying oven at 65 °C for 12 h. Both the crop and the soil samples were ground and sieved through a stainless steel 75-mesh (0.5 mm) sieve. The collected samples were analyzed for the concentrations of PAEs, including DMP, DEP, DEHP, DnBP, DnOP, and BBP. To avoid contamination, no plastic equipment was used during sampling and processing.
2.2.2. Chemicals and Reagents
A standard mixture of 6 PAEs consisting of DMP, DEP, DEHP, DnBP, DnOP, and BBP (each at a concentration of 2000 mg/L) was supplied by Beijing Bailingwei Technologies Co. Ltd. (Beijing, China), and internal standard triphenyl phosphate and an isotope surrogate standard of di-n-butyl phthalate-d4 (DEP-D4) were purchased from the Sigma-Aldrich company (Shanghai, China). The internal standard was acquired initially as a solid with 99% purity. All of the solutions were used within 6 months. All solvents (e.g., dichloromethane, methanol, acetone, n-hexane) were of HPLC grade.
2.2.3. Sample Extraction, Fractionation, and Instrumental Analysis
A 10 g soil sample was spiked with the surrogate standard DnBP-D4 (0.1 mg/kg) and extracted with 220 mL acetone and methyl alcohol (1:1, v/v) in a Soxhlet extractor for 12 h. A 5 g grain sample was spiked with a surrogate standard (0.1 mg/kg) and extracted with 220 mL n-hexane in a Soxhlet extractor for 12 h. The extract solution was dehydrated and concentrated, flowed through anhydrous sodium sulfate (50 g), and then concentrated to 0.8–1.5 mL by the gentle use of nitrogen gas blowing (50 °C) and rotary evaporators (50 °C). Finally, the extract solution was transferred to a brown sample bottle with a volume of 1.5 mL through a 0.22 μm membrane filter, and the final solution was adjusted to 0.5~1.0 mL, and then kept in a refrigerator until instrumental analysis [23,28].
The analysis of PAEs in the extracts was determined using an Agilent 7890A gas chromatograph (GC) coupled with a 5975C mass spectrometer (MS) (Agilent Technologies, Avondale, PA, USA), operating on electron impact and selective ion monitoring mode (SIM). Chromatographic separation was achieved using a DB-5 MS capillary column (30 m × 0.25 mm × 0.25 μm). The extract was injected in splitless mode with an injector temperature of 280 °C. The initial GC oven temperature was maintained at 40 °C for 2 min, then increased to 290 °C at a rate of 5 °C/min, and kept at this level for 4 min.
2.2.4. Quality Assurance and Quality Control
Quality controls were implemented to ensure the accurate quantification of the target analyses. A procedural blank, a spiked blank, a sample duplicate, and a solvent blank were processed after every 15 samples. The surrogate standards were added to all samples to monitor matrix effects. The instruments were calibrated daily with calibration standards. No target compounds were detected in the solvent blank. The surrogate recoveries ranged from 80% to 120%, and the recoveries of the 6 PAEs in the spiked blank samples ranged from 70% to 120% (relative standard deviations were less than 10.5%, n = 6). The limits of detection (LODs) were 0.032~0.191 μg/kg.
2.2.5. Cereal Yields
The cereal grain yield for each treatment was determined by collecting grain from the whole measure pit, and drying it under natural sunshine conditions until the moisture content of grain reached approximately 12%.
2.3. Calculations
(1) Bioaccumulation factor
The bioaccumulation factors of the PAEs were calculated for each treatment according to the following equation [29].
where BCF is the bioaccumulation factor, Cplant is the PAE concentration in the plant in mg/kg (dry weight), and Csoil is the PAE concentration in the soil in mg/kg.
BCF = Cplant/Csoil
The data were statistically analyzed using the IBM SPSS Statistics software package (version 20.0, IBM Corp., Armonk, NY, USA) and Microsoft Excel 2010. For the standard analysis of variance (ANOVA), the attributes from different treatments (mean value of each treatment) were compared using the least significant difference (LSD) at the 5% level to determine significant differences among treatments. If the concentration of a compound was lower than the LOD value, a value of zero was assigned for the calculations of means and sums, and a value equal to half the LOD value was assigned for statistical analysis.
(2) Health risk assessment
The non-carcinogenic and carcinogenic risks of the PAEs to humans were calculated using the methods recommended by the USEPA. DEP, BBP, DEHP, DMP, DnBP, and DnOP were regarded as non-carcinogenic compounds with respect to human health, while BBP and DEHP were regarded as carcinogenic compounds. The non-carcinogenic risks and carcinogenic risks were presented as the hazard index (HI) and risk, respectively. The local residents are considered to be exposed to non-carcinogenic risks when HI > 1; carcinogenic risks are considered very low, low, moderate, high, and very high when risk is below 10−6, 10−6~10−4, 10−4~10−3, 10−3~10−1, and >10−1, respectively. The exposure pathways for these compounds include soil ingestion, inhalation and dermal contact, intake of agricultural products. The HI and risk were calculated using the following equations [30,31,32].
where HI is the non-carcinogenic risks; ADD is the average daily dose in mg/kg/day (ADDintake, ADDingest, ADDdermal, and ADDinhale represent the crops intake, soil ingestion, dermal contact, and inhalation, respectively); RfD is the daily maximum permissible level of contaminants in mg/kg/day (RfDdermal and RfDo represent the dermal contact and intake and ingestion, respectively); risk is the carcinogenic risks; SF is the slope factor of the carcinogenin (mg/kg/day)−1 (SFdermal, SFo, and SFinhale represent the dermal contact, intake and ingestion, and inhalation, respectively); ABSgi is the fraction of pollutant absorbed in the gastrointestinal tract; IURinhale is the inhalation unit risk; BWa is the adult body weight in kg; IR3a is the daily respiratory rate for adult in m3/day; C1 and C2 are the target concentrations of PAE in crops and soils, respectively, in mg/kg; IR1, IR2, and IR3 are the daily intake rate of crops, soil, and respiratory rate in kg/day or m3/day, respectively; EF is the exposure frequency in days/year; ED is the exposure duration in years; BW is the body weight in kg; AT is the lifetime exposure in days; CF is the conversion factor in kg/mg; SA is the soil surface area in cm2/day; AF is the soil adherence factor in mg/cm2; ABS is the fraction of contaminant absorbed dermally from the soil (unitless); and PEF is the particulate emission factor in m3/kg. The values of the parameters are listed in Table 3.
HI = ADD/RfD
Risk = ADD × SF
RfDdermal = RfDo × ABSgi
SFdermal = SFo/ABSgi
SFinhale = IURinhale × BWa/IR3a
ADDintake = (C1 × IR1 × EF × ED)/(BW × AT)
ADDingest = (C2 × IR2 × CF × EF × ED)/(BW × AT)
ADDdermal = (C2 × CF × SA × AF × ABS × EF × ED)/(BW × AT)
ADDinhale = (C2 × (1/PEF) × EF × ED × IR3)/(BW × AT)
Table 3.
Parameters of health risk assessment.
3. Results and Discussion
3.1. Concentrations of the 6 PAEs and Each Individual PAE in the Soil
Figure 2 shows the total concentrations of the 6 PAEs in the topsoil at the time of cereal crop harvest. The concentrations of the 6 PAEs in the topsoil ranged from 4.87 mg/kg to 5.34 mg/kg, 2.79 mg/kg to 3.78 mg/kg, and 3.62 mg/kg to 4.18 mg/kg at the winter wheat (2015), summer maize (2015) and winter wheat (2016) harvests, respectively. The concentrations of the 6 PAEs in the topsoil at the winter wheat harvest were higher than those at the summer maize harvest, which may be due to the relatively higher deposition of PAEs during the winter wheat season [33,34]. At each crop harvest, there were no significant differences in the total concentrations of PAEs among the three treatments (p > 0.05), indicating there was no significant effect of reclaimed irrigation water on the concentrations of PAEs in the soil.
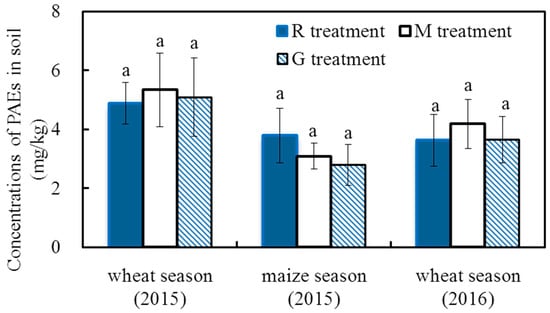
Figure 2.
Concentrations of the 6 PAEs in the soil at crop harvest in 2015 and 2016. Note: Different letters on the top of the histogram indicate significant differences among the three treatments for each crop season (p < 0.05).
Table 4 shows the concentrations of the 6 PAEs in the soil in this study and those published in other studies conducted at home and abroad. Compared with the other results at home, the concentrations of PAEs in the soil in this study were higher than those in the agricultural soil collected from Tianjin, Mainland, Northeast China, Yangtze River Delta and those collected from soil with plastic film or greenhouses in Nanjing [10,13,22,23,28,35]; however, the values from the current study were lower than those reported for Xiangyang and Shandong Peninsula [12,19]. Compared with results from studies conducted abroad, the levels of PAEs in this study were higher than the levels found in agricultural soils from Danish, American, The Netherlands, Czech Republic and Parisian studies, as well as urban soil from Serbia [14,16,18,21,36,37]. In summary, in comparison with the results obtained from other places both within and outside the country, the concentrations of PAEs concentration in the soils in this study were relatively high.
Table 4.
The comparison of the concentrations of PAEs in the present study with those of other studies.
Table 5 shows the PAE compounds in the soil samples. The concentrations of DnOP in all soil samples in this study were below the LODs, and the other 5 PAE compounds in the soil samples were all detected and are shown in Table 5. DnBP and DEHP were the most abundant contaminants in all soil samples with concentrations of 2.01 mg/kg~3.61 mg/kg and 0.64 mg/kg~2.39 mg/kg, respectively, which account for 43.2%~68.7% and 27.1%~48.6% of the 6 PAEs, respectively; DMP was next, accounting for 1.5%~6.8% of the 6 PAEs. The ratios of the sum of DEP and BBP to the 6 PAEs were less than 1.5%.
Table 5.
Concentrations of each individual PAE in the soil at crop harvest in 2015 and 2016 Unit: mg/kg.
The compositions of PAEs in the soils in this study were similar to those reported in other regions [11,13,16,38], where DnBP or DEHP was also the dominant compound. The reasons may be that DEHP and DnBP have a relatively high molecular mass and low solubility in water, and they are frequently rate-limiting for volatilization, biodegradation, and subsurface transport; therefore, these compounds can easily accumulate at high levels in soils. DEP and BBP with low molecular weight have lower soil adsorption coefficients and are relatively soluble in water; thus, these compounds have low levels of soil residuals [39,40].
Compared with the soil cleanup objectives and the guidance established by the New York State Department of Environmental Conservation [41,42], the concentrations of DEP, BBP, and DEHP were all below the corresponding recommended allowable concentrations, while the levels of DMP and DnBP in all soil samples exceeded the allowable soil concentrations. The maximum values of DMP and DnBP were 14-fold and 44-fold higher than the allowable soil concentrations, respectively, indicating that the soil was polluted by PAEs. Similar results were reported for Guangzhou and Shandong by Zeng et al. (2009) [38] and Li et al. (2016a) [19], who found that the concentrations of DMP and DnBP in most soil samples exceeded the allowable concentrations. However, in all soil samples, each individual PAE was far below the recommended soil cleanup objectives, indicating that no remediation measures were required for PAEs in this study. Further attention is still needed regarding their potential effects in the future.
3.2. Growth Characteristics of Cereal Crops
Figure 3 shows the height and leaf area of winter wheat and summer maize at harvest. The height and leaf area of a single winter wheat plant ranged from 44.8 cm to 73.8 cm and 24.9 cm2 to 60.0 cm2, respectively. There were no significant differences in both the height and the leaf area of winter wheat among the three treatments for each variety in the two years (except for Shifu in 2016) (p > 0.05). This result indicated that there was almost no significant effect of reclaimed water on the growth characteristics of winter wheat.

Figure 3.
Height and leaf area of winter wheat and summer maize in 2015 and 2016, height of winter wheat in 2015 (a); leaf area of winter wheat in 2015 (b); height of summer maize in 2015 (c); leaf area of summer maize in 2015 (d); height of winter wheat in 2016 (e); leaf area of winter wheat in 2016 (f); height of summer maize in 2016 (g); leaf area of summer maize in 2016 (h). Note: Different letters on the top of the histogram indicate significant differences among the three treatments for each variety (p < 0.05).
The height and leaf area of a single plant of summer maize ranged from 102 cm to 180 cm and 2366 cm2 to 4133 cm2, respectively. The height of summer maize in the R treatment was significantly higher than that in the G treatment for each variety (except for Tianyumi in 2015 and Xinyu and Tianyumi in 2016) (p < 0.05). The leaf area in the R treatment was significantly higher than that in the G treatment for Jingdan and Nianyumi (p < 0.05) in 2015, while there was almost no significant difference in leaf area among the three treatments for each variety (except for Nianyumi) in 2016 (p > 0.05). The relatively higher leaf area in the R treatment for Jingdan and Nianyumi in 2015 was due to the relatively higher number of leaves on individual plants (the mean numbers of leaves were 9.1 and 7.3 in the R and G treatments for Jingdan, respectively; the mean numbers of leaves were 9.5 and 6.3 in the R and G treatments for Nianyumi, respectively). The effects of reclaimed irrigation water on the growth characteristics of summer maize may be affected by climate.
3.3. Cereal Grain Yields
Figure 4 shows the grain yields of cereal in 2015 and 2016. The grain yields of winter wheat ranged from 4.35 to 7.1 t/ha, and the values were similar to the results of Li et al. (2016c) [43], who found that the grain yields of winter wheat ranged from 5.73 to 7.04 t/ha with an effective water and N supply in 2009–2011. There were no significant differences in the wheat grain yields among the five varieties (p > 0.05), and there were also no significant differences in the wheat yields among the three treatments for each variety (p > 0.05), indicating there was no significant effect of reclaimed irrigation water on wheat grain yields. The similar grain yields among the three treatments for each variety may be due to the similar growth state (e.g., height and leaf area, Figure 3) and similar 1000-grain weight (the 1000-grain weight of winter wheat ranged from 33.91 g to 42.85 g in 2015 and from 32.91 g to 40.26 g in 2016, and there were no significant differences in the 1000-grain weight among the three treatments for each variety). The lower wheat grain yield in 2016 may be due to the relatively higher effective accumulated temperature in the winter wheat season in 2016 (2474 °C in 2015, 2527 °C in 2016) [44].
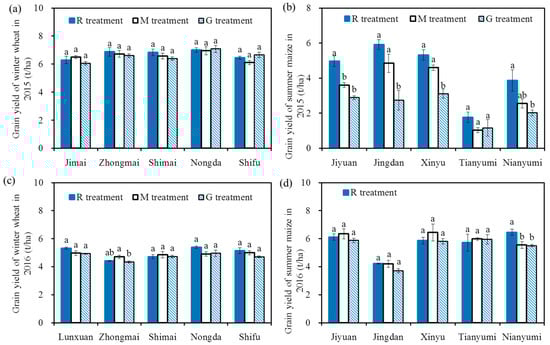
Figure 4.
Grain yields of winter wheat and summer maize in 2015 and 2016, grain yields of winter wheat in 2015 (a); grain yields of summer maize in 2015 (b); grain yields of winter wheat in 2016 (c); grain yields of summer maize in 2016 (d). The grain yield of summer maize ranged from 1.03 to 6.46 t/ha. The values in 2015 were lower than the results reported by Qiu et al. (2012) [45] and Liang et al. (2013) [46], who found that the grain yields of summer maize were 5.2~9.0 t/ha with efficient water and N supplies. The main reasons for these results may be the different climate and varieties. The grain yields in the R treatment were significantly higher than those in the G treatment for each variety in 2015 (p < 0.05, except for Tianyumi), and there were no significant differences among the three treatments for each variety in 2016 (p > 0.05, except for Nianyumi). The relatively higher grain yields in the R treatment compared with those in the G treatment in 2015 may be due to a better growth state in the R treatment (e.g., height and leaf area, Figure 3), and the similar grain yields among the three treatments for each variety in 2016 may be due to a similar growth state (Figure 3). The reasons for the higher maize grain yield and the small effect of reclaimed water on grain yield in 2016 may be due to the relatively higher precipitation in the summer maize season in 2016 (300 mm in 2015, 510 mm in 2016), indicating that the effects of reclaimed irrigation water on summer maize yields were influenced by climate. Note: Different letters on the top of the histogram indicate significant differences among the three treatments for each variety (p < 0.05).
3.4. Concentrations of 6 PAEs and Each PAE in Cereal Grains
Figure 5 shows the 6 PAE concentrations in the cereal grains in 2015 and 2016. The total concentrations of the 6 PAEs in winter wheat grain and summer maize grain ranged from 1.03 mg/kg to 4.05 mg/kg and 0.37 mg/kg to 3.29 mg/kg, respectively. The total concentrations of PAEs in Jimai were higher than those in the other four wheat varieties, and there were no differences among the other four varieties. The total concentrations of PAEs in Jiyuan were significantly higher than those in the other four maize varieties, and there were no differences among the other four varieties.
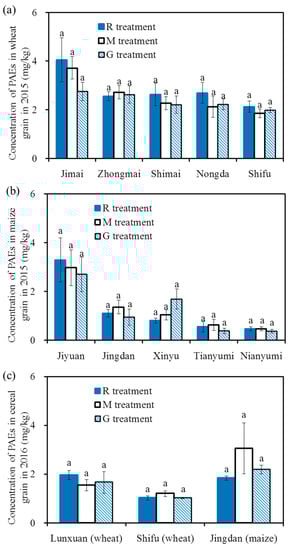
Figure 5.
Concentrations of the 6 PAEs in cereal grains in 2015 and 2016, concentrations of the 6 PAEs in winter wheat grain in 2015 (a); concentrations of the 6 PAEs in summer maize grain in 2015 (b); concentrations of the 6 PAEs in winter wheat and summer maize grain in 2016 (c). Note: Different letters on the top of the histogram indicate significant differences among the three treatments for each variety (p < 0.05).
For the same variety, there was no significant difference for the 6 PAE concentrations in cereal grains among the different treatments in the two years (p > 0.05), indicating there was no significant effect of reclaimed irrigation water on the concentrations of PAEs in cereal grains. The concentrations of PAEs in the present study were similar to those reported by Mo et al. (2009) [28], Wang et al. (2015) [22] and Li et al. (2016b) [20], who found that the concentrations of the 6 PAEs in vegetables ranged from 0.073 mg/kg to 11.2 mg/kg, with a mean value of 1.12 mg/kg~3.2 mg/kg; additionally, the values were lower than the concentrations of PAEs in winter wheat grain (8.0 ± 2.6 mg/kg) and summer maize grain (11.0 ± 5.1 mg/kg) that was irrigated with wastewater [26].
Table 6 shows the ratios of each individual PAE to the total PAEs for cereal grains (the concentrations of DnOP in all crop samples were below the LODs). As Table 6 shows, for both wheat grains and maize grains, DEHP was the most abundant component in most crops samples, accounting for 37.3%~70.7% and 31.6%~77.9% of the 6 PAEs, respectively; the second dominant component was DnBP, which varied from 20.8% to 47.1% and 21.1% to 64.7%, respectively; these were followed by DMP, which had a relative contribution in the range of 3.4% to 9.5% and0.4% to 7.6%, respectively. The sum of DEHP and DnBP accounted for more than 85% of the 6 PAE concentrations. The contributions of DEP or BBP were typically less than 5%. The compositions were similar to those reported in other regions [10,15,20,22,28], where DEHP and DnBP were also the dominant compounds in crops, accounting for 25.7%~67.1% and 20.0%~46.9%, respectively. The reasons for these results were that DEHP and DnBP have low water solubility and thus, are readily absorbed to soil; therefore, these compounds typically have relatively higher accumulation rates in crops. Furthermore, the high water solubility and biodegradation of DEP and BBP contributes to the relatively lower accumulation in crops.
Table 6.
The ratio of each individual PAE to the total 6 PAEs for cereal grains in 2015 and 2016 Unit: %.
The tolerable daily intake (TDI) values for the PAEs, DnBP and DEHP (imposed by the European Food Safety Authority (EFSA)) were 0.3, 0.01, and 0.05 mg/kg, respectively [47,48,49]. Assuming that the daily intake of wheat or maize for adults (weight, 70 kg) is 0.10 kg, the maximum PAEs, DnBP and DEHP reference doses for wheat or maize were 210, 7, and 35 mg/kg, respectively. The concentrations of PAEs, DnBP and DEHP in wheat and maize grains in this study were lower than the reference doses, indicating there was a lower health risk.
3.5. Bioaccumulation Factors of Each PAE
Table 7 shows the BCFs of winter wheat and summer maize. The bioaccumulation factors (BCFs) are expressed as the ratio of the PAE concentration in crops to the PAE concentration in soils (dry weight). The BCFs of the 6 PAEs in wheat grains and maize grains were 0.43~0.84 and 1.0~1.25, respectively. Sun et al. (2016a) [15] reported that the BCFs of the total PAEs for cabbage were in the range of 0.29~1.23, which were similar to our results. The BCFs of each PAE in wheat grain and maize grain were 0.33~35.75 and 0.47~2.9, respectively. Similar results were observed in the studies by Wang et al. (2015) [22] and Li et al. (2016b) [20]. They found that the BCFs of each PAE were in the range of 0.74~8.0 and 0.11~23.0, respectively. Overall, the BCFs of BBP were the highest (1.41~35.75), followed by DMP and DEHP, and then DEP and DnBP. A similar result was reported by Mo et al. (2009) [28], who also found that the BCFs of BBP (0.33~12.5) in vegetables were higher than those of DEHP and DnBP. There were almost no significant differences in the BCFs of each PAE among the three treatments, indicating there were no significant effects of reclaimed irrigation water on the BCFs of cereal grains.
Table 7.
The bioaccumulation factors of each PAE in the soil-cereal grain system in 2015 and 2016.
3.6. Risk Assessment
Table 8 shows the results of the risk assessment, and the mean values of all crops or soils were used for the risk assessment. The total carcinogenic risk of PAEs was 2.82 × 10⁻⁵ for adults and 1.81 × 10⁻⁵ for children, both of which were within the low-risk category (10−6~10−4); moreover, the total non-carcinogenic risk of PAEs was 3.37 × 10⁻¹ for adults and 7.98 × 10⁻¹ for children, both of which were lower than the recommended allowable level (HQ < 1). Overall, the human health risks from the analyzed PAEs in crops and soils were within an acceptable range.
Table 8.
Carcinogenic health risk and non-carcinogenic health hazard index of PAEs.
The non-carcinogenic risks of the PAEs followed the sequence DEHP > DnBP > DEP > BBP, and the carcinogenic risk of DEHP was higher than that of BBP. DEHP contributed 87.22%~87.30% and 99.90%~99.91% to the total non-carcinogenic risks and carcinogenic risks, respectively; the higher contribution of DEHP was due to the relatively higher concentrations (Table 5 and Table 6) and relatively lower RfD (Table 3). A similar result was reported by Sun et al., who stated that DHEP was the dominant contributor to the carcinogenic risks and non-carcinogenic risks of PAEs in Shanghai and Jiangsu [15]. The carcinogenic risk of DEHP was 1.81 × 10⁻⁵ for children and 2.82 × 10⁻⁵ for adults in this study, and the values were consistent with the study in Beijing by Li et al., in which the carcinogenic risk of DEHP ranged from 2.4 × 10⁻⁶ to 7.6 × 10⁻⁵ (Li et al., 2016) [20].
The intake of cereals was the main exposure pathway for both non-carcinogenic risks (which contributed 99.81%~99.95% to the total risk) and carcinogenic risks (which contributed 99.85%~99.96% to the total risk), followed by soil ingestion and dermal contact. Soil inhalation contributed the least to the total risk. This is consistent with the report by Sun et al. (2016a) [15], in which the intake of agricultural products was the primary exposure pathway and contributed to over 90% of the total risks.
4. Conclusions
A two-year field experiment was conducted in winter wheat and summer maize fields on the North China Plain to study the effect of different water quality on the contamination risk posed by PAEs. The main conclusions are as follows.
There were no significant effects of reclaimed irrigation water on the concentrations of PAEs in soils and cereal grains compared with groundwater irrigation. The concentrations of PAEs in the soils in this study were relatively high compared with the results obtained from other locations. DnBP and DEHP were the most abundant contaminants in all soil samples and most crop samples. Each individual PAE in all soil samples was far below the recommended soil cleanup objectives, indicating that no remediation measures were required in this study area. The concentrations of the PAEs, DnBP and DEHP in cereal grains were lower than those of the reference doses.
There was no significant effect of reclaimed irrigation water on the growth characteristics and grain yields of winter wheat (p > 0.05), while the effect of reclaimed irrigation water on summer maize was influenced by climate. The BCFs of BBP were the highest (1.41~35.75), followed by DMP and DEHP. There were no significant effects of reclaimed irrigation water on the BCFs of cereal grains.
The total carcinogenic risk and non-carcinogenic risk of PAEs for adults and children were within the acceptable ranges. DHEP was the dominant contributor to the two risks. The intake of cereals was the main exposure pathway for both risks, followed by soil ingestion and dermal contact. Soil inhalation contributed the least to the total risk.
In this study, there were no significant effects of reclaimed irrigation water on the contamination risk of PAEs compared with groundwater irrigation. The results of this study are based on a two-year experiment, and the PAEs will be in the soil for several years. Therefore, further long-term studies are required to evaluate the long-term effects of reclaimed irrigation water on the contamination risk posed by PAEs.
Author Contributions
H.L. and G.H. conceived and designed the experiments; H.G., C.L. and L.Z. performed the experiments; Y.L. and Q.H. analyzed the data and wrote the paper.
Funding
This research was supported by the National Natural Science Foundation of China (51339007), the National Key Research and Development Program of China (2016YFC0403105), and Beijing Postdoctoral Research Foundation (2017-ZZ-093).
Acknowledgments
The authors gratefully acknowledge the staff of the Tongzhou Experimental Base for their support during our field experiments.
Conflicts of Interest
The authors declare no conflict of interest.
References
- Guo, Y.; Wang, L.; Kannan, K. Phthalates and parabens in personal care products from China: Concentrations and human exposure. Arch. Environ. Contam. Toxicol. 2014, 66, 113–119. [Google Scholar] [CrossRef] [PubMed]
- Singh, S.; Li, S.S. Epigenetic effects of environmental chemicals bisphenol a and phthalates. Int. J. Mol. Sci. 2012, 13, 10143–10153. [Google Scholar] [CrossRef] [PubMed]
- Hens, G.A.; Caballos, A.M.P. Social and economic interest in the control of phthalic acid esters. Trends Anal. Chem. 2003, 22, 847–857. [Google Scholar] [CrossRef]
- Mckee, R.H.; Butala, J.H.; David, R.M.; Gans, G. NTP center for the evaluation of risks to human reproduction reports on phthalates: Addressing the data gaps. Reprod. Toxicol. 2004, 18, 1–22. [Google Scholar] [CrossRef] [PubMed]
- United States Environmental Protection Agency (USEPA). Effluent Guidelines Home, Toxic and Priority Pollutants under the Clean Water Act. Priority Pollutants. Available online: https://www.epa.gov/eg/toxic-and-priority-pollutants-under-clean-water-act#modifications (accessed on 6 June 2016).
- Spillmann, D.M.; Siegrist, M.; Keller, C.; Wormuth, M. Phthalate exposure through food and consumers’ risk perception of chemicals in food. Risk Anal. 2009, 29, 1170–1181. [Google Scholar] [CrossRef] [PubMed]
- Zeng, F.; Cui, K.Y.; Xie, Z.Y.; Wu, L.N.; Liu, M.; Sun, G.Q.; Lin, Y.J.; Luo, D.L.; Zeng, Z.X. Phthalate esters (PAEs): Emerging organic contaminants in agricultural soils in peri-urban areas around Guangzhou, China. Environ. Pollut. 2008, 156, 425–434. [Google Scholar] [CrossRef] [PubMed]
- Cheng, X.M.; Ma, L.L.; Xu, D.D.; Cheng, H.X.; Yang, G.S.; Luo, M. Mapping of phthalate esters in suburban surface and deep soils around a metropolis-Beijing, China. J. Geochem. Explor. 2015, 155, 56–61. [Google Scholar] [CrossRef]
- He, L.Z.; Gielen, G.; Bolan, N.S.; Zhang, X.K.; Qin, H.; Huang, H.G.; Wang, H.L. Contamination and remediation of phthalic acid esters in agricultural soils in China: A review. Agron. Sustain. Dev. 2015, 35, 519–534. [Google Scholar] [CrossRef]
- Zhang, Y.; Wang, P.J.; Wang, L.; Sun, G.Q.; Zhao, J.Y.; Zhang, H.; Du, N. The influence of facility agriculture production on phthalate esters distribution in black soils of northeast China. Sci. Total Environ. 2015, 506–507, 118–125. [Google Scholar] [CrossRef] [PubMed]
- Wu, W.; Hu, J.; Wang, J.Q.; Chen, X.R.; Yao, N.; Tao, J.; Zhou, Y.K. Analysis of phthalate esters in soils near an electronics manufacturing facility and from a non-industrialized area by gas purge microsyringe extraction and gas chromatography. Sci. Total Environ. 2015, 508, 445–451. [Google Scholar] [CrossRef] [PubMed]
- Xia, X.H.; Yang, L.Y.; Bu, Q.W.; Liu, R.M. Levels, distribution, and health risk of phthalate esters in urban soils of Beijing, China. J. Environ. Qual. 2011, 40, 1643–1651. [Google Scholar] [CrossRef] [PubMed]
- Kong, S.F.; Ji, Y.Q.; Liu, L.L.; Chen, L.; Zhao, X.Y.; Wang, J.J.; Bai, Z.P.; Sun, Z.R. Diversities of phthalate esters in suburban agricultural soils and wasteland soil appeared with urbanization in China. Environ. Pollut. 2012, 170, 161–168. [Google Scholar] [CrossRef] [PubMed]
- Škrbić, B.D.; Ji, Y.Q.; Mladenović, D.N.; Zhao, J. Occurrence of the phthalate esters in soil and street dust samples from the Novi Sad city area, Serbia, and the influence on the children’s and adults’ exposure. J. Hazard. Mater. 2016, 312, 272–279. [Google Scholar] [CrossRef] [PubMed]
- Sun, J.T.; Pan, L.L.; Tsang, D.C.W.; Li, Z.H.; Zhu, L.Z.; Li, X.D. Phthalate esters and organochlorine pesticides in agricultural soils and vegetables from fast-growing regions: A case study from eastern China. Environ. Sci. Pollut. Res. 2016, 25, 34–42. [Google Scholar] [CrossRef] [PubMed]
- Tran, B.C.; Teil, M.J.; Blanchard, M.; Alliot, F.; Chevreuil, M. Fate of phthalates and BPA in agricultural and non-agricultural soils of the Paris area (France). Environ. Sci. Pollut. Res. 2015, 22, 11118–11126. [Google Scholar] [CrossRef] [PubMed]
- Cai, Q.Y.; Mo, C.H.; Wu, Q.T.; Zeng, Q.Y. Polycyclic aromatic hydrocarbons and phthalic acid esters in the soil-radish (Raphanus sativus) system with sewage sludge and compost application. Bioresour. Technol. 2008, 99, 1830–1836. [Google Scholar] [CrossRef] [PubMed]
- Gibson, R.; Wang, M.J.; Padgett, E.; Beck, A.J. Analysis of 4-nonylphenols, phthalates, and polychlorinated biphenyls in soils and biosolids. Chemosphere 2005, 61, 1336–1344. [Google Scholar] [CrossRef] [PubMed]
- Li, K.K.; Ma, D.; Wu, J.; Chai, C.; Shi, Y.X. Distribution of phthalate esters in agricultural soil with plastic film mulching in Shandong Peninsula, East China. Chemosphere 2016, 164, 314–321. [Google Scholar] [CrossRef] [PubMed]
- Li, C.; Chen, J.Y.; Wang, J.H.; Han, P.; Luan, Y.X.; Ma, X.P.; Lu, A.X. Phthalate esters in soil, plastic film, and vegetable from greenhouse vegetable production bases in Beijing, China: Concentrations, sources, and risk assessment. Sci. Total Environ. 2016, 568, 1037–1043. [Google Scholar] [CrossRef] [PubMed]
- Vikelsøe, J.; Thomsen, M.; Carlsen, L. Phthalates and nonylphenols in profiles of differently dressed soils. Sci. Total Environ. 2002, 296, 105–106. [Google Scholar] [CrossRef]
- Wang, J.; Chen, G.C.; Christie, P.; Zhang, M.Y.; Luo, Y.M.; Teng, Y. Occurrence and risk assessment of phthalate esters (PAEs) in vegetables and soils of suburban plastic film greenhouses. Sci. Total Environ. 2015, 523, 129–137. [Google Scholar] [CrossRef] [PubMed]
- Wang, J.; Luo, Y.M.; Teng, Y.; Ma, W.T.; Christie, P.; Li, Z.G. Soil contamination by phthalate esters in Chinese intensive vegetable production systems with different modes of use of plastic film. Environ. Pollut. 2013, 180, 265–273. [Google Scholar] [CrossRef] [PubMed]
- Xu, G.; Li, F.S.; Wang, Q.H. Occurrence and degradation characteristics of dibutyl phthalate (DBP) and di-(2-ethylhexyl) phthalate (DEHP) in typical agricultural soils of China. Sci. Total Environ. 2008, 393, 333–340. [Google Scholar] [CrossRef] [PubMed]
- Chen, C.Q.; Li, J.; Chen, P.P.; Ding, R.; Zhang, P.F.; Li, X.Q. Occurrence of antibiotics and antibiotic resistances in soils from wastewater irrigation areas in Beijing and Tianjin, China. Environ. Pollut. 2014, 193, 94–101. [Google Scholar] [CrossRef] [PubMed]
- Tan, W.B.; Zhang, Y.; He, X.S.; Xi, B.D.; Gao, R.T.; Mao, X.H.; Huang, C.H.; Zhang, H.; Li, D.; Liang, Q.; et al. Distribution patterns of phthalic acid esters in soil particlesize fractions determine biouptake in soil-cereal crop systems. Sci. Rep. 2016, 6, 31987. [Google Scholar] [CrossRef] [PubMed]
- Singh, P.K.; Deshbhratar, P.B.; Ramteke, D.S. Effects of sewage wastewater irrigation on soil properties, crop yield and environment. Agric. Water Manag. 2012, 103, 100–104. [Google Scholar] [CrossRef]
- Sun, J.T.; Pan, L.L.; Zhan, Y.; Lu, H.N.; Tsang, D.C.W.; Liu, W.X.; Wang, X.L.; Li, X.D.; Zhu, L.Z. Contamination of phthalate esters, organochlorine pesticides and polybrominated diphenyl ethers in agricultural soils from the Yangtze River Delta of China. Sci. Total Environ. 2016, 544, 670–676. [Google Scholar] [CrossRef] [PubMed]
- Mo, C.H.; Cai, Q.Y.; Tang, S.R.; Zeng, Q.Y.; Wu, Q.T. Polycyclic aromatic hydrocarbons and phthalic acid esters in vegetables from nine farms of the Pearl River Delta, South China. Arch. Environ. Contam. Toxicol. 2009, 56, 181–189. [Google Scholar] [CrossRef] [PubMed]
- US EPA (United States Environmental Protection Agency). Mid Atlantic Risk Assessment. Regional Screening Level (RSL) Summary Table; US EPA (United States Environmental Protection Agency): Washington, DC, USA, 2013.
- US EPA. Supplement Guidance for Developing Soil Screening Levels for Superfound Sites[EB/OL]. 2002. Available online: http://www.epa.gov/superfund/health/conmedia/soil/pdfs/ssg-main.pdf (accessed on 8 October 2010).
- RAIS (Risk Assessment Information System). Risk Exposure Models for Chemicals User’s Guide[EB/OL]; Department of Energy: Washington, DC, USA, 2013. Available online: http://rais.ornl.gov/tools/rais-chemical-risk-guide.html (accessed on 20 August 2016).
- Shao, L.Y.; Niu, H.Y.; He, T.; Li, H.; Fang, J.H. Distribution of the pathalate esters in PM10 of northwestern urban area in Beijing. Environ. Eng. 2009, 27, 300–303. (In Chinese) [Google Scholar] [CrossRef]
- Kong, S.F.; Ji, Y.Q.; Liu, L.L.; Chen, L.; Zhao, X.Y.; Wang, J.J.; Bai, Z.P.; Sun, Z.R. Spatial and temporal variation of phthalic acid esters (PAEs) in atmospheric PM10 and PM2.5 and the influence of ambient temperature in Tianjin, China. Atmos. Environ. 2013, 74, 199–208. [Google Scholar] [CrossRef]
- Niu, L.L.; Xu, Y.; Xu, C.; Yun, L.X.; Liu, W.P. Status of phthalate esters contamination in agricultural soils across China and associated health risks. Environ. Pollut. 2014, 195, 16–23. [Google Scholar] [CrossRef] [PubMed]
- Daňková, R.; Jarošová, A.; Poláková, Š. Monitoring of phthalates in Moravian agricultural soil in 2011 and 2012. Mendelnet 2013, 563–567. Available online: https://mnet.mendelu.cz/mendelnet2013/articles/44_dankova_798.pdf?id=798&file=44_dankova_798.pdf (accessed on 25 July 2018).
- Peijnenburg, W.J.G.M.; Struijs, J. Occurrence of phthalate esters in the environment of The Netherlands. Ecotoxicol. Environ. Saf. 2006, 63, 204–215. [Google Scholar] [CrossRef] [PubMed]
- Zeng, F.; Cui, K.Y.; Xie, Z.Y.; Wu, L.N.; Luo, D.L.; Chen, L.X.; Lin, Y.J.; Liu, M.; Sun, G.X. Distribution of phthalate esters in urban soils of subtropical city, Guangzhou, China. J. Hazard. Mater. 2009, 164, 1171–1178. [Google Scholar] [CrossRef] [PubMed]
- Cartwright, C.D.; Thompson, I.P.; Burns, R.G. Degradation and inpact of phthalate plasticizers on soil microbial communities. Environ. Toxicol. Chem. 2000, 19, 1253–1261. [Google Scholar] [CrossRef]
- Staples, C.A.; Peterson, D.R.; Parkerton, T.F.; Adams, W.J. The environmental fate of phthalate esters: A literature review. Chemosphere 1997, 35, 667–749. [Google Scholar] [CrossRef]
- New York State Department of Environmental Conservation. SVOCs Determination of Soil Cleanup Objectives and Cleanup Levels. Appendix A of TAGM# 4046[OL]. Available online: http://www.dec.state.ny.us/website/dertagm s/prtg4046.html (accessed on 4 April 2003).
- New York State Department of Environmental Conservation. CP-51/Soil Cleanup Guidance. 2010. Available online: http://www.dec.ny.gov/docs/remediation_hudson_pdf/cpsoil.pdf (accessed on 6 June 2016).
- Li, Y.; Liu, H.J.; Huang, G.H. The effect of N rates on yields and nitrogen use efficiencies during four years of wheat-maize rotation cropping seasons. Agron. J. 2016, 108, 2076–2088. [Google Scholar] [CrossRef]
- You, L.Z.; Rosegrant, M.W.; Wood, S.; Sun, D.S. Impact of growing season temperature on wheat productivity in China. Agric. For. Meteorol. 2009, 149, 1009–1014. [Google Scholar] [CrossRef]
- Qiu, S.J.; Ju, X.T.; Lu, X.; Li, L.; Streck, J.I.T.; Christie, P.; Zhang, F.S. Improved nitrogen management for an intensive winter wheat/summer maize double-cropping system. Soil Sci. Soc. Am. J. 2012, 76, 286–297. [Google Scholar] [CrossRef]
- Liang, B.; Zhao, W.; Yang, X.Y.; Zhou, J.B. Fate of nitrogen-15 as influenced by soil and nutrient management history in a 19-year wheat-maize experiment. Field Crops Res. 2013, 144, 126–134. [Google Scholar] [CrossRef]
- Balafas, D.; Shaw, K.J.; Whitfield, F.B. Phthalate and adipate esters in Australian packaging materials. Food Chem. 1999, 65, 279–287. [Google Scholar] [CrossRef]
- EFSA (European Food Safety Authority). Bis(2-ethylhexyl) phthalate (DEHP) for use in food contact materials. EFSA J. 2005, 243, 1–20. [Google Scholar]
- EFSA (European Food Safety Authority). Di-butylphthalate (DBP) for use in food contact materials. EFSA J. 2005, 242, 1–17. [Google Scholar]


© 2018 by the authors. Licensee MDPI, Basel, Switzerland. This article is an open access article distributed under the terms and conditions of the Creative Commons Attribution (CC BY) license (http://creativecommons.org/licenses/by/4.0/).