Article

Cooling Water Sufficiency in a Warming World: Projection Using an Integrated Assessment Model and a Global Hydrological Model

1
Center for Global Environmental Research, National Institute for Environmental Studies, 305-8506 Tsukuba, Japan
2
Department of Environmental Engineering, Kyoto University, 615-8540 Kyoto, Japan
3
Department of Civil and Environmental Engineering, Tokyo Institute of Technology, 152-8552 Tokyo, Japan
4
Center for Regional Environmental Research, National Institute for Environmental Studies, 305-8506 Tsukuba, Japan
*
Author to whom correspondence should be addressed.
Water 2018, 10(7), 872; https://doi.org/10.3390/w10070872
Submission received: 25 May 2018 / Revised: 26 June 2018 / Accepted: 28 June 2018 / Published: 30 June 2018
(This article belongs to the Section Water, Agriculture and Aquaculture)

Abstract

:
Thermoelectric power plants in inland regions use primarily riverine water for cooling. The future availability of riverine water will be affected by climatic change. Power generation is expected to grow throughout the 21st century, accompanied by growth in cooling water demand. We estimated cooling water sufficiency globally under the Shared Socioeconomic Pathway 2 scenario with and without climate mitigation throughout the 21st century (2006–2099) at a spatial resolution of 0.5° × 0.5°. We used the Asia-Pacific Integrated Model Computable General Equilibrium Model (AIM/CGE) to project future thermoelectric cooling-water requirements in 17 global regions with no hydrological constraint on water availability, and the H08 global hydrological model to assess whether consumptive water requirements could be met under particular spatiotemporal and hydrological constraints. The results show that cooling water sufficiency will decrease by 7.9% and 11.4% in 2040–2069 (11.3% and 18.6% in 2070–2099) with and without climate mitigation, respectively. A distinct difference was found between with and without climate mitigation in the Middle East and Africa. The predicted insufficiency was attributable primarily to changes in river flow regimes, particularly a general decrease in low flow levels, and to increased water requirements for thermoelectric power generation and other sectors. The results imply that the growing water demand projected by AIM/CGE will not be fulfilled sustainably in many parts of the world, hence considerable additional efforts of reducing water consumption will be required to secure electric power supply. This confirms the importance of coupling integrated assessment models and global hydrological models for consistent water-energy nexus analyses.

1. Introduction

Cooling is an indispensable process in thermal power generation, and water is the primary coolant in use today [1]. Typically, the sources of cooling water are seawater in coastal areas and streamflow for inland power stations. In contrast to seawater, streamflow is limited in availability [2]. Hence, water use for cooling may conflict with other purposes, such as irrigation, manufacturing, municipal water supply, and maintenance of the aquatic environment [3]. Furthermore, streamflow is part of the hydrological cycle and thus will be affected by global climate change in the future [4,5,6,7]. In addition to the limited availability of streamflow, its temperature is important, as many countries have environmental regulations requiring stream temperature to be maintained below a threshold in order to protect riverine ecosystems [2]. Securing sufficient cooling water to meet increasing energy requirements under a changing climate is one of the major challenges of this century [1,3].
Cooling water shortage under global climate-change conditions has been studied extensively in individual basins [8,9,10] and countries [11,12,13,14]. A few pioneering studies have assessed this issue at continental and global scales. One major approach employs a macroscale hydrological model to investigate the hydrological constraints on cooling water availability. van Vliet et al. [4] developed a global hydrological model to assess the availability of cooling water for 96 power plants in the US and Europe, showing that climate change would reduce streamflow and increase stream temperature in summer. Consequently, water availability for thermoelectric cooling fell below the required level during some periods each year. van Vliet et al. [5] expanded their work globally, finding that the usable capacity of 81–86% of thermoelectric power plants worldwide would be reduced. Bartos and Chester [6] assessed the impacts of climate change on 978 electric power stations, including thermoelectric plants, in the western US, and found a reduction in the average summer generation capacity by several percent, which would be exacerbated several-fold under 10-year drought conditions. Miara et al. [7] performed plant-based and regional assessments in the contiguous US and found that the substantial expected capacity reduction would be buffered by regional reserve margins (i.e., excess capacity). Although these studies successfully quantified the impact of climate change on cooling water availability, they fixed water requirements for thermoelectric cooling and others (e.g., irrigation, manufacturing, municipality) at the present level throughout simulation periods which may result in considerable underestimation of the impact.
Another approach involves the use of integrated assessment models to investigate the cooling water requirements accompanying changes in electricity demand, advancement of technology, and shifting of fuels. Kyle et al. [15] projected global cooling water withdrawal and consumption under various socioeconomic scenarios, including several greenhouse gas (GHG) emission mitigation targets, and technology improvement assumptions using an integrated assessment model called the Global Change Assessment Model. They found that despite the five- to seven-fold expansion of electricity generation from 2005 to 2095, global electric-sector water withdrawals will remain surprisingly stable as consumptive use grows considerably, due mainly to the shift from open-loop (e.g., once-through cooling) to closed-loop (e.g., cooling tower) technology. Fricko et al. investigated several technological pathways to achieve the 2 degrees Celsius target and not inflating water demand [16]. Although these studies successfully reflected the variations in energy and water demands and technologies adopted in the future, they lack hydrological assessments on the water availability for satisfying the water requirement for future electricity production under changing climate conditions. The next challenge is to integrate these two approaches for consistent assessment of global cooling water availability.
In this study, we present a comprehensive global cooling water sufficiency (CWS) assessment to investigate whether the increasing cooling water requirement will be fulfilled in sustainable manner during the 21st century. This study was carried out by using the Asia-Pacific Integrated Model Computable General Equilibrium model (AIM/CGE) [17] and the H08 global hydrological model [18,19]. We estimated the water requirements for thermoelectric cooling and manufacturing in 17 regions of the world at annual intervals during the 21st century using the AIM/CGE model while accounting for growth in electricity demand and advances in technology. The water requirements for other sectors were taken from earlier projections [20,21]. Then, we assessed whether sufficient cooling water would be available based on daily river flows at a spatial resolution of 0.5° × 0.5° under changing climate and socioeconomic conditions.
The rest of this paper is organized as follows. The methodology is described in Section 2. The results and discussion are presented in Section 3. Finally, the conclusions drawn are highlighted in Section 4.

2. Materials and Methods

2.1. Model

The AIM/CGE is a recursive dynamic computable general equilibrium model that was designed primarily for climate policy assessment [17,22]. It divides the world into 17 regions and includes 42 industrial sectors, of which 11 are related to electricity generation. Seven of these sectors use thermal fuel types (coal-fired, oil-fired, gas-fired, nuclear, geothermal, waste biomass, and advanced biomass power generation) and four are non-thermal (hydroelectric, photovoltaic, wind, and other renewable-energy power generation).
In addition to the economic activities (e.g., inputs, outputs, and value added) of each industry, the AIM/CGE model estimates the volume of water required (in terms of withdrawal and consumption) for sector-specific economic activities. The water requirements of manufacturing sectors are estimated by multiplying the value added by the sector-specific water intensity [21]. For power generation sectors, that quantity is estimated by multiplying electricity generation by technology-specific water intensity, which reflects the type of cooling system and energy source [23]. Please note that Carbon Capture and Storage (CCS) technology is available for fossil fueled thermal power plants which require additional water consumption.
The H08 [18,19] is a global hydrological model that includes explicit expressions of major human interventions, such as water abstraction and reservoir operation. The spatial resolution of the global simulation is 0.5° × 0.5° and the calculation interval is 1 day. The H08 model consists of four primary sub-models. The land surface hydrology sub-model calculates the energy and water balances at the land surface, and estimates hydrological variables such as evapotranspiration, soil moisture, and runoff. The river routing sub-model tracks runoff through a global digital river network and estimates daily streamflow. The crop sub-model estimates crop growth in croplands worldwide and the associated irrigation water requirements at daily intervals. The water abstraction sub-model represents abstraction of water from streamflow to meet consumptive water requirements, and the subsequent reduction in streamflow. Water is abstracted based on use type, in the order of municipal, manufacturing, thermoelectric cooling, and irrigation. Water abstraction begins upstream without consideration of downstream water requirements. When streamflow is depleted, water abstraction falls below the required level. Further details of these sub-models are presented in Hanasaki et al. [18,19], along with model validation. The H08 model requires daily gridded global climate data and consumptive water requirement data for the study period.
So-called the one-way coupling approach was taken to combine two models. It means that the simulation of AIM/CGE was conducted first, and the results were used as the input data for H08 (Figure 1). Please note that the output of H08 was not used for AIM/CGE in this study.

2.2. Data

To conduct simulations using the AIM/CGE and H08 models, we prepared various input data (Figure 1). To conduct AIM/CGE simulation, we set baseline socioeconomic conditions, such as gross domestic product, population, and implementation of climate mitigation policies. In this study, we used the Shared Socioeconomic Pathways (SSP) 2 scenario, which depicts the world under a moderate level of economic development [24]. SSP consists of storylines and quantitative socio-economic indicators including GDP, population, total electricity production, and others covering the period of 2005–2100 (https://tntcat.iiasa.ac.at/SspDb/).
To conduct H08 simulation of cooling water abstraction, we prepared water requirements and related auxiliary data globally with 0.5° × 0.5° spatial resolution at daily intervals from 2006 to 2099. Consumptive water requirements included four sectors: irrigation, municipal, manufacturing, and power generation. The daily irrigation water requirement was estimated in the H08 model. The primary factors that determine the consumptive irrigation water requirement are climate, irrigated area, and crop intensity (i.e., number of harvests per year). To determine irrigated area and crop intensity, we used the global scenario prepared by Hanasaki et al. [20], which provides grid-based annual projections of these factors for five SSP scenarios. Consumptive water requirements for municipal use were obtained from the same source.
To estimate the consumptive water requirements for manufacturing and cooling, we utilized AIM/CGE simulation results. Please note that projection of Hanasaki et al. [20] was not used here because it does not subdivide industrial water into manufacturing and cooling purposes. To convert the results for 17 regions into gridded data, we prepared two spatial datasets. One includes gridded population density in 2005 [25], and the other is the spatial distribution of power plants in 2005 based on a global geospatial dataset at spatial resolution of 0.5° × 0.5° developed by Ando et al. [23], who used primarily the 2012 version of the World Electric Power Plants database [26]. This dataset is an inventory of 90,000 power generators worldwide, including technical specifications such as the name, electricity generation capacity, energy source, and cooling system type. Because it lacks location information, this dataset was combined with the geographic coordinates of 60,000 power plants from the Carbon Monitoring for Action database [27]. As neither database specifies the water source, the authors assumed that thermal power plants located within two grid cells (approximately 100 km) of the shore used seawater, while all others used freshwater.
Daily gridded global meteorological data were based on climate scenarios developed for the Inter-Sectoral Impact Model Intercomparison Project [28]. The scenario covers the globe with a spatial resolution of 0.5° × 0.5° at daily intervals over the period of 1950–2099. For the future period (2006–2099), we used projections from five global climate models (GCMs): MIROC-ESM-CHEM, NorES1-M, IPSL-CM5A-LR, GFDL-ESM2M, and HadGEM2-ES under the Representative Concentration Pathways (RCP) 2.6 (low emission) and RCP8.5 (high emission) scenarios. The latter is comparable to SSP2 without implementation of climate mitigation policies (i.e., business as usual (BAU)).

2.3. Simulation and Analyses

Simulation was conducted in three steps (Figure 1). First, we conducted AIM/CGE simulation under the SSP2 socioeconomic assumption with implementation of two different climate mitigation policies. One policy was BAU, in which no GHG emission constraint was applied. The other policy was climate mitigation (MIT), in which GHG emissions were strictly constrained to be consistent with RCP 2.6. The AIM/CGE model enables constraint of GHG emissions through the application of carbon pricing. With carbon pricing in place, all industries (including energy generation) shift toward lower GHG emissions (e.g., electricity generation fueled by nuclear, hydroelectric, photovoltaic, and wind power becomes cost-competitive with that by fossil fuels). In estimating the water needed for thermoelectric cooling, we also adopted the assumption that cooling systems would be updated from open-loop to closed-loop technology at a rate of 0.4% year–1 until 90% of all systems used closed-loop technology [23]. These simulations resulted in the output of technology-specific cooling water requirements for 17 regions at annual intervals without consideration of water constraints. Similarly, water requirements for the manufacturing sector were also obtained under two scenarios. In addition, the estimated cooling and manufacturing water requirements were interpolated spatially, weighted by the fuel-specific capacity of power plants in 2005 and the population density, respectively. With the exception of irrigation, daily variations in water requirements were ignored, and usage was assumed to be constant throughout the year. Thirdly, using water requirement scenarios and meteorological data based on five GCMs for the two RCPs, a total of 10 global hydrological simulations was conducted for the period of 2006–2099. These results provided estimates of cooling water abstraction globally at a spatial resolution of 0.5° × 0.5° and daily intervals.
To evaluate the sufficiency of cooling water, we introduced the CWS index. CWS is defined as the ratio of the accumulation of daily water abstraction for consumptive use for cooling (ACC) to the water requirement (RCC) for a specific year:
C W S y = A C C y , m , d /   R C C y , m , d   ( A C C y , m , d R C C y , m , d ) ,
where y, m, d, and Σ denote the year, month, day, and the sum of daily ACC and RCC for a certain year, respectively. Please note that ACCy,m,d does not exceed RCCy,m,d because excess water abstraction for cooling is seldom carried out in practice. When CWSy falls below unity, a cooling water shortage is indicated. CWS is useful for assessment of the sufficiency of cooling water for thermoelectric power generation, including daily variations in water availability. Earlier researchers have devised similar indexes using different terminology (e.g., usable capacity [4]). Stream temperature was not used as a constraint in this study.
At present, cooling water insufficiency seldom constrains power generation anywhere in the world, except during extreme drought and heat-wave events (e.g., 2003 European heat wave [2]). Thus, CWSy must be very close to unity, at least at the beginning of the simulation period. CWSy, however, falls below unity in the H08 simulation from the beginning due to uncertainties in the data and simulation. To focus on changes in CWS, we applied an adjustment to CWSy (ACWSy) which is inspired by a classical technique to correct air temperature bias in climate projections [29]:
A C W S y = ( C W S y C W S 2006 ) + 1 .

3. Results and Discussion

The primary objective of this study was to investigate CWS using the ACWS index (Equation (2)). Prior to determining this index (Section 3.3), we identified changes in water requirements (Section 3.1) and hydrology (Section 3.2) during the 21st century, which are the primary drivers of changes in the index.

3.1. Water Requirement

3.1.1. Continental Perspective

Figure 2a shows projected global consumptive water use under the BAU scenario. The majority of global water consumption is for irrigation. The fraction used for power generation is limited, ranging from 1.6% (2006) to 4.5% (2099) globally. For all sectors except manufacturing, water consumption increases during the 21st century. The increase in water use for power generation is due mainly to the growth of power generation and the transition from open-loop to closed-loop cooling which is accompanied by intensive water consumption [23].
Figure 2b–f shows projected water use in five regions of the world: Asia, Latin America (LAM), the Middle East and Africa (MAF), Organization for Economic Cooperation and Development (OECD) member countries as of 1990 (OECD90), and countries with transitional economies (REF). Water consumption in Asia accounts for more than 50% of the global total. Because the amount of water used for irrigation and manufacturing in this region is considerably large, power generation makes up a limited fraction. In LAM, as in Asia, the fraction of water used for power generation is quite limited, mainly because hydropower is the dominant technology employed for power generation in this region. Among the five regions, water consumption is projected to grow the most in MAF. Water consumption for thermoelectric cooling is predicted to grow 7.7-fold between 2006 and 2099. In OECD90, water for thermal power generation is projected to increase constantly throughout the 21st century. Although the fraction of water used for power generation was only 4.6% in 2006, it is projected to grow to 10.8% in 2099. In REF, the fraction of thermal power generation exceeds 6% throughout the 21st century. Because the majority of power plants are located inland, thermal power relies mainly on streamflow for cooling.

3.1.2. Local Perspective

Figure 3a shows the global distribution of consumptive water requirements for thermoelectric power cooling in the base period (2006–2025). Water consumption is distributed highly unevenly. Substantial volumes are required in the eastern US, central and western Europe, India, and eastern China. In all other regions, water consumption is distributed sparsely. Figure 3b shows changes in water consumption in the future period (2080–2099) compared with the base period for the BAU scenario. Intensive growth is seen in central and western Europe, while moderate growth is present in the eastern US and India. These changes reflect the AIM/CGE simulation results from the analysis of 17 regions. Interestingly, water consumption in eastern China decreases, due mainly to rapid shift away from preoccupation with coal-fueled power plants toward mixture of multiple fuel types together with improvements in overall efficiency in the country.

3.2. Water Availability

3.2.1. Continental Perspective

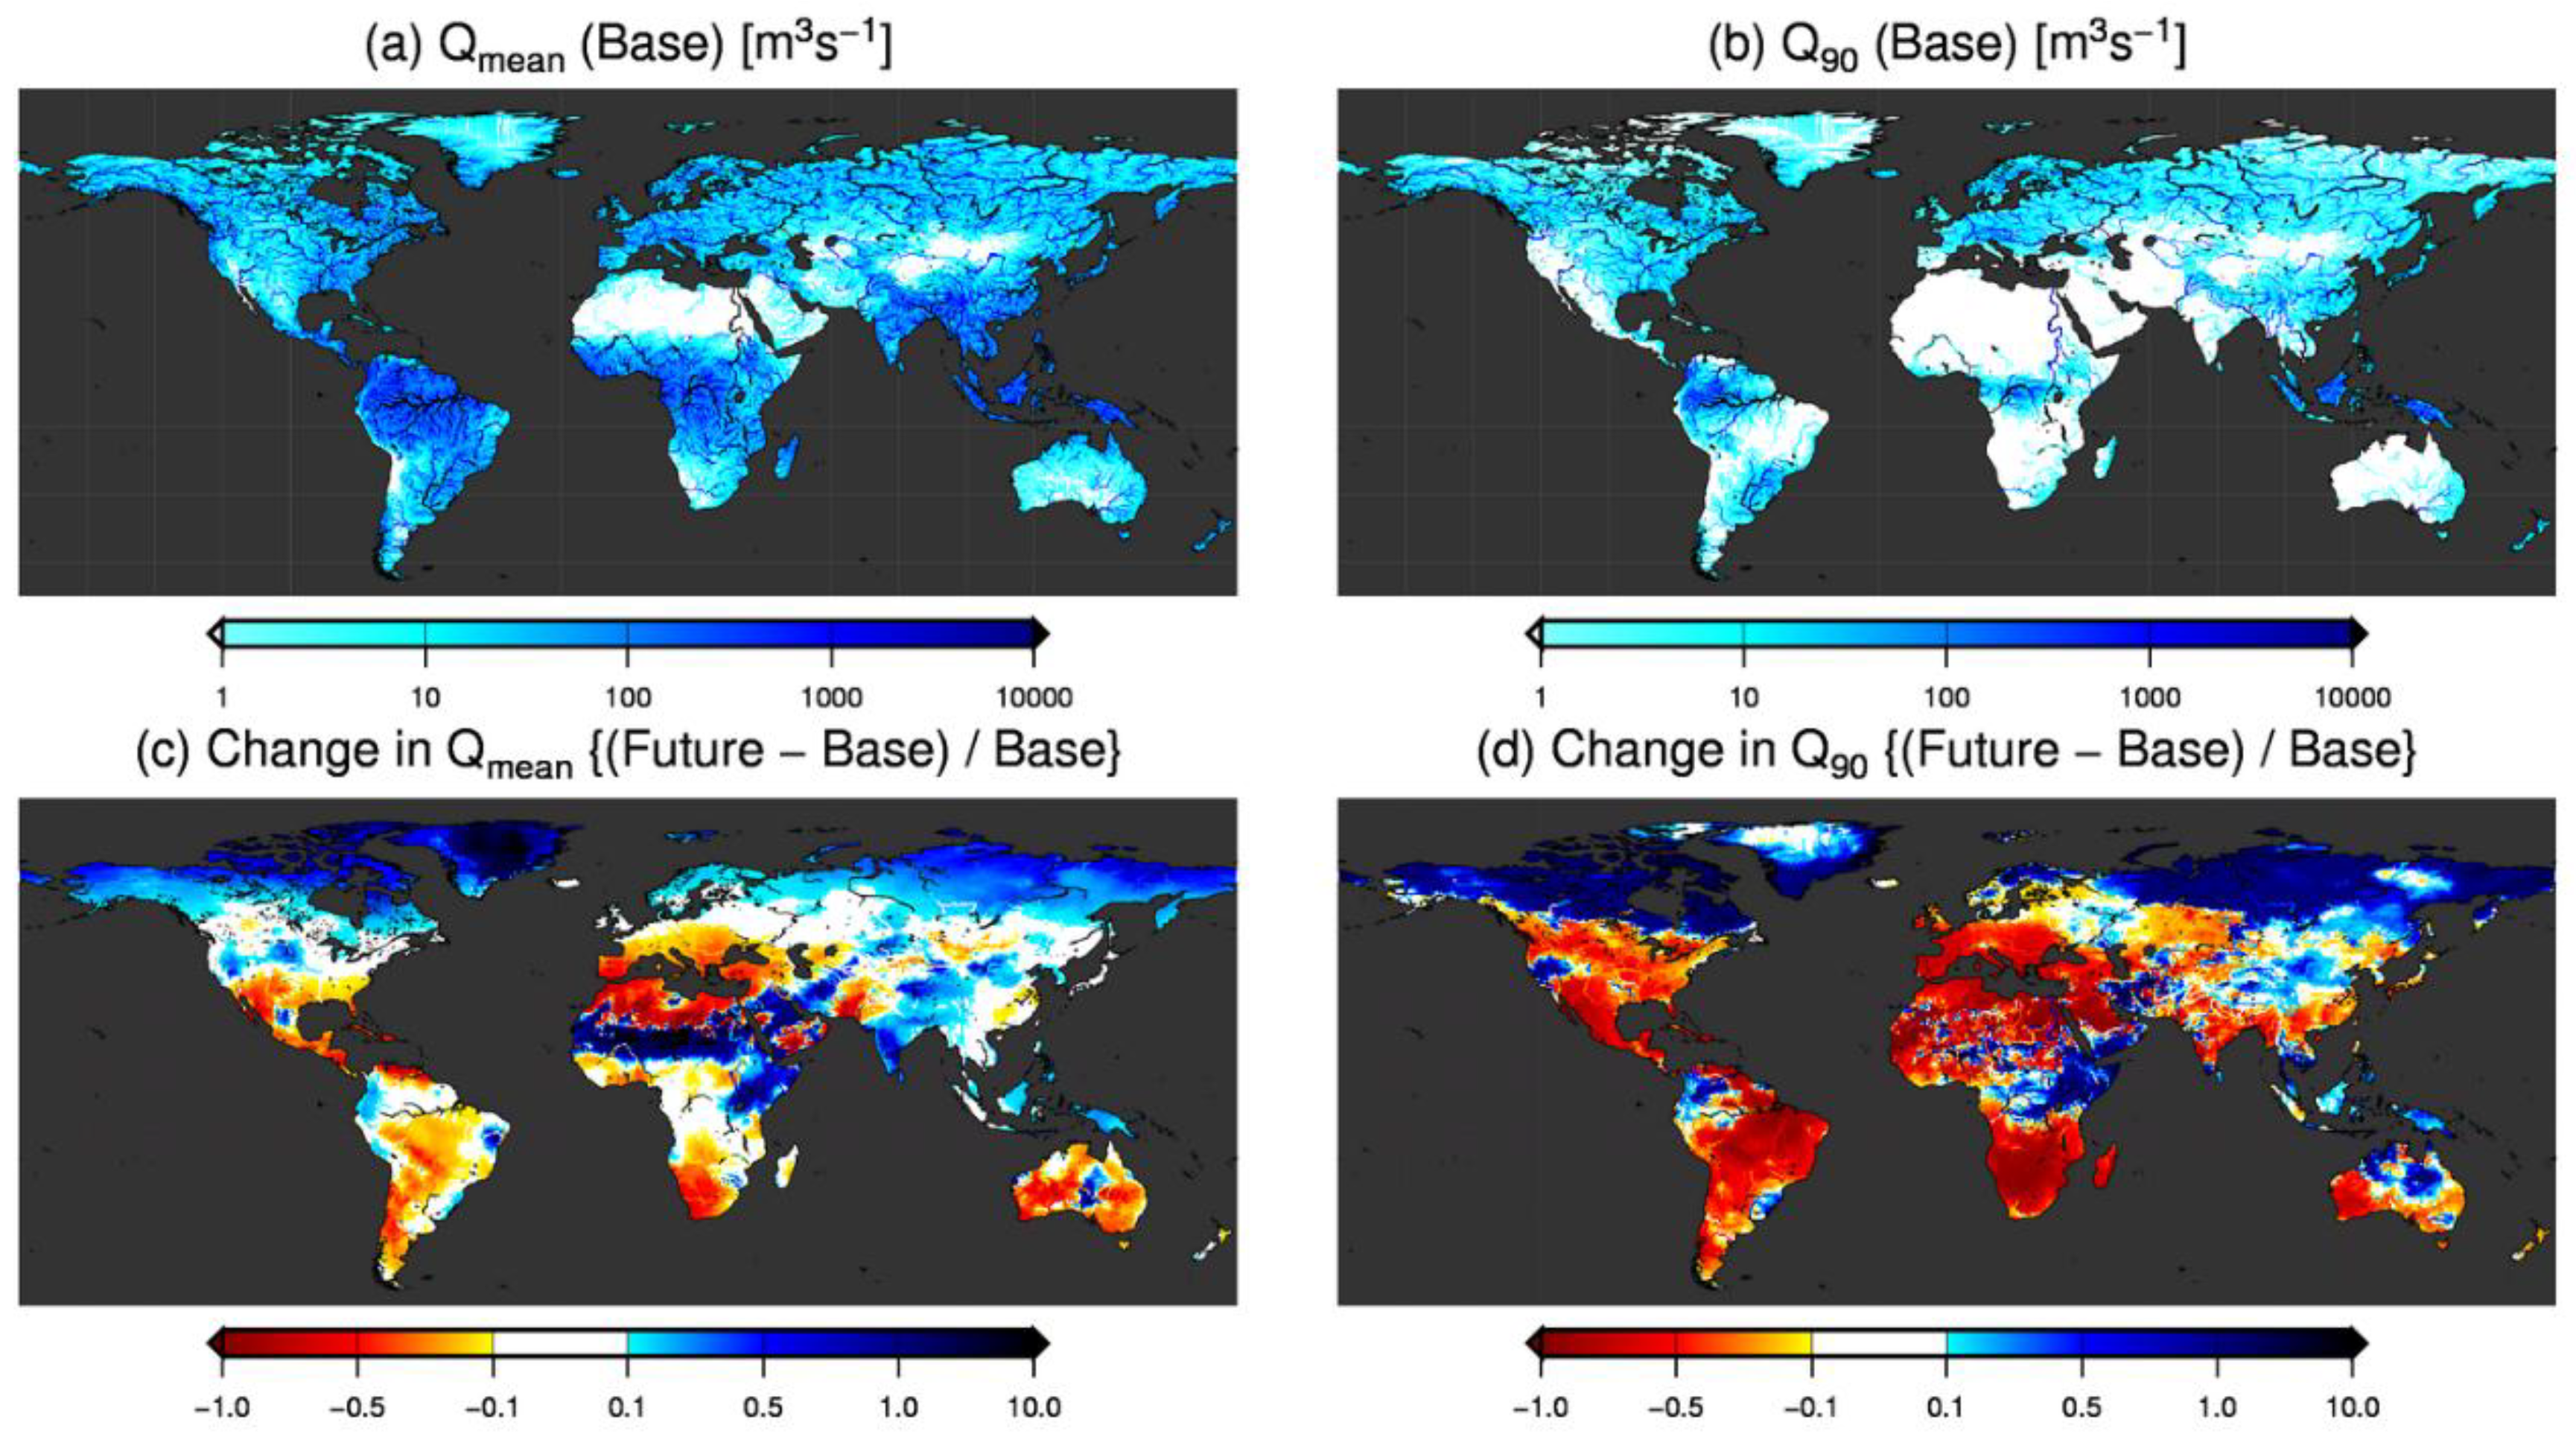
Figure 4a,b show the mean annual streamflow (Qmean) and the 90th percentile daily streamflow (Q90; daily streamflow exceeds this value for 328 days of the year) for the base period (2006–2025). Qmean shows substantial regional differences (e.g., it is generally high at low latitudes and low at middle latitudes). The spatial pattern of Q90 (Figure 4b) largely overlaps with that of Qmean, while the area where Q90 < 1 m3·s–1 is expanded substantially. Attention should be paid to the Indian Subcontinent, the Indochina Peninsula, and low latitudes in Africa near the equator. Because of the distinct contrast between rainy and dry seasons in these regions, Q90 is quite limited despite Qmean being relatively large. Because thermoelectric cooling water is required throughout the year, low flows, typically represented by Q90, provide key information for the analysis of changes in the ACWS index.
Figure 4c,d show the changes in Qmean and Q90 between the base and future periods under the BAU scenario. The change in Qmean is largely positive at high northern latitudes; in some parts of southern, central, and southeastern Asia; and in part of equatorial Africa. Qmean is projected to decrease in other areas. The geographical pattern of change in Q90 does not always align with that of Qmean: Q90 may decrease in regions where Qmean increases (e.g., northern Indian Subcontinent). Globally, Q90 will decrease except at high northern latitudes and in inland China, the eastern equatorial region of Africa, and some other limited regions.

3.2.2. Local Perspective

In addition to the continental-scale patterns of change in Qmean and Q90, local-scale effects were present. First, the river network plays an important role. River channels accumulate and transfer streamflow, causing heterogeneity in water availability based on the river network shape (i.e., grid cells containing main stems or vast catchment areas have high flow, see Figure 4a,b). Second, there are factors such as the operation of reservoirs and the buffering effect of river channels. The change in Q90 can be altered substantially through reservoir operation. Figure 5a,b shows the monthly streamflow above and below the Fort Peck Dam of the Missouri River. Above the dam, streamflow decreases under both climate scenarios, but the decrease in flow is more severe for the BAU scenario. Below the dam, the variations in low flow are largely buffered and the difference between with and without climate mitigation is largely diminished.
As a general hydrological property, larger catchment areas exhibit less variation in streamflow. Figure 5c,d shows data for the Salween River, a major continental river with no major dam in its mainstream. In the upstream portion of the Salween River (at 95°E 25°N, catchment area of 11,200 km2), low flow falls below 10 m3·s–1. At a downstream point (95°E 20°N, catchment area of 114,000 km2) where the catchment area is about 10 times larger than at the upstream site, it greatly exceeds 100 m3·s–1. These findings clearly indicate that reservoirs and catchment area influence the quantity and stability of local water availability, eventually affecting the ACWS index (Equations (1) and (2)).

3.3. Cooling Water Sufficiency

Figure 6a shows the change in global ACWS during the 21st century. To quantify the uncertainties in selected GCMs, we performed experiments using five GCMs individually and then calculated the median changes under the MIT and BAU scenarios. In 2040–2069 (hereafter the 2050s), ACWS was reduced by 7.9% (5th–95th percentile range among total 150 years of simulations, 1.3–13.9%) under the MIT scenario and by 11.4% (6.1–17.9%) under BAU globally. The range of results represents uncertainty due to GCM selection and inter-annual variations in climate during the period.
ACWS in five regions is shown in Figure 6b–f. These results show a decrease in ACWS in all five regions during the 21st century that is consistent among all 10 GCMs tested. The magnitude of the change in ACWS varied among regions. Asia shows the largest reductions in ACWS, of 16.3% (4.7–25.2%) in the MIT scenario and 11.6% (0.9–25.3%) in the BAU scenario. On the other hand, REF has smaller reductions of 4.6% (−3.6–12.8%) under the MIT scenario and 9.5% (2.9–18.9%) under BAU. Moderate decreases are projected in OECD90, LAM, and MAF, with reduction rates of 5.5% (MIT, −3.8–12.0%) and 7.1 (BAU, −1.8–15.6%) in OECD90, 11.5% (MIT, 0.4–23.4%) and 7.2% (BAU, −1.9–15.9%) in LAM, and 4.9% (MIT, −5.2–18.2%;) and 14.0% (BAU, 0.8–23.7%) in MAF.
The reduction of ACWS under BAU is greater than under the MIT scenario for most regions and periods. As exceptions, the ACWS reductions under the MIT scenario are greater in Asia and LAM, due mainly to increases in precipitation and runoff related to climate change together with more intensive adoption of CCS which requires extra water.
ACWS reduction in the future is attributable to two factors. First, water requirements are expected to increase (Section 3.1). As shown in Figure 2 and Figure 3, considerable increases in future cooling water consumption, along with consumption by other sectors (except for the manufacturing sector in some regions), are expected during the 21st century, particularly in developing regions such as Asia, LAM, and MAF. This finding suggests that decreased ACWS increases the risk of water conflicts among sectors. The second factor is a decrease in low flow worldwide (indicated by a change in Q90; Figure 4d). In this study, ACWS was estimated by accumulating the daily water abstraction amounts for thermoelectric cooling, and hence decreased during low flow periods.
Table 1 lists the results of earlier studies of CWS and selected simulation conditions or the primary factors that cause the differences among studies. All studies reported the CWS reduction in around 2050 for low- and high-end climate scenarios (except Miara et al. [7]). Two studies reported global (i.e., more than one countries) results at the spatial resolution of 0.5° × 0.5°, while other two did for US at 0.125° × 0.125° and finer. The key methodological advantages of this study to earlier ones are that it incorporated the growth in electricity demand and the abstraction of other sectors. On the contrary, the key disadvantages are lack in the treatment of individual power plants and stream temperature.
Although the methodologies used differ considerably among studies, our estimation falls within the range of earlier works. To make our study comparable with earlier works, we also extracted results for the US and EU25 from the 17 AIM/CGE regions, because some earlier works have reported results separately for these regions. Our study showed that the median global ACWS drops by 7.9% and 11.4% under the MIT and BAU scenarios, respectively, in the 2050s; these values are slightly greater than but generally consistent with the estimates of van Vliet et al. [5], who reported 7% and 12% in the 2050s. Our study showed that the median ACWS reduction in the US drops by 4.8% and 9.0% during this period, which falls within the range of earlier studies [4,6,7] reporting values between 2.4% and 16.0%.

3.4. Uncertainties and Limitations

This study has some uncertainties and limitations, primarily from the modeling, projections of water requirements, and socioeconomic conditions. In modeling, firstly, we focused solely on consumptive use of cooling water in this study. Other factors may also play important roles in cooling water shortages. For open-loop cooling, water withdrawal and stream temperature are important factors. Water withdrawal (i.e., consumption and return flow) is greater than consumption by two orders of magnitude [30] with the use of this cooling technology, and the return flow is subject to environmental regulations against thermal pollution, providing another direct constraint on thermoelectric generation [7]. Although the consumptive volume would be insignificant and the number of plants with this type of cooling is projected to decrease over time, insufficiency for water withdrawal may be a serious obstacle to operation of such power plants [4,5,6,7]. For closed-loop cooling, although the availability of water for consumptive use is the primary constraint, air temperature and humidity also influence cooling efficiency [7]. Secondly, we modeled CWS in grid cells, not for individual power plants. Therefore, plant-specific factors, such as the volume of water actually required, were not included in this analysis. Indeed, cooling water requirements differ considerably among plants with similar technologies and capacities [30]. Finally, we fixed the order or priority of water abstraction. In particular, we noted that cooling water accounts for a small portion of the entire water requirement. Estimated cooling water insufficiency is attributed largely to abstraction for other sectors, particularly irrigation, in the same grid cells and upstream of the power plants. Reduction of irrigation abstraction would readily alleviate cooling water insufficiency.
For projections of water use, firstly, we distributed fuel-specific cooling water consumption values that were proportional to the distribution of power plants in this study, and that were fixed at the level from 2005. This method eventually concentrates the water requirement into a limited number of grid cells where plants are currently located (Figure 3). Indeed, one straightforward method to avoid cooling water shortages is to locate thermal power plants near the shore as often as possible. The extent of the shift from a riverine to seawater source is one assumption with the most influence on the final results. Because consumption depends on the locations of energy-intensive industries and cities, and improvements in efficiency of electricity transmission (i.e., how far electricity can be transferred inland), further holistic and detailed energy predictions are needed. Secondly, we tested various assumptions for the consumptive water requirement of thermal power plants. This factor is highly uncertain, as it is highly dependent on global socioeconomic growth [17], technological advancements in power generation [15], and policies implemented for water saving and climate mitigation [11]. Finally, we assumed that the cooling water requirement was constant throughout a year. Electricity demand varies in annual and diurnal patterns, and the temporal dynamics of water requirements may exacerbate water insufficiency.
Regarding climatic and socioeconomic projections, firstly, we employed only five GCMs in this study. Although all individual GCM experiments showed reductions in ACWS, the projected changes varied considerably among models (Figure 6). This variability can be attributed primarily to the considerable differences in temperature and precipitation among GCMs. More GCM experiments are needed to further clarify the uncertainties in ACWS projections. Secondly, we assessed only SSP2 in this study. Due to energy demands, the technological assumptions differ substantially among SSPs [17,21], and the requirements for cooling water (as well as water for irrigation and industrial and municipal use) also differ. Finally, we assessed only two climate policy options in this study, namely, BAU and MIT (equivalent to RCP2.6). Because climate policies are diverse, more policy options should be assessed toward obtaining more practical implications.

4. Conclusions

In this study, we projected thermoelectric CWS globally under SSP2 socioeconomic scenarios and two distinct climate conditions (MIT and BAU). The results show that CWS decreases constantly through the 21st century in all regions. The reduction in global ACWS was estimated as 7.9% and 11.4% for the MIT and BAU scenarios in the 2050s, and as 11.3% and 18.6%, respectively, in the 2080s. The estimated insufficiency was attributed primarily to the changes in river flow regimes, in particular a general decrease in low flow and increased water requirements for thermoelectric power generation and other sectors.
To investigate cooling water insufficiency for the power generation sector, a wide range of socioeconomic interactions and detailed spatiotemporal water dynamics must be tracked. Coupling the AIM/CGE global energy-economic model (also called the integrated assessment model) and the H08 global hydrological model, which includes major human activities, proved to be useful for the investigation of such problems. The former model is founded on economics, and offers advantages in estimating future cooling water requirements that are consistent with socioeconomic demands, market dynamics, technological assumptions, and GHG emission constraints, but has the disadvantage of coarse spatiotemporal resolution. The latter model is founded on physics, and has the advantage of capturing the dynamics of water at a fine spatiotemporal resolution. This study demonstrated how these two different model types can be linked and can reinforce each other, and described the remaining challenges. Such model linkage will enable us to better investigate the effects of climate policy from multiple viewpoints (e.g., tradeoffs between mitigation and adaptation, climate target and water security).
The effects of thermoelectric cooling water insufficiency will propagate through the socioeconomic system. To investigate these effects, estimated ACWS should be input into the integrated assessment model. The economic influence of thermoelectric cooling will be elucidated in further studies.

Author Contributions

N.H. and S.F. conceived of and designed the experiments; S.Y. compiled geographic data; N.H. and S.F. performed the experiments; Q.Z. and N.H. analyzed the data; and Q.Z., N.H., S.K., and T.O. wrote the paper.

Acknowledgments

This work was supported by the Environment Research and Technology Development Fund (S-14) of the Ministry of the Environment of Japan. This work was partly conducted within the framework of the NIES Climate Change Adaptation Research Program.

Conflicts of Interest

The authors declare no conflict of interest.

References

  1. King, C.W.; Holman, A.S.; Webber, M.E. Thirst for energy. Nat. Geosci. 2008, 1, 283. [Google Scholar] [CrossRef]
  2. Boogert, A.; Dupont, D. The nature of supply side effects on electricity prices: The impact of water temperature. Econ. Lett. 2005, 88, 121–125. [Google Scholar] [CrossRef]
  3. Schaeffer, R.; Szklo, A.S.; Pereira de Lucena, A.F.; Moreira Cesar Borba, B.S.; Pupo Nogueira, L.P.; Fleming, F.P.; Troccoli, A.; Harrison, M.; Boulahya, M.S. Energy sector vulnerability to climate change: A review. Energy 2012, 38, 1–12. [Google Scholar] [CrossRef]
  4. Van Vliet, M.T.H.; Yearsley, J.R.; Ludwig, F.; Vogele, S.; Lettenmaier, D.P.; Kabat, P. Vulnerability of us and european electricity supply to climate change. Nat. Clim. Change 2012, 2, 676–681. [Google Scholar] [CrossRef]
  5. Van Vliet, M.T.H.; Wiberg, D.; Leduc, S.; Riahi, K. Power-generation system vulnerability and adaptation to changes in climate and water resources. Nat. Clim. Change 2016, 6, 375–380. [Google Scholar] [CrossRef]
  6. Bartos, M.D.; Chester, M.V. Impacts of climate change on electric power supply in the western United States. Nat. Clim. Change 2015, 5, 748. [Google Scholar] [CrossRef]
  7. Miara, A.; Macknick, J.E.; Vörösmarty, C.J.; Tidwell, V.C.; Newmark, R.; Fekete, B. Climate and water resource change impacts and adaptation potential for us power supply. Nat. Clim. Change 2017, 7, 793. [Google Scholar] [CrossRef]
  8. Koch, H.; Vögele, S. Dynamic modelling of water demand, water availability and adaptation strategies for power plants to global change. Ecol. Econ. 2009, 68, 2031–2039. [Google Scholar] [CrossRef]
  9. Förster, H.; Lilliestam, J. Modeling thermoelectric power generation in view of climate change. Reg. Environ. Change 2010, 10, 327–338. [Google Scholar] [CrossRef]
  10. Koch, H.; Vögele, S.; Kaltofen, M.; Grünewald, U. Trends in water demand and water availability for power plants—Scenario analyses for the german capital berlin. Clim. Change 2012, 110, 879–899. [Google Scholar] [CrossRef]
  11. Feeley, T.J.; Skone, T.J.; Stiegel, G.J.; McNemar, A.; Nemeth, M.; Schimmoller, B.; Murphy, J.T.; Manfredo, L. Water: A critical resource in the thermoelectric power industry. Energy 2008, 33, 1–11. [Google Scholar] [CrossRef] [Green Version]
  12. Chandel, M.K.; Pratson, L.F.; Jackson, R.B. The potential impacts of climate-change policy on freshwater use in thermoelectric power generation. Energy Policy 2011, 39, 6234–6242. [Google Scholar] [CrossRef]
  13. Clemmer, S.; Rogers, J.; Sattler, S.; Macknick, J.; Mai, T. Modeling low-carbon us electricity futures to explore impacts on national and regional water use. Environ. Res. Lett. 2013, 8, 015004. [Google Scholar] [CrossRef]
  14. Macknick, J.; Sattler, S.; Averyt, K.; Clemmer, S.; Rogers, J. The water implications of generating electricity: Water use across the United States based on different electricity pathways through 2050. Environ. Res. Lett. 2012, 7, 045803. [Google Scholar] [CrossRef]
  15. Kyle, P.; Davies, E.G.R.; Dooley, J.J.; Smith, S.J.; Clarke, L.E.; Edmonds, J.A.; Hejazi, M. Influence of climate change mitigation technology on global demands of water for electricity generation. Int. J. Greenh. Gas Control 2013, 13, 112–123. [Google Scholar] [CrossRef]
  16. Fricko, O.; Parkinson, S.C.; Johnson, N.; Strubegger, M.; van Vliet, M.T.H.; Riahi, K. Energy sector water use implications of a 2 °C climate policy. Environ. Res. Lett. 2016, 11, 034011. [Google Scholar] [CrossRef] [Green Version]
  17. Fujimori, S.; Hasegawa, T.; Masui, T.; Takahashi, K.; Herran, D.S.; Dai, H.; Hijioka, Y.; Kainuma, M. Ssp3: Aim implementation of shared socioeconomic pathways. Global Environ. Change 2017, 42, 268–283. [Google Scholar] [CrossRef]
  18. Hanasaki, N.; Kanae, S.; Oki, T.; Masuda, K.; Motoya, K.; Shirakawa, N.; Shen, Y.; Tanaka, K. An integrated model for the assessment of global water resources—Part 1: Model description and input meteorological forcing. Hydrol. Earth Syst. Sci. 2008, 12, 1007–1025. [Google Scholar] [CrossRef]
  19. Hanasaki, N.; Kanae, S.; Oki, T.; Masuda, K.; Motoya, K.; Shirakawa, N.; Shen, Y.; Tanaka, K. An integrated model for the assessment of global water resources—Part 2: Applications and assessments. Hydrol. Earth Syst. Sci. 2008, 12, 1027–1037. [Google Scholar] [CrossRef]
  20. Hanasaki, N.; Fujimori, S.; Yamamoto, T.; Yoshikawa, S.; Masaki, Y.; Hijioka, Y.; Kainuma, M.; Kanamori, Y.; Masui, T.; Takahashi, K.; et al. A global water scarcity assessment under shared socio-economic pathways—Part 1: Water use. Hydrol. Earth Syst. Sci. 2013, 17, 2375–2391. [Google Scholar] [CrossRef]
  21. Fujimori, S.; Hanasaki, N.; Masui, T. Projections of industrial water withdrawal under shared socioeconomic pathways and climate mitigation scenarios. Sustain. Sci. 2017, 12, 275–292. [Google Scholar] [CrossRef]
  22. Fujimori, S.; Tu, T.T.; Masui, T.; Matsuoka, Y. Aim/Cge [Basic] Manual; Center for Social and Environmental Systems Research, National Institute for Environmental Studies: Tsukuba, Japan, 2012; p. 74. [Google Scholar]
  23. Ando, N.; Yoshikawa, S.; Fujimori, S.; Kanae, S. Long-term projections of global water use for electricity generation under the shared socioeconomic pathways and climate mitigation scenarios. Hydrol. Earth Syst. Sci. Discuss. 2017, 2017, 1–25. [Google Scholar] [CrossRef]
  24. Van Vuuren, D.P.; Riahi, K.; Calvin, K.; Dellink, R.; Emmerling, J.; Fujimori, S.; Kc, S.; Kriegler, E.; O’Neill, B. The shared socio-economic pathways: Trajectories for human development and global environmental change. Global Environ. Change 2017, 42, 148–152. [Google Scholar] [CrossRef]
  25. Center for International Earth Science Information Network (CIESIN) Columbia University; Centro Internacional de Agricultura Tropical (CIAT). Gridded Population of the World Version 3 (Gpwv3): Population Grids; Socioeconomic Data and Applications Center (SEDAC) Columbia University: Palisades, NY, 2005. [Google Scholar]
  26. S & P Platts. World Electric Power Plants Database. Available online: https://www.platts.com/products/world-electric-power-plants-database (accessed on 30 June 2018).
  27. CARMA (Carbon Monitoring for Action). Power Plants. Available online: http://carma.org/ (accessed on 30 June 2018).
  28. Hempel, S.; Frieler, K.; Warszawski, L.; Schewe, J.; Piontek, F. A trend-preserving bias correction—The isi-mip approach. Earth Syst. Dynam. 2013, 4, 219–236. [Google Scholar] [CrossRef]
  29. Hanasaki, N.; Fujimori, S.; Yamamoto, T.; Yoshikawa, S.; Masaki, Y.; Hijioka, Y.; Kainuma, M.; Kanamori, Y.; Masui, T.; Takahashi, K.; et al. A global water scarcity assessment under shared socio-economic pathways—Part 2: Water availability and scarcity. Hydrol. Earth Syst. Sci. 2013, 17, 2393–2413. [Google Scholar] [CrossRef]
  30. Macknick, J.; Newmark, R.; Heath, G.; Hallett, K.C. Operational water consumption and withdrawal factors for electricity generating technologies: A review of existing literature. Environ. Res. Lett. 2012, 7, 045802. [Google Scholar] [CrossRef]
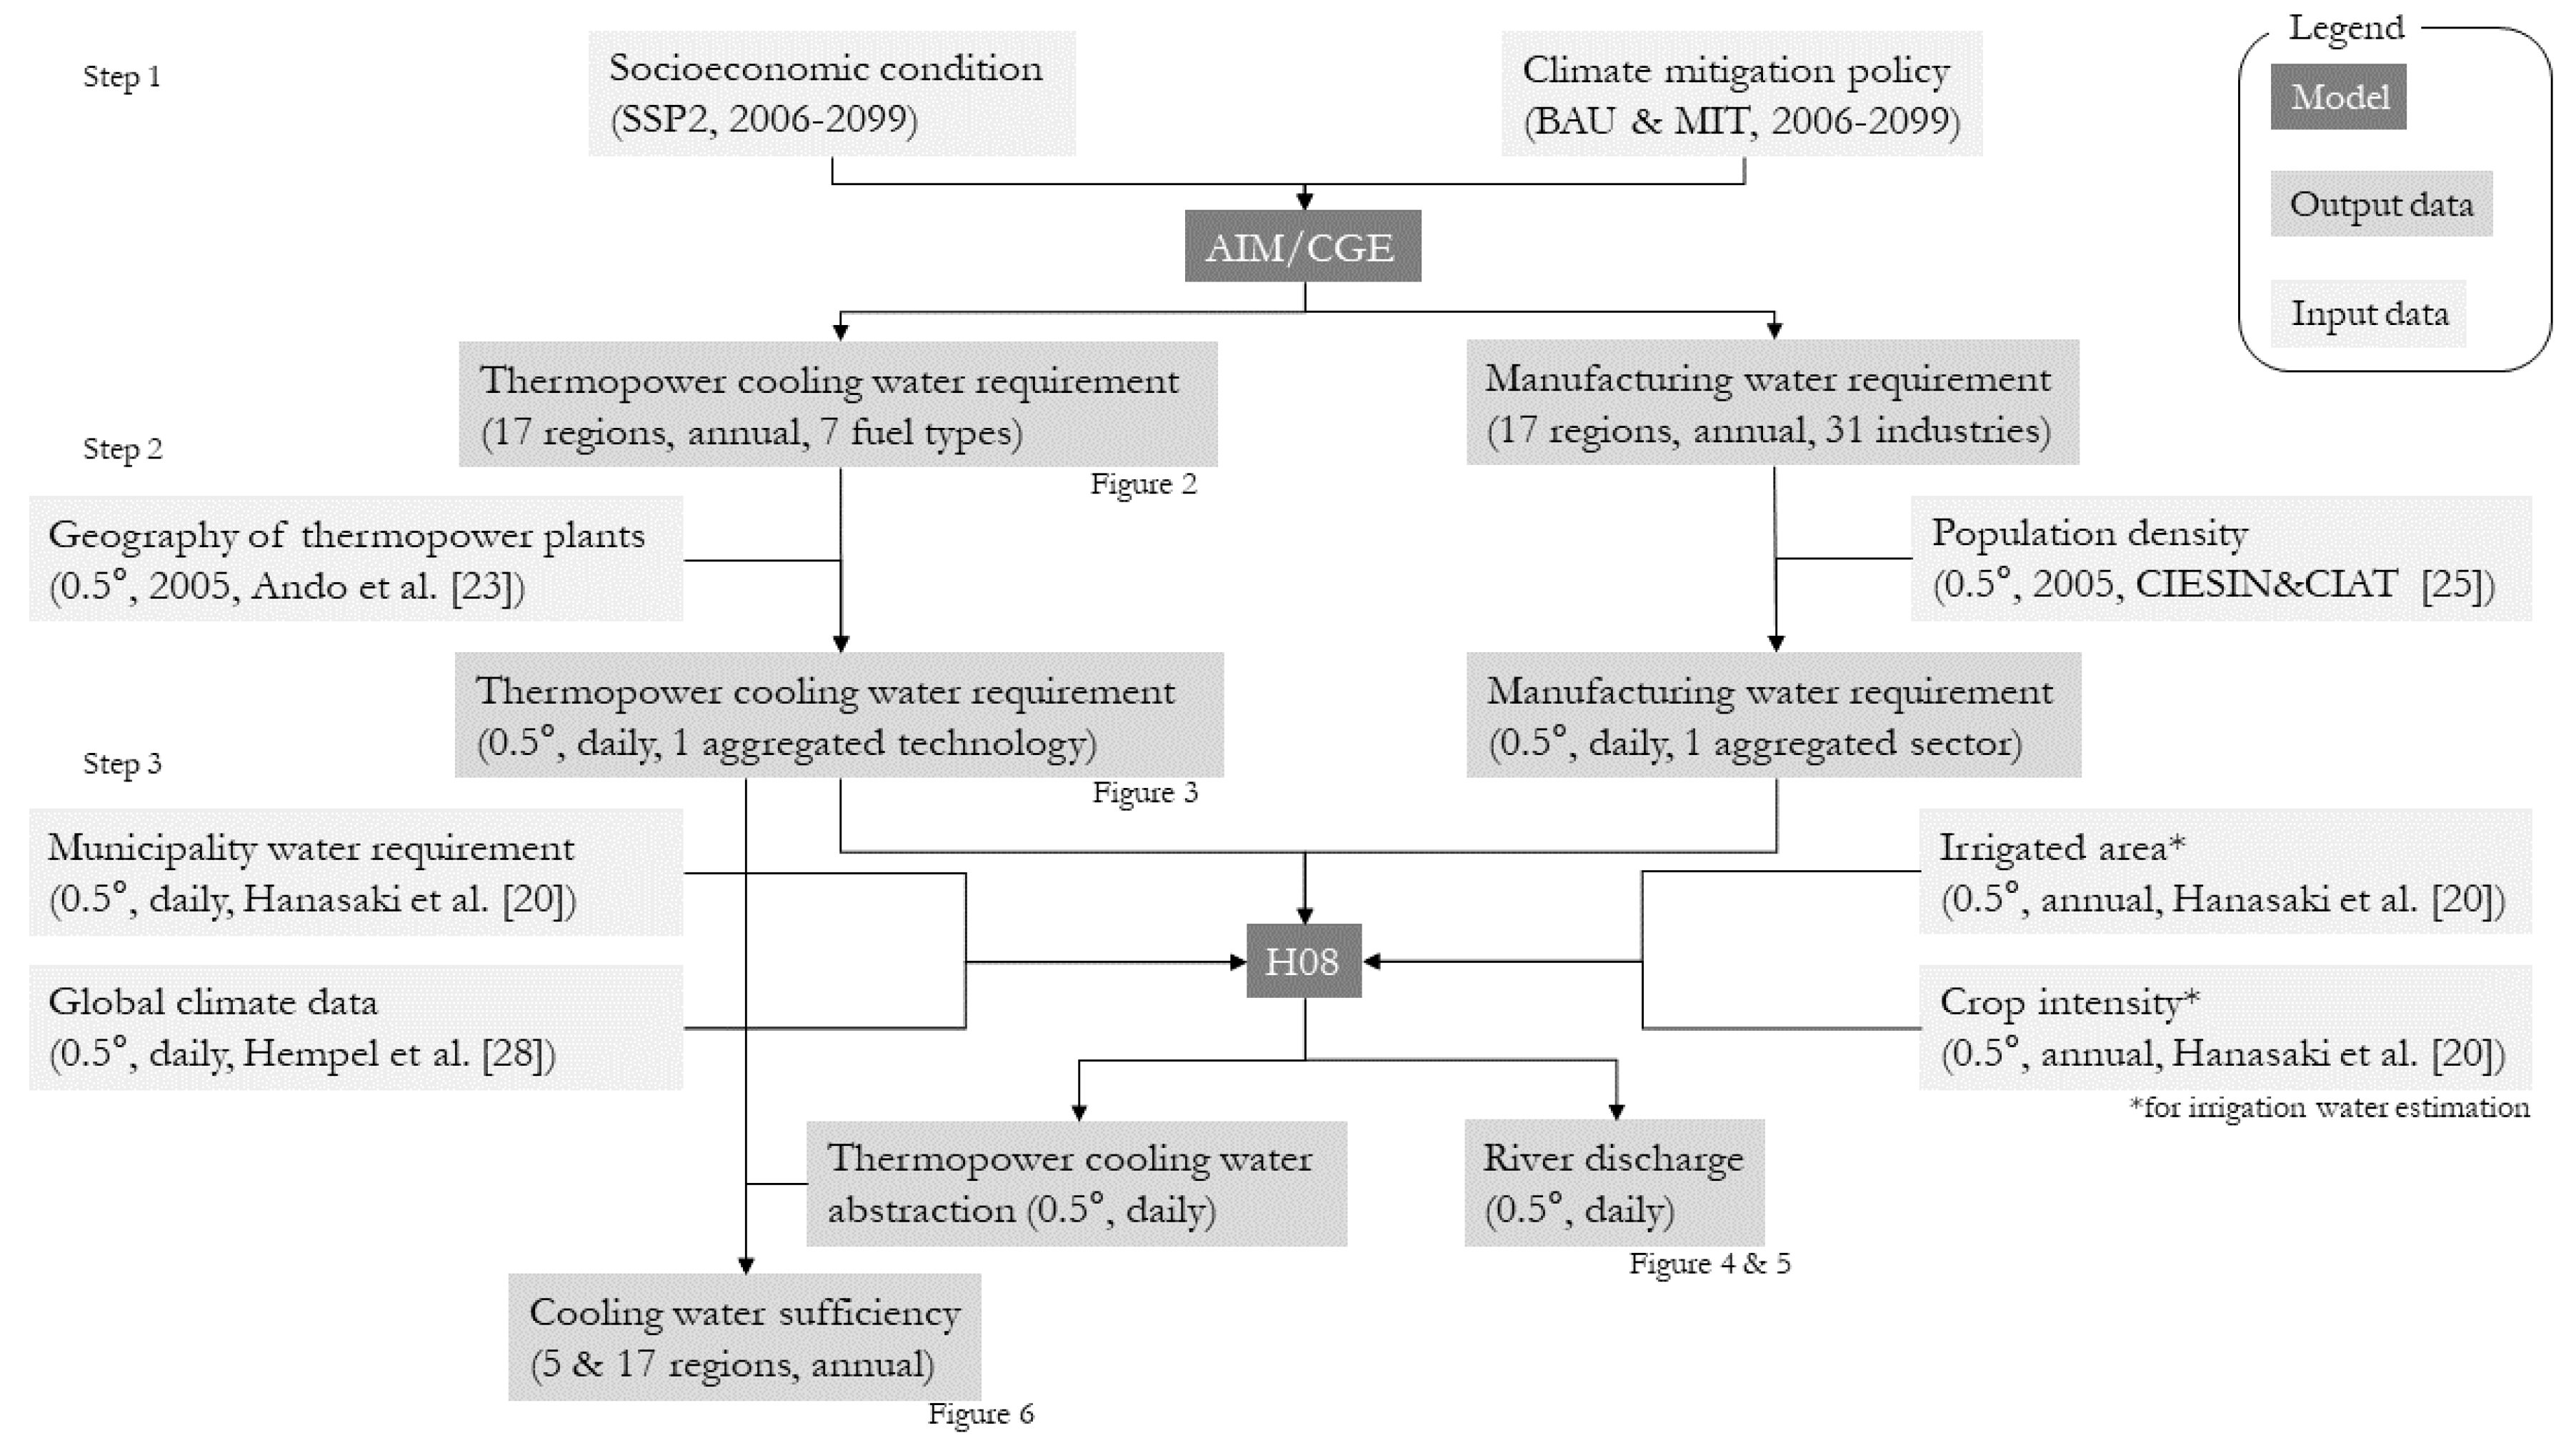
Figure 1. Schematic diagram of data flow. SSP, BAU, and MIT stand for Shared Socioeconomic Pathways, business as usual, and mitigation, respectively.
Water 10 00872 g001
Figure 2. Consumptive water requirements for (a) global total, (b) Asia, (c) Latin America (LAM), (d) Middle East and Africa (MAF), (e) OECD member countries as of 1990 (OECD90), and (f) countries with transitional economies (REF) under the BAU scenario.
Water 10 00872 g002
Figure 3. Distribution of consumptive water use for thermal power generation. (a) Distribution of consumptive water use in 2006. (b) Distribution of the change (rate) in consumptive water use in the future period (2080–2099) compared to the base period (2006–2025) for the BAU scenario.
Water 10 00872 g003
Figure 4. (a) Mean annual streamflow (Qmean) and (b) 90th percentile daily streamflow (Q90) during the base period (2006–2025). Changes in (c) Qmean and (d) Q90 between the base period and future (2080–2099) under the BAU scenario. The results of ensemble mean of five GCMs are shown.
Water 10 00872 g004
Figure 5. Mean monthly flow (a) above and (b) below the Fort Peck Dam of the Missouri River, and in (c) upstream (95°E 25°N) and downstream (95°E 20°N) reaches of the Salween River. Please note that a logarithmic vertical axis is used for (c) and (d). Black, blue, and red lines show the base period (2006–2025), the future period (2080–2099) under the MIT scenario, and BAU scenario, respectively. The results of MIROC-ESM-CHEM are shown.
Water 10 00872 g005
Figure 6. Sufficiency in thermal power cooling water (a) globally, and in (b) Asia, (c) Latin America (LAM), (d) the Middle East and Africa, (e) OECD, and (f) countries with transitional economies (REF).
Water 10 00872 g006
Table 1. Earlier global estimates of reduction in CWS due to climate change and selected simulation conditions.
Van Vliet et al. [4]Van Vliet et al. [5]Bartos and Chester [6]Miara et al. [7]This study
DomainUS and EUGlobalWestern USUSGlobal
Spatial resolution0.50.50.1250.050.5
Time2040s (2031–2060)2050s (2040–2069)2050s (2040–2060)2050s (2035–2064)2050s (2040–2069)
ScenariosSRES B1 & A2RCP 2.6 & 8.5SRES B1, A1, A2RCP 8.5RCP2.6 & 8.5
ConstraintsStreamflow, stream temperatureStreamflow, stream temperatureStreamflow, stream temperature, air temperature, humidityStreamflow, stream temperature, air temperature, humidityStreamflow
CWS calculationFor 96 individual plantsFor 1427* individual plantsFor 978 individual plantsFor 1080 individual plantsAt grid cells
Cooling water requirementFixed at presentFixed at present, five adaptation optionsFixed at presentFixed at presentDemand growth according to SSP2
Water abstraction of other sectorsNoNoNoNoIrrigation, manufacturing, municipal
Reduction in CWS4.4–16% (US)
6.3–19% (EU)
7.0–12% (global, 2050s)1.4–3.5% (western US)2.4 % (US)7.9–11.4% (global)
4.8–9.0 (US)
1.5–3.1 (EU)
Note *28% of thermoelectric power installed capacity worldwideReduction in CWS under a 10-year drought: 7.4–9.5% (western US)