Article

Hydrogeologic and Paleo-Geographic Characteristics of Riverside Alluvium at an Artificial Recharge Site in Korea

1
Groundwater Laboratory, Korea Institute of Geoscience and Mineral Resources (KIGAM), Daejeon 34132, Korea
2
Department of Geological Sciences, Pusan National University, Busan 46241, Korea
3
Geo-Information Institute, 1048-11 Jungang-daero, Yeonje-gu, Busan 47598, Korea
*
Author to whom correspondence should be addressed.
Water 2018, 10(7), 835; https://doi.org/10.3390/w10070835
Submission received: 25 May 2018 / Revised: 14 June 2018 / Accepted: 20 June 2018 / Published: 23 June 2018
(This article belongs to the Section Hydrology)

Abstract

:
This study showed the hydrogeological characteristics of an alluvial aquifer that is composed of sand, silt, and clay layers in a small domain. It can be classified into a lower high-salinity layer and an upper freshwater layer and contains shells and remnant paleo-seawater (average 5000 μS/cm) due to sea level fluctuation. Geological and electrical conductivity logging, a long-term pumping test, and multi-depth water quality measurements were conducted at pumping, injection, and observational wells to evaluate the hydrogeologic properties, identify the optimal recharge rate, and assess artificial recharge. Using a hydraulic test, a large difference in drawdown and salinity appeared at the radially located observational wells because of the difference in hydraulic connectivity between the wells in the small study area. It was concluded that the hydraulic anisotropy and heterogeneity of the alluvial aquifer should be carefully examined when locating an injection well and considering the efficient design of artificial recharge.

1. Introduction

Because of recent rapid climate change and natural hazards, the depletion of available water resources threatens stable water resource supplies throughout the world. Among the useful measures confronting this water resource deficiency is aquifer artificial recharge (AAR), which is being implemented in many countries and regions such as the U.S.A., Japan, Europe, Middle Asia, Africa, etc. AAR is also an effective means to appropriately improve water quality in time and space [1]. The Korea Water Corporation first surveyed riverbank filtration sites for introducing the AAR technique in Korea [2]. Hamm et al. [3,4] characterized the hydraulic properties of a riverbank filtration site in Changwon, Korea using groundwater modeling. Seo et al. [5] hydrogeologically assessed potential sites for artificial recharge using a geographic information system (GIS). Kim et al. [6] analyzed artificial recharge technologies and patents for providing water resources.
Sea level change is linked to various factors such as crustal uplift and subsidence, climate change, glacier formation and retreat, tidal fluctuation, etc. Eustatic sea level generally rose during the Cenozoic era, well reflecting the sea-level change in relation to the growth and decline of glaciers [7]. During the period of the last glacial maximum (15,000–18,000 before present (BP)), sea level was 120 m lower than the present day [8,9]. During the years 100,000–200,000 BP, sea level change caused by glaciers is closely related to the formation of offshore sediments. The loss of the latest continental shelf in Europe and North America occurred at 9000–10,000 BP. Since this time, sea level has risen by at least 30 m with the disappearance of continental glaciers, as fluvial sediments deposited during that time are located 30 m lower than the current sea level. The impact of climate change on sea level rise will significantly affect coastal environments including causing threats to human health [10] and a decline in groundwater resource availability in coastal areas [11]. Sea level rise during the 20th century has mainly been a result of ocean warming and the input of ice melt from land, which can produce an immediate effect of submergence, increased coastal land flooding, and saltwater intrusion [12]. Movement of coastlines during the Quaternary (present to 2.58 million years ago (Mya)) resulted in both a saltwater wedge extending inland [13] and in substantial fresh groundwater bodies offshore [14]. In the Netherlands, salinity in the coastal groundwater is intimately linked to the paleo-geographic setting of marine transgression and regression [15]. Marine transgression can extensively salinize freshwater aquifers via free-convective infiltration of seawater [16,17].
This study aimed to examine the hydrogeological and paleo-geographic characteristics of an AAR site in Daesan-myeon, Changweon, Korea. For this purpose, a long-term pumping test and electrical conductivity (EC) logging were conducted on the pumping, injection, and observation wells in the alluvial aquifer.

2. Geological and Hydrogeological Setting

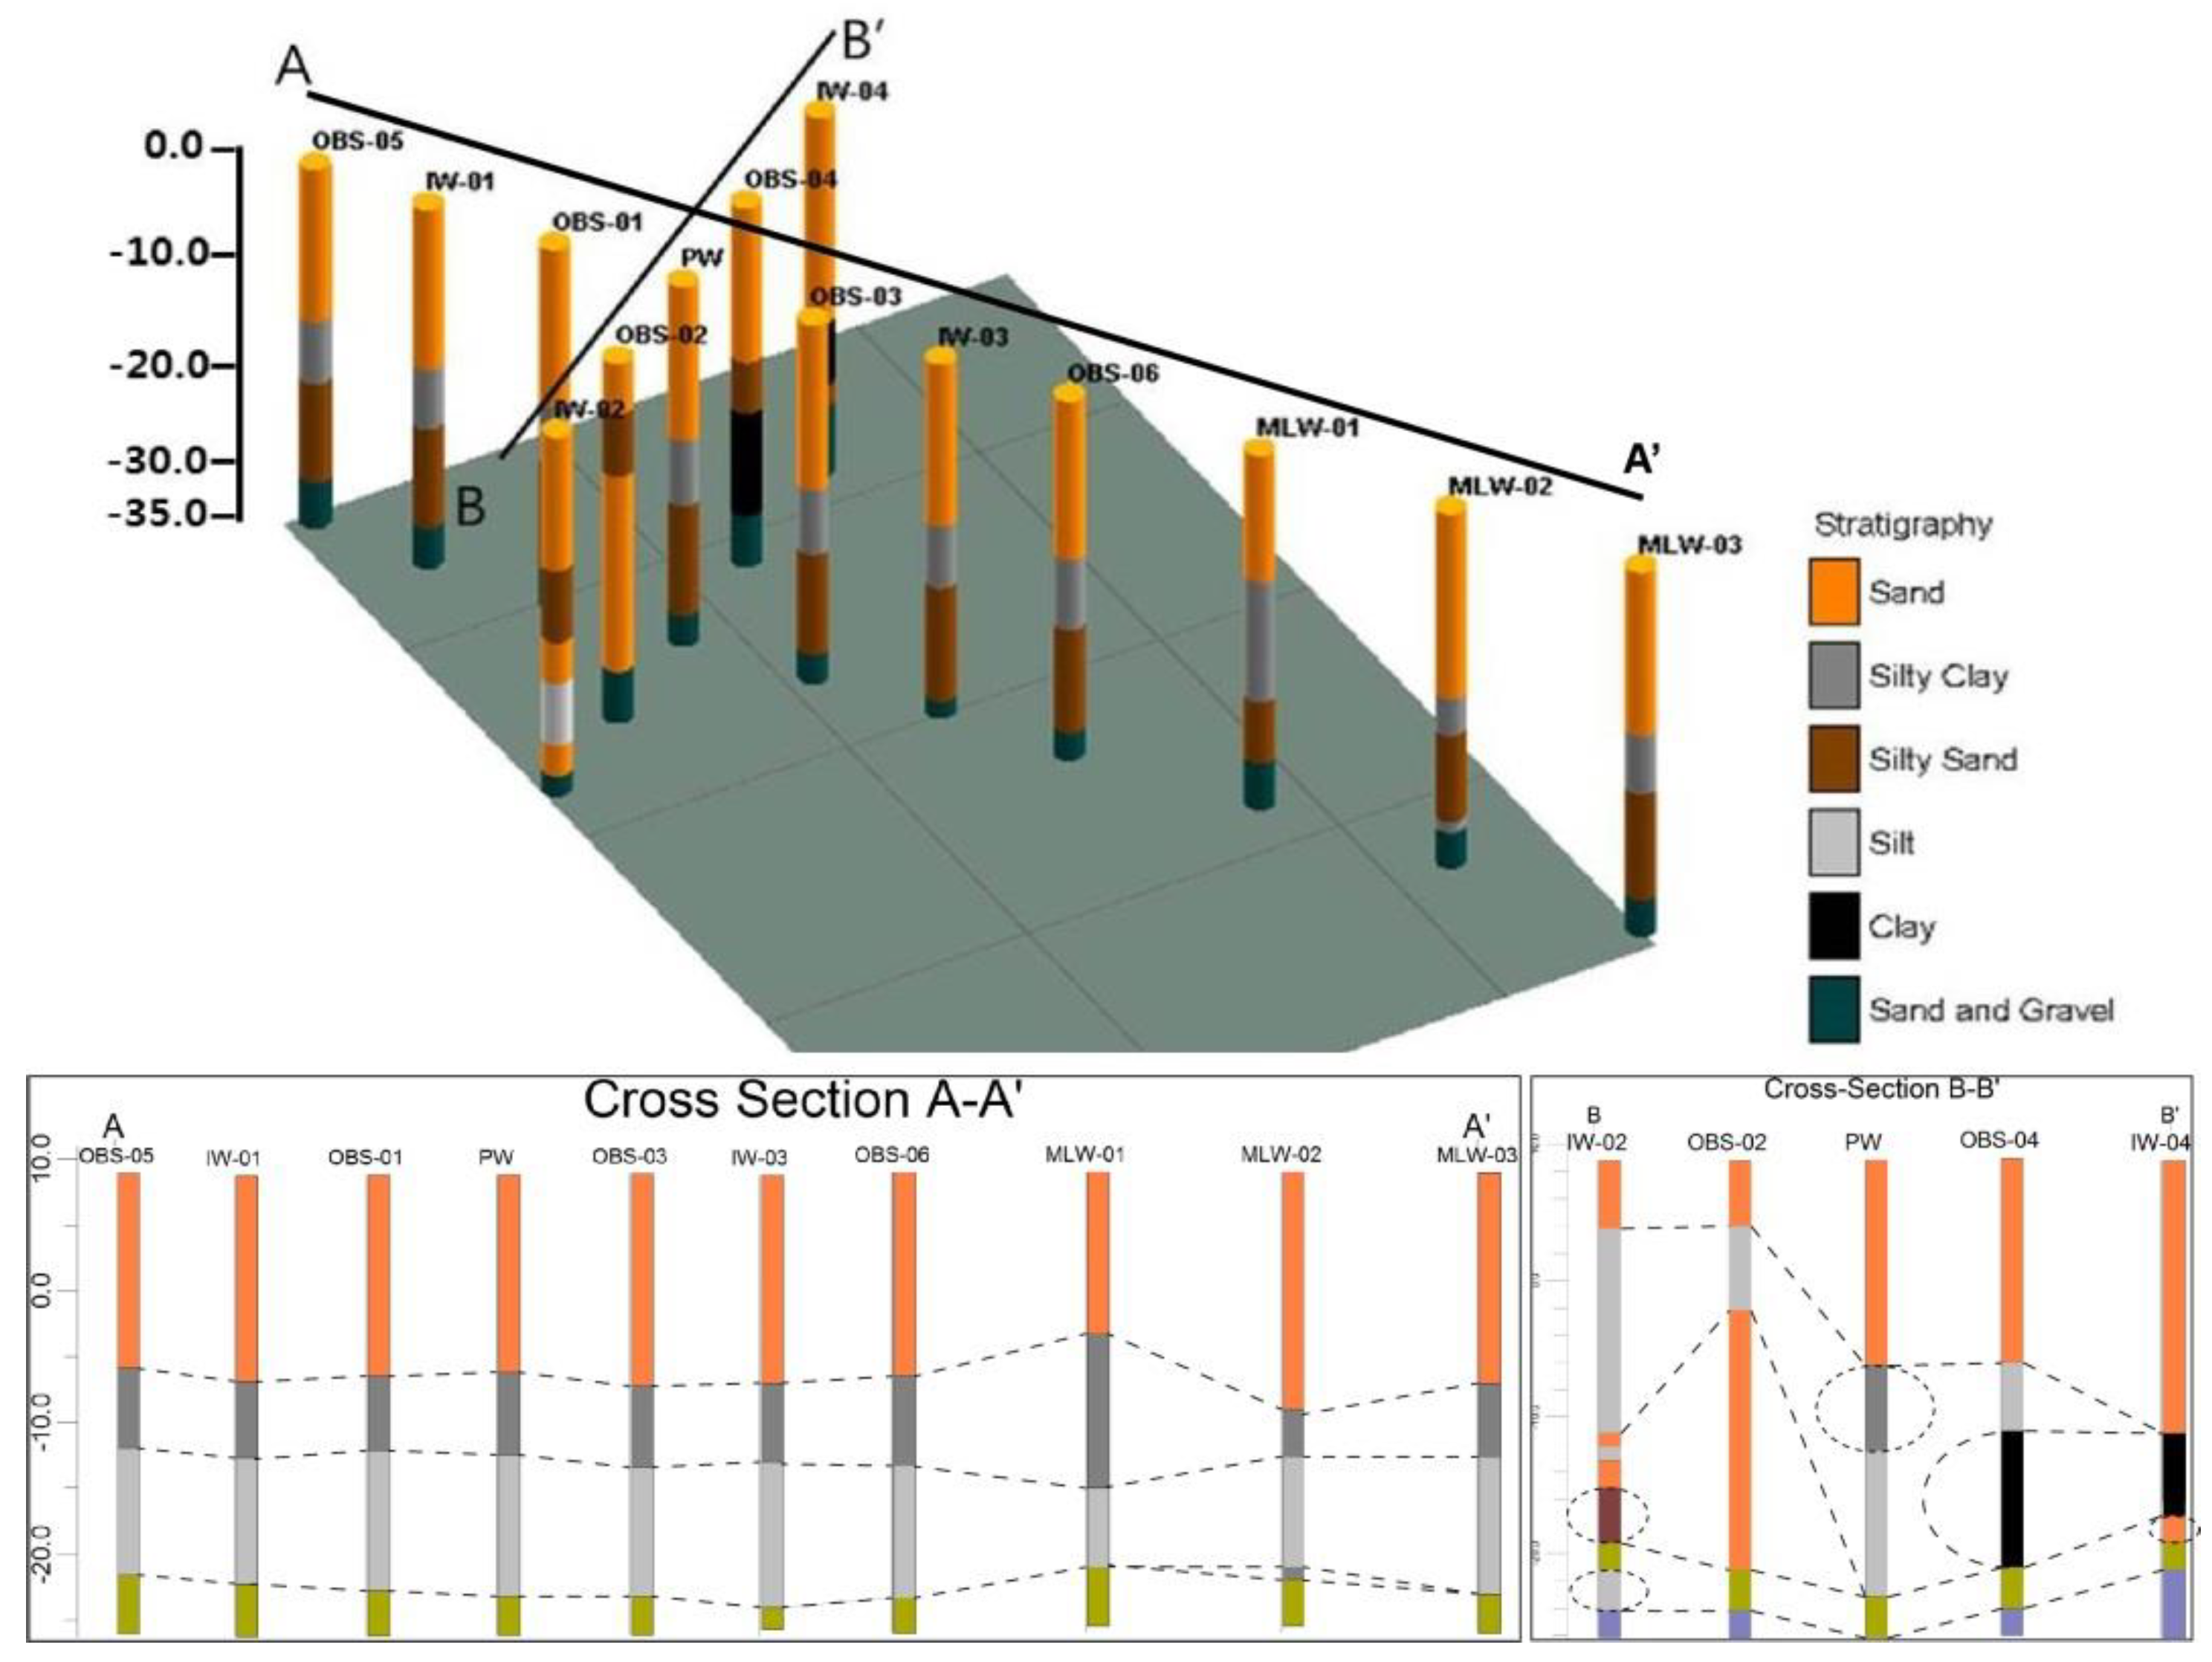
The study area had a small dimension of 150 m in width × 50 m in length and was near the Nakdong River in Changwon, Korea, where an alluvial aquifer system lies with a landfill approximately 0.5–1.0 m in thickness. The study area is being used as a playground and had been used for greenhouse agriculture until 2010 prior to Korea’s Four Main River project. The alluvium in the floodplain along the Nakdong River mostly consists of alternating layers of sand, gravel, silt, and clay that have been produced by numerous meandering activities of the Nakdong River (Figure 1). Site geology by geological log showed four layers (gravel/sand, silty sand, silty clay, and sand layers of 15 m thickness) from depth to surface (Figure 2). The gravel/sand layer serves as the main aquifer from 33 m below the land surface, the silty sand and silty clay layer as an aquitard, and the sand layer as an unconfined aquifer. In detail, each layer partially contains a small-scale portion of silt and clay.
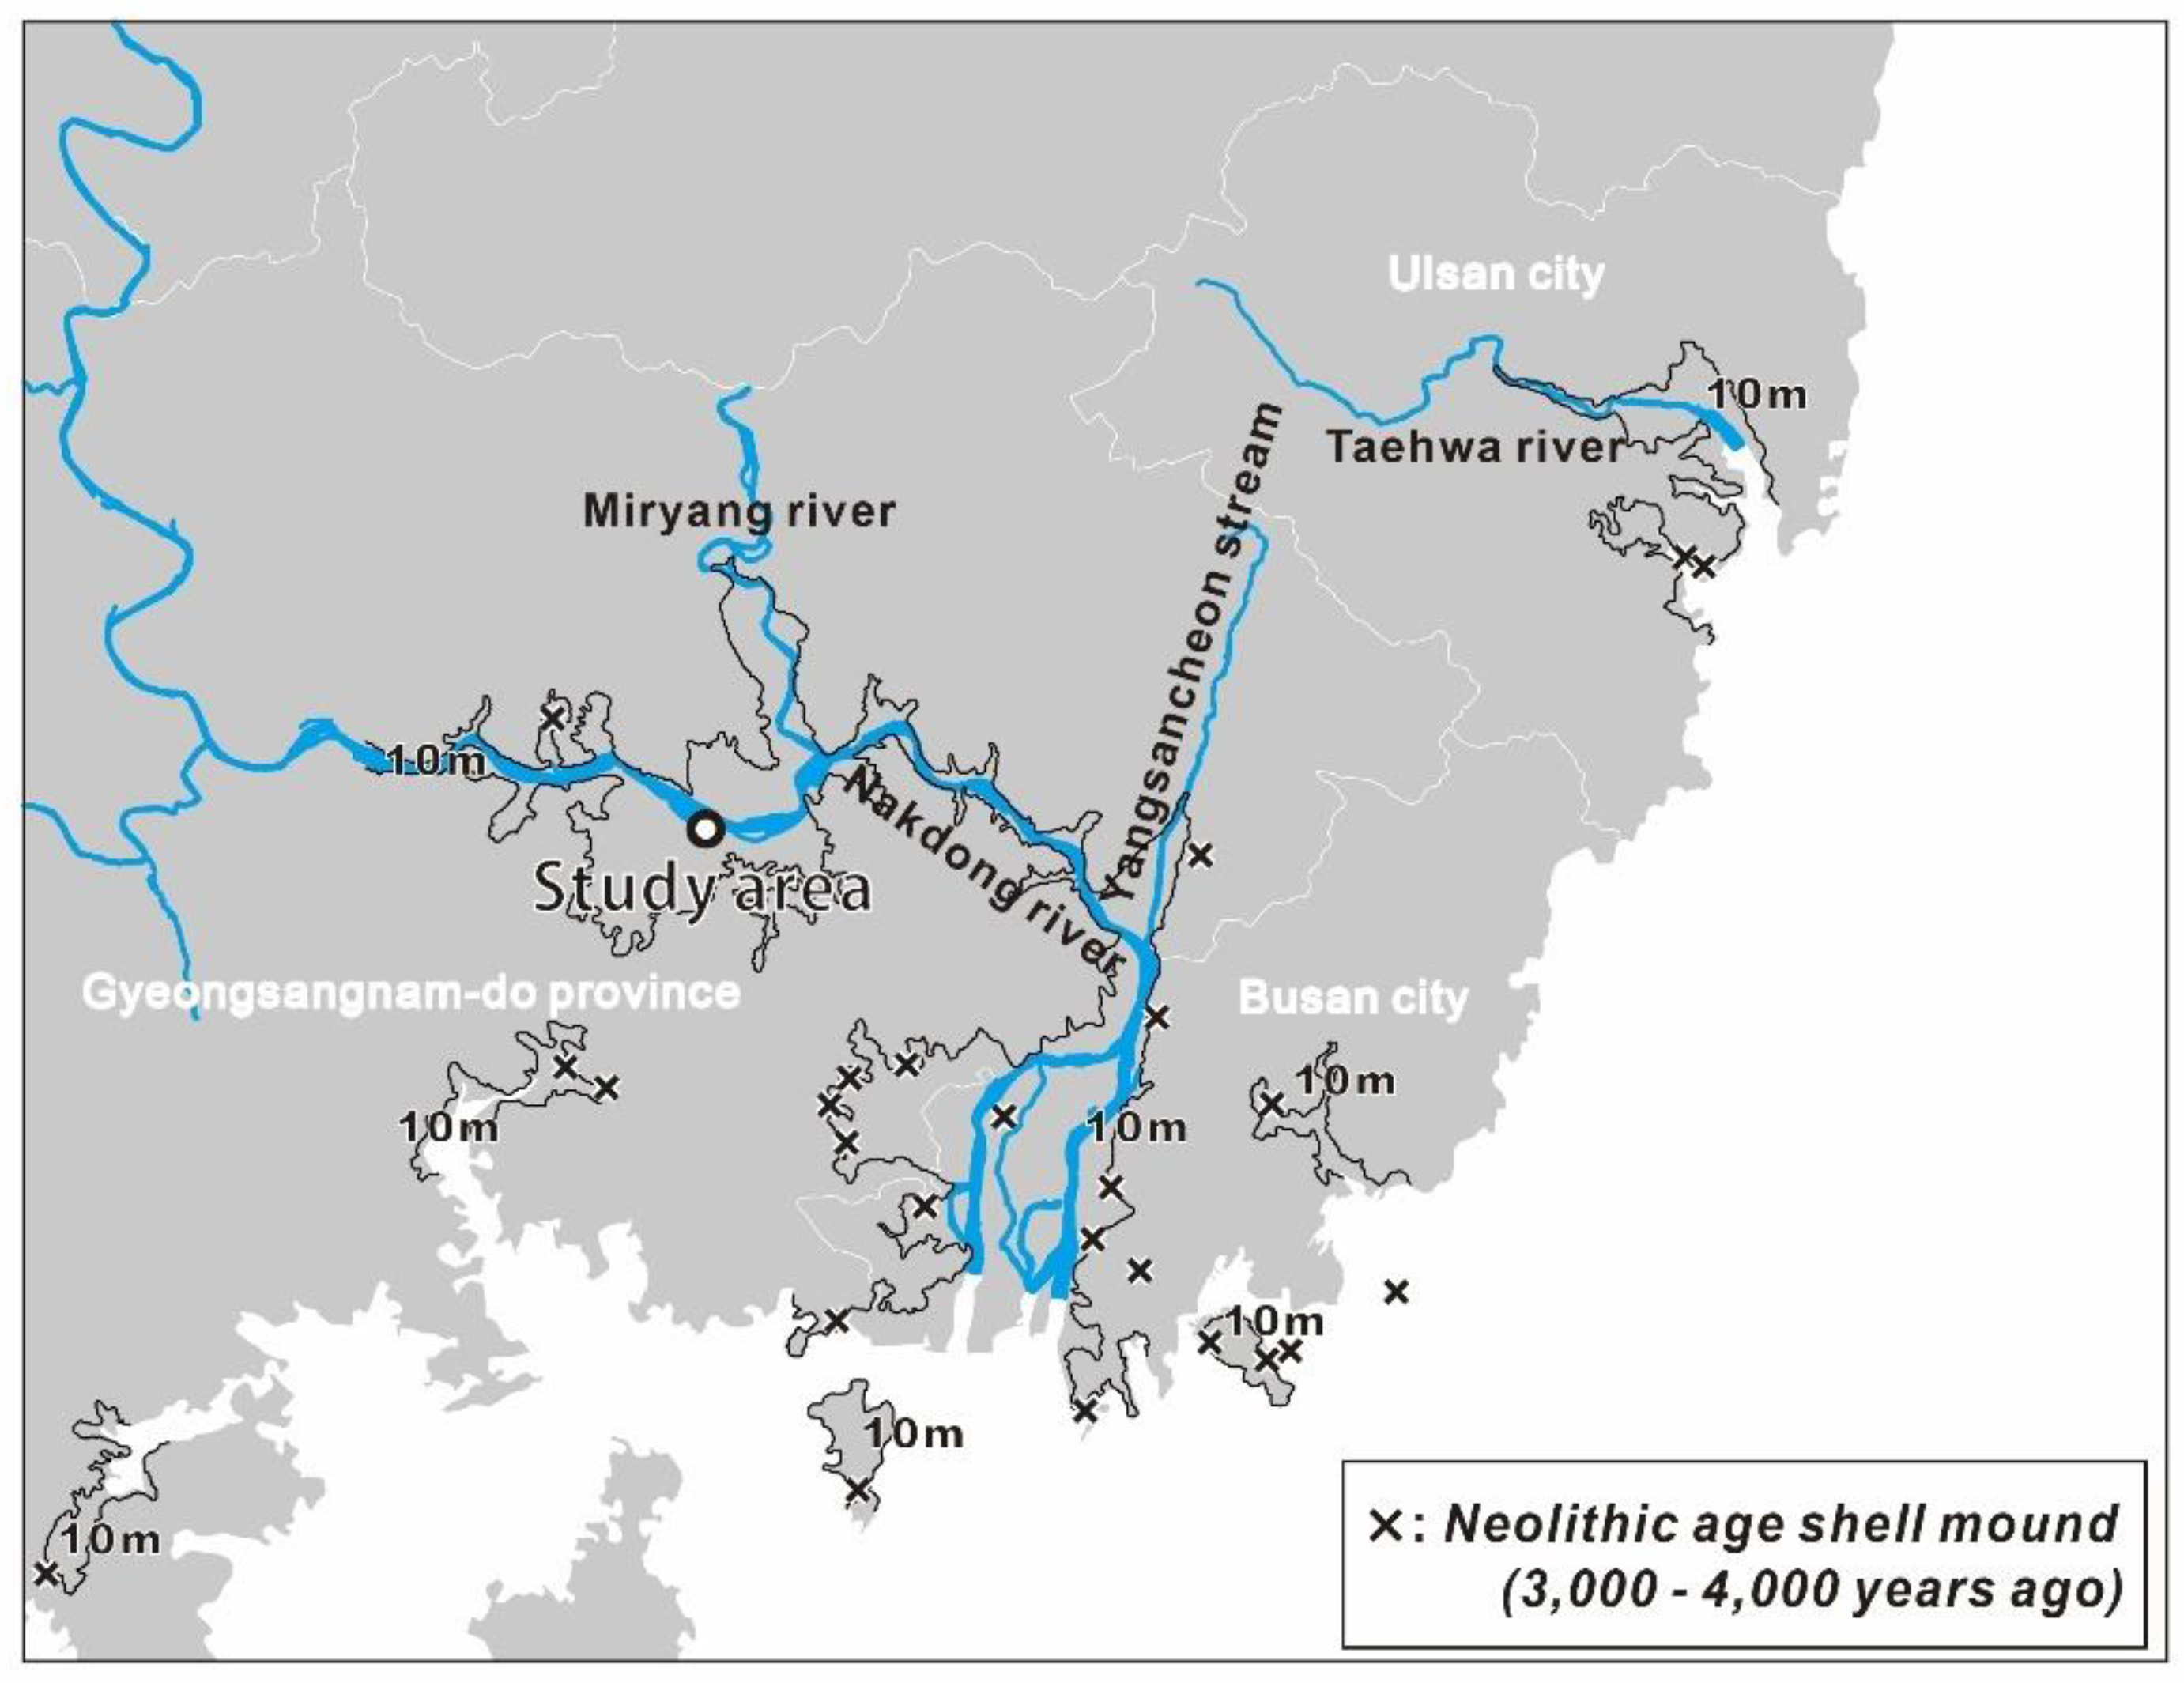
Hydrogeologically, at a depth of 10 m, the alluvium is classified into an upper freshwater bed and a lower remnant paleo-seawater bed (average 5000 μS/cm). According to a sea-level fluctuation study of the western coastal region in Korea for the period 9000 BP to the present, sea level rose 6.5 m with repeated rises and falls [18]. Shell mounds deposited 3000 to 4000 years ago in the southeastern region of the Korean Peninsula during the Neolithic age (8000 BP–2333 BP) also indicate that the ancient sea level was approximately 10 m higher compared to that of the present (Figure 3).
The local geology is composed of sedimentary rocks of the upper Cretaceous Yucheon group (feldspathic sandstone, greenish shale, and cherty shale) extruded by Cretaceous volcanic rocks (andesite, andesitic tuff, andesitic lapilli tuff, and andesitic tuff breccia) [3,19]. The sedimentary and volcanic rocks are intruded by Bulguksa igneous rocks (biotite granite and granodiorite). The Quaternary alluvium covers the sedimentary, volcanic, and intrusive rocks [20].

3. Methods

For AAR, a total of fourteen wells were drilled in the study area: one pumping well, six observation wells, four injection wells, and three multi-depth observation wells for geochemical monitoring. The injection (IW) and observation wells (OBS) are radially situated around the pumping well (PW) at an interval of 10 or 15 m to show the hydraulic connectivity (Figure 1). The wells have depths of approximately 34.5–35.0 m with a surface elevation of approximately 8.7–9.0 m and a depth to water of approximately 7.0–7.3 m (Table 1).
Using water level sensors (conductivity and depth (CTD) divers), a 6-day multi-rate pumping test was performed to examine water level change in the pumping and observation wells. A long-term pumping test was conducted to verify the hydraulic properties and connectivity of the alluvial aquifer. The transport/dilution effect of the remnant paleo-salt water was monitored at 25 m in the observation wells during the pumping period as well as at 25-m depth in the injection wells.
In addition, during the pumping test, EC loggings were performed to delineate the groundwater flow direction and rate at the study site (Table 1). One day before the pumping test, background EC logs were obtained using the CTD-diver. Next, EC logging was conducted during the morning and afternoon for five days during the pumping test, with a supplementary logging following pumping completion.

4. Results

4.1. Hydrogeologic Characteristics

A multi-step pumping test was performed at four-step pumping rates (Q1 = 144 m3/d, Q2 = 158 m3/d, Q3 = 455 m3/d, and Q4 = 203 m3/d) with a pump depth of 28 m. For easy detection of the hydraulic connectivity, the rate of the third pumping step (Q3) was approximately three times that of Q2 for 20 min. Groundwater levels of the observation wells (OBS-1, -2, -3, and -4 wells) at the same distance from the pumping well displayed highly dissimilar drawdown during the pumping test. This major difference in the drawdown of the observational wells was caused by highly variable hydraulic connectivity and different flow rates between the pumping well and the observation wells. For instance, the groundwater level at the OBS-3 well changed at the start of the pumping whereas the drawdown occurred at 10 min for the IW-2 well, 80 min for the OBS-5 well, and 600 min for the IW-4 well following pumping initiation (Figure 4).
The OBS-3 well showed a distinct drawdown of 12 m, similar to the level change of the pumping well but different from the other observation wells, indicating a good hydraulic connectivity between the OBS-3 well and the pumping well. The injection well IW-2 displayed a smaller but analogous drawdown behavior to that of the OBS-3 well. On the other hand, the OBS-1, -2, and -4 wells displayed smaller drawdowns of 0.11–0.16 m. Remarkably, larger drawdowns were identified for the multilayered wells (MLWs) at 45–75 m from the pumping wells than at the observation wells (except for the OBS-3 well) at 10–20 m from the pumping wells. The drawdowns of the MLW-1, MLW-2, and MLW-3 wells were 1.5, 0.37, and 0.33 m, respectively, within 10 min from the start of pumping, showing a larger drawdown at the nearer observation wells (MLW-1) and a smaller drawdown at the farther observation wells (MLW-2 and MLW-3) from the pumping well.
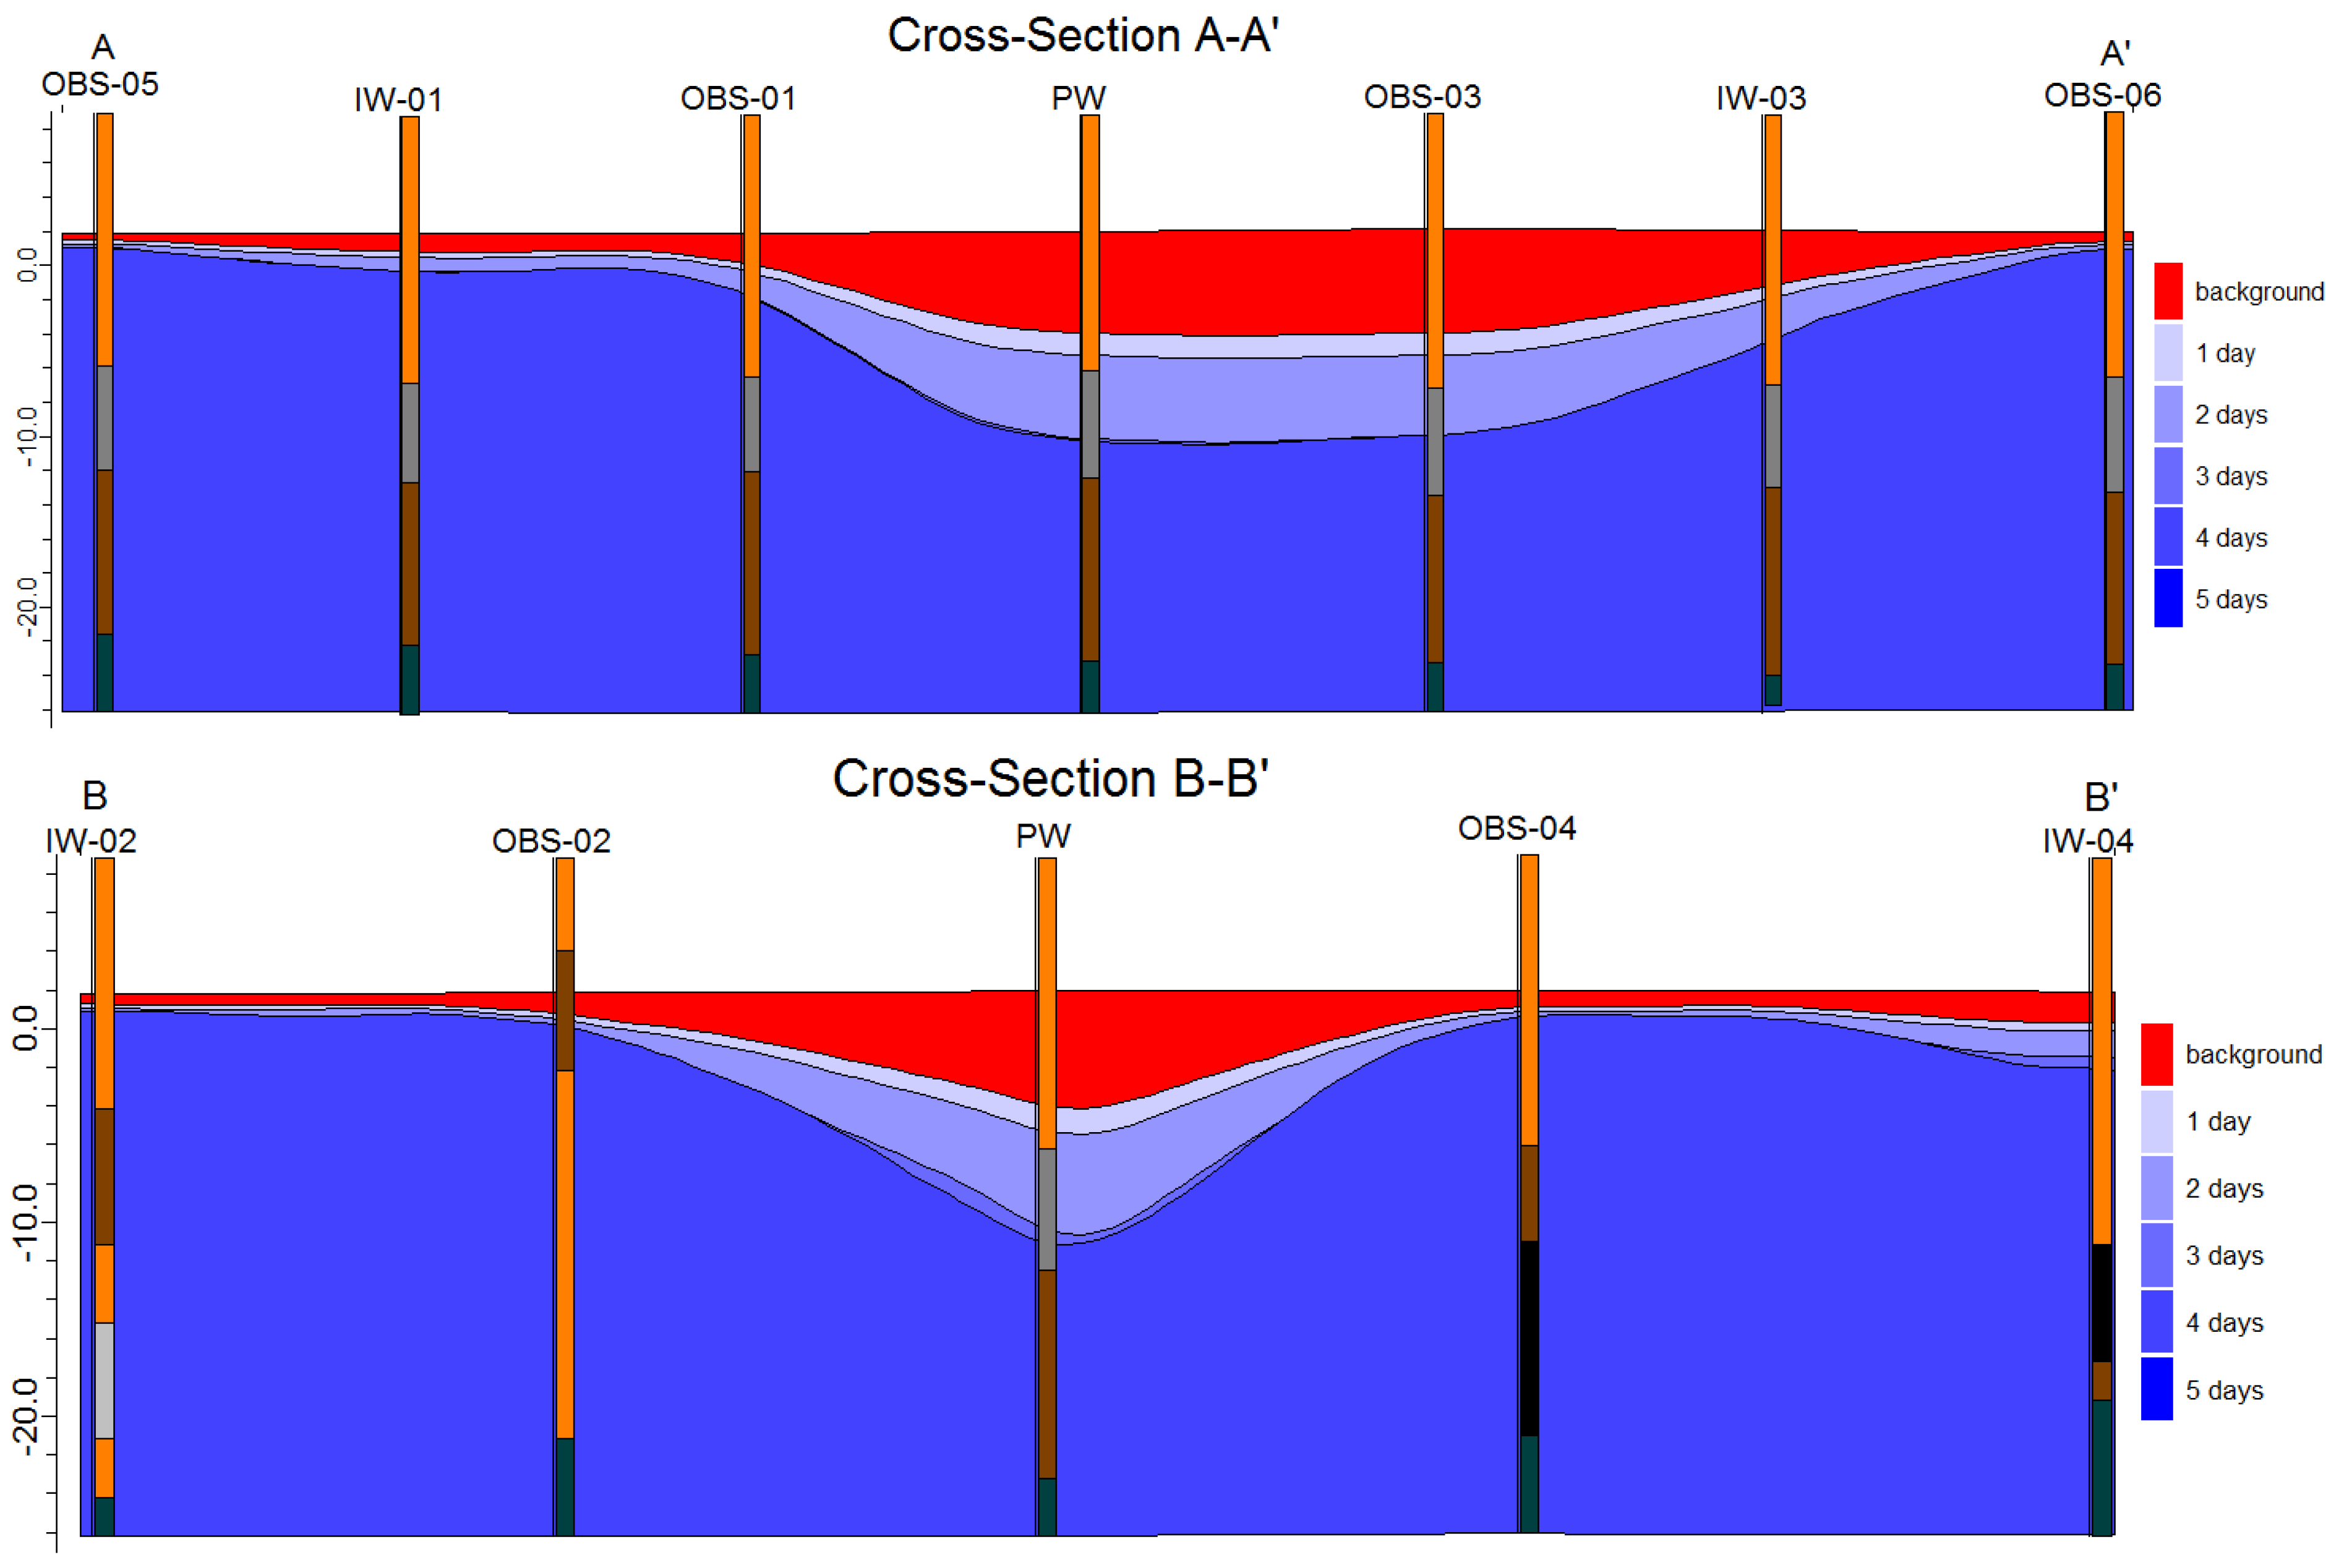
During the recovery period, the water level rapidly rose to the initial level at the OBS-3, IW-2, and OBS-5 wells. In contrast, the recovery time to the initial level was longer than 24 h at the other observation wells, suggesting low hydraulic connectivity around the wells. As a result, complex hydraulic connectivity and anisotropy were delineated in the small-scale riverside alluvial aquifer from both the pumping test and the drawdown patterns of the cross-section A-A’ to the Nakdong River as well as of the cross-section B-B’ parallel to the river (Table 2, Figure 5).

4.2. Hydraulic Parameter Estimation

The pumping test was executed to estimate the hydraulic parameters (transmissivity and storativity) and show the lateral and vertical geometry of the aquifer. Hamm et al. [3] applied a modified confined aquifer model considering wellbore and elastic storage [21] for the alluvial aquifer system 7 km upstream of the study site. The aquifer system is composed of a lower sand/gravel layer (the main leaky confined aquifer) and an upper silty sand layer (the confining bed) with good hydraulic connectivity between the upper and lower layers. In this study area, using geological logs as well as the pumping test data, appropriate aquifer models were selected among the leaky confined aquifer models [22,23] and the unconfined aquifer models [24,25] by using both theoretical and derivative curves (AQTESOLV ver. 4.5) in order to precisely interpret the aquifer system. Comparative analysis was completed using various models—Hantush–Jacob, Moench, Neuman, and unconfined Theis models [22,23,24,26]—using OBS-3 well data. Among the four models, the Hantush–Jacob model and the Neuman model of the free-surface aquifer were superior to those of the Moench and Theis models.
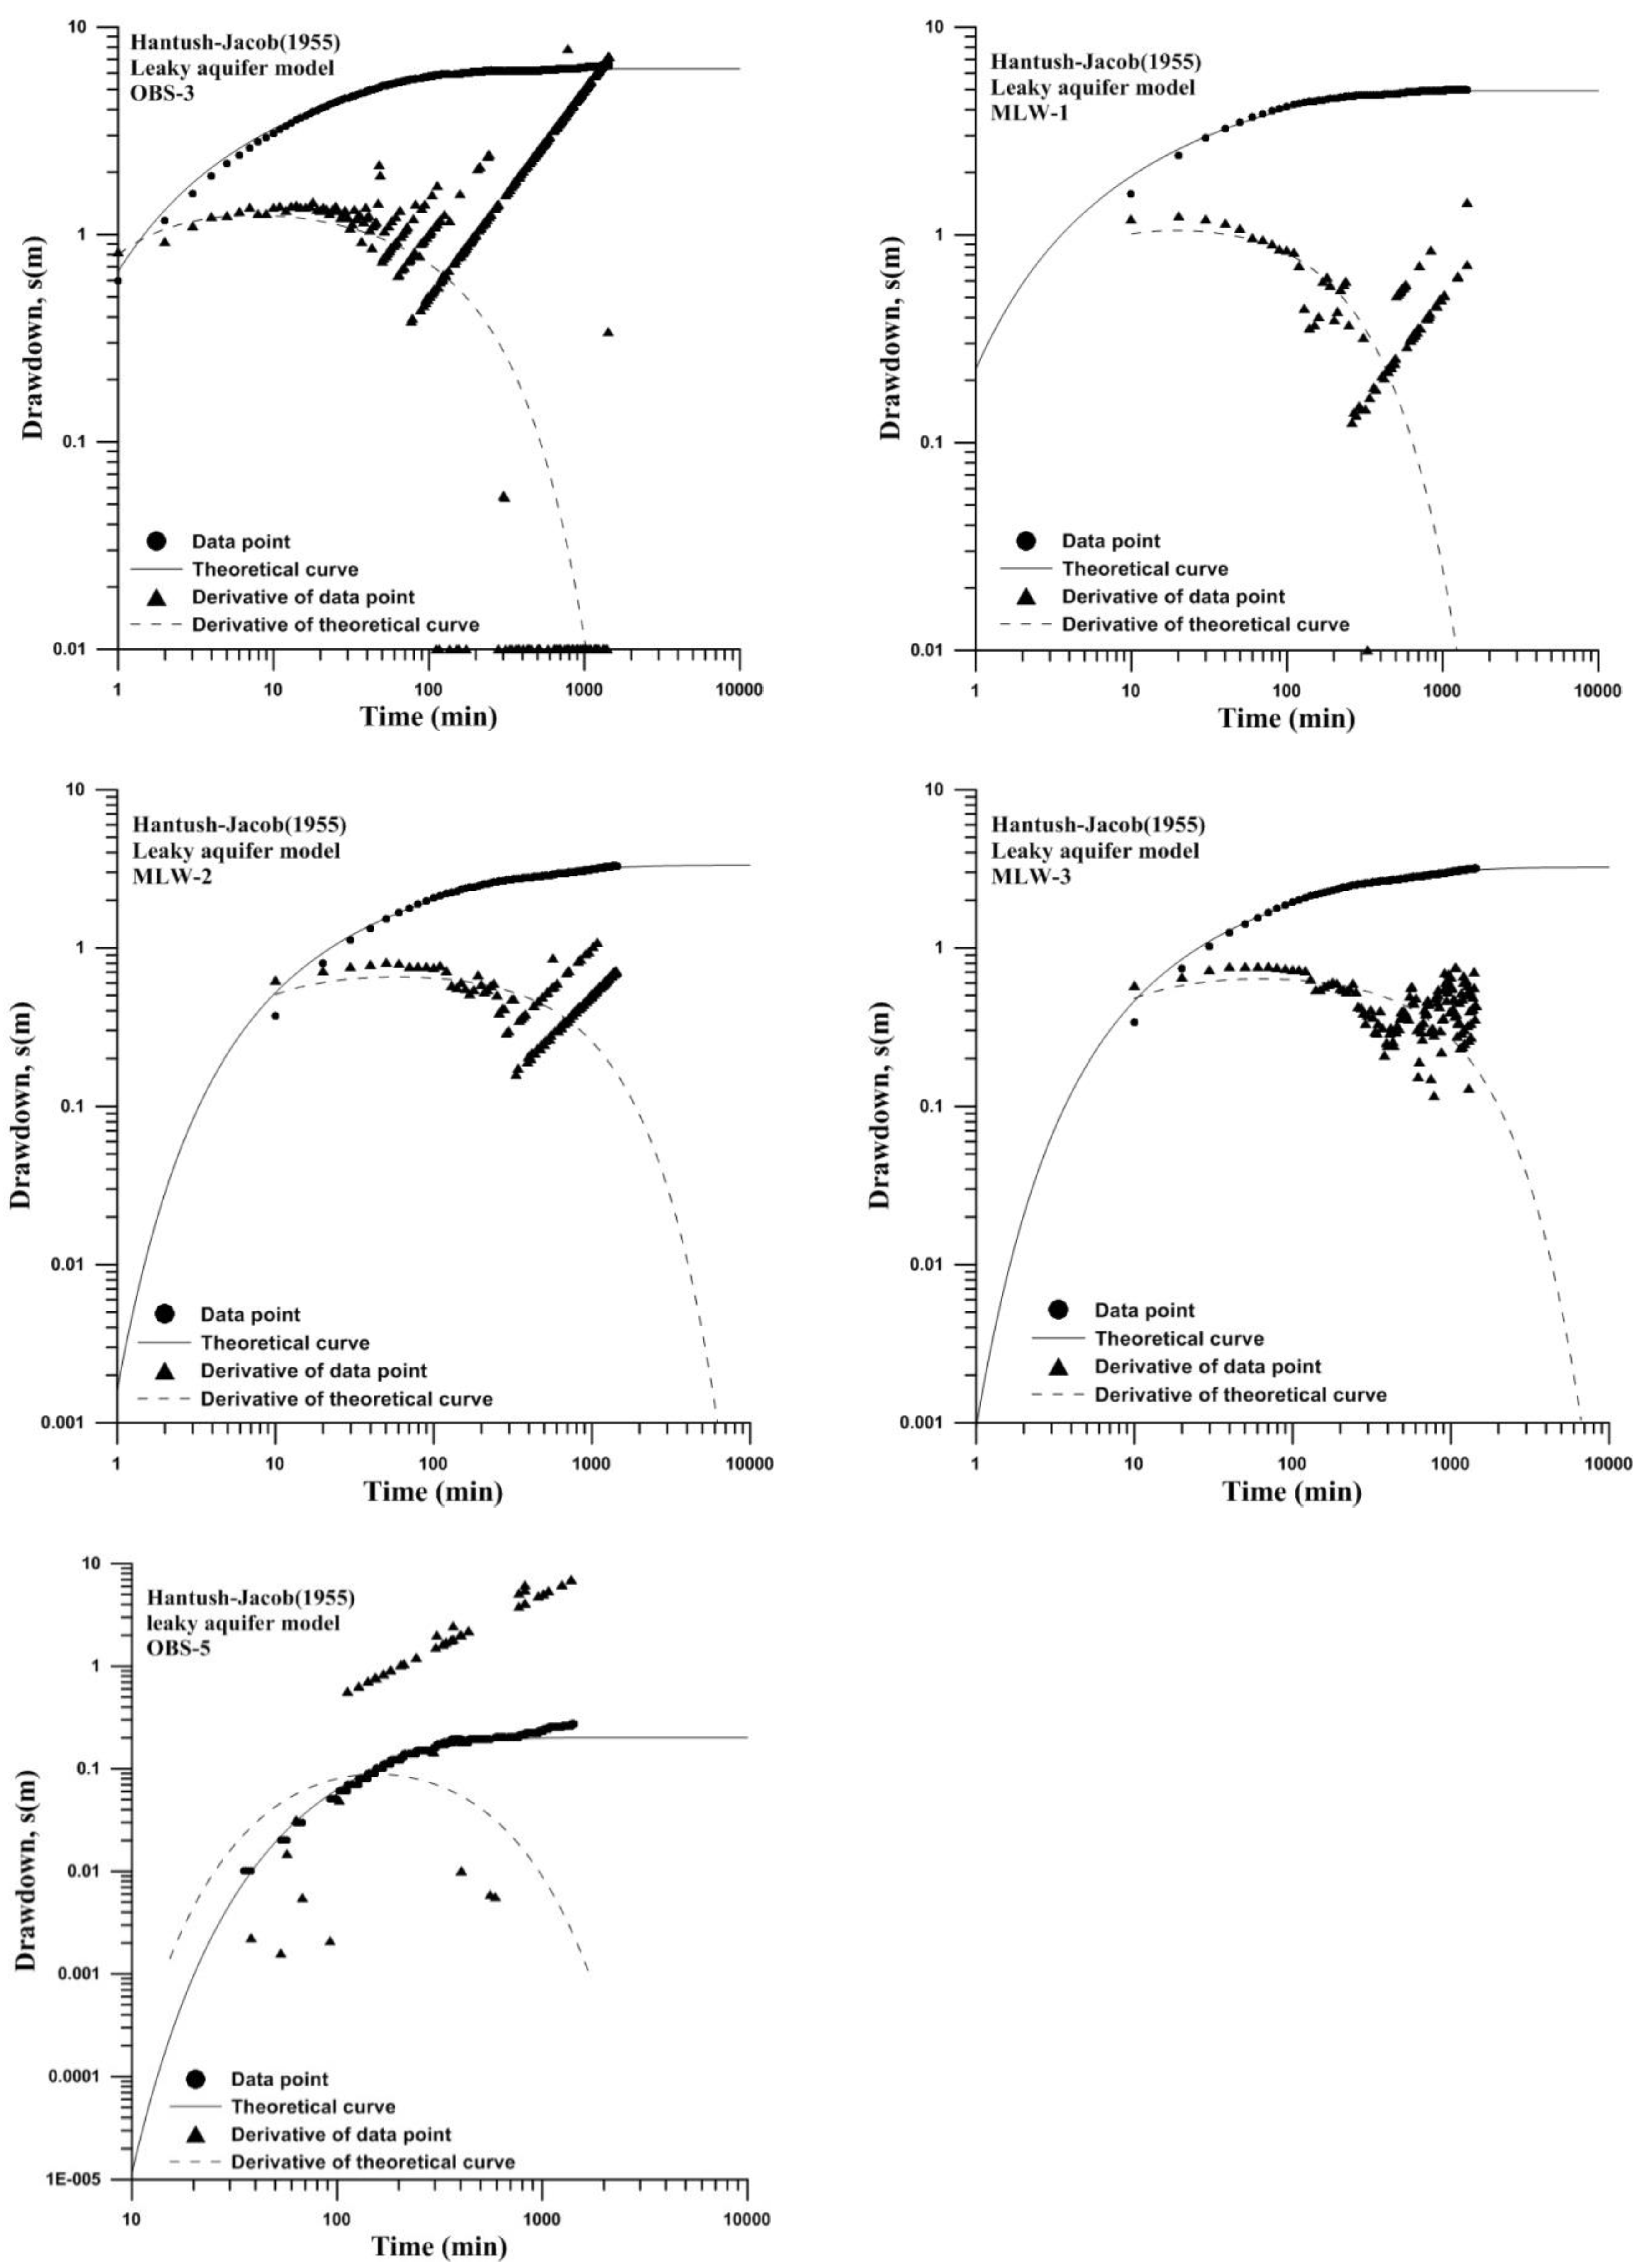
The Hantush–Jacob leaky aquifer model was most suitable for the OBS-3 and the MLW-1, -2, and -3 wells (Figure 6). The observed drawdowns at the OBS-5 well, resembling those of the Neuman model considering gravity drainage, were actually caused by the pumping rate decrease because of the submersible pump pressure reduction. The geological columnar section also sustains the leaky confined aquifer model. On the other hand, the OBS-1 and -2 wells were appropriate for the Cooper–Jacob model and the OBS-4 and -6 wells fitted the Neuman model. The OBS-1, -2, -4, and -6 wells were clogged by the precipitation of grains largely originating from the upper silty sand layer, hindering groundwater flow from the lower main aquifer and showing a small drawdown of less than 10 cm. These wells recovered much more slowly than the wells of the leaky aquifer system, because of a weak hydraulic connection with the lower main aquifer.
Transmissivity (T) estimates ranged from 1.14 × 10⁻⁴ to 5.52 × 10⁻⁴ m2/s and storativity (S) estimates ranged from 1.5 × 10⁻⁵ – 1.1 × 10⁻² using the leaky aquifer model [22]. The T values via the Cooper–Jacob unconfined model ranged from 4.67 × 10⁻³ to 4.76 × 10⁻³ m2/s and the S values ranged from 0.25 to 2.26 m, whereas the T values using the Newman unconfined model were determined as 1.91 × 10⁻³–4.19×10⁻³ m2/s and the S values as 9.6 × 10⁻³–5.2 × 10⁻³ (Table 2). From the T values, the hydraulic conductivity (K) values were estimated as 6.07 × 10⁻⁶–3.51 × 10⁻⁴ m/s. According to the comparison of the K values using the pumping test and slug tests, the OBS-1, -2, and -6 wells showed similar K values to each other by an order of 10−4 m/s. On the other hand, for the OBS-3 well, the K values (on the order of 10−6 m/s) using the pumping tests were lower than those (on the order of 10−4 m/s) using the slug tests. This result explains the hydraulic heterogeneity between the pumping well and the OBS-3 well as well as the higher permeability around the OBS-3 well (Table 2). T values of 5.55 × 10⁻³–2.38 × 10⁻² m2/s (geometric mean 1.04 × 10⁻² m2/s) were estimated by [19] at riverbank sites near the study area and were in accordance with the estimated T values in this study area.
The heterogeneity and anisotropy of the alluvial aquifer in the study area is suggested by variable T and S values in space as well as a negative relationship between the hydraulic parameters (T and S) vs. distance from the river (between OBS-3 and MLW-3) (Figure 7).

4.3. Estimation of Remnant Paleo-saltwater

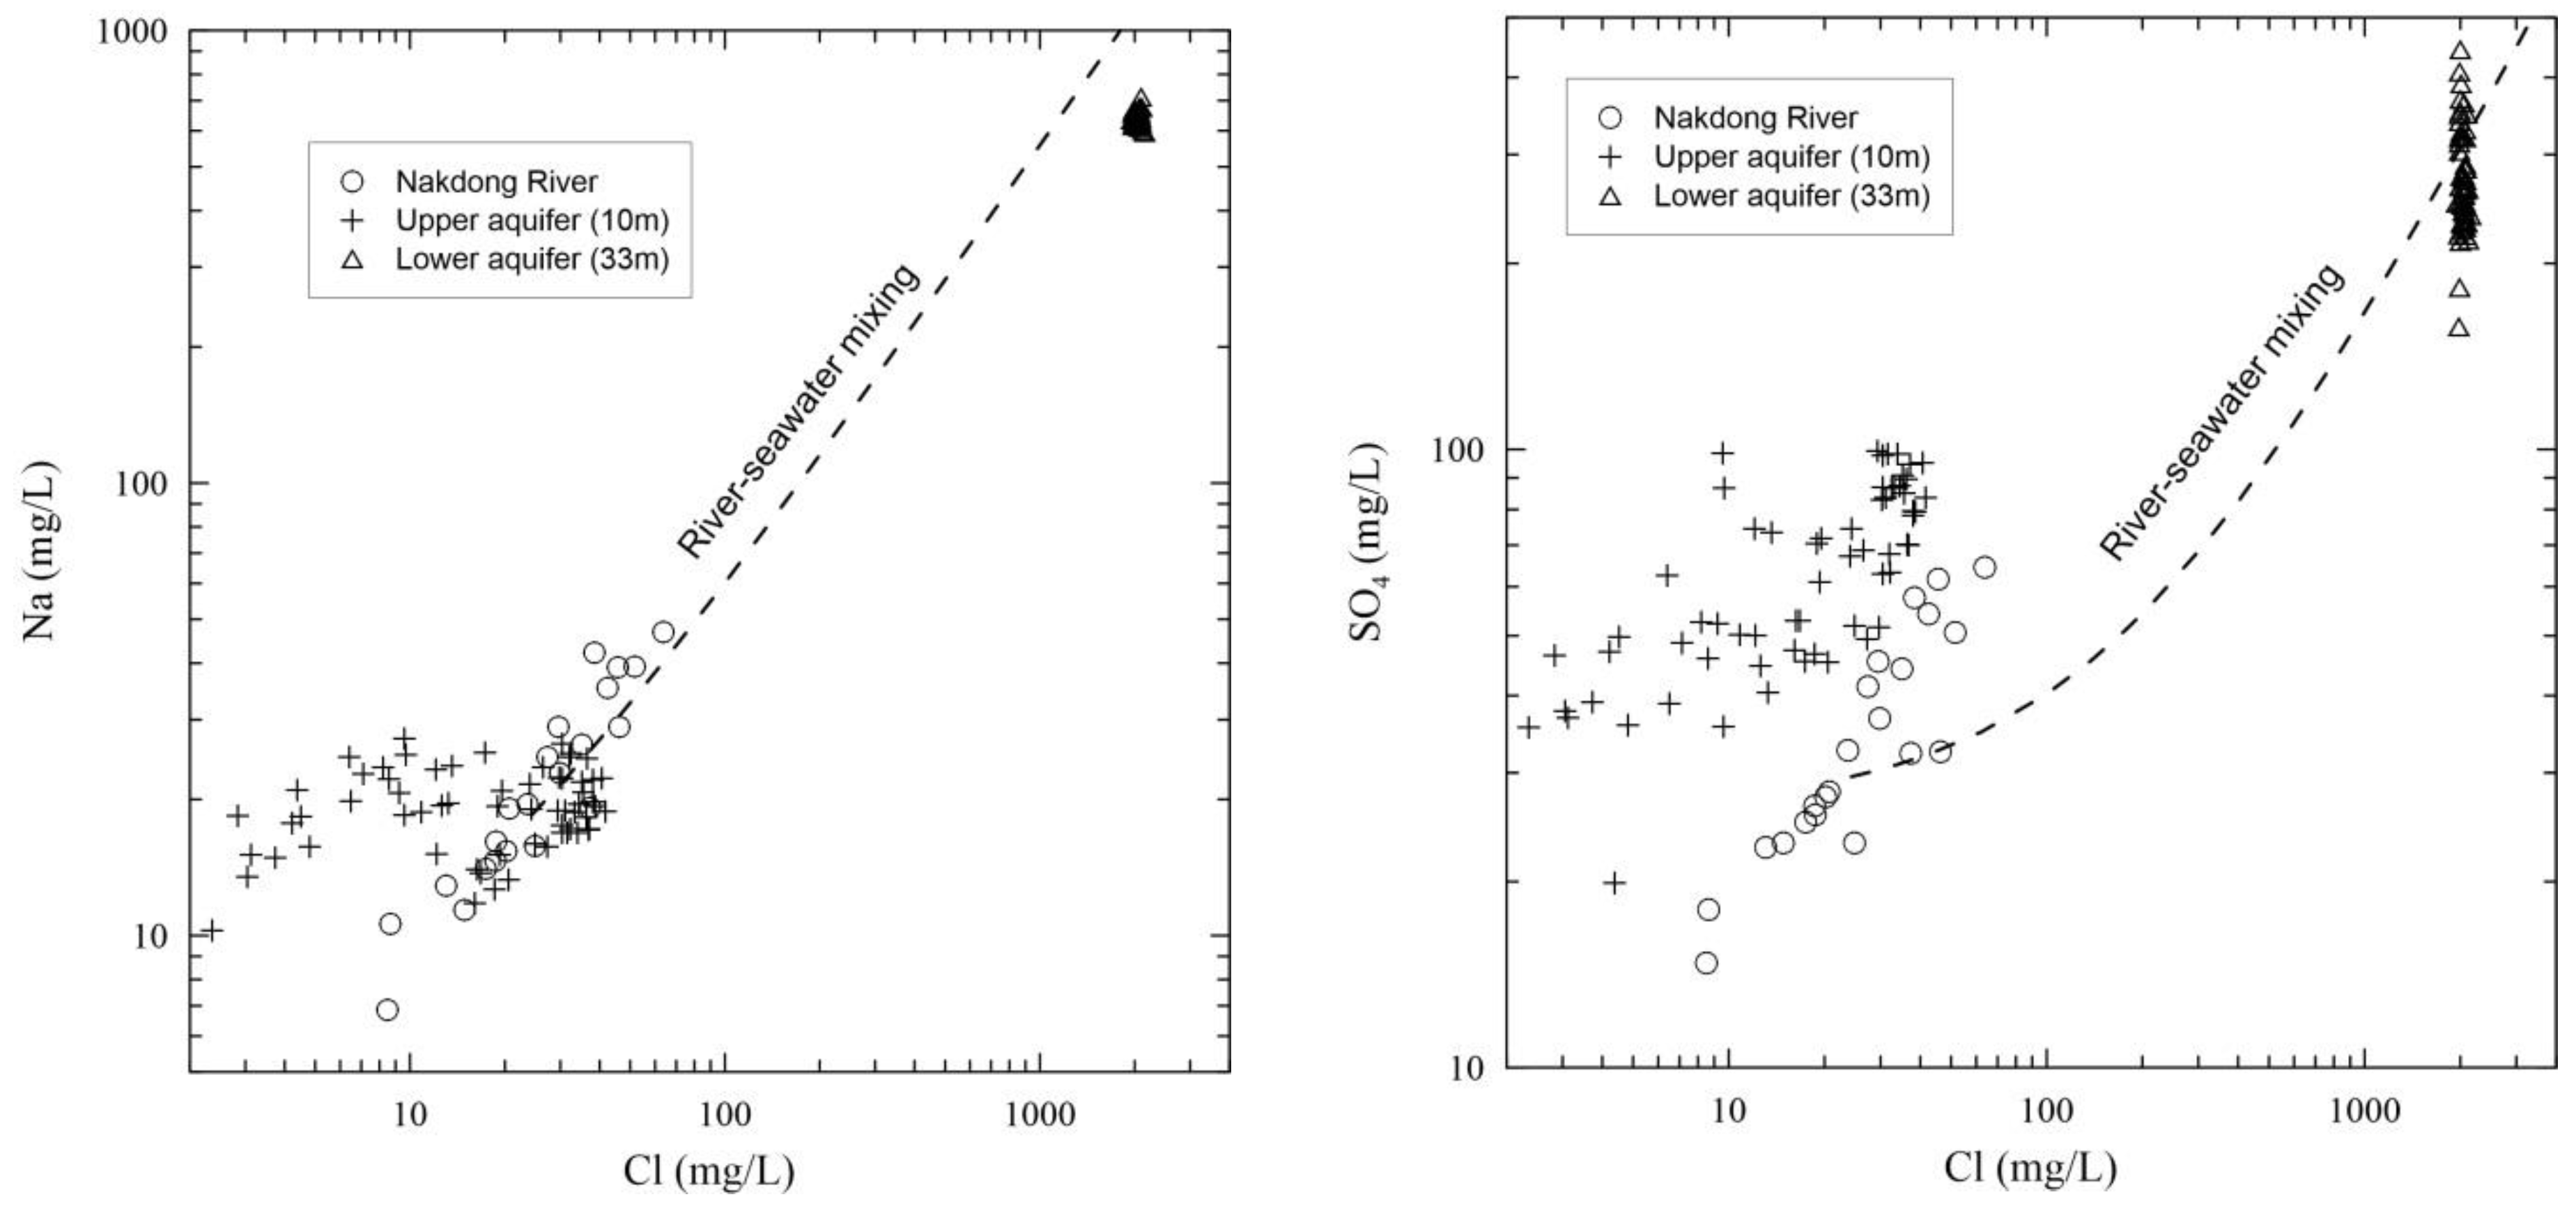
High salinity appears in porewater in inland aquitards having substantial thickness due to seawater intrusion [27]. The upper (0–10 m) and lower aquifers (>25 m depth) of the study area were discriminated by table isotopic analysis of groundwater samples (Figure 8). The upper aquifer seems to be partially influenced by the river and the lower aquifer is not influenced by the river, showing deep groundwater characteristics. The Na-Cl-SO4 relationship and salinity of the lower aquifer is suggested to be linked to seawater intrusion based on shell mounds deposited 3000 to 4000 years ago. A comparison of the concentrations of the major ions and Cl indicates a typical ion exchange process during the seawater intrusion period and a high SO42− concentration derived from the seawater intrusion.
During the pumping test, not only the groundwater behavior but also remnant paleo-seawater in the lower zone of the alluvium was examined using an EC sensor at a depth of 25 m at both the pumping well and observational wells. The EC change at the pumping well along the A-A’ cross section displayed a gradual decrease until the fourth stage and stabilized within a range of ~2.4 mS/cm of change. The variable EC changes in space and time at the observational wells were discovered to be irrelevant to distance from the pumping well. The EC change at the OBS-3 well was 10 m distant from the pumping well in the direction of the Nakdong River and showed a consistently decreasing tendency. The OBS-6 well 20 m distant from the pumping well showed a value of 5.9 mS/cm from the pump start and abruptly decreased to 1.0 mS/cm after a 4-h lapse. On the other hand, the OBS-1 well 10 m distant from the pumping well in the direction of the riverbank started to sharply decrease after an ~8-h lapse and showed a gentle decrease from the fourth step during the pumping with a resultant ~3.2 mS/cm of EC change. The IW-2 well 20 m distant from the pumping well showed a prompt change in EC early and then a slow change rate of ~2.4 mS/cm at pump shutoff. The OBS-5 well 30 m distant from the pumping well showed rapid decrease of EC during the early period and then the EC values became nearly stable despite a pumping increase. During the recovery period of the pump shutoff, the observational wells, except the OBS-3 well, and the pumping well did not show any distinct EC change (Figure 9).
The EC change in the B-B’ cross-section showed a slower EC change than that of the A-A’ cross-section. An EC change in the IW-2 well was observed from approximately 13 h since the pump start and the lowered to 700 μS/cm with ~4.0 mS/cm of decline. At the OBS-2 well, similar to the IW-2 well, the EC values changed after a ~56-h lapse from the pump start, reaching ~800 μS/cm with an abrupt decline to 5.1 mS/cm. The directions of the OBS-2 and IW-2 wells displayed the greatest decrease in the EC values among the four directions. The OBS-4 well in the opposite direction of that of the OBS-2 well showed an EC change at ~51 h since the pump start with a smaller decrease of ~800 μS/cm. Similarly, at the IW-4 well, an EC change appeared 32 h after the pump start with a further gradual, small change of ~200 μS/cm (Table 3, Figure 9). The OBS-4 well exhibited the highest EC value of 6.1 mS/cm among the observational wells while the IW-4 well 10 m from the OBS-4 well showed a low EC of 2.1 mS/cm, indicating the negligible impact of pumping with the smallest variation in the EC values at the OBS-4 and IW-4 wells.

4.4. Spatial Distribution of Paleo-saltwater

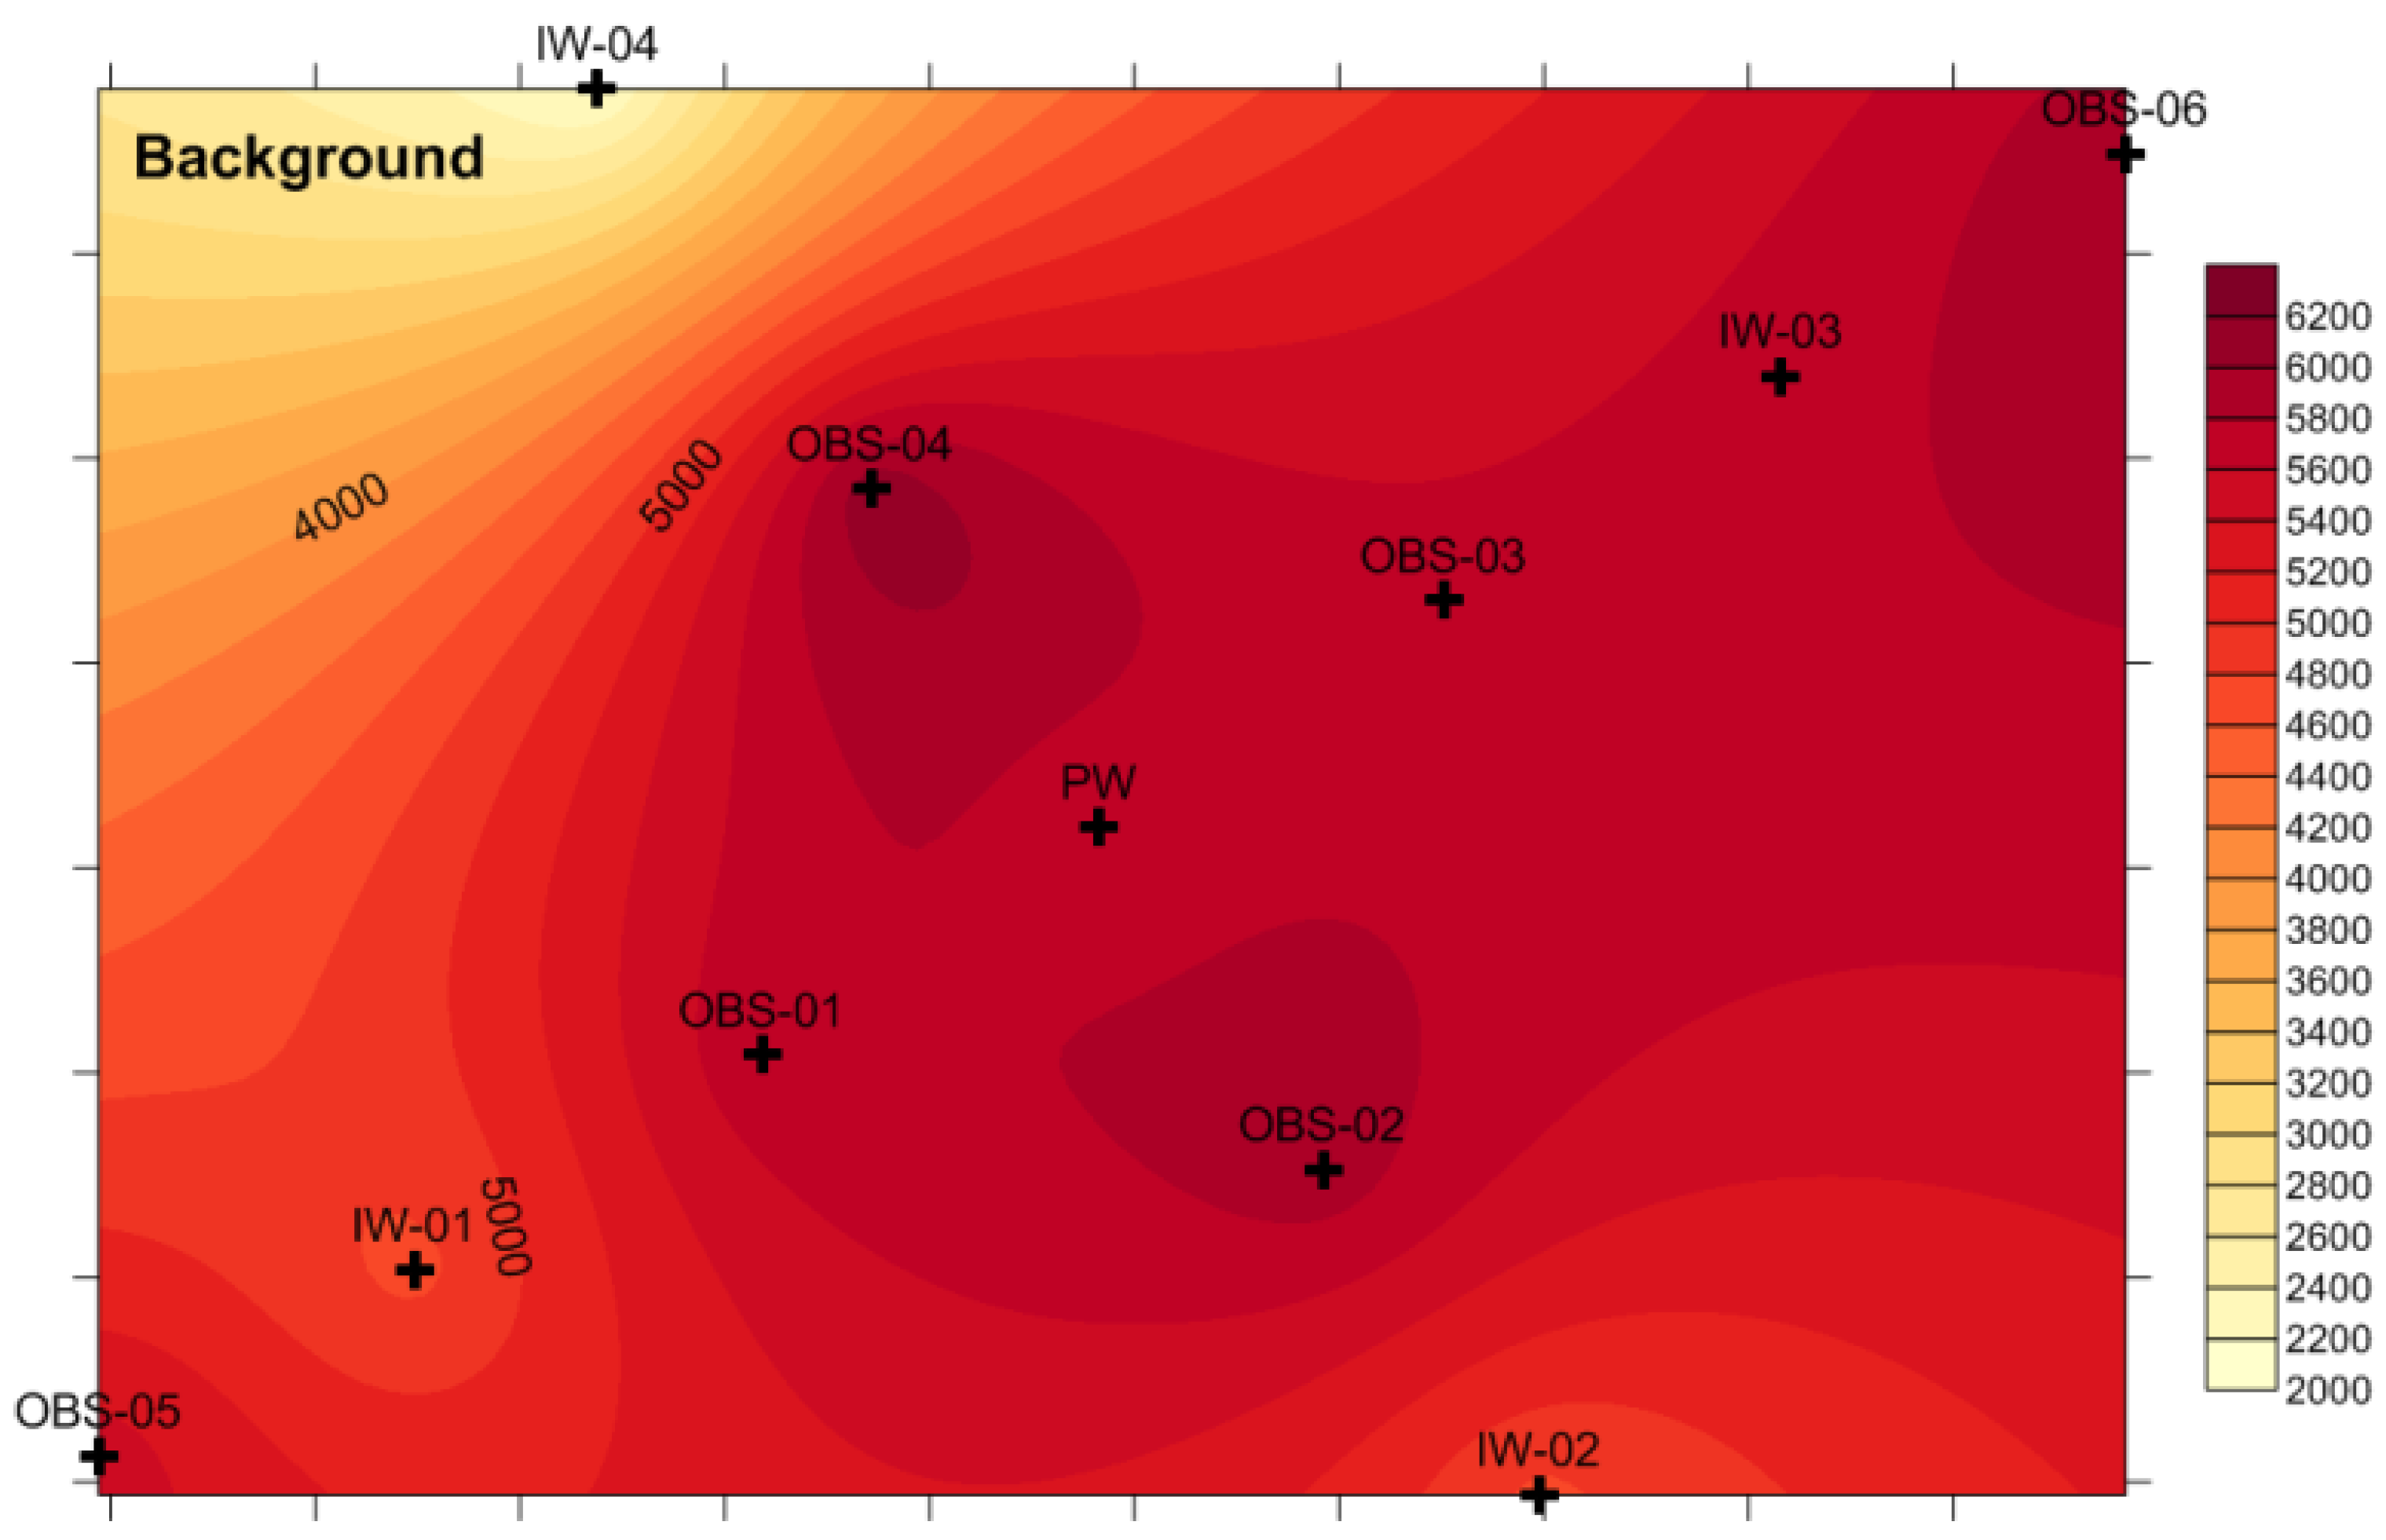
The distribution of the remnant paleo-seawater around 25-m depth was produced by the dilution and elimination of the remnant paleo-saltwater. A higher salt concentration was identified near the pumping well and a lower concentration appeared around the IW-4 well (Figure 10). With pumping, the salt concentration decreased except at the pumping well and the observational wells 10 m distant from the pumping well. At the OBS-1 well near the riverbank, EC values showed a decreasing trend after a 16-h lapse since the pump start to ~3000 μS/cm after a 36-h lapse. In contrast, the EC of the IW-1 well 20 m from the pumping well decreased very slowly. The EC values of the OBS-5 well 30 m distant from the pumping illustrated nearly no change after a 6-h lapse. The OBS-6 well displayed a decreasing tendency of EC at a 6-h lapse. On the other hand, both the OBS-3 and OBS-4 wells demonstrated a high EC as well as minor variation for a long time following the pumping start. The IW-4 well in the direction of river flow exhibited low EC values with an insignificant change. The EC values of the IW-2 well decreased ~2000 μS/cm at 25 h. On the other hand, the OBS-2 well showed a high EC until 64 h compared to the nearby wells, but during the late stage of the pumping presented a lower EC of 1000 μS/cm relative to the surrounding observational wells. As a result, low EC values analogous to freshwater were identified in the direction of the OBS-2 and IW-2 wells (Figure 11).
The pumping test resulted in an irregularity of dilution and an elimination effect of the remnant paleo-seawater in terms of distance from the pumping well. The phenomenon can be explained by the remnant paleo-seawater that is contained in the clay and silt layers rather than inside the aquifer and is discharged while pumping, with a mixing of the remnant paleo-saltwater and freshwater from the main aquifer. For instance, sea level rise can cause seawater intrusion deeply to the inland along rivers, e.g., ~75 km inland from the sea [28]. The elevated salinity can be sustained in porewater in silt/clay aquitard systems [29].
As a result, in the study area, the freshwater aquifer is underlain by a paleo-seawater layer that was produced by sea water intrusion in the environment of the coastal region during the last glacial ice age.

4.5. Vertical Profile of Saltwater Bed

On the vertical profile of the OBS-1 well, the EC values abruptly increase at ~12-m depth, dividing the upper freshwater and lower paleo-saltwater. Most observation wells represent vertical profile of typical coastal aquifer type [30]. The vertical profiles display the mixing zone of upper freshwater and lower seawater that has 1.0–5.0 mS/cm and is located at depths between approximately 10 to 20 m on the vertical profiles of the wells (Figure 12). This phenomenon coincides well with the Neolithic sea level 3000–4000 years ago which was approximately 10 m higher than that of the present, as shown by shell mounds found in the southeastern region of the Korean Peninsula. During pumping of the OBS-1 well, the EC values consistently decreased.
For the OBS-2 well, the salinity during pumping decreased at the upper zone and the EC values were less than 1000 μS/cm in the range of freshwater at all depths during the time of shut-down, analogous to the OBS-1 well. The OBS-3 well showed the greatest drawdown and an EC change of ~6.0–5.0 mS/cm at the lower zone. The OBS-4 well also behaved similarly to a typical coastal aquifer with a distinct EC change with depth. The OBS-5 well showed the smallest EC change below 15-m depth during the pumping test.
The OBS-6 well showed a high EC value of ~6.0 mS/cm at the lower zone during the initial period. However, the mixing of fresh and paleo-salt waters occurred with progress in the pumping and the EC values were the same from ~13-m depth to the bottom of the well after a 25-h lapse, showing a decreasing tendency (Figure 12).

5. Discussion and Conclusions

Pumping tests and EC logging were performed in a riverside alluvium of the Nakdong River in South Korea in order to produce drinking water using AAR technique. Via the pumping tests, the study area was shown to be composed of an upper freshwater layer and a lower remnant paleo-seawater layer, representing a typical coastal aquifer that was formed during the last glacial ice age. The pumping test analysis showed T values of 1.14 × 10⁻⁴–4.76 × 10⁻³ m2/s with an average of 1.86 × 10⁻³ m2/s and S values of 1.5 × 10⁻⁵–1.1 × 10⁻². T and S values in the direction of the river (from the pumping well to the OBS-3 and MLW-3 wells) were highly related to distance from the pumping well.
Most of the observational wells showed a decreasing EC trend during pumping with the zonation of upper freshwater and lower paleo-saltwater. Remarkably, the OBS-4 illustrated a high value and minor variation of EC over a long period from the pumping start that seems to be related to a thick clay layer of paleo-salt saltwater. The vertical profile of the OBS-4 well shows that of a typical coastal aquifer with an increasing tendency of EC values with depth. The Na-Cl and SO4-Cl relationships of the lower aquifer suggest river-seawater mixing that explains seawater intrusion indicated by shell mounds formed 3000 to 4000 years ago.
As a result of the study, the aquifer in the study area was proven to be highly anisotropic and heterogeneous while the pumping test analysis assumes the aquifer’s isotropy and homogeneity. The varying EC values as well as irregular groundwater heads in both the vertical and lateral directions also indicated the anisotropic and heterogeneous properties of the studied aquifer system.

Author Contributions

The idea of this article was developed by S.-H.L. The text was mainly written by S.-H.L and S.-Y.H. K.H., Y.K., D.-C.K., H.Y. and S.-W.K. collected and analyzed field data

Acknowledgments

This study was supported financially by the 2014 Basic Research (18-3411) of the Korea Institute of Geoscience and Mineral Resources.

Conflicts of Interest

The authors declare no conflict of interest.

References

  1. Ray, C. Riverbank Filtration: Understanding Contaminant Biogeochemistry and Pathogen Removal; Kluwer Academic Publishers: Dordrecht, The Netherlands, 2001; p. 253. [Google Scholar]
  2. Korea Water Corporation. Report on Pilot Survey of Hydraulic Property of Fluvial Deposits for Water Resource Utilization; Korea Water Corporation: Daejeon, Korea, 1995; p. 132. [Google Scholar]
  3. Hamm, S.-Y.; Cheong, J.-Y.; Ryu, S.M.; Kim, M.J.; Kim, H.S. Hydrogeological characteristics of bank storage area in Daesan-Myeon, Changwon City, Korea. J. Geol. Soc. Korea 2002, 38, 595–610. [Google Scholar]
  4. Hamm, S.-Y.; Cheong, J.-Y.; Kim, H.S.; Hahn, J.S.; Cha, Y.H. Groundwater flow modeling in a riverbank filtration area, Deasan-Myeon, Changwon City. Econ. Environ. Geol. 2005, 38, 67–78. [Google Scholar]
  5. Seo, J.A.; Kim, Y.C.; Kim, J.S.; Kim, Y.J. Site prioritization for artificial recharge in Korea using GIS mapping. J. Soil Groundw. Environ. 2011, 16, 66–78. [Google Scholar] [CrossRef]
  6. Kim, Y.C.; Seo, J.A.; Ko, K.S. Trend and barrier in the patents of artificial recharge for securing groundwater. j. Soil Groundw. Environ. 2012, 17, 59–75. [Google Scholar] [CrossRef]
  7. Haq, B.U.; Hardenbol, J.; Vail, P.R. Chronology of fluctuating sea levels since the Triassic (250 million years ago to present). Science 1987, 235, 1156–1167. [Google Scholar] [CrossRef] [PubMed]
  8. Oldale, R.N.; O’Hara, C.J. New radiocarbon dates from the inner continental shelf off Southeastern Massachusetts and a local sea level rise curve for the past 12,000 yr. Geology 1980, 8, 102–106. [Google Scholar] [CrossRef]
  9. Fairbanks, R.G. A 17,000-year glacio-eustatic sea level record; influence of glacial melting rates on the Younger Dryas event and deep-ocean circulation. Nature 1989, 342, 637–642. [Google Scholar] [CrossRef]
  10. Plag, H.-P.; Jules-Plag, S. Sea-Level Rise and Coastal Ecosystems. In Vulnerability of Ecosystems to Climate. Climate Vulnerability: Understanding and Addressing Threats to Essential Resources; Pielke, S.R.A., Seastedt, T., Suding, K., Eds.; Elsevier: Amsterdam, The Netherlands, 2013; Volume 4, pp. 163–184. [Google Scholar] [CrossRef]
  11. Masciopinto, C.; Liso, I.S. Assessment of the impact of sea-level rise due to climate change on coastal groundwater discharge. Sci. Total Environ. 2016, 569–570, 672–680. [Google Scholar] [CrossRef] [PubMed]
  12. Nicholls, R.J.; Cazenave, A. Sea-level rise and its impact on coastal zones. Science 2010, 328, 1517–1520. [Google Scholar] [CrossRef] [PubMed]
  13. Van Weert, F.; Van der Gun, J.; Reckman, J. Global Overview of Saline Groundwater Occurrence and Genesis; Report nr. GP 2009-1; International Groundwater Resources Assessment Centre: Utrecht, Netherlands, 2009; p. 109. [Google Scholar]
  14. Post, V.E.A.; Groen, J.; Kooi, H.; Person, M.; Ge, S.; Edmunds, W.M. Offshore fresh groundwater reserves as a global phenomenon. Nature 2013, 504, 71–78. [Google Scholar] [CrossRef] [PubMed]
  15. Delsman, J.R. Saline Groundwater–Surface Water Interaction in Coastal Lowlands; IOS press BV: Amsterdam, The Nerherlands, 2015; p. 194. ISBN 978-1-61499-517-3. [Google Scholar]
  16. Kooi, H.; Groen, J.; Leijnse, A. Modes of seawater intrusion during transgressions. Water Resour. Res. 2000, 36, 3581–3589. [Google Scholar] [CrossRef]
  17. Post, V.E.A.; Kooi, H. Rates of salinization by free convection in high-permeability sediments: Insights from numerical modeling and application to the Dutch coastal area. Hydrogeol. J. 2003, 11, 549–559. [Google Scholar] [CrossRef]
  18. Chang, J.H.; Park, Y.A.; Han, S.J. Late Quaternary stratigraphy and sea-level change in the tidal flat of Gomso Bay, West Coast of Korea. Sea J. Korean Soc. Ocean. 1996, 1, 59–72. [Google Scholar]
  19. Cheong, J.-Y.; Hamm, S-.Y.; Kim, H.S.; Ko, E.J.; Yang, K.; Lee, J.H. Estimating hydraulic conductivity using grain-size analyses, aquifer tests, and numerical modeling in a riverside alluvial system in South Korea. Hydrogeol. J. 2008, 16, 1129–1143. [Google Scholar] [CrossRef]
  20. Kim, N.J.; Lee, H.K. Geologic map of Yeongsan area (1:50,000); National Geological Survey: Seoul, Korea, 1964; p. 52. [Google Scholar]
  21. Papadopulos, I.S.; Cooper, H.H. Drawdown in a well of large diameter. Water Resour. Res. 1967, 3, 241–244. [Google Scholar] [CrossRef]
  22. Hantush, M.S.; Jacob, C.E. Non-steady radial flow in an infinite leaky aquifer. EOS 1955, 36, 95–100. [Google Scholar] [CrossRef]
  23. Moench, A.F. Transient flow to a large-diameter well in an aquifer with storative semiconfining layers. Water Resour. Res. 1985, 21, 1121–1131. [Google Scholar] [CrossRef]
  24. Neuman, S.P. Effect of partial penetration on flow in unconfined aquifers considering delayed gravity response. Water Resour. Res. 1974, 10, 303–312. [Google Scholar] [CrossRef]
  25. Cooper, H.H.; Jacob, C.E. A generalized graphical method for evaluating formation constants and summarizing well field history. Am. Geophys. Union Trans. 1946, 27, 526–534. [Google Scholar] [CrossRef]
  26. Theis, C.V. The relation between the lowering of the piezometric surface and the rate and duration of discharge of a well using groundwater storage. Am. Geophys. Union Trans. 1935, 16, 519–524. [Google Scholar] [CrossRef]
  27. Wang, Y.; Jiao, J.J.; Cherry, J.A.; Lee, C.M. Contribution of the aquitard to the regional groundwater hydrochemistry of the underlying confined aquifer in the Pearl River Delta, China. Sci. Total Environ. 2013, 461, 663–671. [Google Scholar] [CrossRef] [PubMed]
  28. Shi, L.; Jiao, J.J. Seawater intrusion and coastal aquifer management in China: A review. Environ. Earth Sci. 2014, 72, 2811–2819. [Google Scholar] [CrossRef]
  29. Wang, Y.; Jiao, J.J. Origin of groundwater salinity and hydrogeochemical processes in the confined Quaternary aquifer of the Pearl River Delta, China. J. Hydrol. 2012, 438, 112–124. [Google Scholar] [CrossRef]
  30. Kim, K.-Y.; Han, W.S.; Park, E. The impact of highly permeable layer on hydraulic system in a coastal aquifer. Hydrol. Process. 2012, 27, 3128–3138. [Google Scholar] [CrossRef]
Figure 1. Map of the study site in Daesan-myeon, Changweon.
Water 10 00835 g001
Figure 2. Subsurface geologic logs of the wells and cross-section A-A’ and B-B’.
Water 10 00835 g002
Figure 3. Location of shell mounds deposited 3000 to 4000 years ago.
Water 10 00835 g003
Figure 4. Changes in water level of the observational wells during the pumping test. The number in parentheses refers to the distance from the pumping well.
Water 10 00835 g004
Figure 5. Cross-sections A-A’ and B-B’ showing drawdown in the pumping and observation wells during pumping test.
Water 10 00835 g005
Figure 6. Hantush–Jacob (1955) leaky aquifer model of pumping tests at the OBS-3, MLW-1, MLW-2, MLW-3, and OBS-5 observation wells.
Water 10 00835 g006
Figure 7. T vs. S at observational wells at various distances from the PW well.
Water 10 00835 g007
Figure 8. Major ions and Cl concentrations of the Nakdong River and groundwater in the upper and lower aquifers.
Water 10 00835 g008
Figure 9. Changes in EC values at 25-m depth along the cross-sections (a) A-A’ and (b) B-B’ during drawdown and recovery. The numbers in parentheses refer to the distance from the pumping well.
Water 10 00835 g009
Figure 10. Areal distribution of background EC values (mS/cm) at 25-m depth from the surface in the study area.
Water 10 00835 g010
Figure 11. Areal EC values at 25-m depth with elapsed times during the pumping test.
Water 10 00835 g011
Figure 12. Changes in the vertical profiles of temperature and EC values at the observational wells during the pumping test.
Water 10 00835 g012
Table 1. Pumping, injection, and observational wells in the study area.
WellXYElevation (EL. m)Well Depth (m)DTW (m)EC Logging Depth (m)
PW177,584.1305,3718.81735.07.02-
IW 1177,567.4305,360.28.72535.07.0-
IW 2177,594.9305,354.78.81535.0--
IW 3177,600.8305,3828.77934.57.08-
IW 4177,571.9305,3898.80235.0--
OBS 1177,575.9305,365.48.79135.07.1728.3
OBS2177,589.6305,362.68.8135.07.1729.8
OBS3177,592.6305,376.58.88635.07.0733.8
OBS4177,578.6305,379.28.9835.07.3632.8
OBS5177,559.7305,355.68.92935.07.3124.4
OBS6177,609.2305,387.49.00235.07.3630.5
MLW1177,621.3305,395.79.03434.57.23-
MLW2177,633.8305,403.79.03434.57.35-
MLW3177,646.2305,411.98.89435.57.35-
PW: Pumping well; IW: Injection well; OBS: Observation well; MLW: Multilayered well; EL: Elevation in mean sea level; DTW: Depth to water.
Table 2. Hydraulic parameters at the observation wells using pumping test solutions.
WellAquifer ModelSolutionDrawdown (1 Step, m)T (m2/s)S
OBS-1unconfinedCooper-Jacob (1946)0.14.67 × 10−30.25
OBS-2unconfinedCooper-Jacob (1946)0.044.76 × 10−32.26
OBS-3leakyHantush-Jacob (1955)6.481.14 × 10−41.7 × 10⁻⁴
OBS-4unconfinedNeuman (1974)0.094.19 × 10−35.2 × 10⁻³
OBS-5LeakyHantush-Jacob (1955)0.275.52 × 10−41.1 × 10⁻²
OBS-6unconfinedNeuman (1974)0.11.91 × 10−39.6 × 10⁻³
MLW-1LeakyHantush-Jacob (1955)4.971.22 × 10−41.5 × 10⁻⁵
MLW-2LeakyHantush-Jacob (1955)3.282.06 × 10−46.3 × 10⁻⁵
MLW-3leakyHantush-Jacob (1955)3.162.11 × 10−44.6 × 10⁻⁵
Table 3. Groundwater levels and EC values at 25-m depth at the wells during the pumping test.
Well No.Distance (m)Depth to Water (h, m)EC (mS/cm)
InitialFinalhInitialFinal∆EC
PW06.8722.215.335.63.22.4
OBS110m6.937.070.145.82.53.3
OBS210m6.967.070.115.90.85.1
OBS310m6.6919.4712.495.75.30.4
OBS410m6.987.140.166.25.30.9
IW1 *20m---4.72.32.4
IW220m7.057.630.584.70.74.0
IW420m6.957.370.422.11.90.2
OBS530m7.067.70.645.53.71.8
OBS630m7.057.210.165.91.04.9
IW1 *: Pressure sensor error.