Water Use Efficiency and Its Influencing Factors in China: Based on the Data Envelopment Analysis (DEA)—Tobit Model

Abstract
1. Introduction
2. Materials and Methods
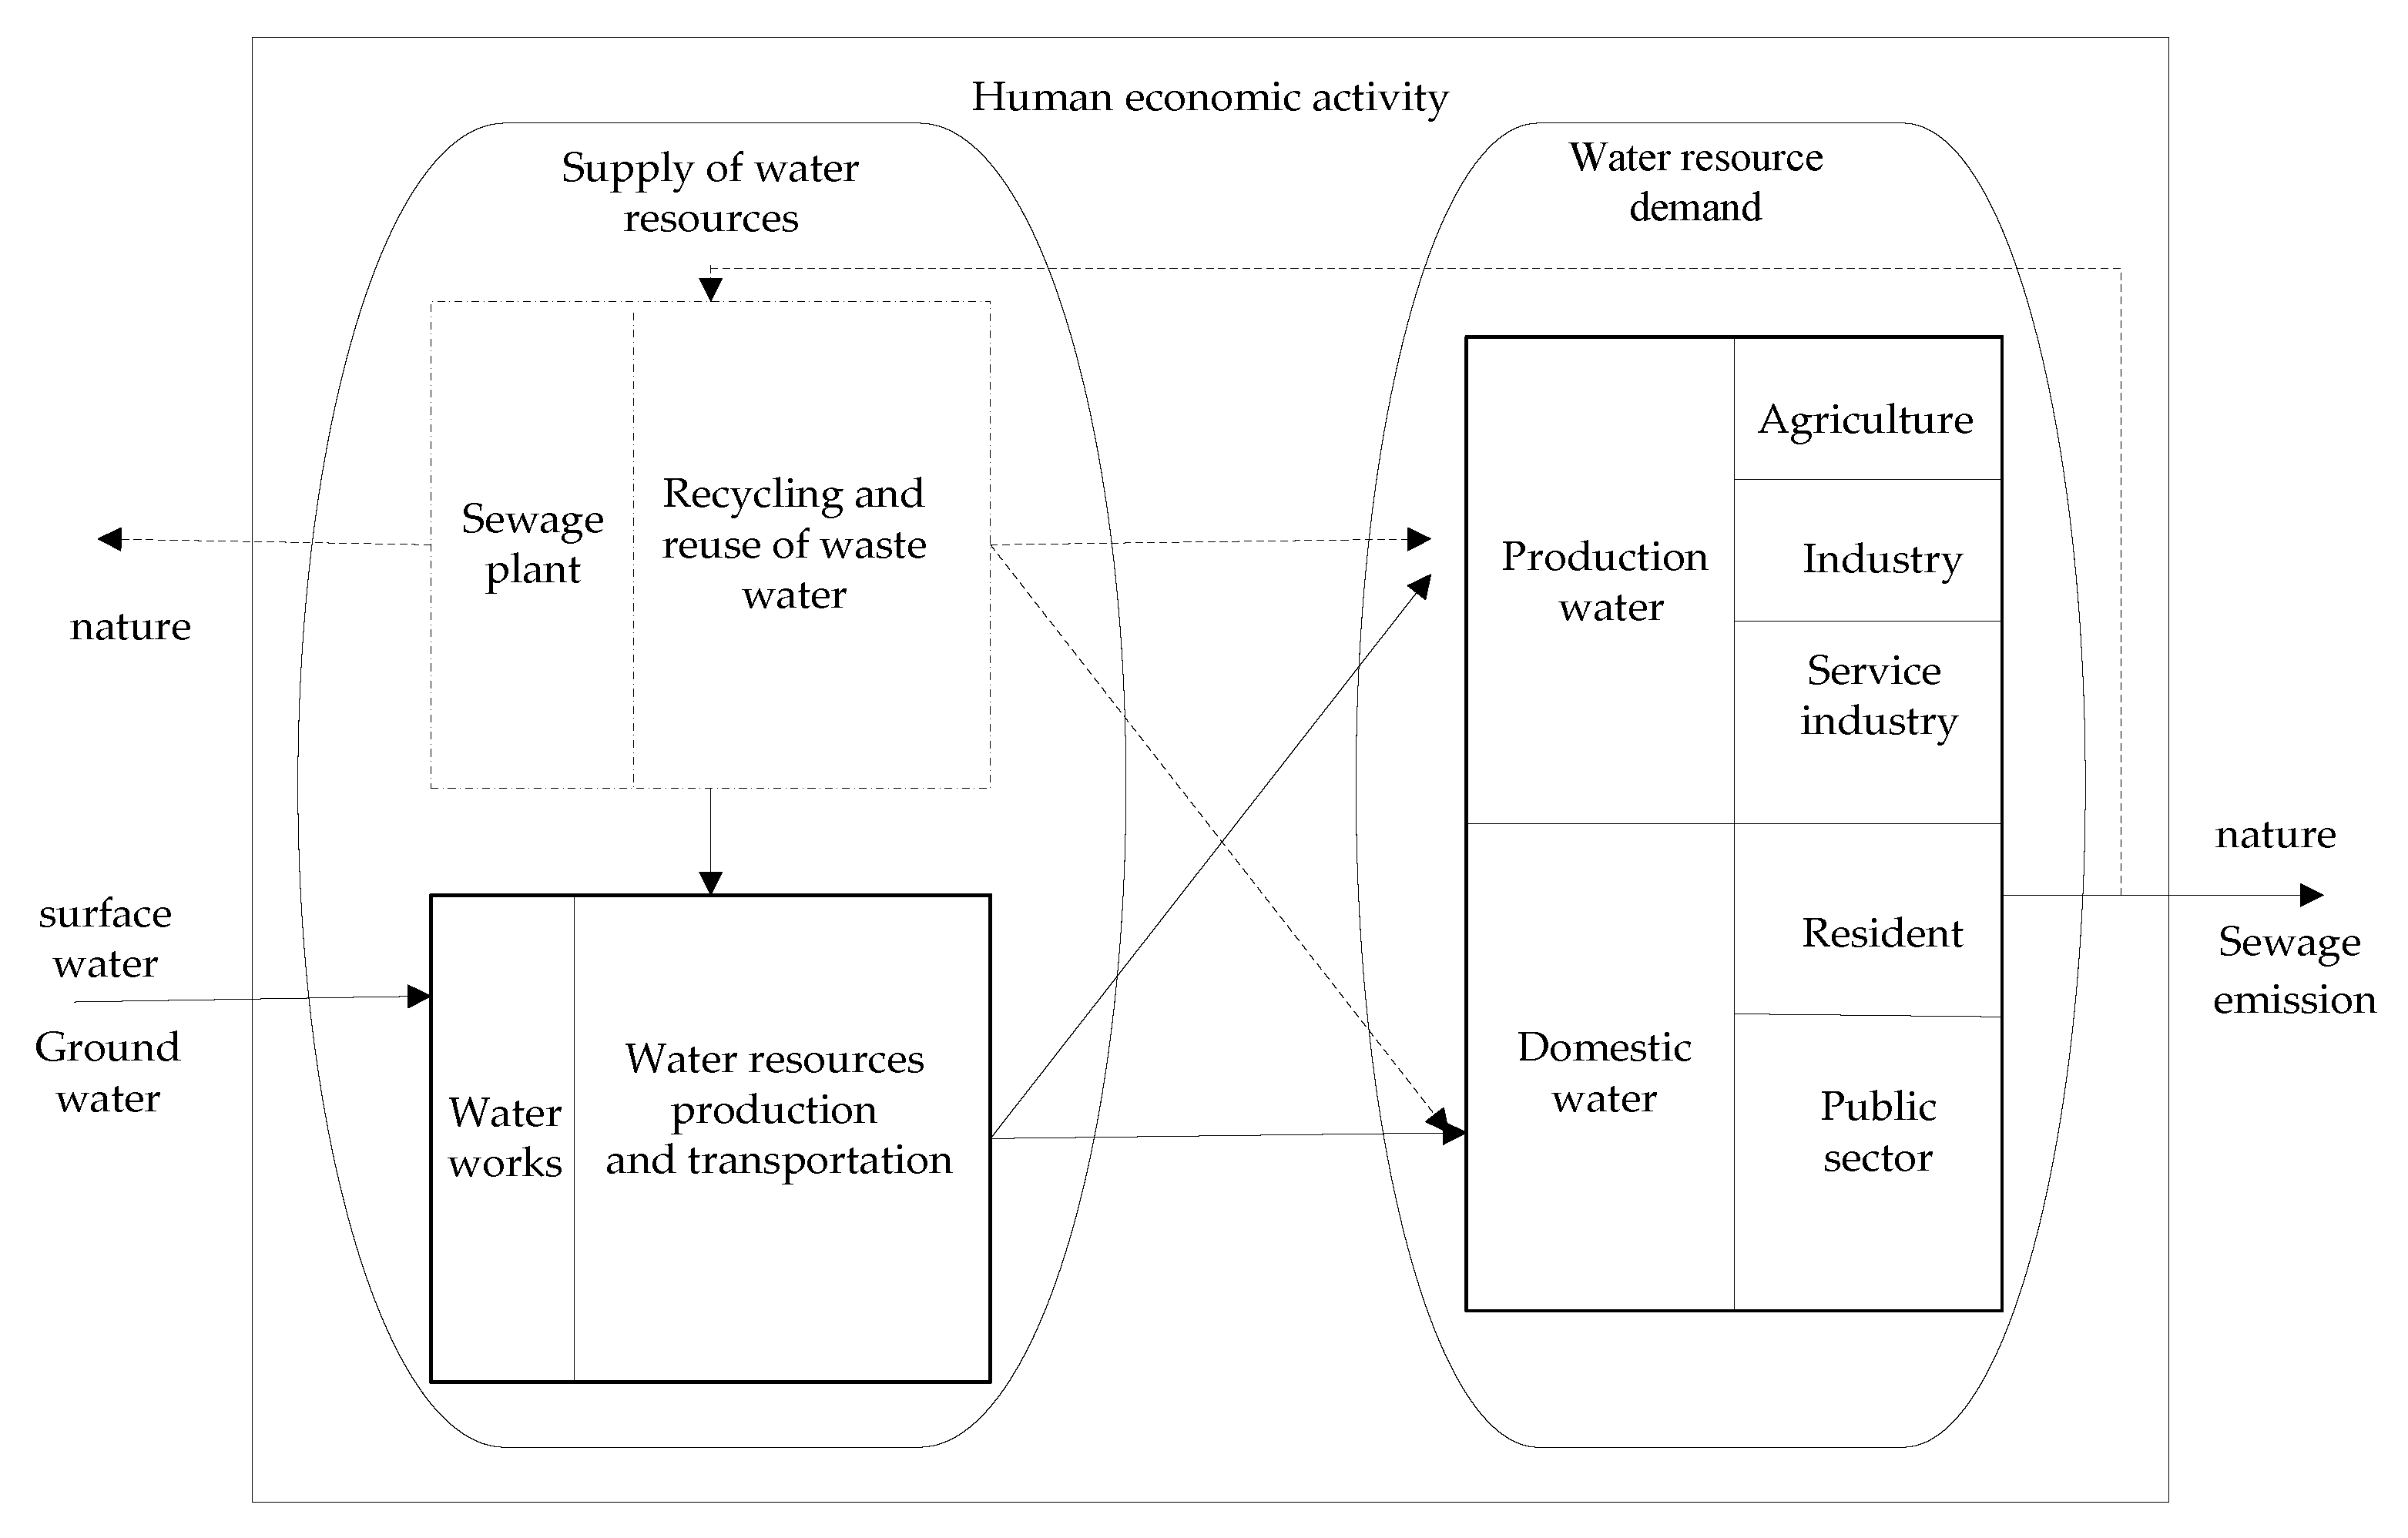
2.1. Water Use Efficiency Calculation Method
2.2. The Tobit Regression Model
2.3. Definition of Water Use Efficiency
3. Data
3.1. Input-Output Indicators
- The ratio cannot be considered as an indicator.
- The indicators are authentic.
- There is no difficulty in collecting index data.
- The indictors reflect a basic production relationship.
3.2. Factors that Influence Water Resource Efficiency
- From the points of the endogenous economic growth theory, the technological progress is the engine of one country’s economic growth, and economic development is closely related to environmental protection. Thus, technological progress is an important factor in environmental performance. Production technology plays a positive role in effectively improving water environment management and decision-making. Thus, technological progress is conducive to improving water use efficiency. We determine it to be a factor of water use efficiency, and the number of invention patent applications is used as a proxy index for technological progress. Thus, the number of patent applications for inventions by X1 is introduced, and the coefficient of X1 is predicted to be positive.
- Government intervention will affect each Chinese province’s water resource input output because of the government’s influence on water usage efficiency, through environmental regulations, investment in water infrastructure, and sewage treatment, for example. Under the current worsening water environment, the government shoulders the important responsibility of water environment governance. Ma et al. [49] also considered government intervention as a factor that affects water use efficiency. As the water environment’s deterioration is primarily a result of excessive pollutant emissions across industrial enterprises, we selected the complete investments in industrial pollution control, which is denoted by X2, as the proxy index for government intervention. The coefficient of X2 is predicted to be negative.
- Water-rich countries or regions will export water-intensive products, while water resource intensive products are imported into countries with a shortage of water resources. Trade in agricultural and industrial products that consume large amounts of water will lead to the indirect transfer of water resources [50,51]. Further, trade will influence water resource management and usage efficiency. We posit that each region would prefer to gain more profit from export commodities, and it must decrease costs by promoting water use efficiency and export dependence; specifically, the proportion of export trade to GDP is expressed as X3, with its coefficient predicted to be positive.
- The promotion of education is conducive to improving the quality of knowledge, skills, and innovation in all aspects of the labor force. Such education can effectively reduce the waste of water resources and improve efficiency in water utilization. Therefore, the average number of schools per 100,000 people, as denoted by X4, is a significant element that influences water use efficiency. Its effect is expected to be positive.
- According to the theory of sustainable development, the industrial structure has a direct or indirect effect on the type, scale, and cause of the formation of pollutants. Industrial structure is considered to be a key factor that influences water use efficiency [52,53]. Agricultural production uses substantial quantities of water. The agricultural irrigation mode and surface pollution all affect water use efficiency. Whether or not the other industrial development stages and models include high water consumption and pollution, industrial water use will influence a region’s water resource efficiency. This index is characterized by the ratio of industrial value added to the GDP, as denoted by X5. The coefficient of X5 is expected to be negative.
4. Results and Discussion
4.1. Estimate Results for Water Resource Efficiency
- The promotion of water use efficiency each year from 2008–2013 may be explained by the State Council’s decision to expedite water conservancy reform, introduce an emissions permit system, and enhance environmental protection consciousness. However, water use efficiency deteriorated from 2015–2016, with rapid economic development and an increasing urban population.
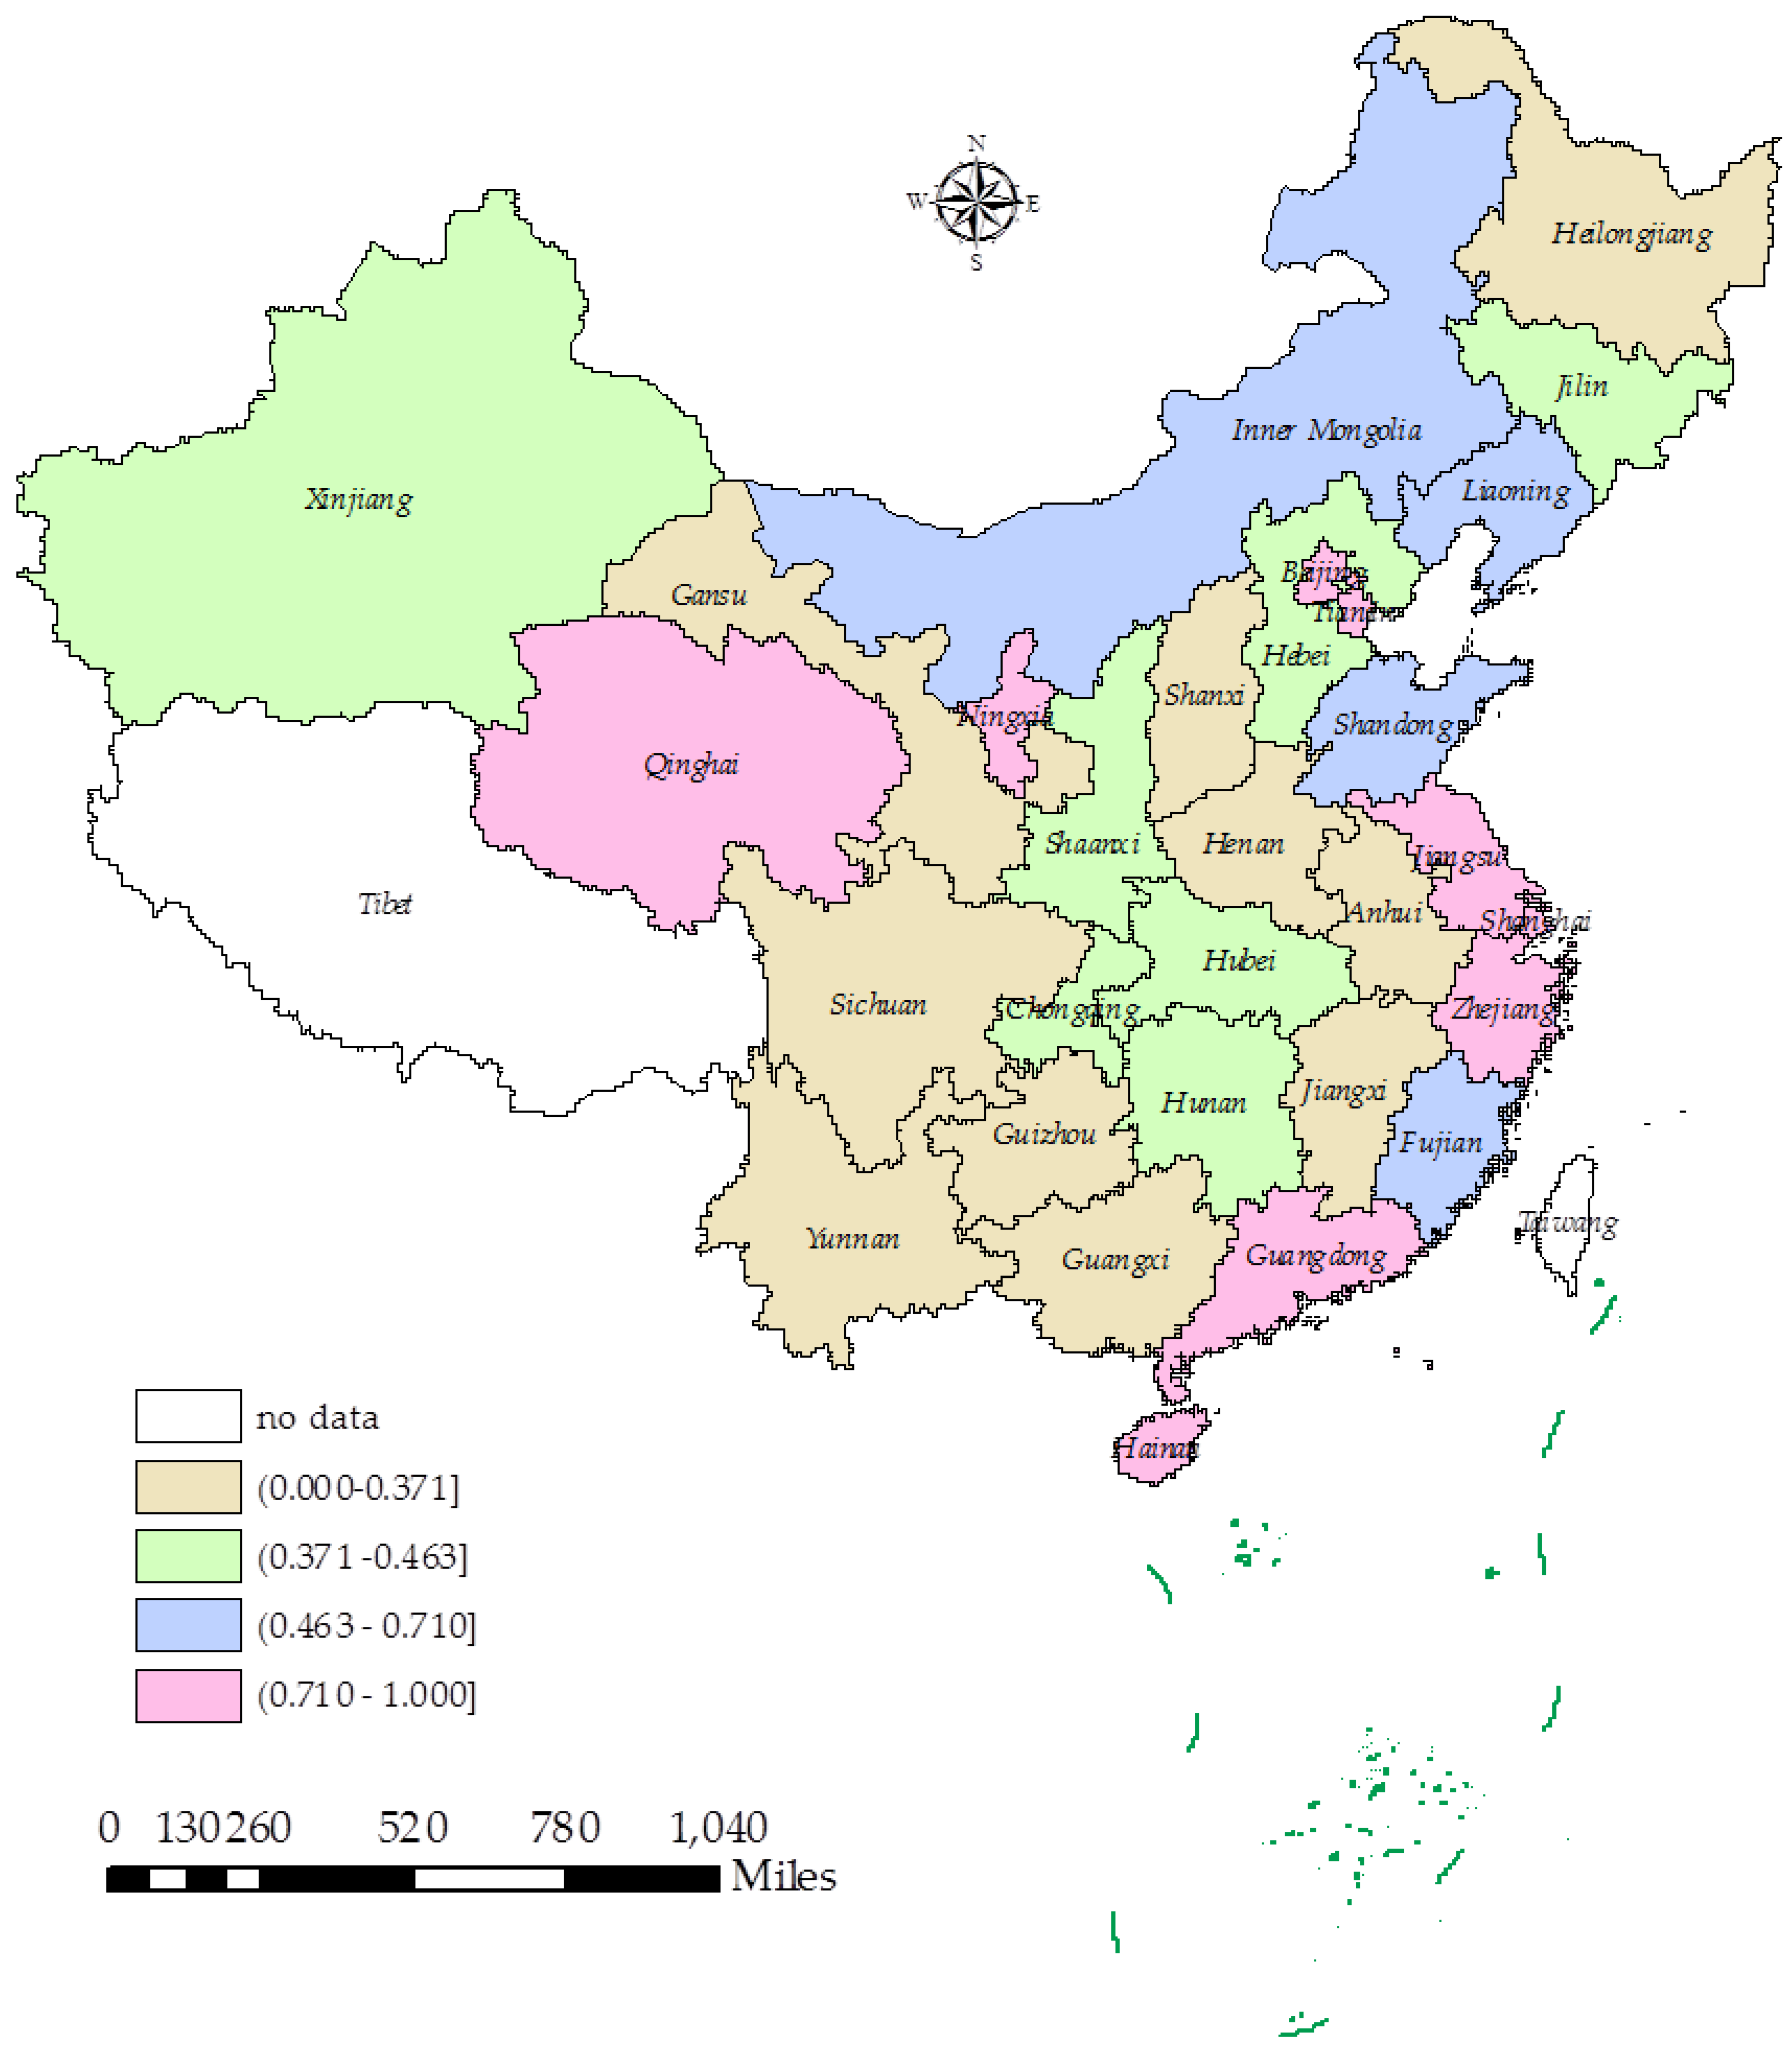
- Water use efficiency in Tianjin, Shanghai, Qinghai, Guangdong, and Beijing all equal 1 during 2008–2016. Specifically, these provinces are in the efficiency frontier and their efficiency is ideal.
- More than half of the 30 provinces did not exhibit an optimal water use efficiency level during 2008–2016. Seven provinces (including five efficient regions) have an efficiency of 1 and a mean efficiency greater than 0.9, including Jiangsu with 0.970 and Ningxia with 0.991. Yunnan performed the poorest with 2008–2016 efficiencies at 0.213,0.218,0.218,0.240,0.251,0.267,0.271,0.281, and 0.285.Its mean efficiency in the sample period was only 0.249. Other provincial regions also did not achieve an effective input and output of water resources, according to their mean efficiencies. For example, Hebei had a mean efficiency of 0.403; Fujian’s was 0.585; Liaoning’s was 0.573; and, Heilongjiang’s was 0.364.
- Water use efficiency exhibited a wave-like curve for Shanxi, Jilin, and Jiangsu. Specifically, Xinjiang’s water use efficiency decreased from 0.470 to 0.464 (in 2008–2009); then increased from 0.464 to 0.499 (2009–2010); then decreased from 0.499 to 0.493 (2010–2011); then decreased further from0.493 to 0.487 (2011–2012), from 0.487 to 0.476 (2012–2013), from 0.476to 0.463 (2013–2014), from 0.463 to 0.424 (2014–2015), and finally, from 0.424 to 0.392 (2015–2016). Our study’s results differ from existing research because of the input and output indicators of water use efficiency we elected to utilize [48,53].
- Finally, we note that water use efficiency in developed provincial regions is generally better than that in less-developed provincial regions, which is consistent with findings from previous research [48,54]. For example, the mean water use efficiency of developed provinces, like Tianjin, Shanghai, Beijing, Guangdong, and Jiangsu, is 1.000, 1.000, 1.000, 1.000, and 0.970, respectively, however the mean water use efficiency in less-developed regions, like Gansu, Shaanxi, and Guizhou is 0.344, 0.386, and 0.301, respectively.
4.2. Regional Differences
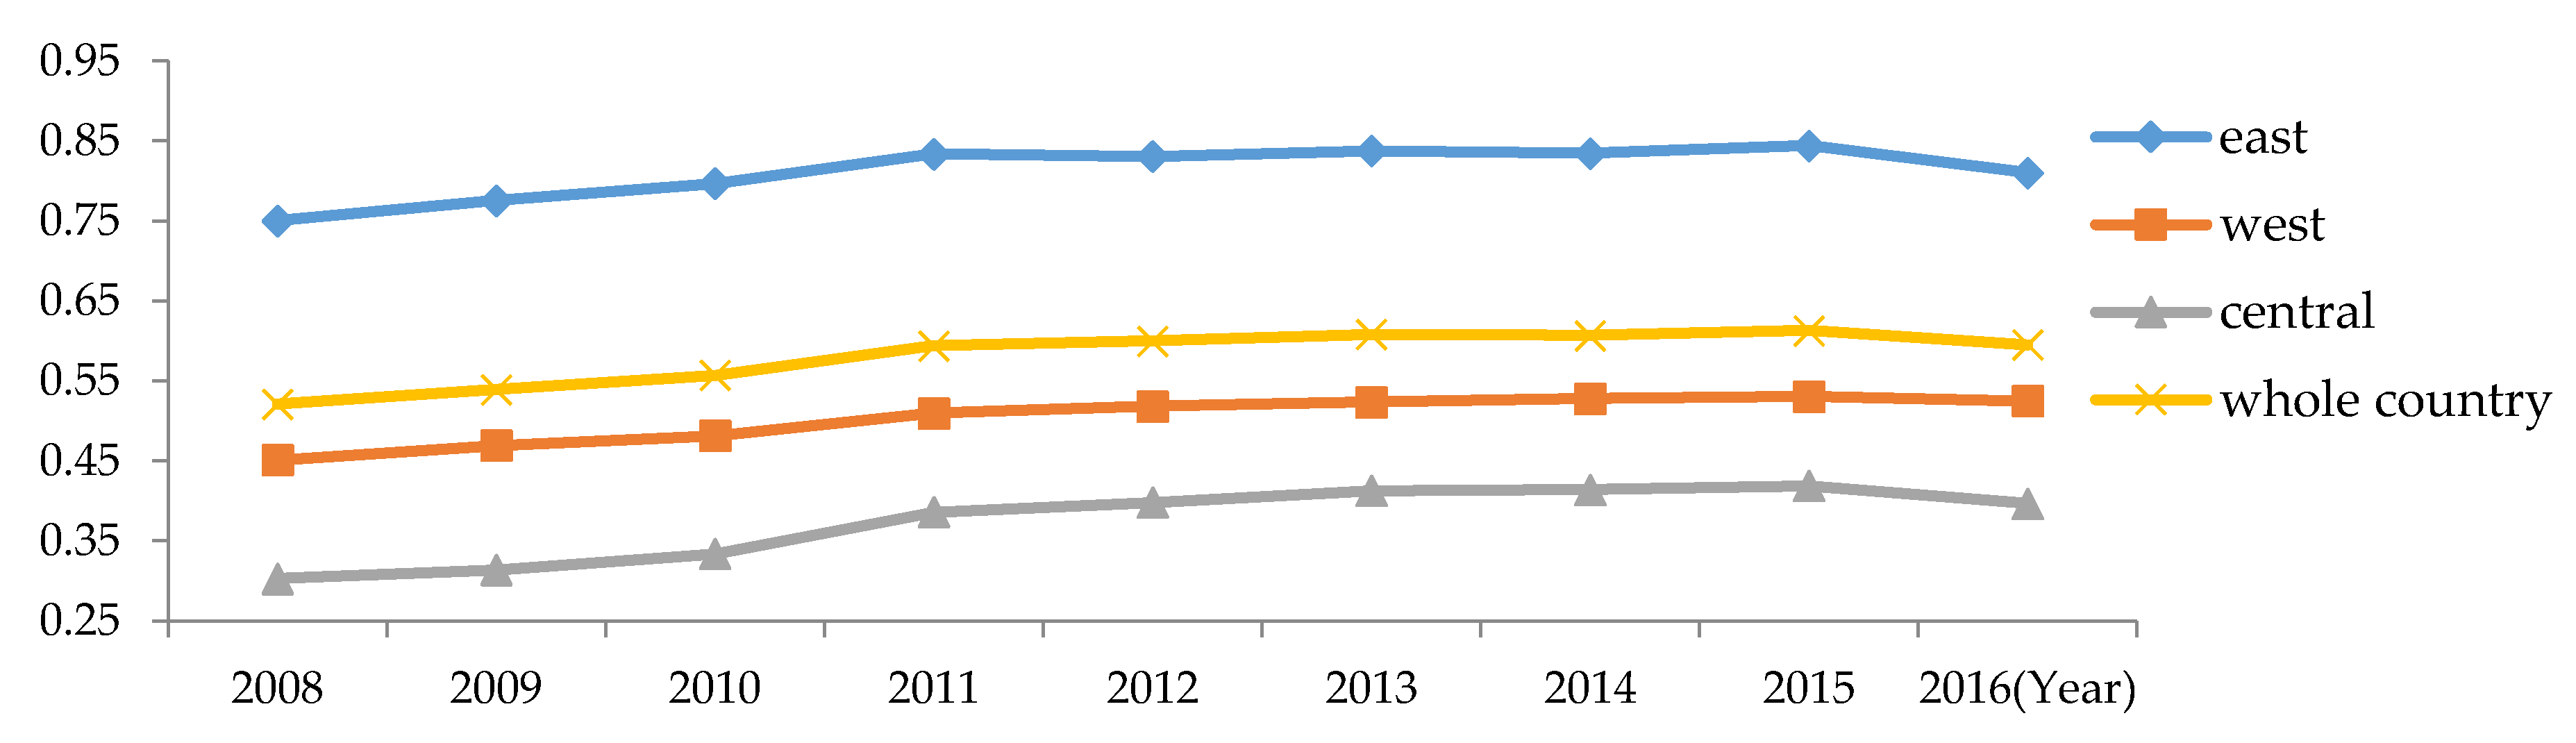
- During 2008–2016, China’s water use efficiency was distributed in such a way that the east had the highest efficiency, followed by the west, while the middle was the lowest. From the geometric mean, water resource development in the eastern region is better than that in the central and western regions.
- Water use efficiency in these three areas—and specifically, in Tianjin, Beijing, Guangdong, and Shanghai in the east—all reached 1. This demonstrates that water use efficiency in these four provinces was optimal, becoming the benchmark for other provinces. Of the 11 provinces, four (Shandong, Jiangsu, Hainan, and Zhejiang) had an average water use efficiency value that was between 0.70 and 1.00, while two (Fujian and Liaoning) had average water use efficiency values between 0.50 and 0.80, with Hebei exhibiting the lowest efficiency.
- Among the eight districts in the central area, Jilin had the highest value, which was less than Beijing and Qinghai—the places with the highest water use efficiency in the east and west, respectively.
- In the western area, Qinghai was ahead in water use efficiency and achieved technical effectiveness, which was possibly because of the strict water resource management system implemented by its provincial government. However, Yunnan’s value lags behind the other provinces. The efficiency of the three areas overall is less than 0.60.
4.3. Water Resource Efficiency Types
4.4. Influencing Factors
- For variable X2, government intervention has a negative relationship with water use efficiency. The greater the number of completed investments in industrial pollution controls, the more wastewater occurs. The higher the output of sewage emissions, the lower the water use efficiency. The regression coefficient did not pass the 10% significance test, with government intervention having a non-significant effect on water use efficiency. The government can use tax collection to compare with the external uneconomical consumption tax, or give subsidies relative to external economic value, in order to achieve effective allocation of resources in the future [56].
- For variable X3, Tianjin, Shanghai, Beijing, Jiangsu, and Zhejiang have higher export dependence and a higher water use efficiency. In order to produce more for exporting, those regions with higher export dependence should continuously improve their water use efficiency.
- For variable X4, education has a significant, positive effect on water use efficiency; that is, the higher the residents’ educational level, the more significance that environmental protection has to residents, and the more dissatisfied they will be with the current environmental situation. This will increase the urgency in improving this situation, as the improvement of knowledge and cultural levels create a better understanding of the dire situation of water resources and the environment in China.
- Finally, the industrial structure in variable X5 negatively impacts water use efficiency, as the regression coefficient did pass the 10% significance test, and the structure’s effect on water use efficiency was significant. This negative relationship is possibly related to industrial enterprises not having widely used water-saving technology. China’s industrial structure must be adjusted and optimized to some extent, as most industries in China consume high amounts of energy and water resources, and they emit pollution.
5. Conclusions
Author Contributions
Funding
Acknowledgments
Conflicts of Interest
References
- National Bureau of Statistics of China. China Statistical Yearbook (2009–2017); China Statistical Publishing House: Beijing, China, 2018. [Google Scholar]
- Zhao, D.; Liu, J. A new approach to assessing the water footprint of hydroelectric power based on allocation of water footprints among reservoir ecosystem services. Phys. Chem. Earth 2015, 79–82, 40–46. [Google Scholar] [CrossRef]
- Tang, Y.; Ma, Y.; Wong, C.W.Y.; Miao, X. Evolution of government policies on guiding corporate social responsibility in China. Sustainability 2018, 10, 741. [Google Scholar] [CrossRef]
- Shi, D. Theories and Practices of China’s Industrial Green Development: Policy Options for Deepening the Green Development. Contemp. Financ. Econ. 2018, 1, 3–8. [Google Scholar]
- Molinos-Senante, M.; Marques, R.C.; Pérez, F.; GóMEZ, T.; Sale-Garrido, R.; Caballero, R. Assessing the sustainability of water companies: A synthetic indicator approach. Ecol. Indic. 2016, 61, 577–587. [Google Scholar] [CrossRef]
- Ali, M.K.; Klein, K.K. Water use efficiency and productivity of the irrigation districts in Southern Alberta. Water Resour. Manag. 2014, 28, 2751–2766. [Google Scholar] [CrossRef]
- Njiraini, G.W.; Guthiga, P.M. Are small-scale irrigators water use efficient? Evidence from Lake Naivasha Basin, Kenya. Environ. Manag. 2013, 52, 1192–1201. [Google Scholar] [CrossRef] [PubMed]
- Scaratti, D.; Michelon, W.; Scaratti, G. Evaluation of municipal service management efficiency of water supply and sanitation using Data Envelopment Analysis. Eng. Sanit. Ambient. 2013, 18, 333–340. [Google Scholar] [CrossRef]
- Morales, M.; Heaney, J. Benchmarking nonresidential water use efficiency using parcel-level data. J. WaterRes.Plan. Manag. 2015, 142, 04015064. [Google Scholar] [CrossRef]
- Azad, M.A.S.; Ancev, T.; Hernández-Sancho, F. Efficient water use for sustainable irrigation industry. Water Resour. Manag. 2015, 29, 1683–1696. [Google Scholar] [CrossRef]
- Molinos-Senante, M.; Hernández-Sancho, F.; Sala-Garrido, R. Cost–benefit analysis of water-reuse projects for environmental purposes: A case study for Spanish wastewater treatment plants. J. Environ. Manag. 2011, 92, 3091–3097. [Google Scholar] [CrossRef] [PubMed]
- Manjunatha, A.V.; Speelman, S.; Chandrakanth, M.G.; Van, H.G. Impact of groundwater markets in India on water use efficiency: A data envelopment analysis approach. J. Environ. Manag. 2011, 92, 2924–2929. [Google Scholar] [CrossRef] [PubMed]
- Raju, K.S.; Kumar, D.N. Ranking irrigation planning alternatives using data envelopment analysis. Water Resour. Manag. 2006, 20, 553–566. [Google Scholar] [CrossRef]
- Veettil, P.C.; Speelman, S.; Huylenbroeck, G.V. Estimating the impact of water pricing on water use efficiency in semi-arid cropping system: An application of probabilistically constrained nonparametric efficiency analysis. Water Resour. Manag. 2013, 27, 55–73. [Google Scholar] [CrossRef]
- Ren, C.; Li, R.; Guo, P. Two-Stage DEA Analysis of Water use efficiency. Sustainability 2016, 9, 52. [Google Scholar] [CrossRef]
- Long, K.; Pijanowski, B.C. Is there a relationship between water scarcity and water use efficiency in China? A national decadal assessment across spatial scales. Land Use Policy 2017, 69, 502–511. [Google Scholar] [CrossRef]
- Choi, K.H.; Cho, J.K. Case Study on the Jeollabuk-do Local Water Supply Efficiency by using DEA and Malmquist Index. J. Digit. Converg. 2014, 12, 571–580. (In Korean) [Google Scholar] [CrossRef]
- Lee, S. An Empirical analysis of the Efficiency of Multi-regionalization Local Water supply services. Korean Local Gov. Rev. 2016, 18, 121–142. (In Korean) [Google Scholar]
- Romano, G.; Guerrini, A. Measuring and comparing the efficiency of water utility companies: A data envelopment analysis approach. Util. Policy 2011, 19, 202–209. [Google Scholar] [CrossRef]
- Storto, C. Are public-private partnerships a source of greater efficiency in water supply? Results of a non-parametric performance analysis relating to the Italian industry. Water 2013, 5, 2058–2079. [Google Scholar] [CrossRef]
- Torres, M.; Paul, C.J.M. Driving forces for consolidation or fragmentation of the US water utility industry: A cost function approach with endogenous output. J. Urban Econ. 2006, 59, 104–120. [Google Scholar] [CrossRef]
- Ananda, J. Evaluating the Performance of Urban Water Utilities: Robust Nonparametric Approach. J. Water Res. Plan. Manag. 2014, 140, 431–439. [Google Scholar] [CrossRef]
- Azad, M.A.S.; Ancev, T. Measuring environmental efficiency of agricultural water use: A Luenberger environmental indictor. J. Environ. Manag. 2014, 145, 314–320. [Google Scholar] [CrossRef] [PubMed]
- Tone, K. A slacks-based measure of efficiency in data envelopment analysis. Eur. J. Oper. Res. 2001, 130, 498–509. [Google Scholar] [CrossRef]
- Hailu, A.; Veeman, T.S. Non-parametric productity analysis with undesirable outputs: An application to the Canadian pulp and paper industry. Am. J. Agric. Econ. 2001, 83, 605–616. [Google Scholar] [CrossRef]
- Zhou, C.; Shi, C.; Wang, S.; Zhang, G. Estimation of eco-efficiency and its influencing factors in Guangdong province based on Super-SBM and panel regression models. Ecol. Indic. 2018, 86, 67–80. [Google Scholar] [CrossRef]
- Bongo, M.F.; Ocampo, L.A.; Magallano, Y.A.D.; Manaban, G.A.; Ramos, E.K.F. Input–output performance efficiency measurement of an electricity distribution utility using super-efficiency data envelopment analysis. Soft Comput. 2018, 10, 1–15. [Google Scholar] [CrossRef]
- Charnes, A.; Cooper, W.W.; Rhodes, E. Measuring the efficiency of decision making units. Eur. J. Oper. Res. 1978, 2, 429–444. [Google Scholar] [CrossRef]
- Tu, Z.G.; Liu, L.K. Efficiency evaluation of industrial sectors in China accounting for the energy and environment factors based on provincial data by SBM approach. Econ. Rev. 2011, 2, 133–139. (In Chinese) [Google Scholar]
- Gómez-Calvet, R.; Conesa, D.; Gómez-Calvet, A.R.; Tortosa-Ausina, E. Energy efficiency in the European Union: What can be learned from the joint application of directional distance functions and slacks-based measures? Appl. Energy 2014, 132, 137–154. [Google Scholar] [CrossRef]
- Seiford, L.M.; Zhu, J. Model undesirable factors in efficiency evaluation. Eur. J.Oper. Res. 2002, 142, 16–20. [Google Scholar] [CrossRef]
- Banker, R.D.; Charners, A.; Cooper, W.W. Some model for estimating technical and scale inefficiencies in data envelopment analysis. Manag. Sci. 1984, 30, 1078–1092. [Google Scholar] [CrossRef]
- Cooper, W.W.; Ruiz, J.L.; Sirvent, I. Choosing weights from alternative optimal solutions of dual multiplier models in DEA. Eur. J. Oper. Res. 2007, 180, 443–458. [Google Scholar] [CrossRef]
- Carvalho, P.; Marques, R.C.; Berg, S. A meta-regression analysis of benchmarking studies on water utilities market structure. Util. Policy 2012, 21, 40–49. [Google Scholar] [CrossRef]
- Yang, Z.; Wang, D.; Du, T.; Zhang, A.; Zhou, Y. Total-Factor Energy Efficiency in China’s Agricultural Sector: Trends, Disparities and Potentials. Energies 2018, 11, 853. [Google Scholar] [CrossRef]
- Tobin, J. Estimation of relationships for limited dependent variables. Econom. J. Econom. Soc. 1958, 26, 24–36. [Google Scholar] [CrossRef]
- Debnath, A.K.; Blackman, R.; Haworth, N. A Tobit model for analyzing speed limit compliance in work zones. Saf. Sci. 2014, 70, 367–377. [Google Scholar] [CrossRef]
- Washington, S.P.; Karlaftis, M.G.; Mannering, F.L. Statistical and Econometric Methods for Transportation Data Analysis; CRC Press: Boca Raton, FL, USA, 2011; pp. 12–56. [Google Scholar]
- Alberta Water Council. Water Conservation, Efficiency and Productivity: Principles, Definitions, Performance Measures and Environmental Indicators; Final Report; Alberta Water Council: Edmonton, AB, Canada, 2007. [Google Scholar]
- Farrell, M.J. The measurement of productive efficiency. J. R. Stat. Soc. 1957, 120, 253–290. [Google Scholar] [CrossRef]
- Song, M.; Guan, Y. The environmental efficiency of Wanjiang demonstration area: A Bayesian estimation approach. Ecol. Indic. 2014, 36, 59–67. [Google Scholar] [CrossRef]
- Han, J.; Wang, Y.; Chen, C. A study on regional differences of industrial carbon emissions performance and its factors in China spatial econometric analysis based on provincial data. Comp. Econ. Soc. Syst. 2015, 1, 113–124. (In Chinese) [Google Scholar]
- Cao, X.; Ren, J.; Wu, M.; Guo, X.; Wang, Z.; Wang, W. Effective use rate of generalized water resources assessment and to improve agricultural water use efficiency evaluation index system. Ecol. Indic. 2017, 86, 58–66. [Google Scholar] [CrossRef]
- Asumadu-sarkodie, S.; Owusu, P.A. Carbon dioxide emissions, GDP per capita, industrialization and population. Environ. Eng. Res. 2017, 22, 116–124. [Google Scholar] [CrossRef]
- Cameron, A.J.; Van, S.M.M.; Kunst, A.E.; Te Velde, S.J.; Van Lenthe, F.J.; Salmon, J.; Brug, J. Macroenvironmental factors including GDP per capita and physical activity in Europe. Med. Sci. Sports Exerc. 2013, 45, 278–285. [Google Scholar] [CrossRef] [PubMed]
- Zhang, J.; Wu, G.; Zhang, J. The Estimation of China’s provincial capital stock: 1952–2000. Econ. Res. J. 2004, 10, 35–44. (In Chinese) [Google Scholar]
- Cooper, W.W.; Seiford, L.M.; Tone, K. Introduction to Data Envelopment Analysis and Its Uses: With DEA-Solver Software and References; Springer Science & Business Media: Berlin, Germany, 2006; pp. 21–68. [Google Scholar]
- Deng, G.; Li, L.; Song, Y. Provincial water use efficiency measurement and factor analysis in China: Based on SBM-DEA model. Ecol. Indic. 2016, 69, 12–18. [Google Scholar] [CrossRef]
- Ma, H.; Huang, D.; Zhang, J.; Tian, Z. The provincial differences of China’s water use efficiency in recent years: Technological progress or technical efficiency. Resour. Sci. 2012, 34, 794–801. (In Chinese) [Google Scholar]
- Deng, G.; Wang, L.; Song, Y. Effect of variation of water-use efficiency on structure of Virtual Water trade-analysis based on input-output model. Water Resour. Manag. 2015, 29, 2947–2965. [Google Scholar] [CrossRef]
- Wang, Z.; Huang, K.; Yang, S.; Yu, Y. An input-output approach to evaluate the water footprint and virtual water trade of Beijing, China. J. Clean. Prod. 2013, 42, 1081–1095. [Google Scholar] [CrossRef]
- Su, S.P.; Huang, S.W.; Sun, X.X.; Lin, W.X. Analysis of sustainable use efficiency of provincial water resources. Chin. J. Eco-Agric. 2012, 20, 803–809. (In Chinese) [Google Scholar] [CrossRef]
- Li, J.; Ma, X. Econometric analysis of industrial water use efficiency in China. Environ. Dev. Sustain. 2015, 17, 1209–1226. [Google Scholar] [CrossRef]
- Su, G. Technical Efficiency of Corn Production in Main Producing Region in China Based on DEA-Tobit. Asian Agric. Res. 2010, 2, 5–7. [Google Scholar]
- Song, C.; Li, M.; Zhang, F.; He, Y.L.; Tao, W.Q. A data envelopment analysis for energy efficiency of coal-fired power units in China. Energy Convers. Manag. 2015, 102, 121–130. [Google Scholar] [CrossRef]
- Pinto, F.S.; Simões, P.; Marques, R.C. Raising the bar: The role of governance in performance assessments. Util. Policy 2017, 49, 38–47. [Google Scholar] [CrossRef]
- Chapagain, A.K.; Hoekstra, A.Y. Virtual Water Trade: A Quantification of Virtual Water Flows between Nations in Relation to International Crop Trade. J. Org. Chem. 2002, 11, 835–855. [Google Scholar]
- Ye, Q.; Li, Y.; Zhuo, L.; Zhang, W.; Xiong, W.; Wang, C. Optimal allocation of physical water resources integrated with virtual water trade in water scarce regions: A case study for Beijing, China. Water Res. 2018, 129, 264–276. [Google Scholar] [CrossRef] [PubMed]
- Hartmann, J.; van der Aa, M.; Wuijts, S.; de Roda Husman, A.M.; van der Hoek, J.P. Risk governance of potential emerging risks to drinking water quality: Analysing current practices. Environ. Sci. Policy 2018, 84, 97–104. [Google Scholar] [CrossRef]


| Index | Indicators (Unit) |
|---|---|
| Input | Labor (10 thousand capital) |
| Input | Capital (100 million dollar) |
| Input | Water (100 million m3) |
| Undesirable output | Sewage (10,000 tons) |
| Desirable output | Per capita GDP (dollar) |
| Variable | Unit | Mean | SD | Min | Max |
|---|---|---|---|---|---|
| Labor | 10 thousand capital | 616.90 | 352.62 | 47.02 | 1973.28 |
| Capital | 100 million dollar | 7039.67 | 6964.129 | 91.7044 | 39,045.57 |
| Water | 100 million m3 | 201.03 | 141.97 | 22.33 | 591.29 |
| Sewage | 10,000 tons | 593,035.60 | 189,494.10 | 1 | 910,986.90 |
| Per capita GDP | dollar | 6803.597 | 3603.4 | 1549.041 | 18,682.46 |
| Variable | Independent or Dependent | Unit | Mean | SD | Min | Max |
|---|---|---|---|---|---|---|
| Technological progress | Independent | 1000pieces | 4.678 | 7.169 | 0.023 | 40.952 |
| Government intervention | Independent | 10,000 million dollars | 3.497 | 3.107 | 0.059 | 22.763 |
| Education | Independent | 10,000 person/per 100,000population | 0.245 | 0.093 | 0.097 | 0.675 |
| Industrial structure | Independent | % | 46.8 | 8.1 | 19.3 | 59.0 |
| Export | Independent | % | 14.6 | 16.0 | 1.4 | 75.4 |
| Water use efficiency | Dependent | - | 0.582 | 0.276 | 0.213 | 1.000 |
| Province | 2008 | 2009 | 2010 | 2011 | 2012 | 2013 | 2014 | 2015 | 2016 | Mean |
|---|---|---|---|---|---|---|---|---|---|---|
| Beijing | 1.000 | 1.000 | 1.000 | 1.000 | 1.000 | 1.000 | 1.000 | 1.000 | 1.000 | 1.000 |
| Tianjin | 1.000 | 1.000 | 1.000 | 1.000 | 1.000 | 1.000 | 1.000 | 1.000 | 1.000 | 1.000 |
| Hebei | 0.327 | 0.342 | 0.361 | 0.429 | 0.436 | 0.463 | 0.440 | 0.428 | 0.406 | 0.403 |
| Shanxi | 0.358 | 0.329 | 0.348 | 0.361 | 0.365 | 0.356 | 0.339 | 0.327 | 0.305 | 0.343 |
| Inner Mongolia | 0.556 | 0.602 | 0.630 | 0.710 | 0.726 | 0.696 | 0.691 | 0.671 | 0.649 | 0.659 |
| Liaoning | 0.452 | 0.486 | 0.518 | 0.614 | 0.638 | 0.659 | 0.674 | 0.659 | 0.457 | 0.573 |
| Jilin | 0.378 | 0.406 | 0.421 | 0.475 | 0.487 | 0.488 | 0.489 | 0.487 | 0.465 | 0.455 |
| Heilongjiang | 0.350 | 0.333 | 0.330 | 0.376 | 0.393 | 0.389 | 0.381 | 0.372 | 0.349 | 0.364 |
| Shanghai | 1.000 | 1.000 | 1.000 | 1.000 | 1.000 | 1.000 | 1.000 | 1.000 | 1.000 | 1.000 |
| Jiangsu | 0.871 | 0.947 | 1.000 | 1.000 | 1.000 | 0.987 | 0.939 | 0.995 | 0.988 | 0.970 |
| Zhejiang | 0.703 | 0.754 | 0.813 | 0.896 | 0.860 | 0.843 | 0.824 | 0.856 | 0.840 | 0.821 |
| Anhui | 0.216 | 0.234 | 0.263 | 0.340 | 0.346 | 0.375 | 0.378 | 0.386 | 0.368 | 0.323 |
| Fujian | 0.445 | 0.477 | 0.489 | 0.621 | 0.600 | 0.647 | 0.656 | 0.672 | 0.656 | 0.585 |
| Jiangxi | 0.252 | 0.265 | 0.287 | 0.341 | 0.337 | 0.355 | 0.358 | 0.372 | 0.375 | 0.327 |
| Shandong | 0.567 | 0.627 | 0.687 | 0.716 | 0.744 | 0.759 | 0.763 | 0.812 | 0.713 | 0.710 |
| Henan | 0.295 | 0.316 | 0.346 | 0.386 | 0.391 | 0.403 | 0.411 | 0.410 | 0.384 | 0.371 |
| Hubei | 0.301 | 0.330 | 0.357 | 0.430 | 0.455 | 0.490 | 0.504 | 0.527 | 0.500 | 0.433 |
| Hunan | 0.273 | 0.295 | 0.316 | 0.377 | 0.409 | 0.445 | 0.452 | 0.468 | 0.453 | 0.388 |
| Guangdong | 1.000 | 1.000 | 1.000 | 1.000 | 1.000 | 1.000 | 1.000 | 1.000 | 1.000 | 1.000 |
| Guangxi | 0.295 | 0.288 | 0.318 | 0.344 | 0.354 | 0.355 | 0.354 | 0.364 | 0.353 | 0.336 |
| Hainan | 0.886 | 0.899 | 0.894 | 0.896 | 0.896 | 0.884 | 0.896 | 0.899 | 0.912 | 0.896 |
| Chongqing | 0.355 | 0.374 | 0.374 | 0.418 | 0.430 | 0.449 | 0.467 | 0.497 | 0.543 | 0.434 |
| Sichuan | 0.225 | 0.241 | 0.257 | 0.319 | 0.335 | 0.361 | 0.376 | 0.385 | 0.386 | 0.321 |
| Guizhou | 0.269 | 0.285 | 0.285 | 0.292 | 0.305 | 0.310 | 0.318 | 0.328 | 0.321 | 0.301 |
| Yunnan | 0.213 | 0.218 | 0.218 | 0.240 | 0.251 | 0.267 | 0.271 | 0.281 | 0.285 | 0.249 |
| Shaanxi | 0.283 | 0.306 | 0.334 | 0.387 | 0.411 | 0.429 | 0.444 | 0.447 | 0.437 | 0.386 |
| Gansu | 0.359 | 0.356 | 0.353 | 0.361 | 0.358 | 0.349 | 0.340 | 0.317 | 0.303 | 0.344 |
| Qinghai | 1.000 | 1.000 | 1.000 | 1.000 | 1.000 | 1.000 | 1.000 | 1.000 | 1.000 | 1.000 |
| Ningxia | 0.937 | 1.000 | 1.000 | 1.000 | 1.000 | 1.000 | 0.991 | 0.993 | 1.000 | 0.991 |
| Xinjiang | 0.470 | 0.464 | 0.499 | 0.493 | 0.487 | 0.476 | 0.463 | 0.424 | 0.392 | 0.463 |
| Mean | 0.521 | 0.539 | 0.557 | 0.594 | 0.600 | 0.608 | 0.607 | 0.613 | 0.595 | 0.582 |
| East | Score | Central | Score | West | Score |
|---|---|---|---|---|---|
| Guangdong | 1.000 | Henan | 0.371 | Sichuan | 0.321 |
| Hebei | 0.404 | Hunan | 0.388 | Guangxi | 0.371 |
| Shandong | 0.710 | Anhui | 0.323 | Yunnan | 0.249 |
| Jiangsu | 0.980 | Hubei | 0.433 | Guizhou | 0.301 |
| Liaoning | 0.573 | Jiangxi | 0.324 | Shaanxi | 0.386 |
| Zhejiang | 0.821 | Heilongjiang | 0.364 | Chongqing | 0.434 |
| Fujian | 0.585 | Shanxi | 0.343 | Gansu | 0.347 |
| Hainan | 0.866 | Jilin | 0.455 | Xinjiang | 0.482 |
| Shanghai | 1.000 | Inner Mongolia | 0.659 | ||
| Tianjin | 1.000 | Ningxia | 0.993 | ||
| Beijing | 1.000 | Qinghai | 1.000 | ||
| mean | 0.813 | 0.375 | 0.504 | ||
| Geometric mean | 0.780 | 0.372 | 0.452 |
| Variable | Coefficient | Std.Err | t | P > |t| |
|---|---|---|---|---|
| X1 | 0.008** | 0.004 | 2.18 | 0.030 |
| X2 | −0.008 | 0.006 | −1.46 | 0.146 |
| X3 | 0.113*** | 0.015 | 7.61 | 0.000 |
| X4 | 0.799*** | 0.227 | 3.51 | 0.001 |
| X5 | −0.383* | 0.231 | −1.66 | 0.099 |
| CONS | 0.438*** | 0.122 | 3.59 | 0.000 |
© 2018 by the authors. Licensee MDPI, Basel, Switzerland. This article is an open access article distributed under the terms and conditions of the Creative Commons Attribution (CC BY) license (http://creativecommons.org/licenses/by/4.0/).
Share and Cite
Wang, S.; Zhou, L.; Wang, H.; Li, X. Water Use Efficiency and Its Influencing Factors in China: Based on the Data Envelopment Analysis (DEA)—Tobit Model. Water 2018, 10, 832. https://doi.org/10.3390/w10070832
Wang S, Zhou L, Wang H, Li X. Water Use Efficiency and Its Influencing Factors in China: Based on the Data Envelopment Analysis (DEA)—Tobit Model. Water. 2018; 10(7):832. https://doi.org/10.3390/w10070832
Chicago/Turabian StyleWang, Shuqiao, Li Zhou, Hui Wang, and Xiaocong Li. 2018. "Water Use Efficiency and Its Influencing Factors in China: Based on the Data Envelopment Analysis (DEA)—Tobit Model" Water 10, no. 7: 832. https://doi.org/10.3390/w10070832
APA StyleWang, S., Zhou, L., Wang, H., & Li, X. (2018). Water Use Efficiency and Its Influencing Factors in China: Based on the Data Envelopment Analysis (DEA)—Tobit Model. Water, 10(7), 832. https://doi.org/10.3390/w10070832