Long-Term Monitoring of a Surface Flow Constructed Wetland Treating Agricultural Drainage Water in Northern Italy


Abstract
:1. Introduction
2. Materials and Methods
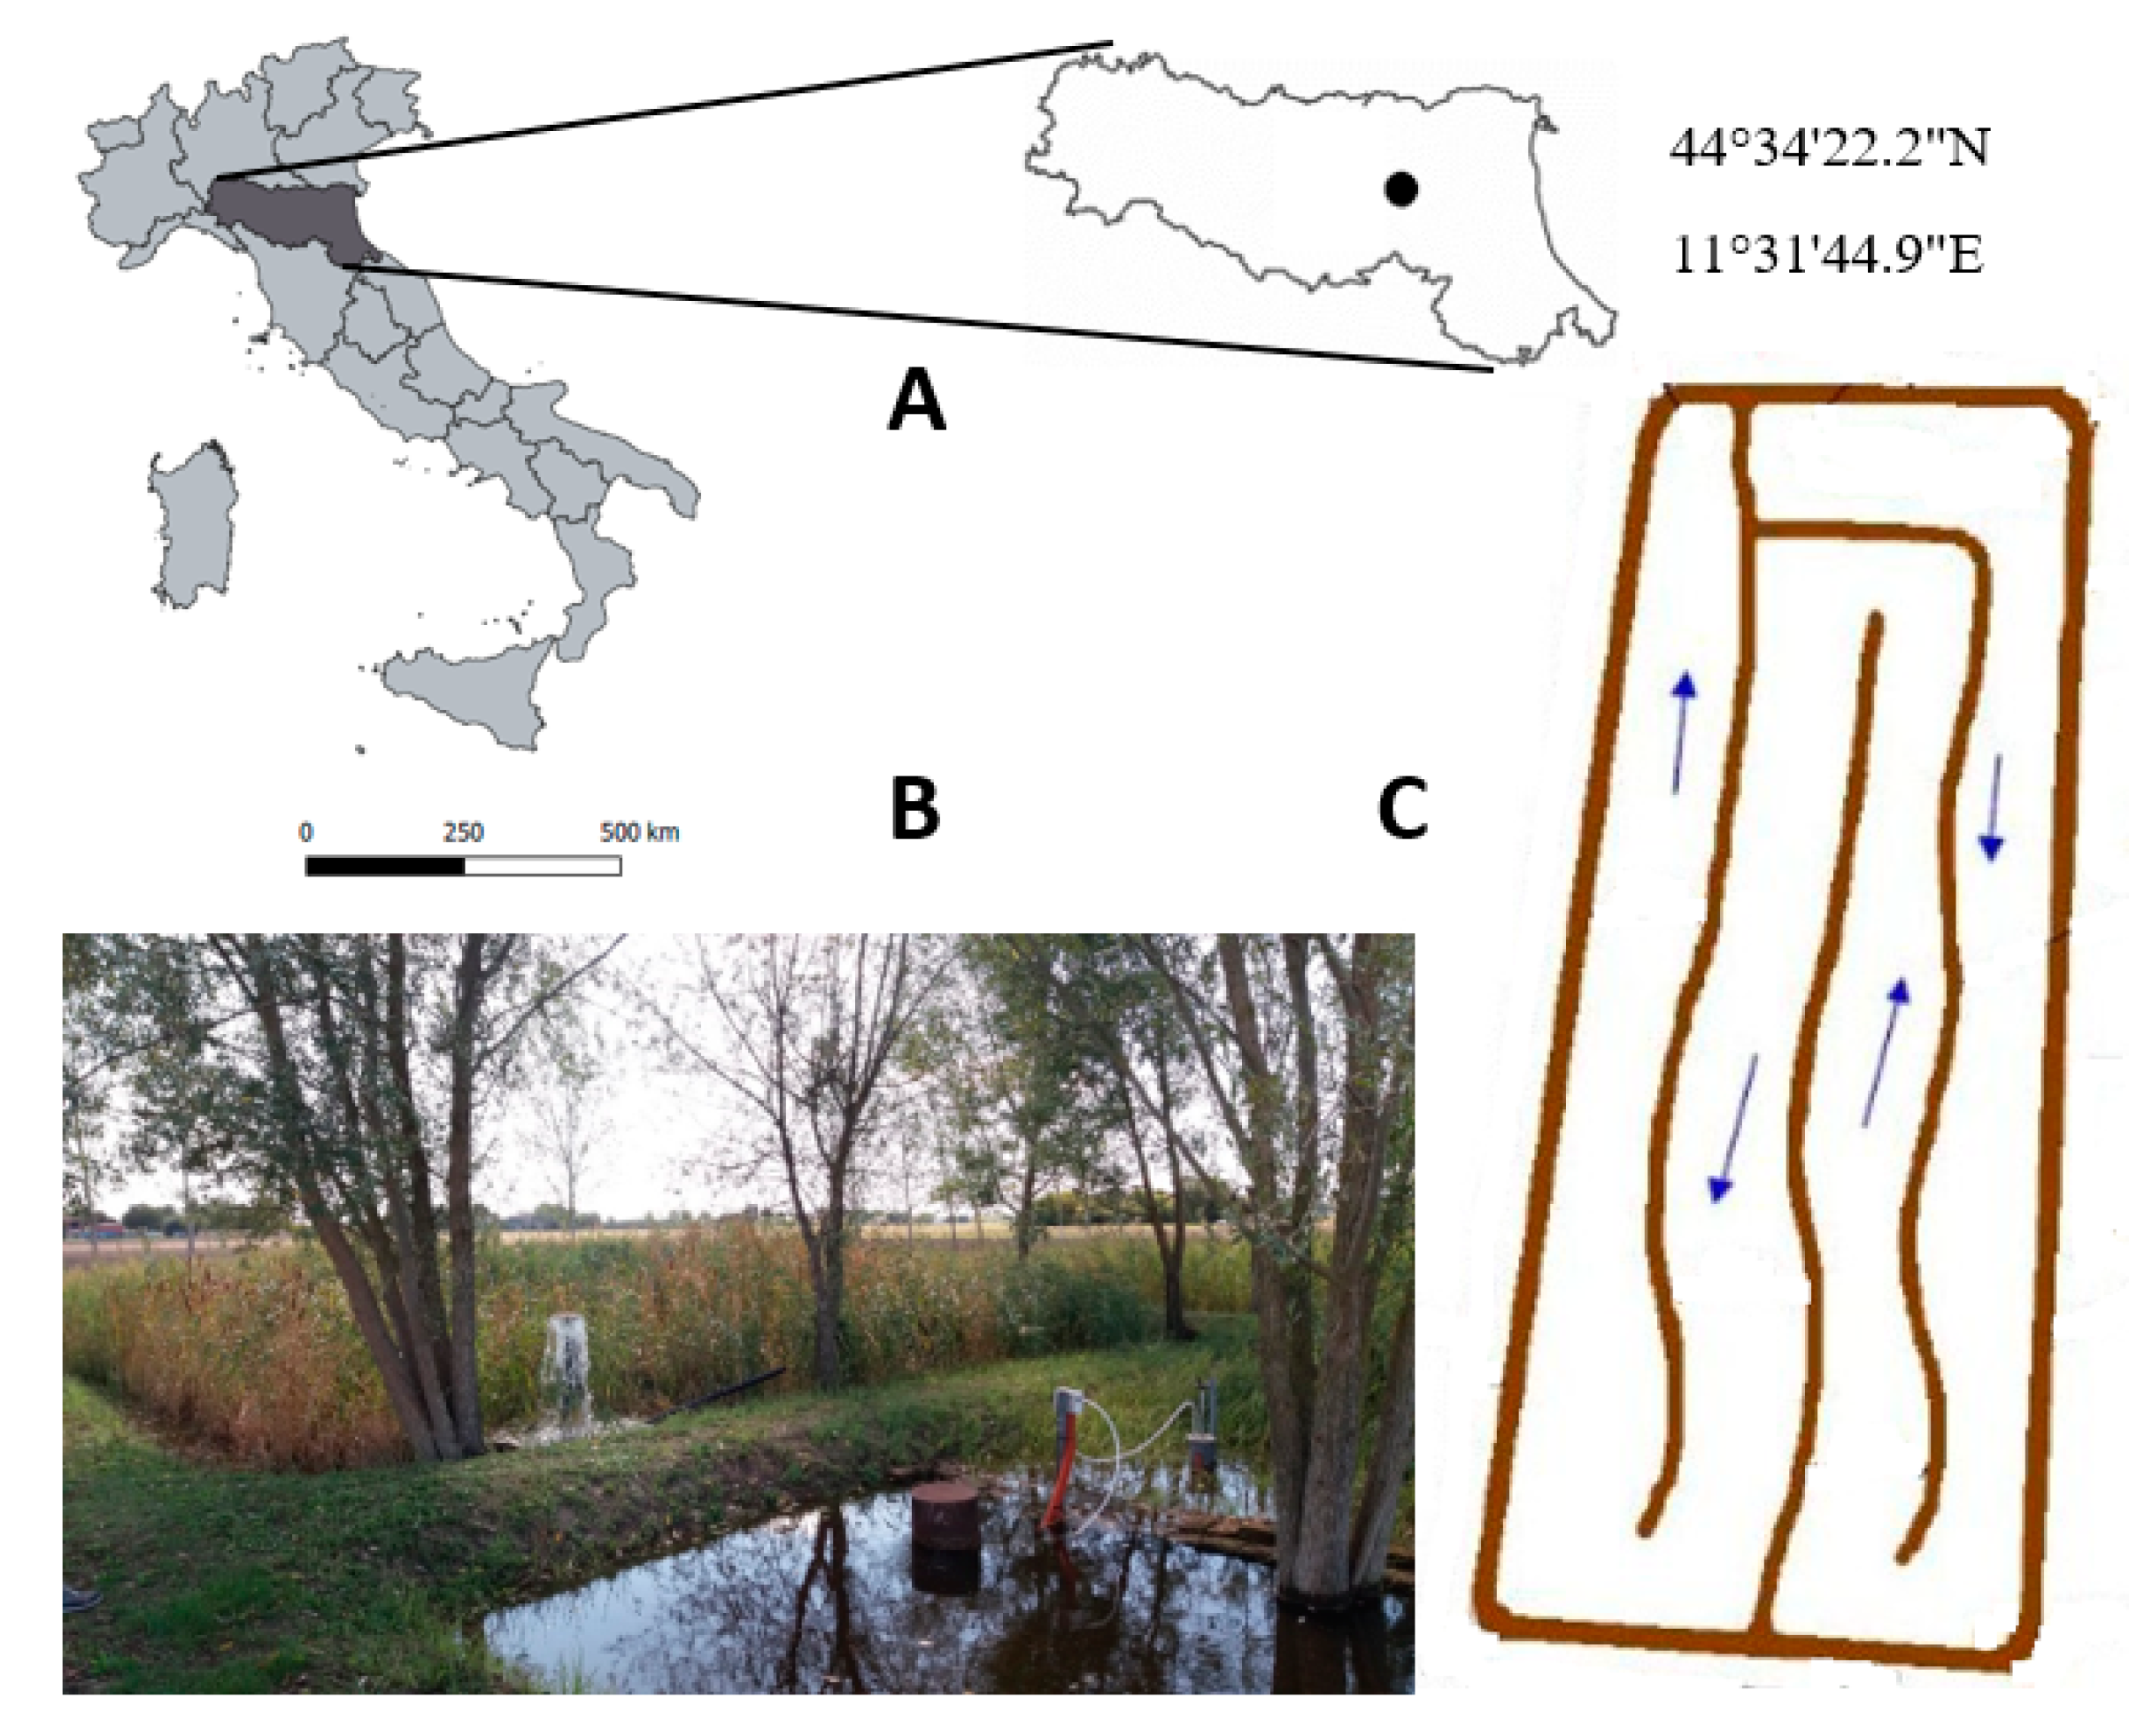
2.1. Experimental Design
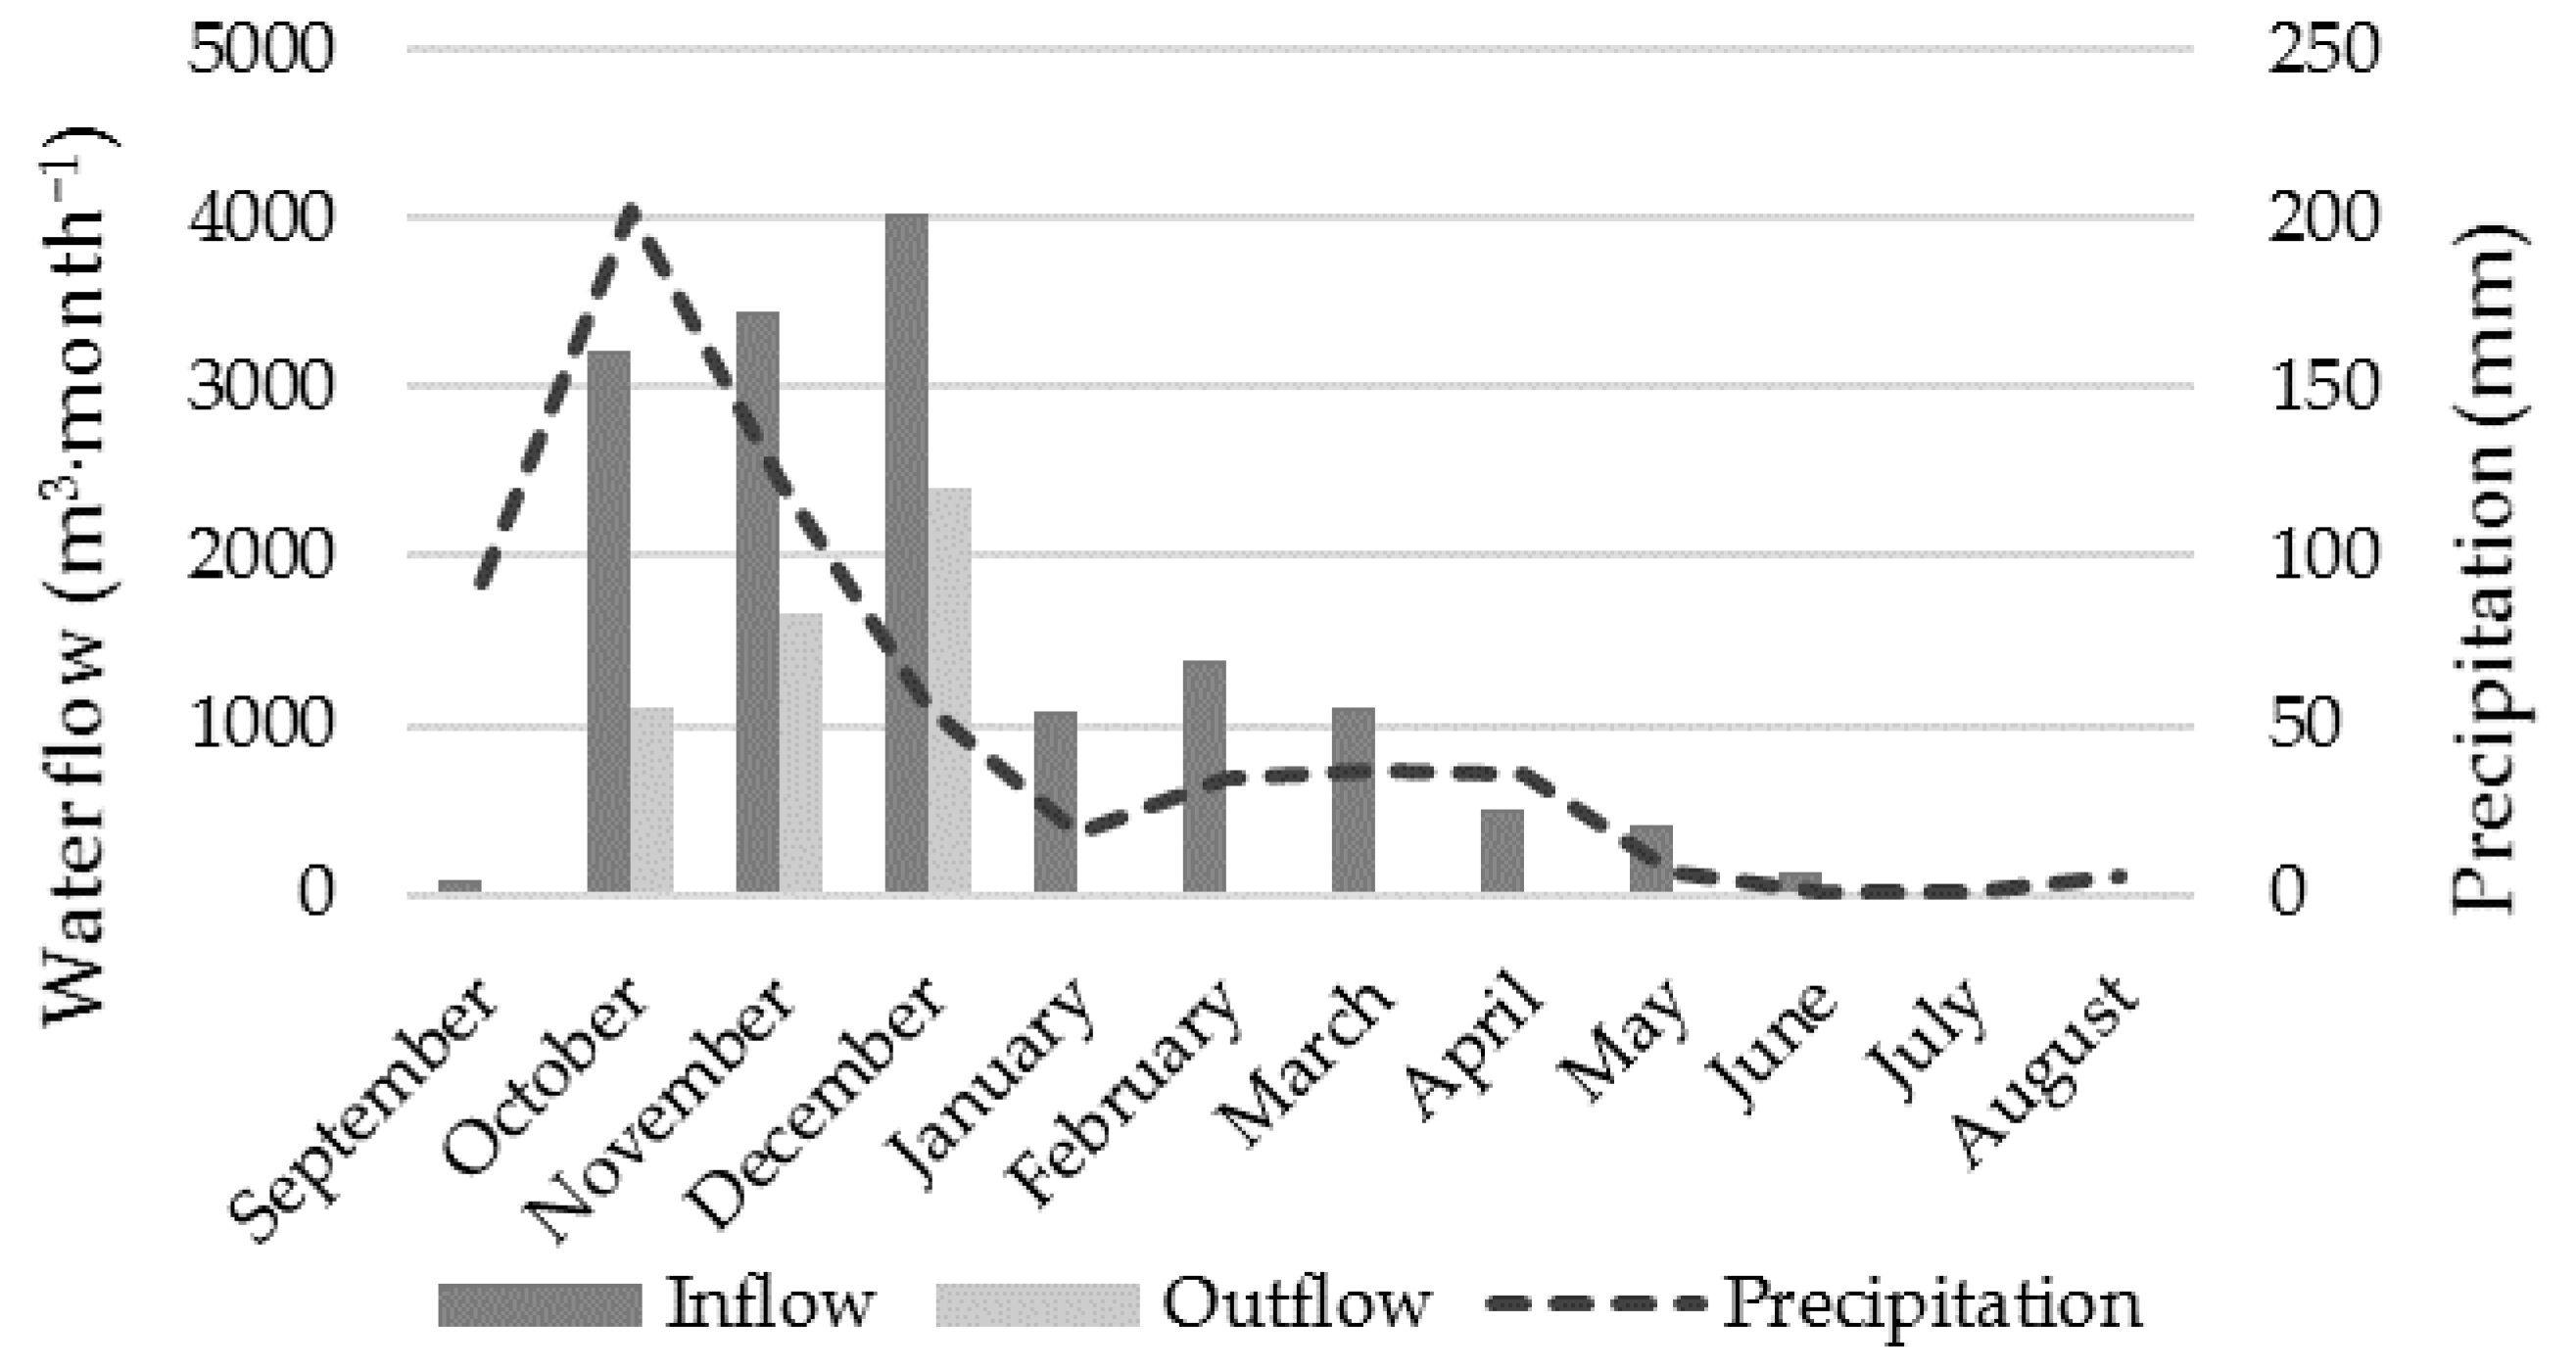
2.1.1. Water Balance and Quality
- Qin = inflow rate (m3·d−1);
- P = precipitation rate (m·d−1);
- A = wetland top surface area (m2);
- Qout = outflow rate (m3·d−1);
- I = infiltration flow rate (m3·d−1);
- ET = evapotranspiration rate (m·d−1);
- V = water storage inside the SFCW (m3);
- t = time (d).
2.1.2. Vegetation
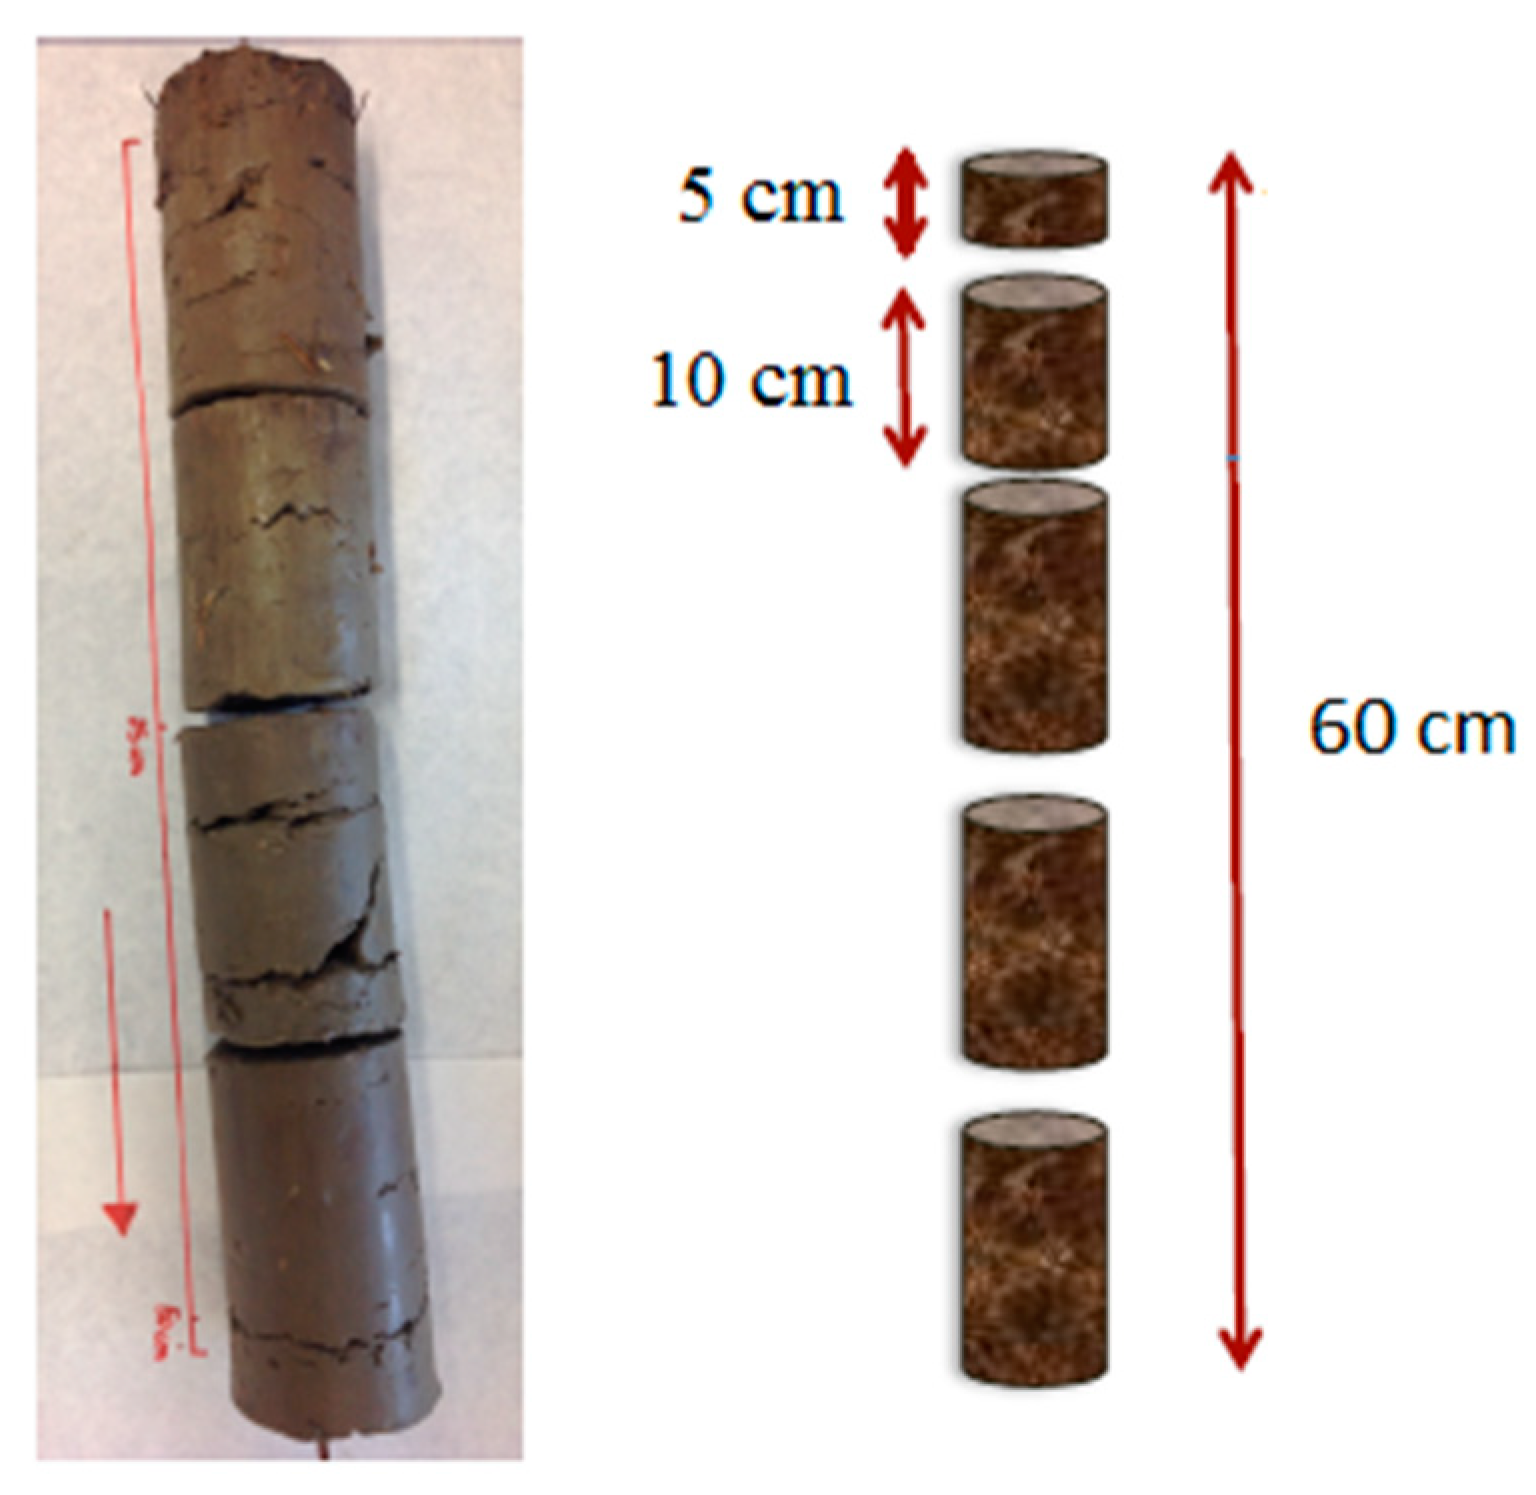
2.1.3. Soil
2.2. Data Analysis
3. Results and Discussion
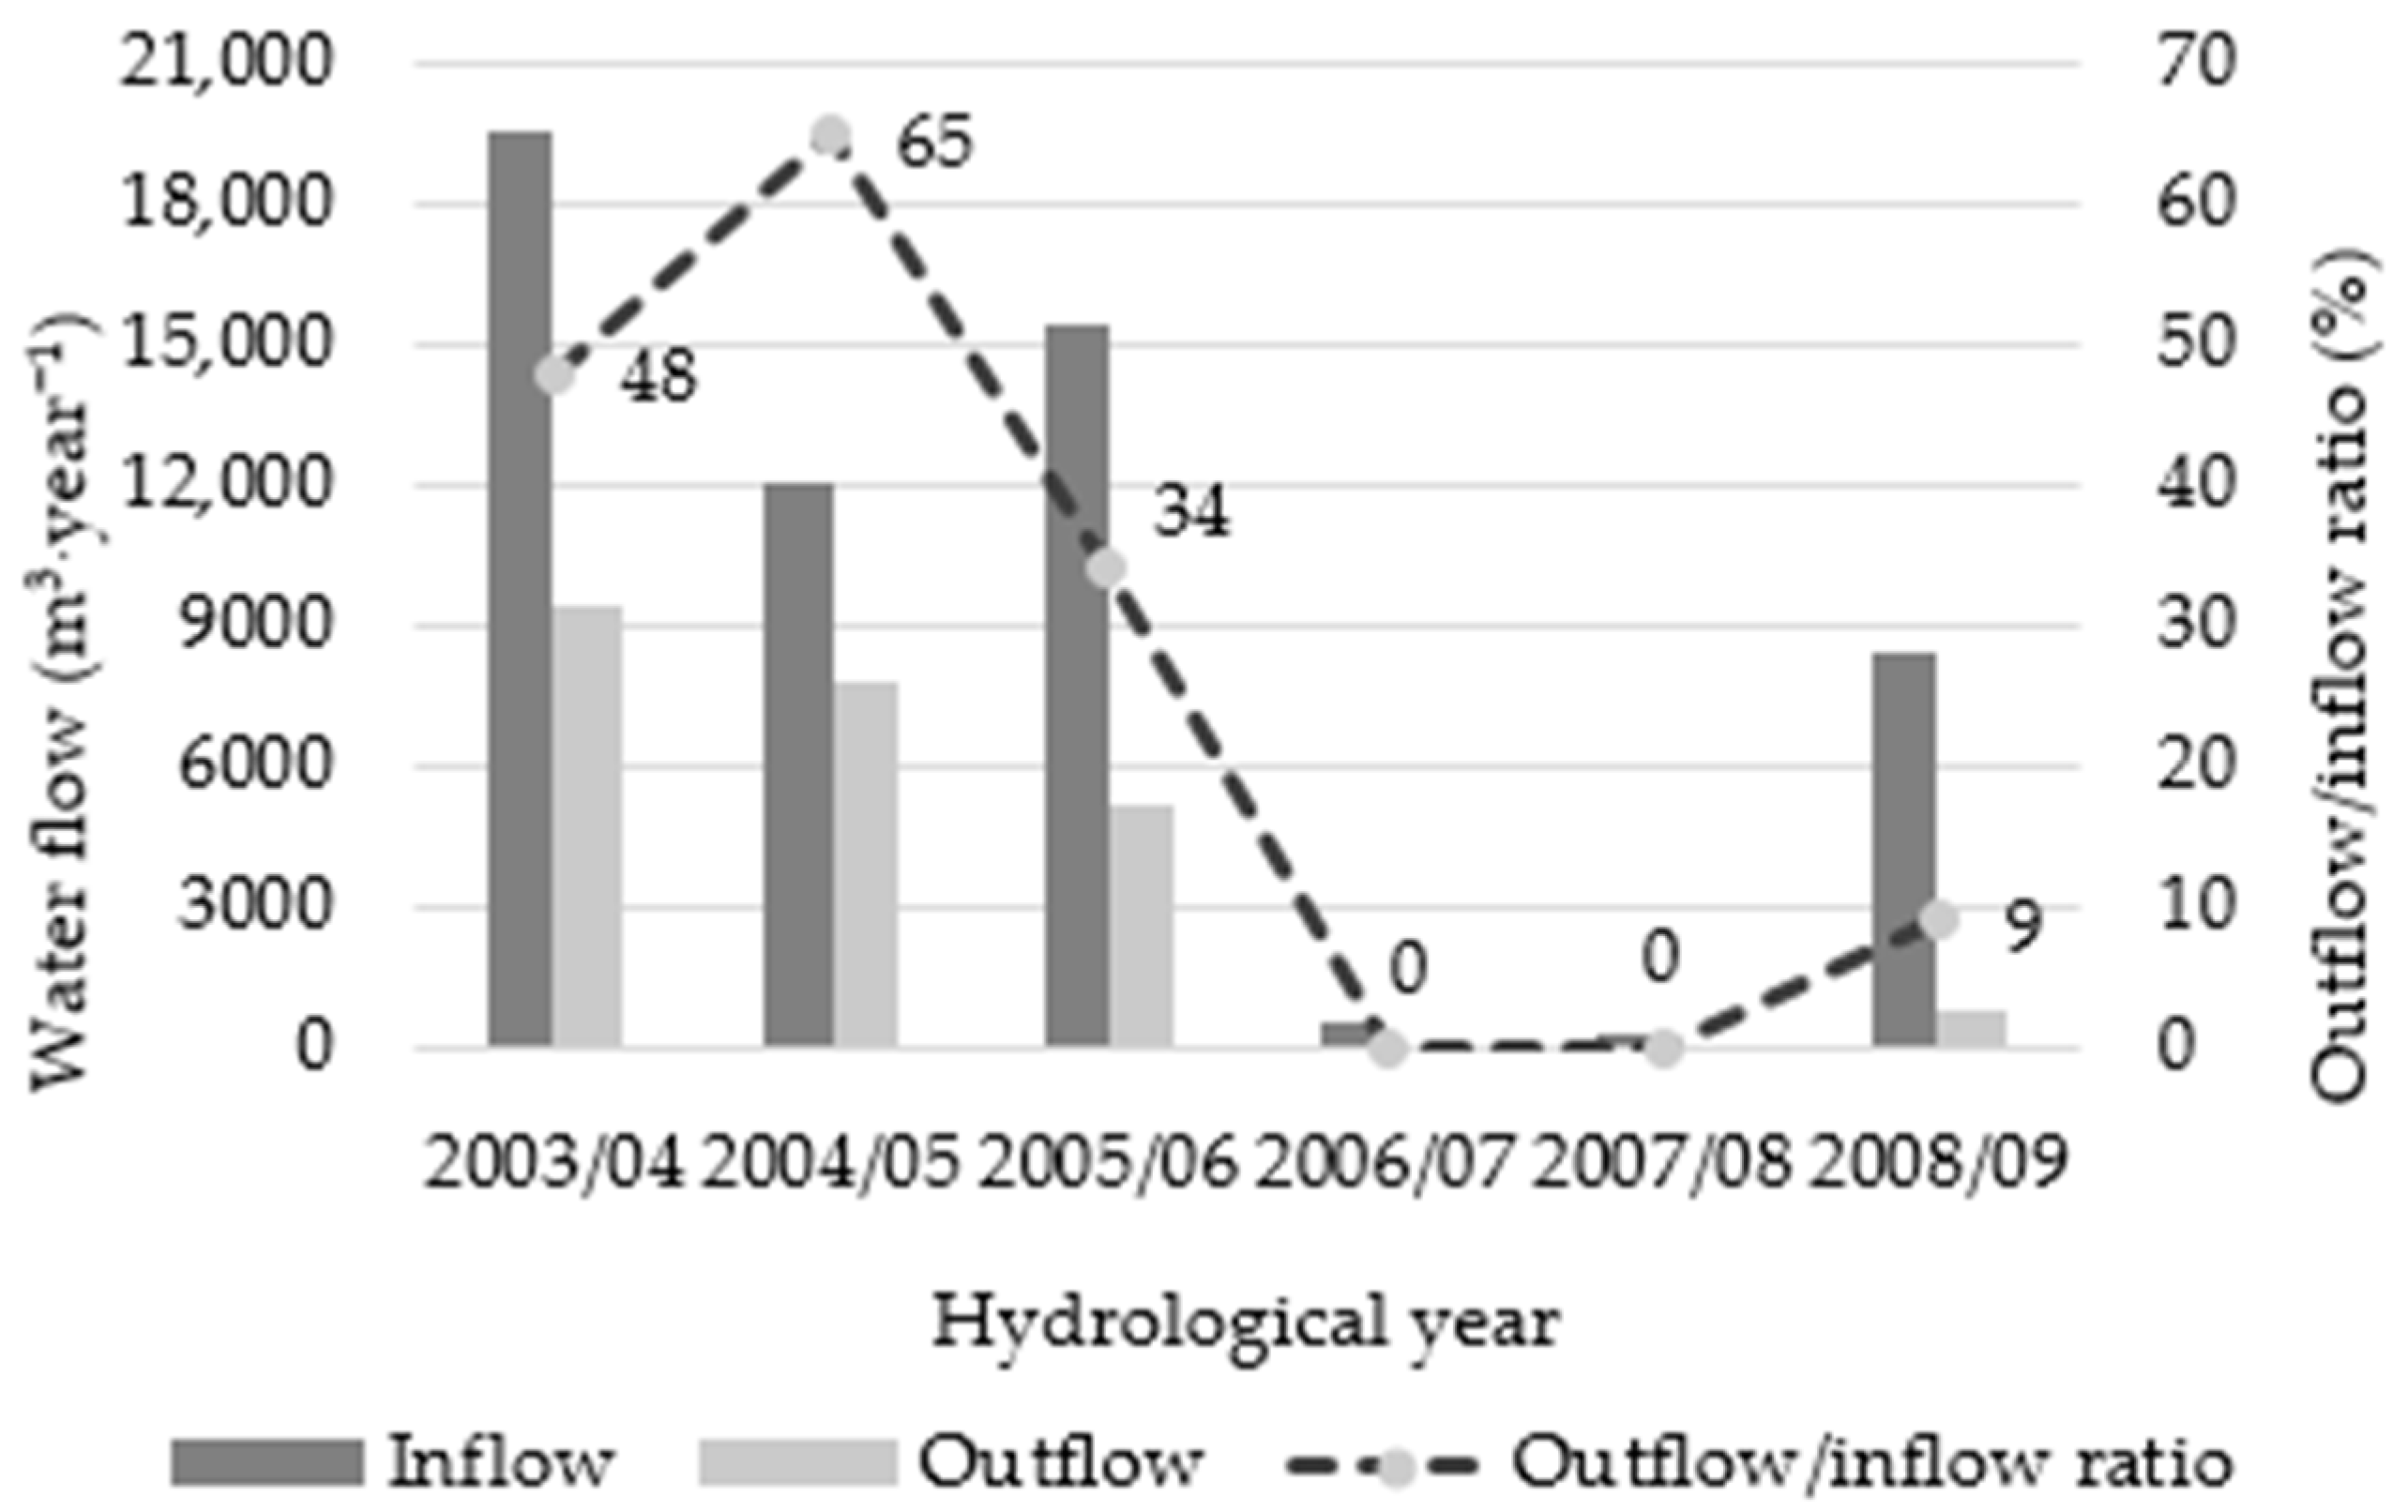
3.1. Simplified Water Balance
3.2. Water Quality
3.2.1. Analysis of Single Events
3.3. CW Soil and Vegetation
3.3.1. Plant Development
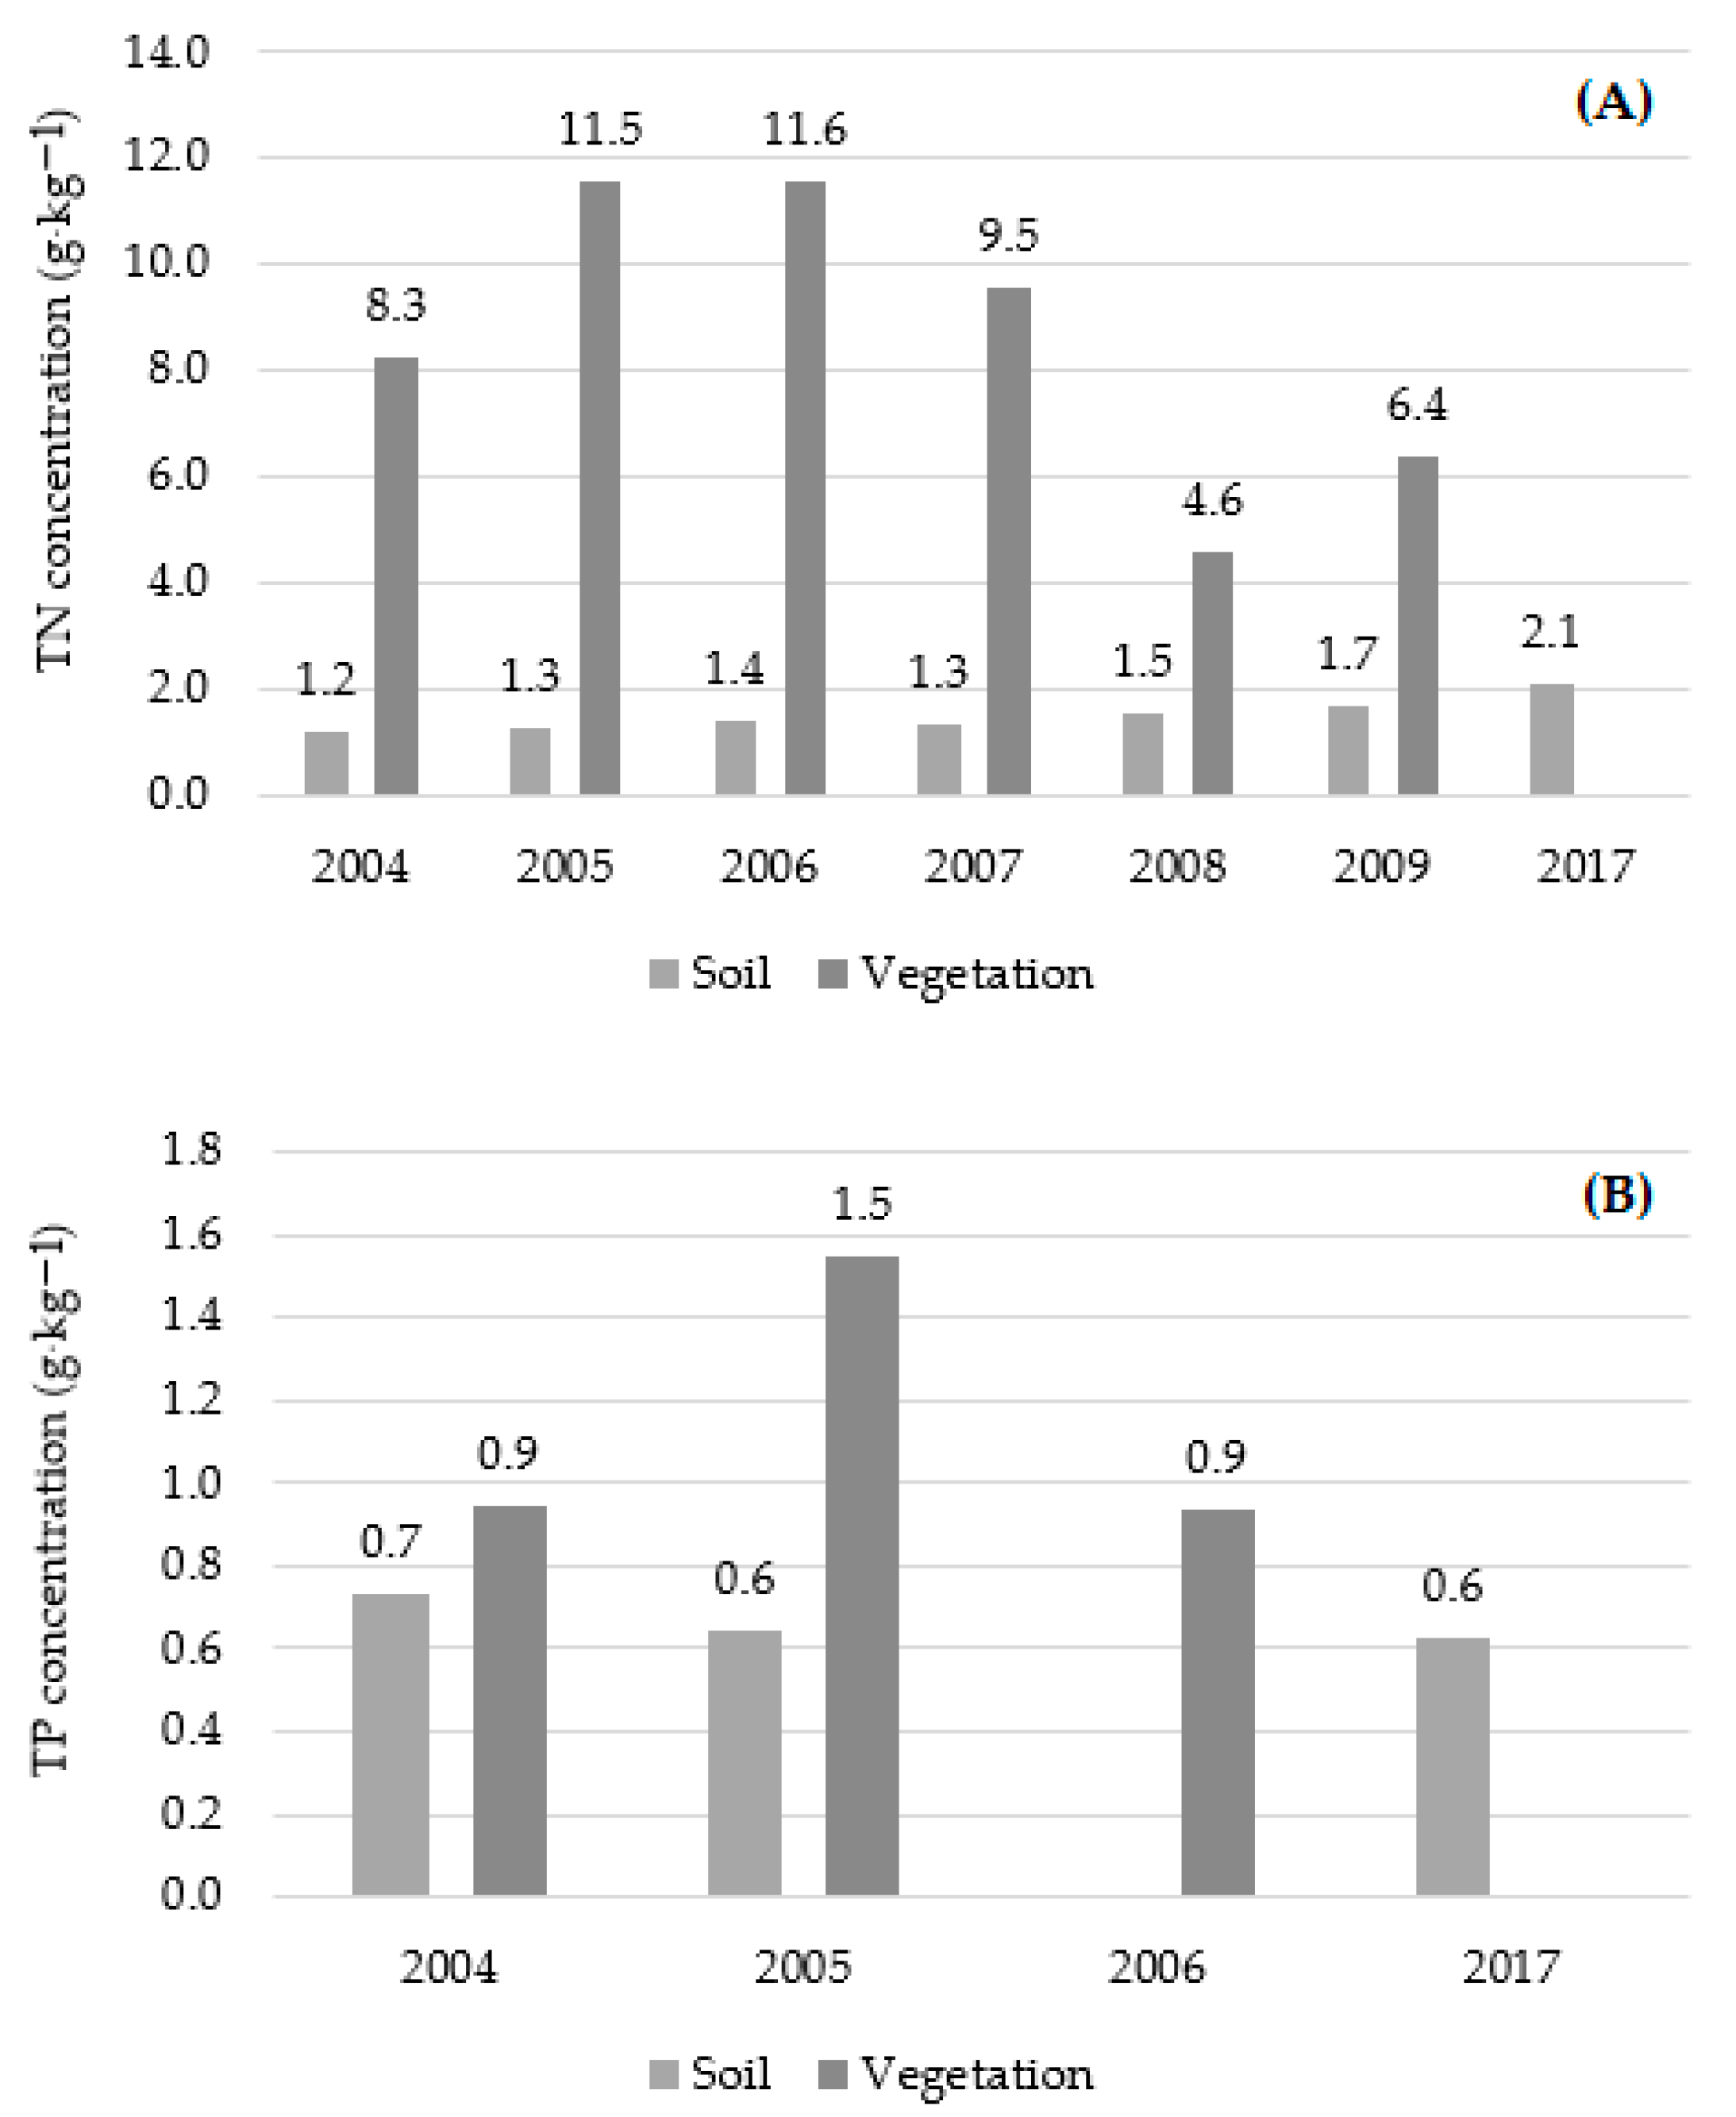
3.3.2. Nutrients’ Content of Biomass and Soil
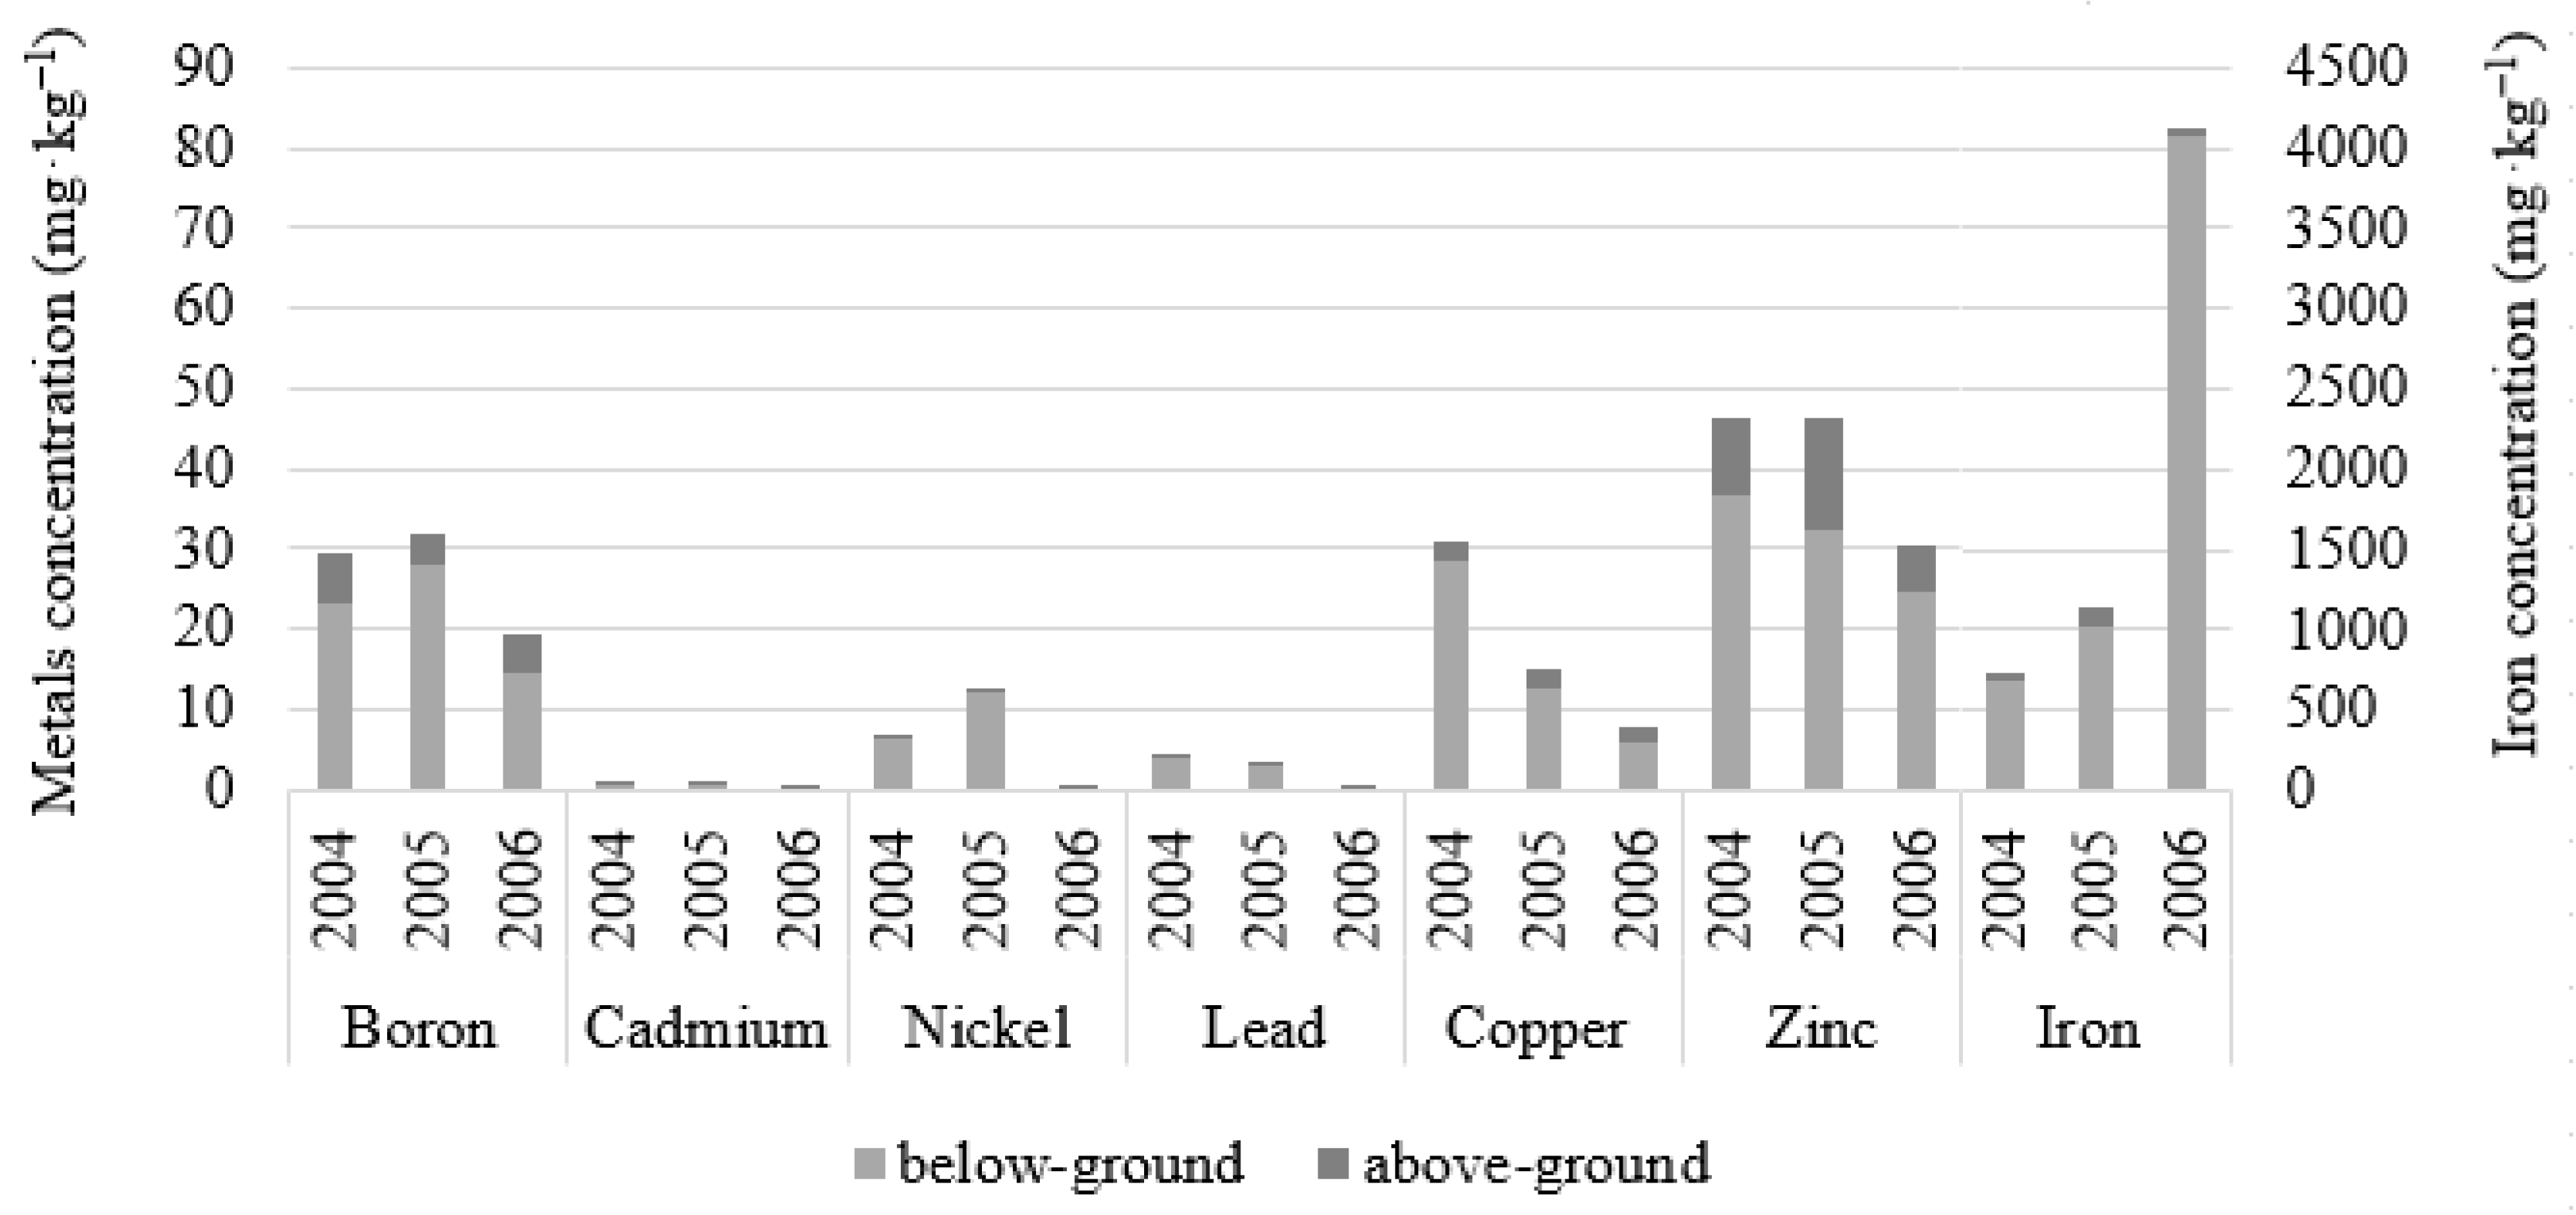
3.3.3. Boron and Heavy Metals in Biomass and Soil
4. Conclusions
Supplementary Materials
Author Contributions
Funding
Conflicts of Interest
References and Notes
- Kadlec, R.H.; Wallace, S.D. Treatment Wetlands, 2nd ed.; CRC Press: Boca Raton, FL, USA, 2009. [Google Scholar]
- Meng, P.; Pei, H.; Hu, W.; Shao, Y.; Li, Z. How to increase microbial degradation in constructed wetlands: Influencing factors and improvement measures. Bioresour. Technol. 2014, 157, 316–326. [Google Scholar] [CrossRef] [PubMed]
- Carvalho, P.N.; Arias, C.A.; Brix, H. Constructed Wetlands for Water Treatment: New Developments. Water 2017, 9, 397. [Google Scholar] [CrossRef]
- Leon, A.S.; Tang, Y.; Chen, D.; Yolcu, A.; Glennie, C.; Pennings, S.C. Dynamic Management of Water Storage for Flood Control in a Wetland System: A Case Study in Texas. Water 2018, 10, 325. [Google Scholar] [CrossRef]
- Keesstra, S.; Nunes, J.; Novara, A.; Finger, D.; Avelar, D.; Kalantari, Z.; Cerdà, A. The superior effect of nature based solutions in land management for enhancing ecosystem services. Sci. Total Environ. 2018, 610–611, 997–1009. [Google Scholar] [CrossRef] [PubMed]
- Tournebize, J.; Chaumont, C.; Mander, Ü. Implications for constructed wetlands to mitigate nitrate and pesticide pollution in agricultural drained watersheds. Ecol. Eng. 2017, 103, 415–425. [Google Scholar] [CrossRef]
- Barbagallo, S.; Cirelli, G.L.; Marzo, A.; Milani, M.; Toscano, A. Hydraulic behaviour and removal efficiencies of two H-SSF constructed wetlands for wastewater reuse with different operational life. Water Sci. Technol. 2011, 64, 1032–1039. [Google Scholar] [CrossRef] [PubMed]
- Aiello, R.; Cirelli, G.L.; Consoli, S.; Licciardello, F.; Toscano, A. Risk assessment of treated municipal wastewater reuse in Sicily. Water Sci. Technol. 2013, 67, 89–98. [Google Scholar] [CrossRef] [PubMed]
- Barbera, A.C.; Borin, M.; Cirelli, G.L.; Toscano, A.; Maucieri, C. Comparison of carbon balance in Mediterranean pilot constructed wetlands vegetated with different C4 plant species. Environ. Sci. Pollut. Res. Int. 2015, 22, 2372–2383. [Google Scholar] [CrossRef] [PubMed]
- Molari, G.; Milani, M.; Toscano, A.; Borin, M.; Taglioli, G.; Villani, G.; Zema, D.A. Energy characterisation of herbaceous biomasses irrigated with marginal waters. Biomass Bioenergy 2014, 70, 392–399. [Google Scholar] [CrossRef]
- Valenti, F.; Porto, S.M.C.; Chinnici, G.; Cascone, G.; Arcidiacono, C. Assessment of citrus pulp availability for biogas production by using a GIS-based model: The case study of an area in southern Italy. Chem. Eng. Trans. 2017, 58, 529–534. [Google Scholar]
- Kynkaanniemi, P.; Ulen, B.; Torstensson, G.A.; Tonderski, K.S. Phosphorus retention in a newly constructed wetland receiving agricultural tile drainage water. J. Environ. Qual. 2013, 42, 596–605. [Google Scholar] [CrossRef] [PubMed]
- Dipu, S.; Salom Gnana Thanga, V. Heavy metal uptake, its effects on plant biochemistry of wetland (constructed) macrophytes and potential application of the used biomass. Int. J. Environ. Eng. 2014, 6, 43–54. [Google Scholar] [CrossRef]
- Gachango, F.G.; Pedersen, S.M.; Kjaergaard, C. Cost-effectiveness analysis of surface flow constructed wetlands (SFCW) for nutrient reduction in drainage discharge from agricultural fields in Denmark. Environ. Manag. 2015, 56, 1478–1486. [Google Scholar] [CrossRef] [PubMed]
- Reinhardt, M.; Gächter, R.; Wehrli, B.; Müller, B. Phosphorus retention in small constructed wetlands treating agricultural drainage waters. J. Environ. Qual. 2005, 34, 1251–1259. [Google Scholar] [CrossRef] [PubMed]
- Johannesson, K.M.; Tonderski, K.S.; Ehde, P.M.; Weisner, S.E.B. Temporal phosphorus dynamics affecting retention estimates in agricultural constructed wetlands. Ecol. Eng. 2017, 103, 436–445. [Google Scholar] [CrossRef]
- EC (European Commission). Council Directive Concerning the Protection of Waters against Pollution Caused by Nitrates from Agricultural Sources (91/676/EEC); European Commission: Brussels, Belgium, 1991. [Google Scholar]
- Tournebize, J.; Chaumont, C.; Fesneau, C.; Guenne, A.; Vincent, B.; Garnier, J.; Mander, Ü. Long-term nitrate removal in a buffering pond-reservoir system receiving water from an agricultural drained catchment. Ecol. Eng. 2015, 80, 32–45. [Google Scholar] [CrossRef]
- Groh, T.A.; Gentry, L.E.; David, M.B. Nitrogen removal and greenhouse gas emissions from constructed wetlands receiving tile drainage water. J. Environ. Qual. 2015, 44, 1001–1010. [Google Scholar] [CrossRef] [PubMed]
- Climatic Tables. Available online: https://www.arpae.it/sim/?osservazioni_e_dati/climatologia (accessed on 23 April 2018). (In Italian).
- Borin, M.; Milani, M.; Salvato, M.; Toscano, A. Evaluation of Phragmites australis (Cav.) Trin. evapotranspiration in Northern and Southern Italy. Ecol. Eng. 2011, 37, 721–728. [Google Scholar] [CrossRef]
- Maddison, M.; Soosaar, K.; Mauring, T.; Mander, Ü. The biomass and nutrient and heavy metal content of cattails and reeds in wastewater treatment wetlands for the production of construction material in Estonia. Desalination 2009, 247, 121–129. [Google Scholar] [CrossRef]
- Zheng, Y.; Wang, X.C.; Ge, Y.; Dzakpasu, M.; Zhao, Y.; Xiong, J. Effects of annual harvesting on plants growth and nutrients removal in surface-flow constructed wetlands in Northwestern China. Ecol. Eng. 2015, 83, 268–275. [Google Scholar] [CrossRef]
- Borin, M.; Tocchetto, D. Five years water and nitrogen balance for a constructed surface flow wetland treating agricultural drainage waters. Sci. Total Environ. 2007, 380, 38–47. [Google Scholar] [CrossRef] [PubMed]
- Ware, G.W.; Whitacre, D.M. The Pesticide Book, 6th ed.; Meister Media Worldwide: Willoughby, OH, USA, 2004. [Google Scholar]
- Knez, M.; Graham, R.D. The impact of micronutrient deficiencies in agricultural soils and crops on the nutritional health of humans. In Essentials of Medical Geology, Revised Edition; Selinus, O., Ed.; Springer: Dordrecht, Germany, 2013; pp. 517–533. [Google Scholar]
- Roca, N.; Pazos, M.S.; Bech, J. Background levels of potentially toxic elements in soils: A case study in Catamarca (a semiarid region in Argentina). Catena 2012, 92, 55–66. [Google Scholar] [CrossRef]
- Vymazal, J.; Březinová, T. Accumulation of heavy metals in aboveground biomass of Phragmites australis in horizontal flow constructed wetlands for wastewater treatment: A review. Chem. Eng. J. 2016, 290, 232–242. [Google Scholar] [CrossRef]
- Gill, L.W.; Ring, P.; Higgins, N.M.P.; Johnston, P.M. Accumulation of heavy metals in a constructed wetland treating road runoff. Ecol. Eng. 2014, 70, 133–139. [Google Scholar] [CrossRef]
- Angelova, V.R.; Ivanova, R.V.; Todorov, J.M.; Ivanov, K.I. Lead, cadmium, zinc, and copper bioavailability in the soil-plant-animal system in a polluted area. Sci. World J. 2010, 10, 273–285. [Google Scholar] [CrossRef] [PubMed]
- Weiss, J.V.; Emerson, D.; Megonigal, J.P. Geochemical control of microbial Fe (III) reduction potential in wetlands: Comparison of the rhizosphere to non-rhizosphere soil. FEMS Microbiol. Ecol. 2004, 48, 89–100. [Google Scholar] [CrossRef] [PubMed]
- Harguinteguy, C.A.; Fernández Cirelli, A.; Pignata, M.L. Heavy metal accumulation in leaves of aquatic plant Stuckenia filiformis and its relationship with sediment and water in the Suquía River (Argentina). Microchem. J. 2014, 114, 111–118. [Google Scholar] [CrossRef]
- D.Lgs. 152 (Decreto legislativo). Norme in materia ambientale. 2006. (In Italian)
- Carta del Fondo Naturale-Antropico dei Metalli Pesante. Available online: http://ambiente.regione.emilia-romagna.it/geologia/temi/metalli-pesanti/carta-del-fondo-naturale-antropico-della-pianura-emiliano-romagnola-alla-scala1-250-000-2012 (accessed on 23 April 2018). (In Italian).


| Hydrological Year | Parameter | Total Nitrogen | Nitrate | Ammonium | Total Phosphorus |
|---|---|---|---|---|---|
| 2003–2004 | Inflow | 21.9 ± 2.7 (34) | - | - | - |
| Outflow | 14.5 ± 2.4 (17) | - | - | - | |
| T test-p value | 0.078 | - | - | - | |
| 2004–2005 | Inflow | 16.5 ± 1.4 (27) | 14.2 ± 1.4 (27) | 0.1 ± 0.0 (27) | 0.1 ± 0.0 (27) |
| Outflow | 13.4 ± 1.3 (33) | 11.7 ± 1.5 (33) | 0.3 ± 0.1 (33) | 0.4 ± 0.1 (33) | |
| T test-p value | 0.124 | 0.229 | 0.272 | 0.083 | |
| 2005–2006 | Inflow | 13.7 ± 1.2 (17) | 11.4 ± 1.1 (17) | 0.1 ± 0.0 (17) | 0.1 ± 0.0 (17) |
| Outflow | 8.2 ± 1.2 (11) | 4.5 ± 0.8 (11) | 0.1 ± 0.0 (11) | 0.0 ± 0.0 (11) | |
| T test-p value | 0.004 | <0.001 | 0.226 | 0.353 | |
| 2006–2007 | Inflow | 2.4 ± 0.6 (2) | 0.8 ± 0.1 (2) | 0.1 ± 0.0 (2) | 0.2 ± 0.2 (2) |
| Outflow | * | * | * | * | |
| T test-p value | - | - | - | - | |
| 2007–2008 | Inflow | 8.7 (1) | - | - | 0.2 (1) |
| Outflow | * | * | * | * | |
| T test-p value | - | - | - | - | |
| 2008–2009 | Inflow | 17.6 ± 2.1 (11) | - | - | - |
| Outflow | 11.2 ± 2.7 (10) | - | - | - | |
| T test-p value | 0.071 | - | - | - |
| Balance | Parameter | 2003–2004 | 2004–2005 | 2005–2006 | 2006–2007 | 2007–2008 | 2008–2009 |
|---|---|---|---|---|---|---|---|
| TN | Input (kg·year−1) | 313 | 216 | 219 | 6 | 12 | 180 |
| Output (kg·year−1) | 125 | 115 | 39 | 0 | 0 | 11 | |
| Retention rate (%) | 60 | 47 | 82 | 100 | 100 | 94 | |
| NO3− | Input (kg·year−1) | - | 182 | 180 | 0.5 | - | - |
| Output (kg·year−1) | - | 99 | 21 | * | * | - | |
| Retention rate (%) | - | 45 | 88 | 100 | - | - | |
| NH4+ | Input (kg·year−1) | - | 1.1 | 1.3 | 0.1 | - | - |
| Output (kg·year−1) | - | 1.1 | 0.4 | * | * | - | |
| Retention rate (%) | - | 0 | 71 | 100 | - | - | |
| TP | Input (kg·year−1) | - | 1.2 | 1.4 | 0.1 | 0.1 | - |
| Output (kg·year−1) | - | 2.1 | 0.7 | 0.0 | 0.0 | - | |
| Retention rate (%) | - | - | 49 | 100 | 100 | - |
| Parameter | 10th November–5th December 2004 | 6th–30th November 2005 | ||||
|---|---|---|---|---|---|---|
| Inflow | Outflow | Retention | Inflow | Outflow | Retention | |
| Water volume (m3) | 1138 | 1086 | - | 2857 | 1223 | - |
| TN (kg) | 15.17 | 4.69 | 59% | 41.63 | 10.20 | 75% |
| NO3− (kg) | 11.52 | 1.64 | 85% | 36.57 | 6.55 | 82% |
| NH4+ (kg) | 0.06 | 0.57 | - | 0.13 | 0.07 | 45% |
| TP (kg) | 0.03 | 0.57 | - | 0.12 | 0.07 | 43% |
| Plant Survey Parameter | 2004 | 2005 | 2006 | 2007 | 2008 | 2009 |
|---|---|---|---|---|---|---|
| Main species | P, T | P, T | P, T | P, T, W, L | P, T, W, L | P, T, W, L |
| Dry weight (kg·m−2) | 5.32 | 5.40 | 4.68 | 3.02 | 7.03 | 5.63 |
| above-ground | 3.01 | 2.74 | 1.57 | 0.21 | 0.70 | 0.88 |
| below-ground | 2.31 | 2.66 | 3.11 | 2.81 | 6.33 | 4.75 |
| above/below ground ratio | 1.30 | 1.03 | 0.50 | 0.07 | 0.11 | 0.19 |
| Average height (cm) | 247 | 253 | 190 | 131 | 239 | 301 |
| Shoots (number m−2) | 223 | 171 | 210 | 73 | 105 | 57 |
| Parameter | Biomass | Soil | ||||
|---|---|---|---|---|---|---|
| 2005 | 2006 | Average | 2005 | 2006 | Average | |
| Cadmium | 0.4 | 0.0 | 0.2 | 0.0 | 0.0 | 0.0 |
| Copper | 12.7 | 6.1 | 9.4 | 35.5 | 32.0 | 33.8 |
| Iron | 1014.7 | 4086.2 | 2550.5 | 29.5 | 40.9 | 35.2 |
| Lead | 3.0 | 0.3 | 1.7 | 37.0 | 13.5 | 25.3 |
| Nickel | 12.2 | 0.2 | 6.2 | 54.5 | 54.0 | 54.3 |
| Zinc | 32.5 | 24.9 | 28.7 | 109.5 | 85.0 | 97.3 |
| Parameter | 0–5 cm | 5–15 cm | 15–30 cm | 30–45 cm | 45–60 cm | Limit A | Limit B |
|---|---|---|---|---|---|---|---|
| Total organic carbon (g·kg−1) * | 41.5 ± 6.1 (4) a | 16.3 ± 1.7 (4) b | 10.2 ± 0.5 (4) b,c | 8.4 ± 1.1 (4) c | 7.2 ± 1.3 (4) c | - | - |
| Total nitrogen (g·kg−1) * | 3.5 ± 0.4 (4) a | 1.6 ± 0.1 (4) b | 1.2 ± 0.0 (4) b,c | 1.0 ± 0.1 (4) b,c | 0.9 ± 0.2 (4) c | - | - |
| Total phosphorus (g·kg−1) | 0.7 ± 0.0 (4) | 0.6 ± 0.0 (4) | 0.6 ± 0.1 (4) | 0.5 ± 0.0 (4) | 0.5 ± 0.1 (4) | - | - |
| Boron (mg·kg−1) | 44.5 ± 0.6 (4) | 45.3 ± 0.3 (4) | 44.0 ± 0.4 (4) | 42.3 ± 1.7 (4) | 40.5 ± 2.1 (4) | - | - |
| Cadmium (mg·kg−1) | 0.2 ± 0.0 (4) | 0.2 ± 0.0 (4) | 0.1 ± 0.0 (4) | 0.2 ± 0.0 (4) | 0.1 ± 0.0 (4) | 2 | 15 |
| Chrome (mg·kg−1) | 67.9 ± 0.8 (4) | 72.0 ± 0.6 (4) | 71.6 ± 1.0 (4) | 68.4 ± 1.5 (4) | 66.4 ± 2.1 (4) | 150 | 500 |
| Copper (mg·kg−1) | 36.9 ± 1.6 (4) | 36.6 ± 1.4 (4) | 38.9 ± 4.5 (4) | 35.0 ± 3.5 (4) | 32.2 ± 4.0 (4) | 120 | 600 |
| Iron (g·kg−1) | 24.9 ± 0.5 (4) | 26.5 ± 0.3 (4) | 26.5 ± 0.1 (4) | 25.9 ± 0.4 (4) | 25.0 ± 0.7 (4) | - | - |
| Lead (mg·kg−1) | 24.8 ± 2.6 (4) | 23.8 ± 1.2 (4) | 24.9 ± 2.0 (4) | 22.9 ± 1.4 (4) | 20.0 ± 1.1 (4) | 100 | 1000 |
| Nickel (mg·kg−1) | 48.5 ± 0.7 (4) | 51.2 ± 0.6 (4) | 51.2 ± 0.2 (4) | 49.5 ± 1.1 (4) | 48.3 ± 1.3 (4) | 120 | 500 |
| Zinc (mg·kg−1) | 78.3 ± 1.4 (4) | 77.1 ± 1.6 (4) | 77.0 ± 2.6 (4) | 73.7 ± 2.7 (4) | 70.0 ± 2.8 (4) | 150 | 1500 |
© 2018 by the authors. Licensee MDPI, Basel, Switzerland. This article is an open access article distributed under the terms and conditions of the Creative Commons Attribution (CC BY) license (http://creativecommons.org/licenses/by/4.0/).
Share and Cite
Lavrnić, S.; Braschi, I.; Anconelli, S.; Blasioli, S.; Solimando, D.; Mannini, P.; Toscano, A. Long-Term Monitoring of a Surface Flow Constructed Wetland Treating Agricultural Drainage Water in Northern Italy. Water 2018, 10, 644. https://doi.org/10.3390/w10050644
Lavrnić S, Braschi I, Anconelli S, Blasioli S, Solimando D, Mannini P, Toscano A. Long-Term Monitoring of a Surface Flow Constructed Wetland Treating Agricultural Drainage Water in Northern Italy. Water. 2018; 10(5):644. https://doi.org/10.3390/w10050644
Chicago/Turabian StyleLavrnić, Stevo, Ilaria Braschi, Stefano Anconelli, Sonia Blasioli, Domenico Solimando, Paolo Mannini, and Attilio Toscano. 2018. "Long-Term Monitoring of a Surface Flow Constructed Wetland Treating Agricultural Drainage Water in Northern Italy" Water 10, no. 5: 644. https://doi.org/10.3390/w10050644
APA StyleLavrnić, S., Braschi, I., Anconelli, S., Blasioli, S., Solimando, D., Mannini, P., & Toscano, A. (2018). Long-Term Monitoring of a Surface Flow Constructed Wetland Treating Agricultural Drainage Water in Northern Italy. Water, 10(5), 644. https://doi.org/10.3390/w10050644