Topography-Related Glacier Area Changes in Central Tianshan from 1989 to 2015 Derived from Landsat Images and ASTER GDEM Data
Abstract
1. Introduction
2. Study Area and Data
2.1. Study Area
2.2. Data Sets
3. Analytical Methods
3.1. Extraction of Glacier Outlines
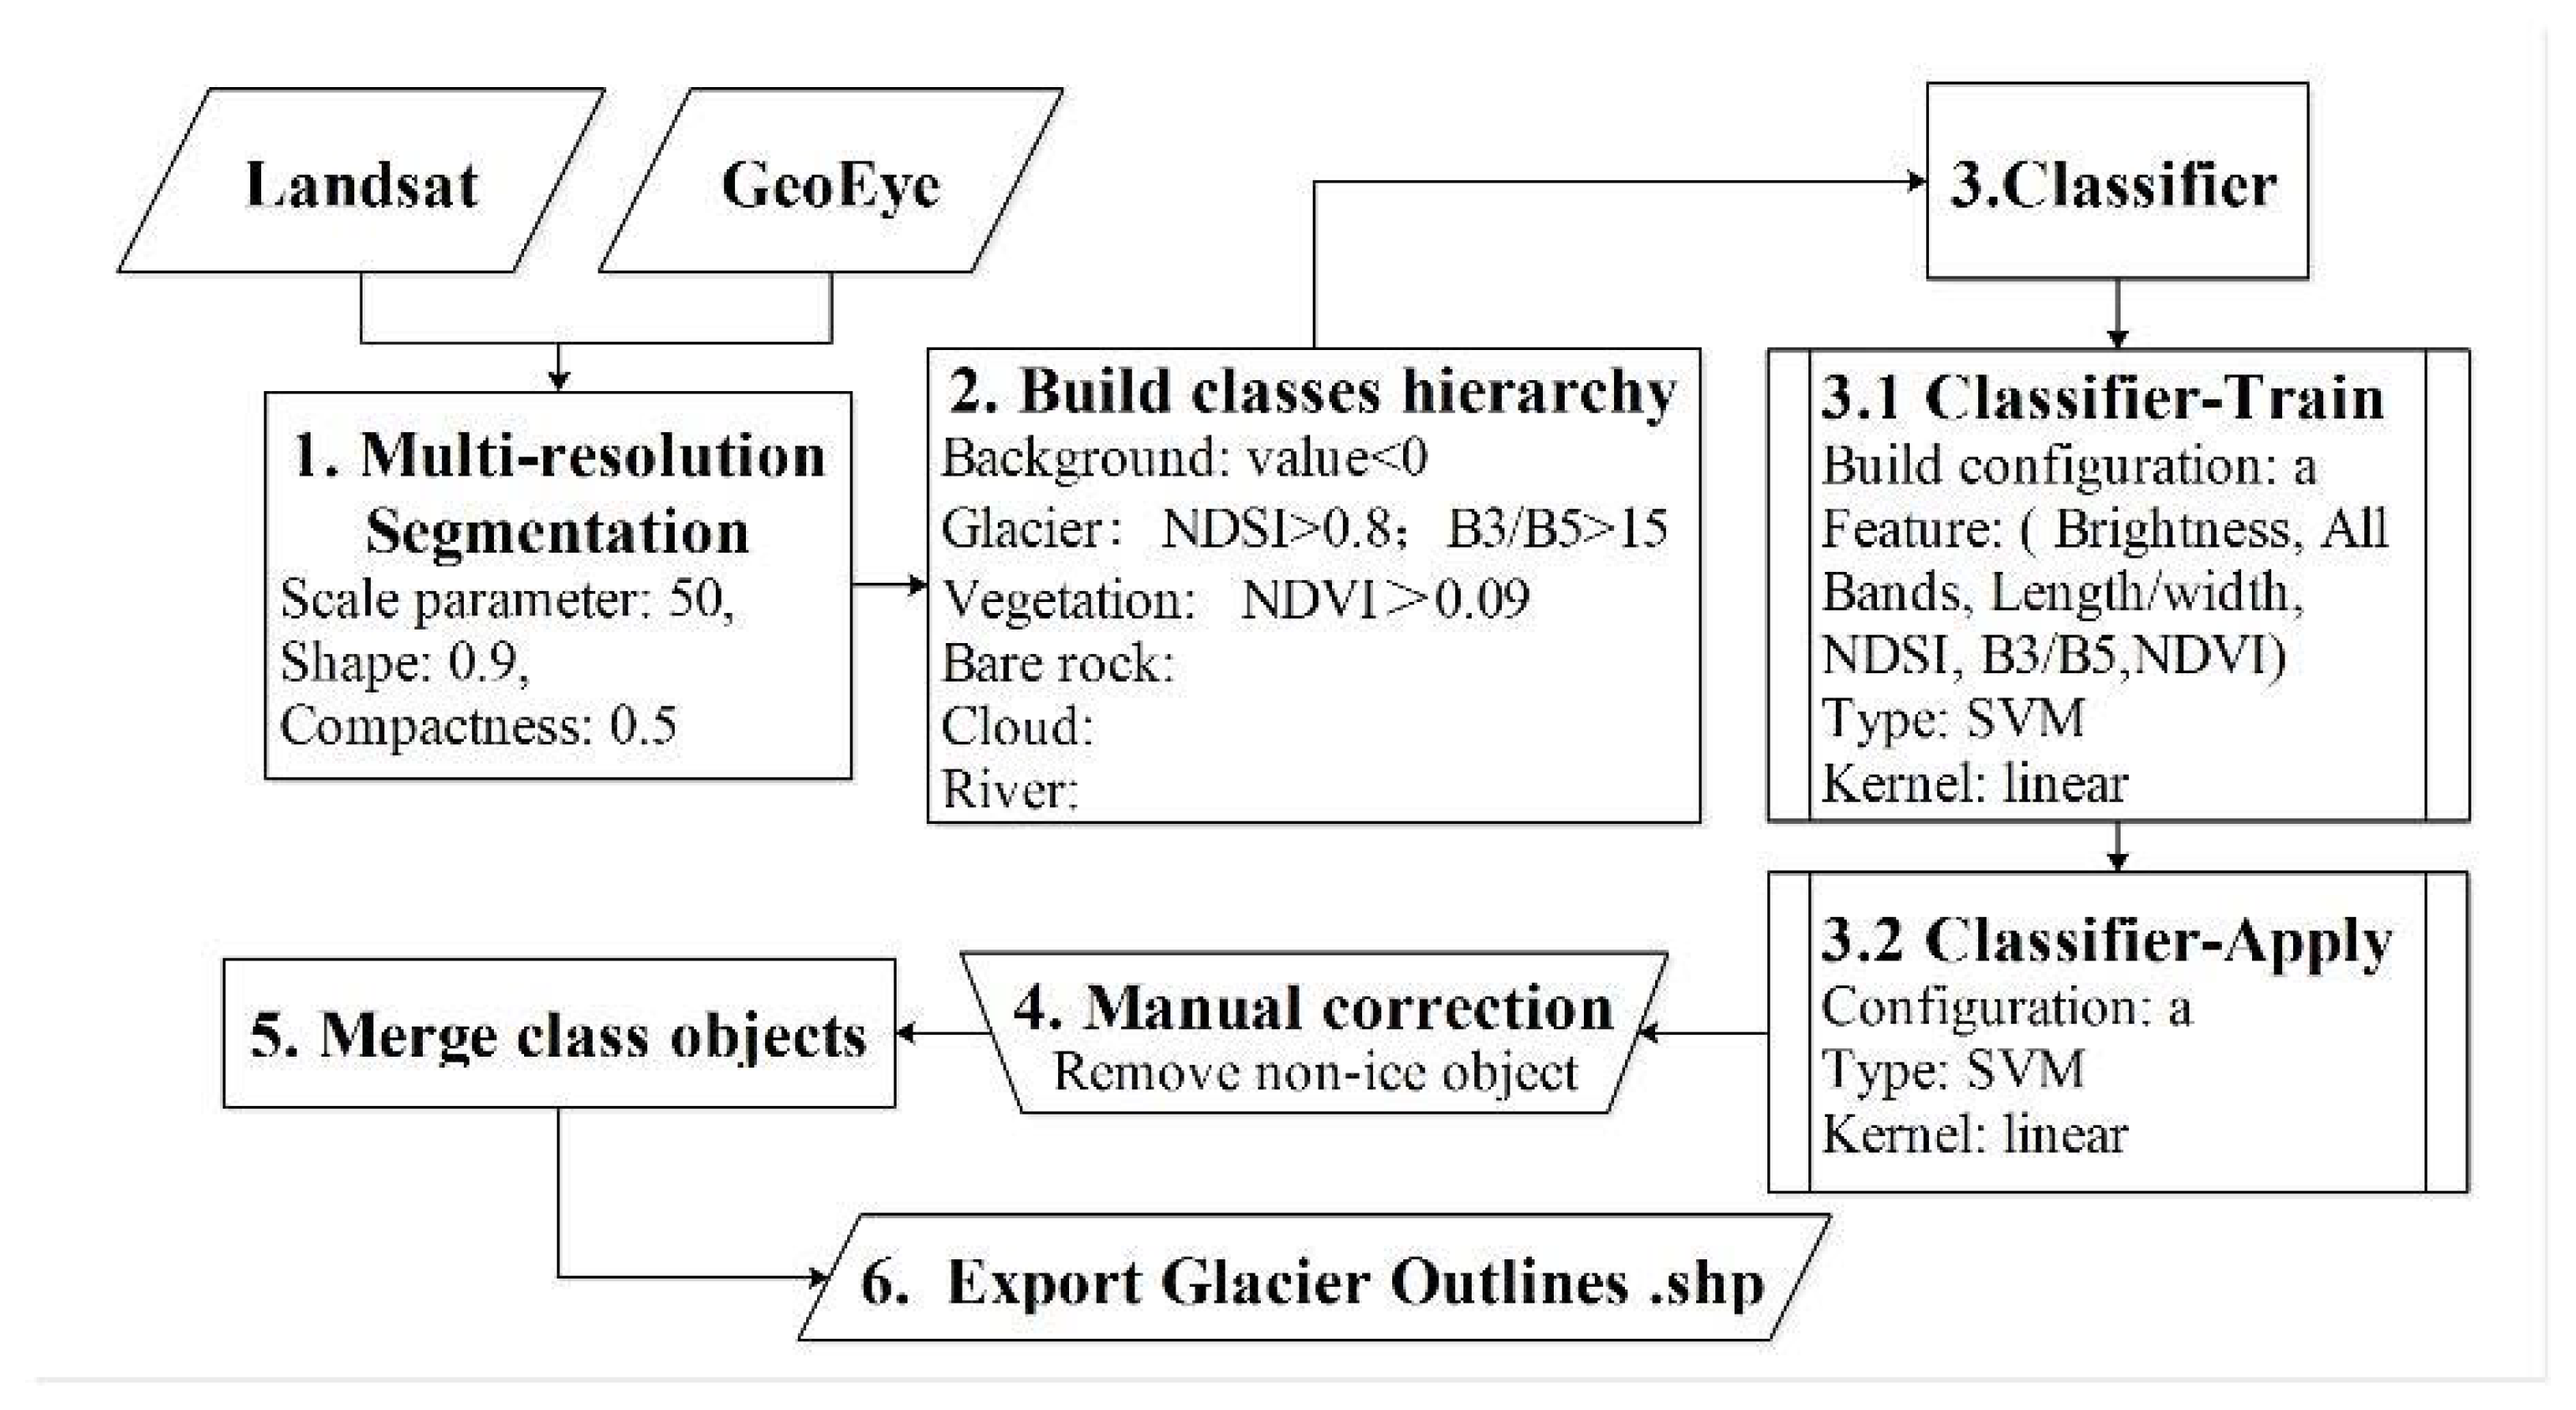
3.1.1. Object-Based Image Classification
3.1.2. Glacier Combination from Different Tiles
3.2. Assessment of Glacier Outlines
3.3. Computation of 3D Surface Areas
4. Results
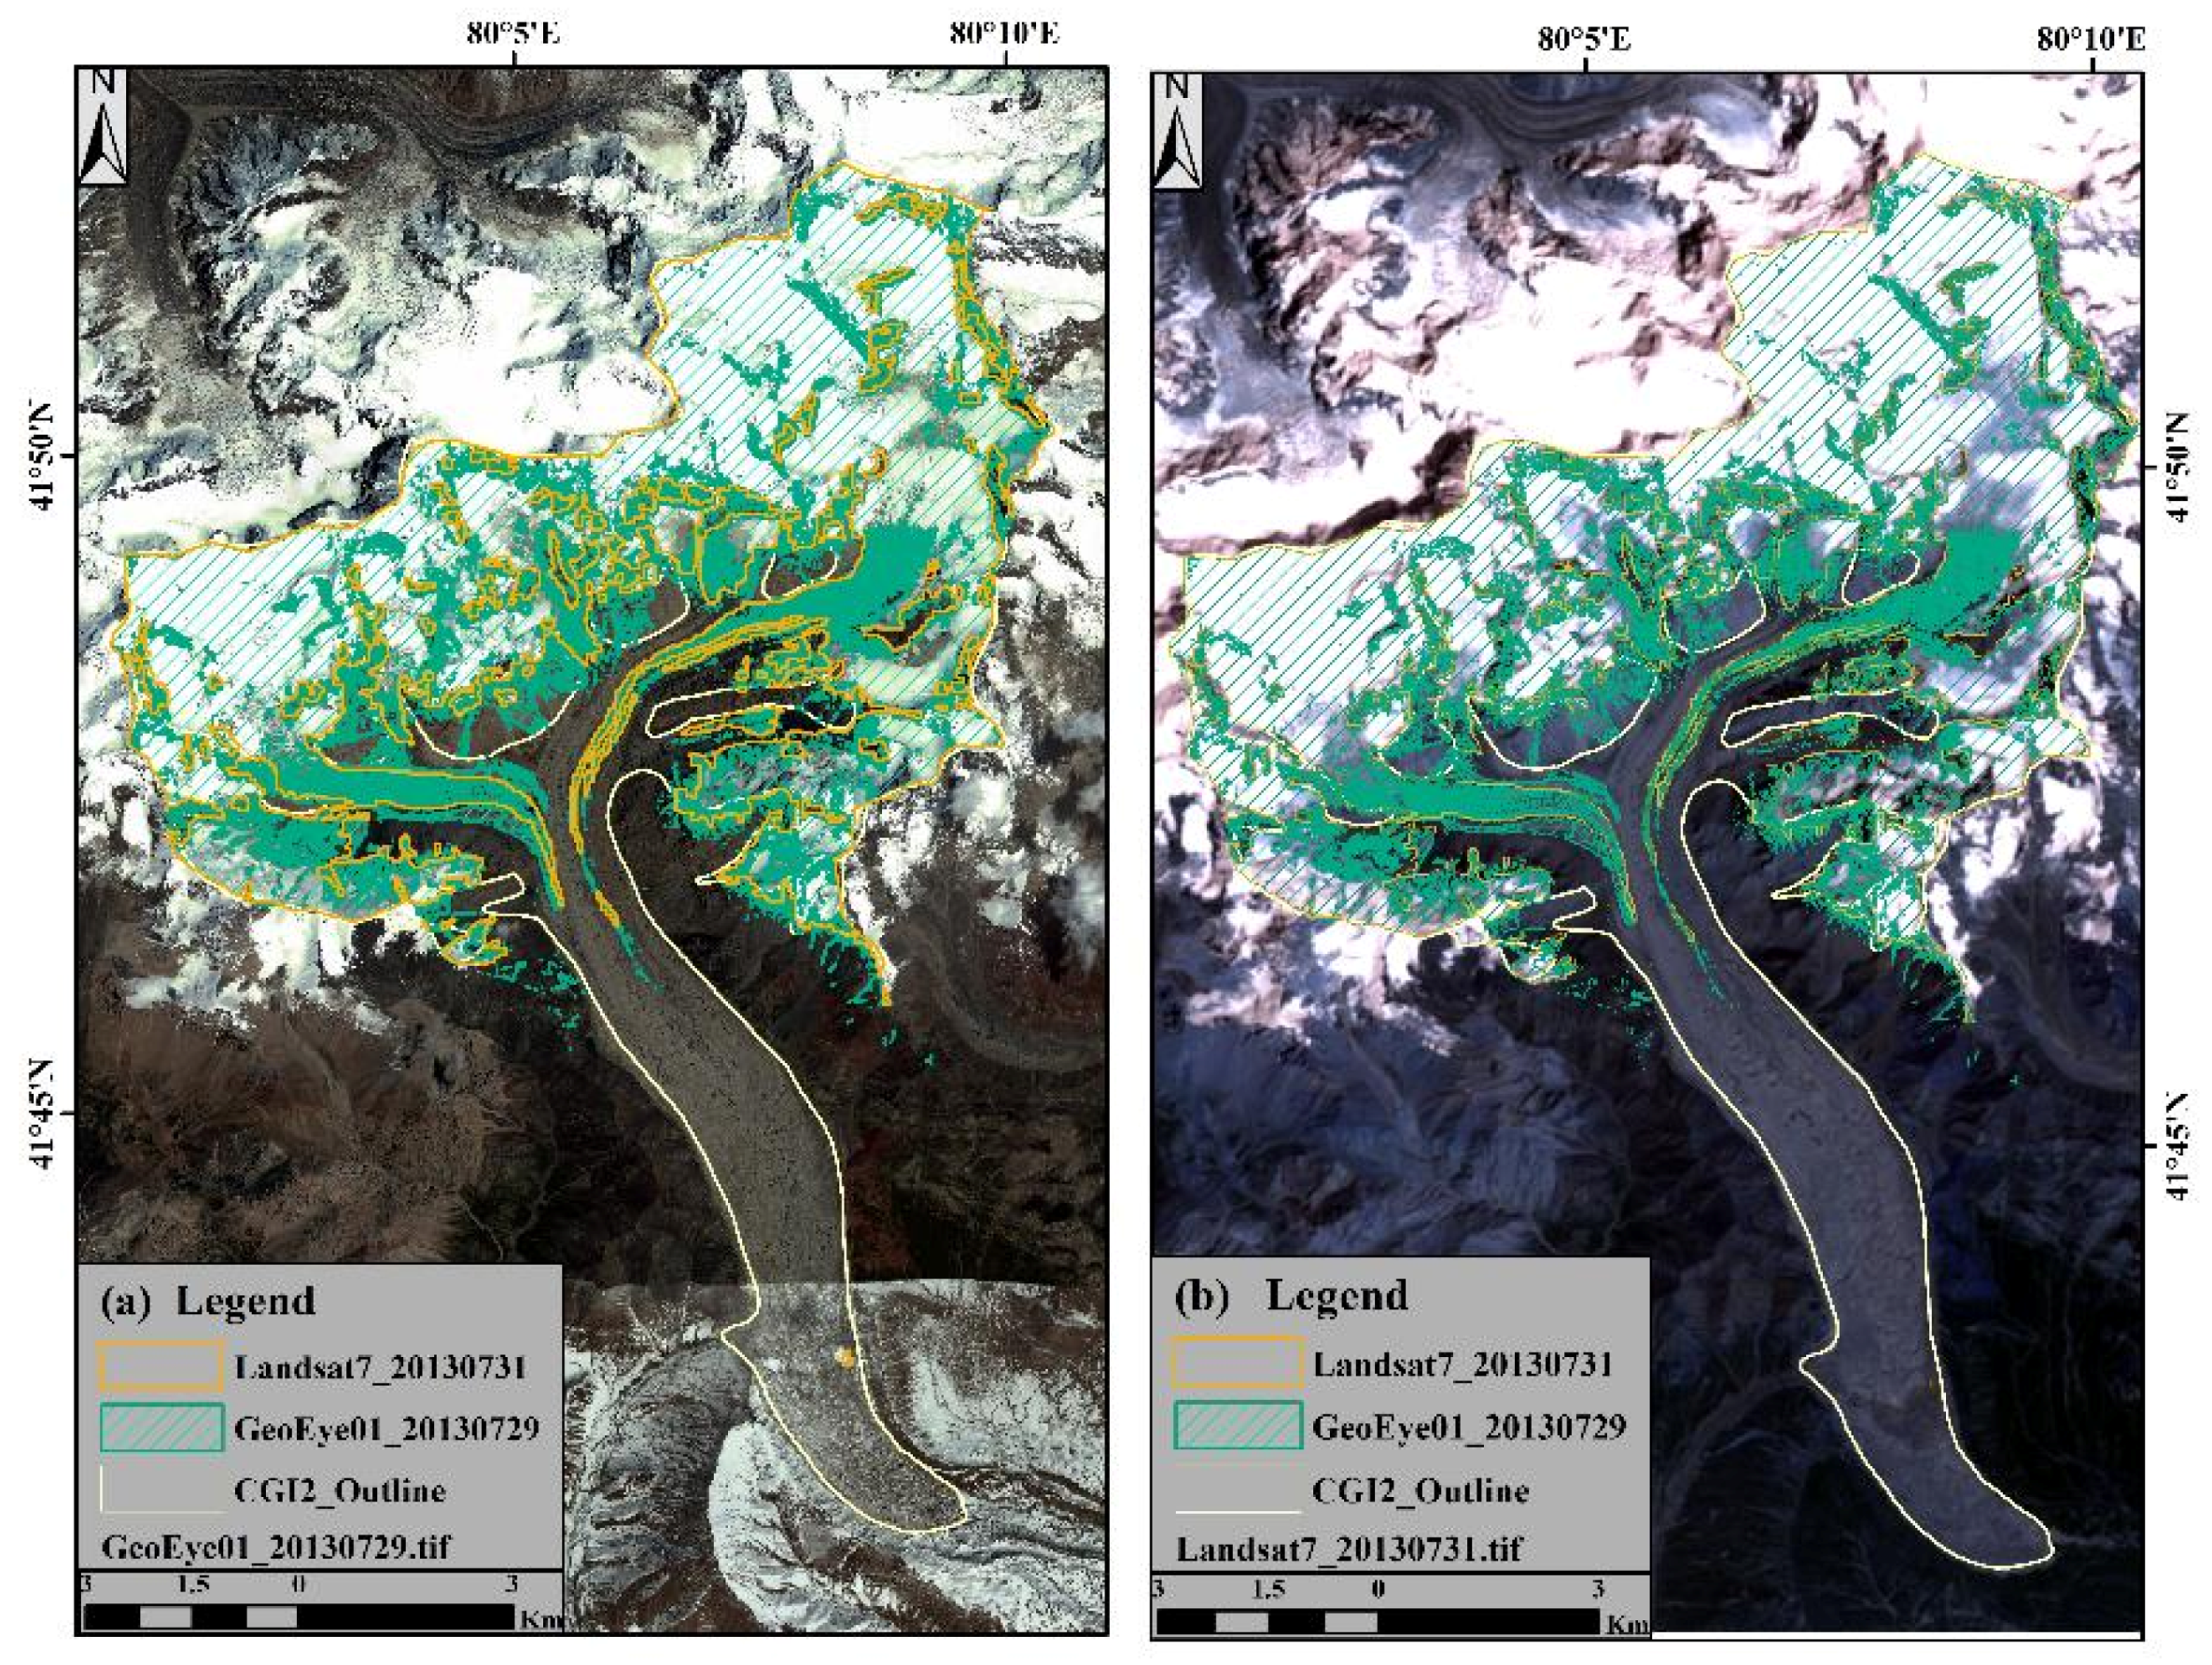
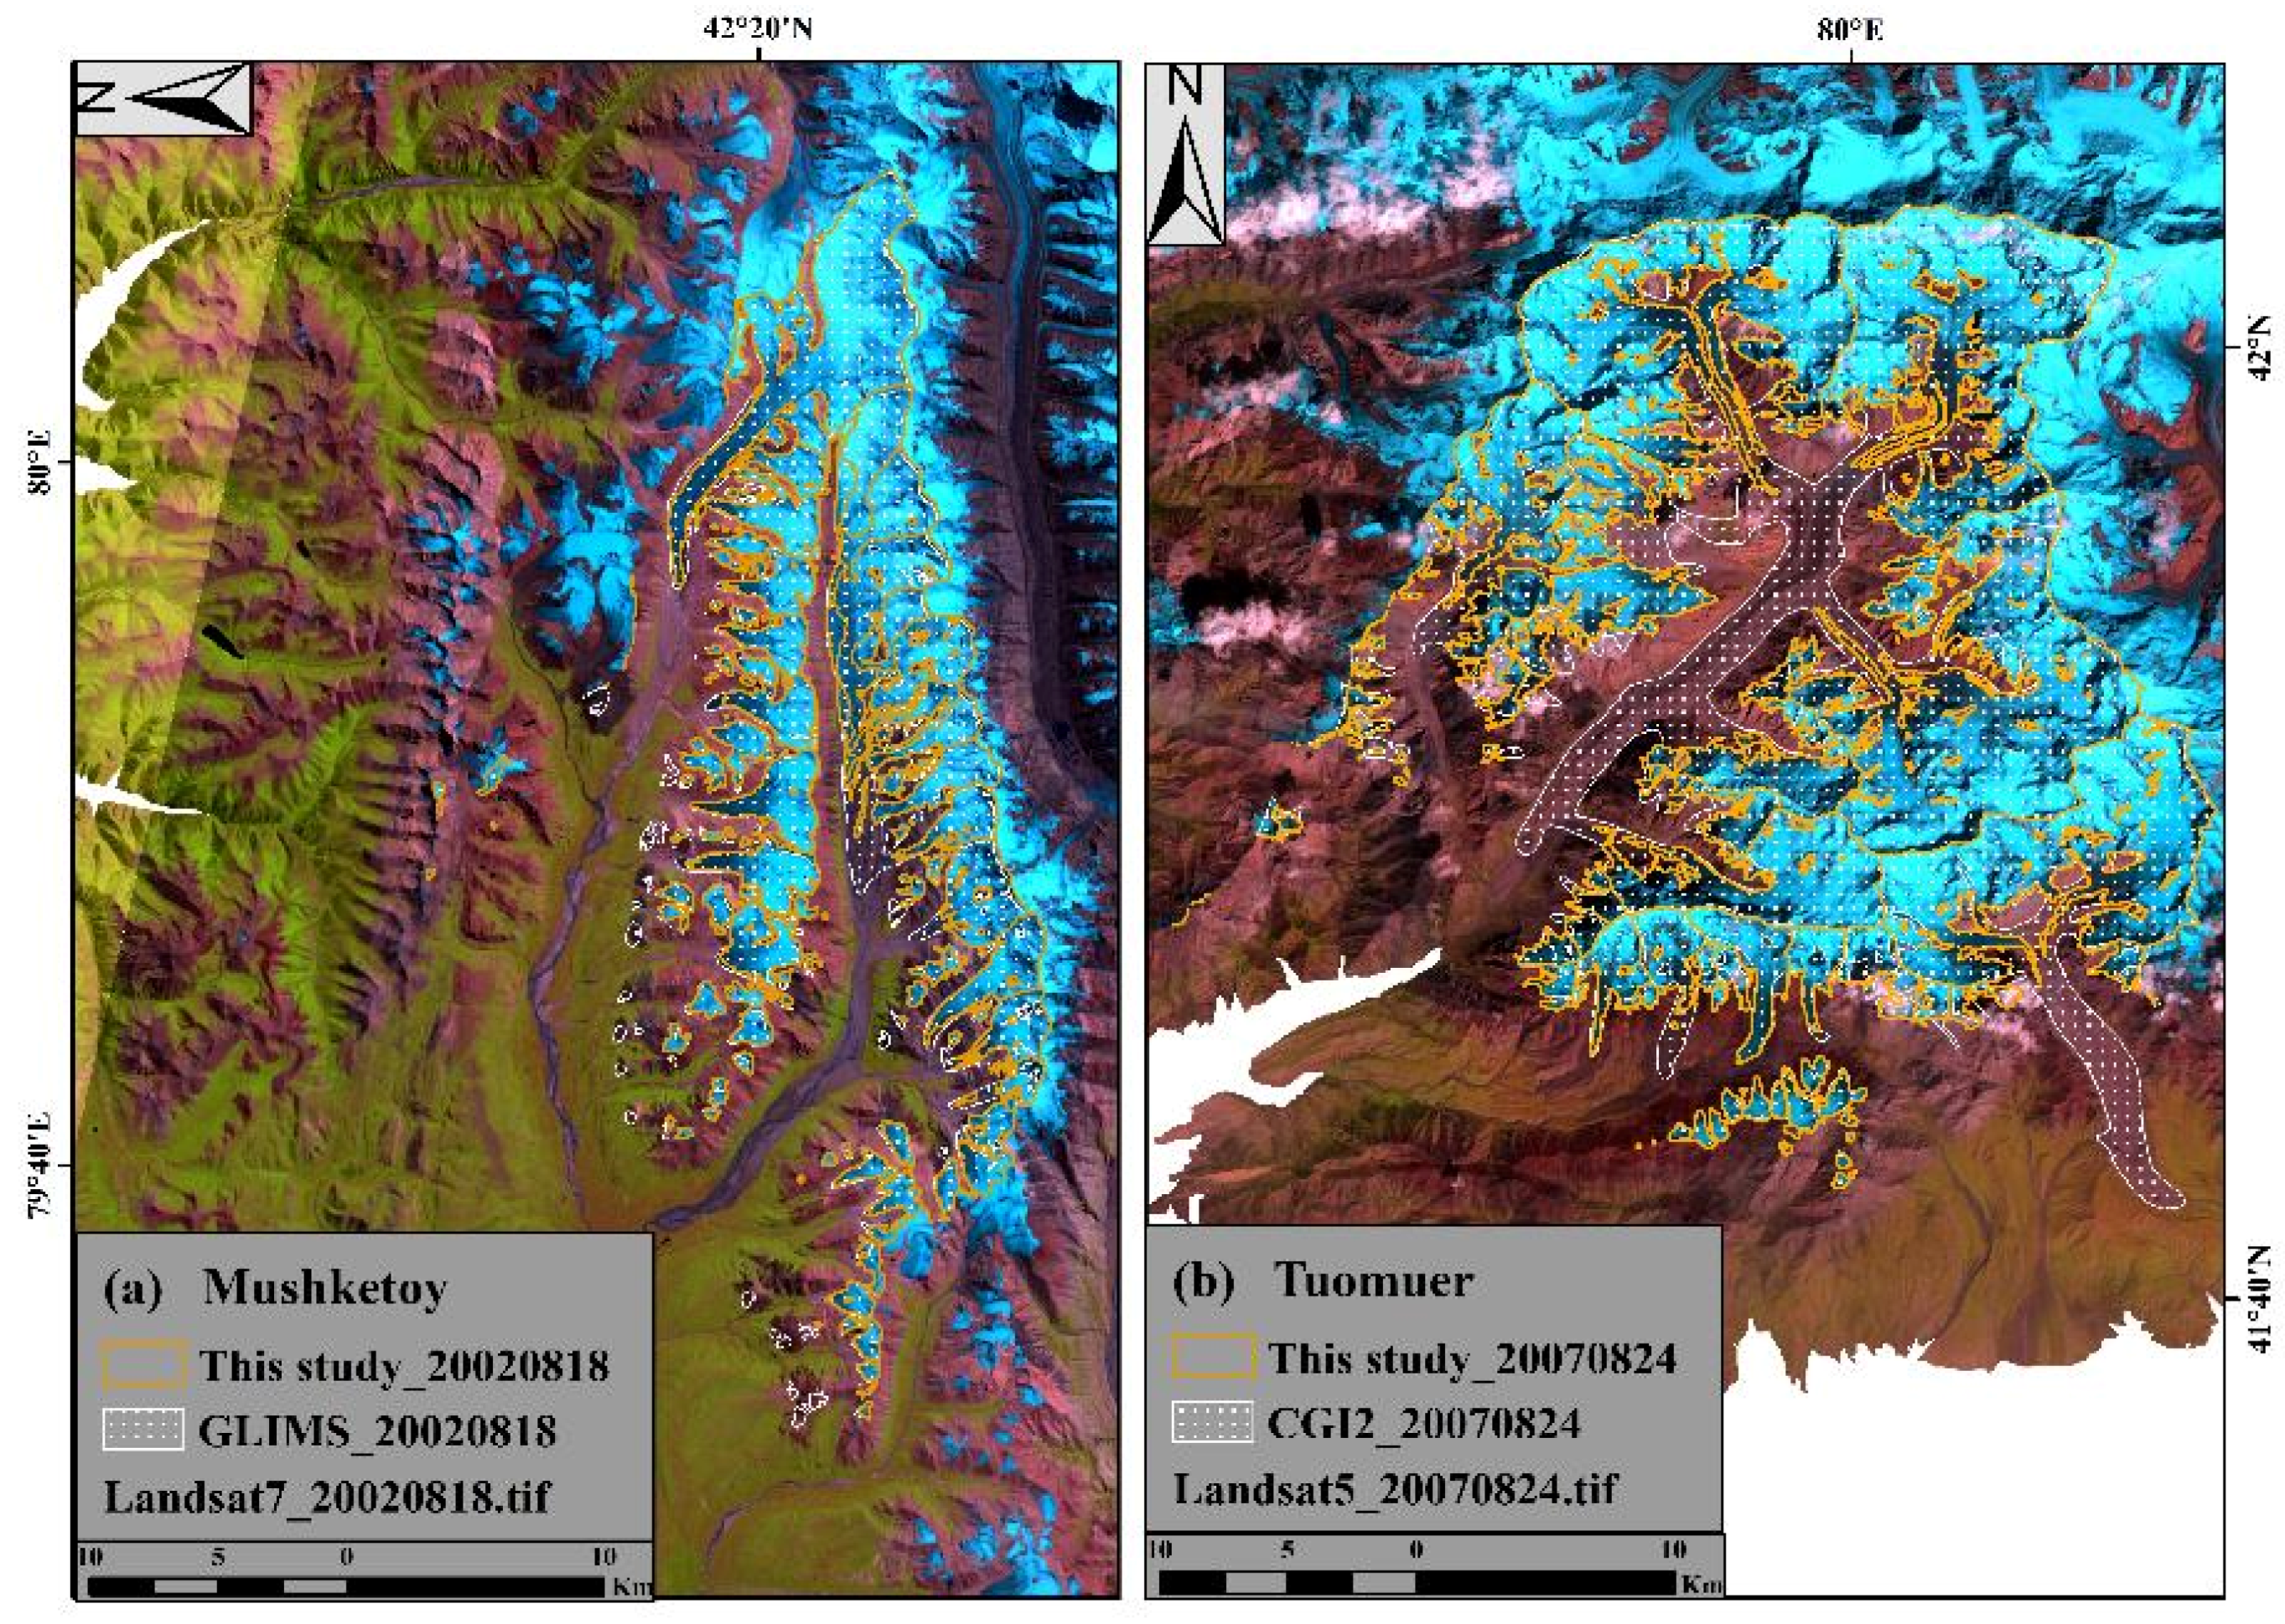
4.1. Glacier 2D Area Validation and Comparisons
4.2. Glaciers Changes
4.3. Glacier 2D and 3D Area Comparison and Change Analysis
4.3.1. Glacier 3D Area Computation
4.3.2. Glacier Area Change in Slope Zones
4.3.3. Glacier Area Change in Elevation Bands
4.3.4. Glacier Area Change in Aspect Fields
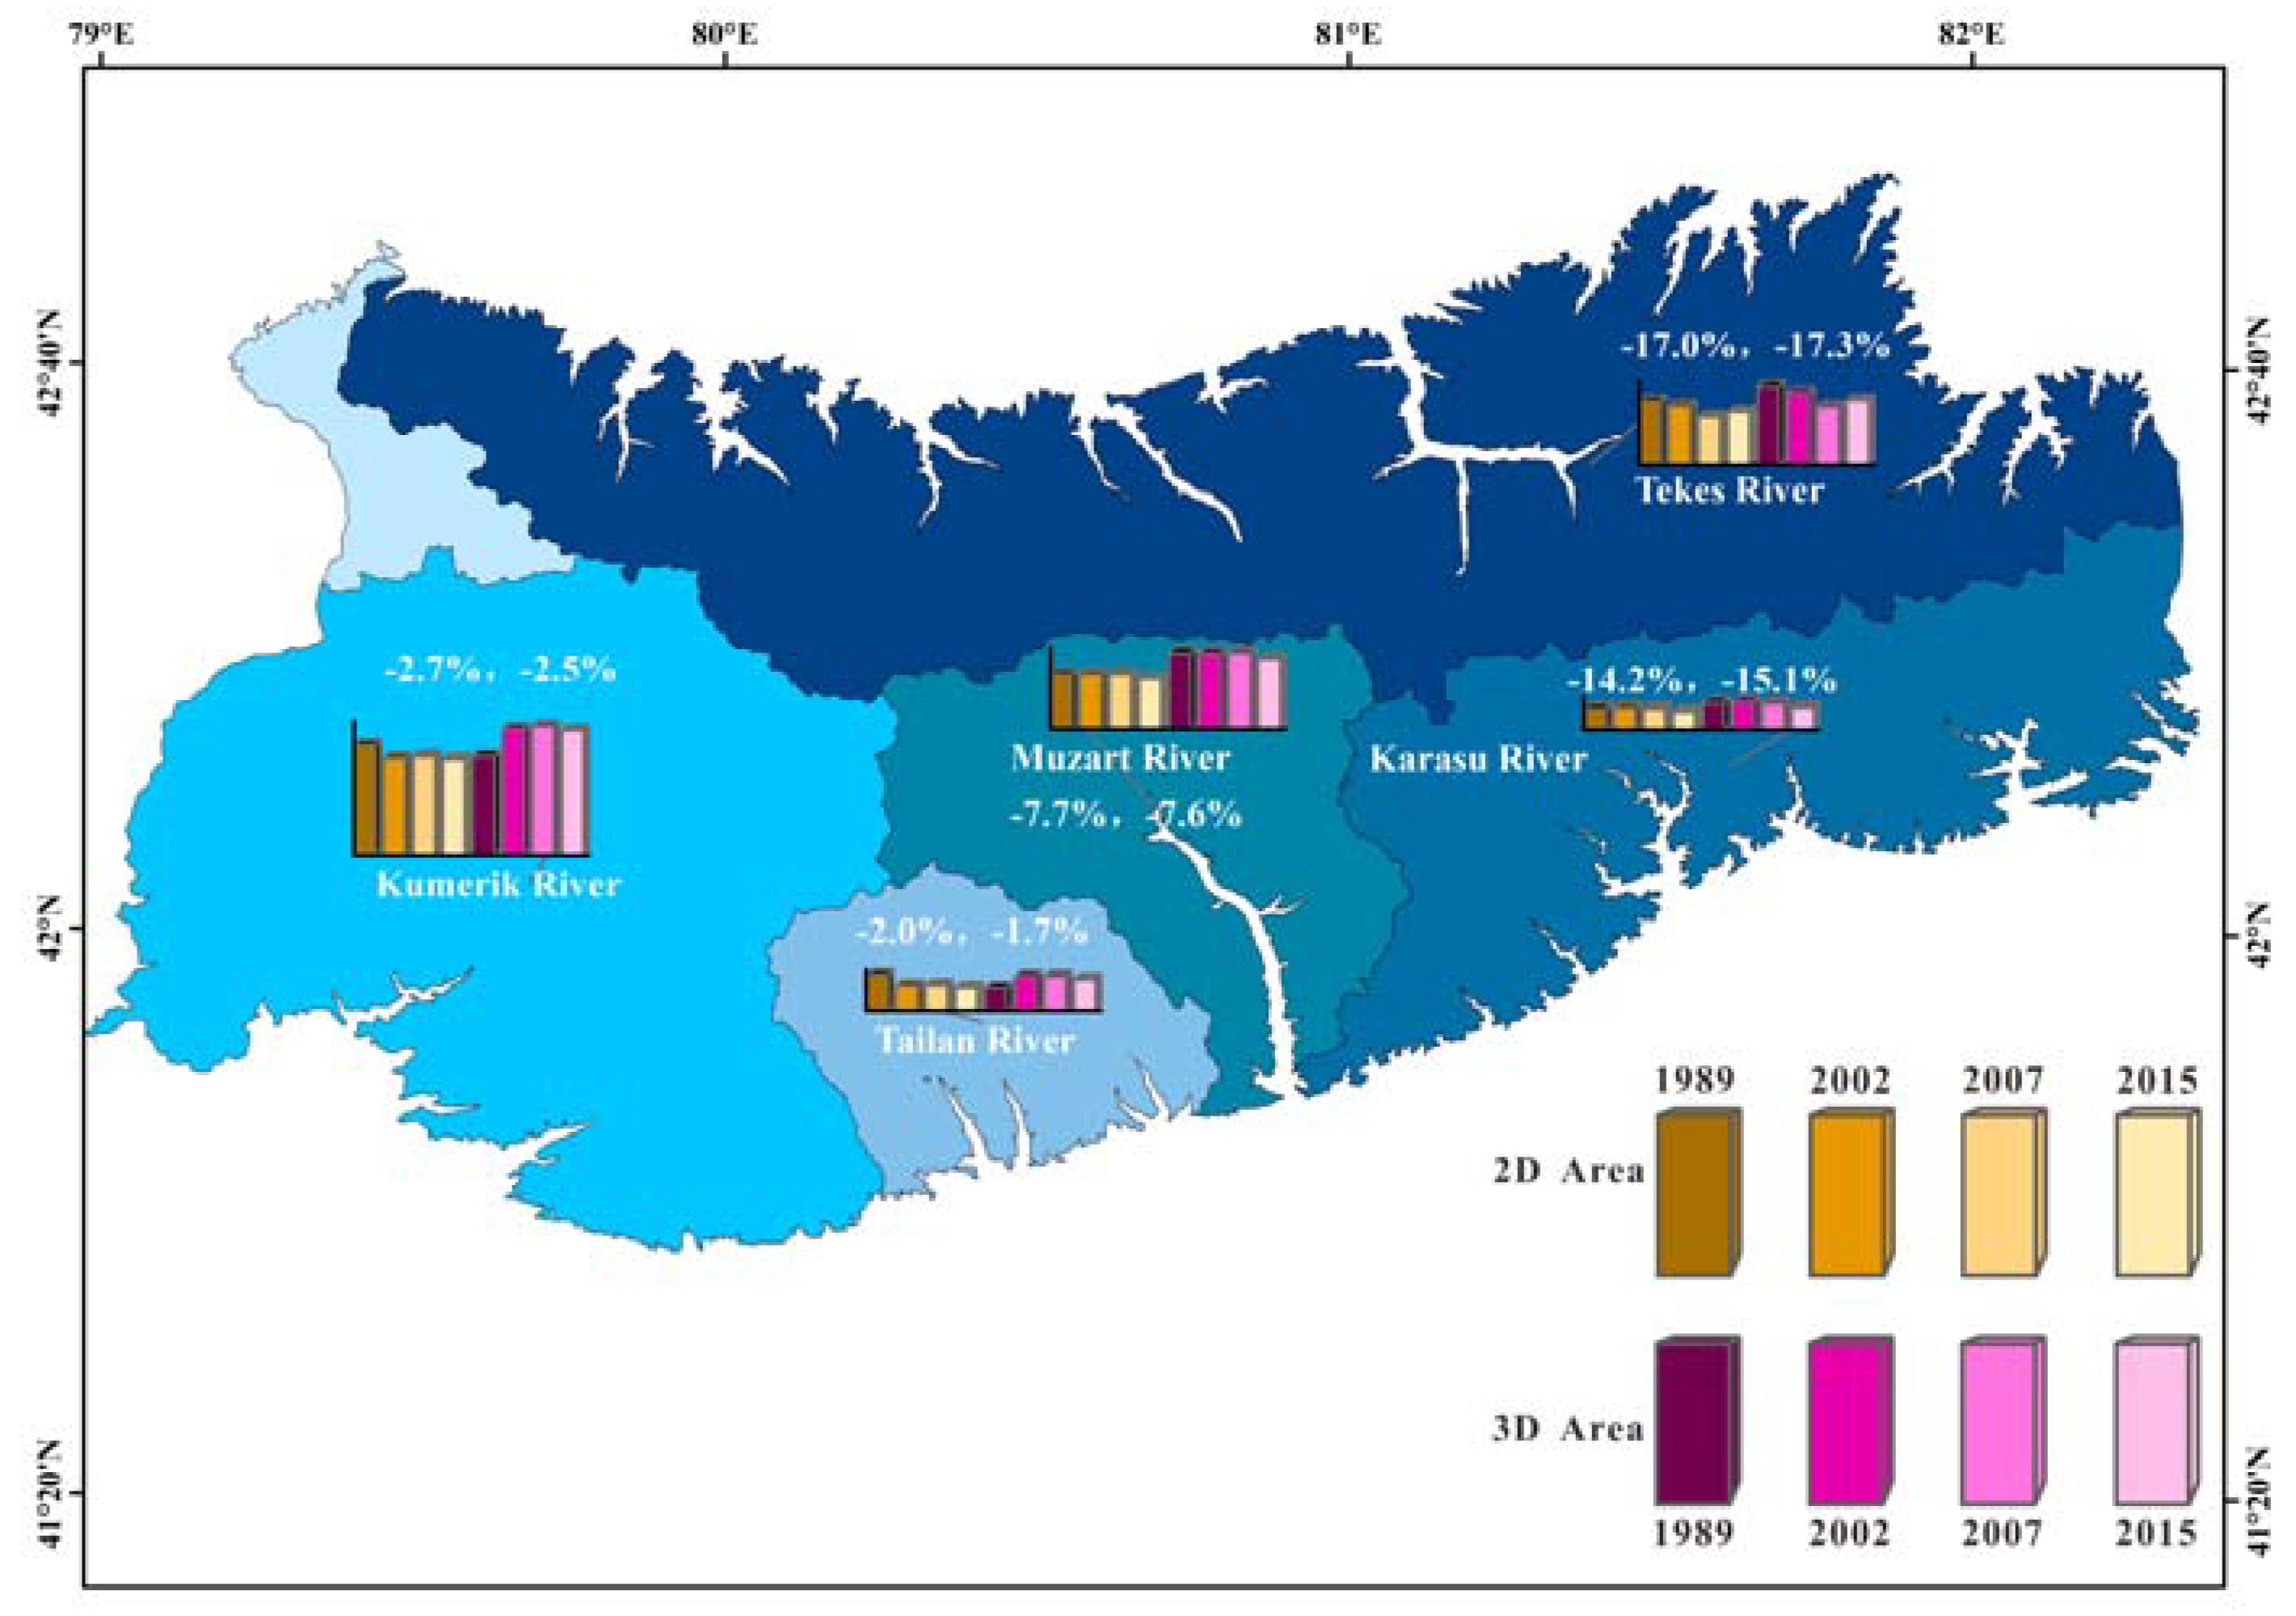
4.3.5. Glacier Area Change in River Catchments
5. Discussion
5.1. Glacier Mapping
5.2. Glacier 2D and 3D Area Difference
5.3. Glacier 2D Areas Changes
6. Summary
Author Contributions
Funding
Acknowledgments
Conflicts of Interest
References
- Adhikari, S.; Marshall, S.J. Glacier volume-area relation for high-order mechanics and transient glacier states. Geophys. Res. Lett. 2012, 39, 132–133. [Google Scholar] [CrossRef]
- Farinotti, D.; Longuevergne, L.; Moholdt, G.; Duethmann, D.; Mölg, T.; Bolch, T.; Vorogushyn, S.; Güntner, A. Substantial glacier mass loss in the Tien Shan over the past 50 years. Nat. Geosci. 2015, 8, 716–722. [Google Scholar] [CrossRef]
- Pritchard, H.D. Asia’s glaciers are a regionally important buffer against drought. Nature 2017, 545, 169–174. [Google Scholar] [CrossRef] [PubMed]
- Zhang, Y.; Yi, L.; Lin, S.; Liu, S.; Xi, C.; Wang, X. Using glacier area ratio to quantify effects of melt water on runoff. J. Hydrol. 2016, 538, 269–277. [Google Scholar] [CrossRef]
- Kutuzov, S.; Shahgedanova, M. Glacier retreat and climatic variability in the eastern Terskey–Alatoo, inner Tien Shan between the middle of the 19th century and beginning of the 21st century. Glob. Planet. Chang. 2009, 69, 59–70. [Google Scholar] [CrossRef]
- Wang, Y.; Hou, S.; Liu, Y. Glacier changes in the Karlik Shan, eastern Tien Shan, during 1971/72–2001/02. Ann. Glaciol. 2009, 50, 39–45. [Google Scholar] [CrossRef]
- Hagg, W.; Braun, L.N.; Kuhn, M.; Nesgaard, T.I. Modelling of hydrological response to climate change in glacierized Central Asian catchments. J. Hydrol. 2007, 332, 40–53. [Google Scholar] [CrossRef]
- Hagg, W.; Mayer, C.; Lambrecht, A.; Kriegel, D.; Azizov, E. Glacier changes in the Big Naryn basin, Central Tian Shan. Glob. Planet. Chang. 2013, 110, 40–50. [Google Scholar] [CrossRef]
- Haireti, A.; Tateishi, R.; Alsaaideh, B.; Gharechelou, S. Multi-criteria technique for mapping of debris-covered and clean-ice glaciers in the Shaksgam valley using Landsat TM and ASTER GDEM. J. Mt. Sci. 2016, 13, 703–714. [Google Scholar] [CrossRef]
- Sorg, A.F.; Bolch, T.; Stoffel, M.; Solomina, O.; Beniston, M. Climate change impacts on glaciers and runoff in Tien Shan (Central Asia). Nat. Clim. Chang. 2012, 2, 725–731. [Google Scholar] [CrossRef]
- Nuimura, T.; Sakai, A.; Taniguchi, K.; Nagai, H.; Lamsal, D.; Tsutaki, S.; Kozawa, A.; Hoshina, Y.; Takenaka, S.; Omiya, S.; et al. The GAMDAM Glacier Inventory: A quality-controlled inventory of Asian glaciers. Cryosphere 2015, 9, 849–864. [Google Scholar] [CrossRef]
- Pfeffer, W.T.; Arendt, A.A.; Bliss, A.; Bolch, T.; Cogley, J.G.; Gardner, A.S.; Hagen, J.O.; Hock, R.; Kaser, G.; Kienholz, C.; et al. The Randolph Glacier Inventory: A globally complete inventory of glaciers. J. Glaciol. 2014, 60, 537–552. [Google Scholar] [CrossRef]
- RGI Consortium. Randolph Glacier Inventory. 2017. Available online: http://www.glims.org/RGI/randolph.html (accessed on 8 August 2017).
- GLIMS; National Snow and Ice Data Center (NSIDC). GLIMS Glacier Database, [Central Asia]. NSIDC: Boulder, CO, USA, 2012. Available online: http://dx.doi.org/10.7265/N5V98602 (accessed on 12 August 2016).
- WGMS; National Snow and Ice Data Center (NSIDC). World Glacier Inventory, Version 1. [Central Asia]. NSIDC: Boulder, CO, USA, 1999. Updated 2012. Available online: http://dx.doi.org/10.7265/N5/NSIDC-WGI-2012-02 (accessed on 16 May 2016).
- Guo, W.; Liu, S.; Xu, J.; Wu, L.; Shangguan, D.; Yao, X.; Wei, J.; Bao, W.; Yu, P.; Liu, Q.; et al. The second Chinese glacier inventory: Data, methods and results. J. Glaciol. 2015, 61, 357–372. [Google Scholar] [CrossRef]
- Wang, S.; Zhang, M.; Li, Z.; Wang, F.; Li, H.; Li, Y.; Huang, X. Response of Glacier Area Variation to Climate Change in Chinese Tianshan Mountains in the Past 50 Years. Acta Geogr. Sin. 2011, 82, 247–261. [Google Scholar]
- Xu, B.; Lu, Z.; Liu, S.; Jing, L.; Xie, J.; Long, A.; Yin, Z.; Zou, S. Glacier changes and their impacts on the discharge in the past half-century in Tekes watershed, Central Asia. Phys. Chem. Earth 2015, 89–90, 96–103. [Google Scholar] [CrossRef]
- Shangguan, D.H.; Bolch, T.; Ding, Y.J.; Kröhnert, M.; Pieczonka, T.; Wetzel, H.U.; Liu, S.Y. Mass changes of Southern and Northern Inylchek Glacier, Central Tian Shan, Kyrgyzstan, during ~1975 and 2007 derived from remote sensing data. Cryosphere 2015, 9, 703–717. [Google Scholar] [CrossRef]
- Wang, X.; Chen, H.; Chen, Y. Large Differences between Glacier 3D Surface Extents and 2D Planar Areas in Central Tianshan. Water 2017, 9, 282. [Google Scholar] [CrossRef]
- Wang, L.; Zhong, L.; Wang, F.; Li, H.; Wang, P. Glacier changes from 1964 to 2004 in the Jinghe River basin, Tien Shan. Cold Reg. Sci. Technol. 2014, 102, 78–83. [Google Scholar] [CrossRef]
- Kaldybayev, A.; Chen, Y.; Evgeniy, V. Glacier change in the Karatal river basin, Zhetysu (Dzhungar) Alatau, Kazakhstan. Ann. Glaciol. 2016, 57, 11–19. [Google Scholar] [CrossRef]
- Du, W.; Li, J.; Bao, A.; Wang, B. Mapping changes in the glaciers of the eastern Tienshan Mountains during 1977–2013 using multitemporal remote sensing. J. Appl. Remote Sens. 2014, 8. [Google Scholar] [CrossRef]
- Pieczonka, T.; Bolch, T.; Wei, J.; Liu, S. Heterogeneous mass loss of glaciers in the Aksu-Tarim Catchment (Central Tien Shan) revealed by 1976 KH-9 Hexagon and 2009 SPOT-5 stereo imagery. Remote Sens. Environ. 2013, 130, 233–244. [Google Scholar] [CrossRef]
- Cogley, J.; Hock, R.; Rasmussen, L.; Arendt, A.; Bauder, A.; Braithwaite, R.; Jansson, P.; Kaser, G.; Möller, M.; Nicholson, L.; et al. Glossary of Glacier Mass Balance and Related Terms; IHP-VII Technical Documents in Hydrology No. 86, IACS Contribution No. 2; UNESCO-IHP: Paris, France, 2011. [Google Scholar]
- Fierz, C.; Armstrong, R.L.; Durand, Y.; Etchevers, P.; Greene, E.; McClung, D.M.; Nishimura, K.; Satyawali, P.K.; Sokratov, S.A. The International Classification for Seasonal Snow on the Ground; IHP-VII Technical Documents in Hydrology No. 83, IACS Contribution No. 1; UNESCO-IHP: Paris, France, 2009. [Google Scholar]
- Pieczonka, T.; Bolch, T. Region-wide glacier mass budgets and area changes for the Central Tien Shan between ~1975 and 1999 using Hexagon KH-9 imagery. Glob. Planet. Chang. 2015, 128, 1–13. [Google Scholar] [CrossRef]
- Wang, X.W.; Xie, H.J. New methods for studying the spatiotemporal variation of snow cover based on combination products of MODIS Terra and Aqua. J. Hydrol. 2009, 371, 192–200. [Google Scholar] [CrossRef]
- World Data Center for Glaciology and Geocryology (WDCGG), Lanzhou, 2015. Available online: http://wdcdgg.westgis.ac.cn/ (accessed on 12 October 2015).
- Frey, H.; Paul, F. On the suitability of the SRTM DEM and ASTER GDEM for the compilation of topographic parameters in glacier inventories. Int. J. Appl. Earth Obs. Geoinf. 2012, 18, 480–490. [Google Scholar] [CrossRef]
- Wang, L.; Li, Z.; Wang, F. Spatial distribution of the debris layer on glaciers of the Tuomuer Peak, western Tian Shan. J. Earth Sci. 2011, 22, 528–538. [Google Scholar] [CrossRef]
- Wang, X.; Xie, H.; Liang, T. Evaluation of MODIS snow cover and cloud mask and its application in Northern Xinjiang, China. Remote Sens. Environ. 2008, 112, 1497–1513. [Google Scholar] [CrossRef]
- Kraaijenbrink, P.D.A.; Shea, J.M.; Pellicciotti, F.; Jong, S.M.D.; Immerzeel, W.W. Object-based analysis of unmanned aerial vehicle imagery to map and characterise surface features on a debris-covered glacier. Remote Sens. Environ. 2016, 186, 581–595. [Google Scholar] [CrossRef]
- Nijhawan, R.; Garg, P.; Thakur, P. A comparison of classification techniques for glacier change detection using multispectral images. Perspect. Sci. 2016, 8, 377–380. [Google Scholar] [CrossRef]
- Robson, B.A.; Nuth, C.; Dahl, S.O.; Hölbling, D.; Strozzi, T.; Nielsen, P.R. Automated classification of debris-covered glaciers combining optical, SAR and topographic data in an object-based environment. Remote Sens. Environ. 2015, 170, 372–387. [Google Scholar] [CrossRef]
- Bajracharya, S.R.; Maharjan, S.B.; Shrestha, F. The status and decadal change of glaciers in Bhutan from the 1980s to 2010 based on satellite data. Ann. Glaciol. 2014, 55, 159–166. [Google Scholar] [CrossRef]
- Trimble. Documentation: eCognition Developer 9.0; Reference Book; Trimble Germany GmbH: Munich, Germany, 2014. [Google Scholar]
- Huang, C.; Davis, L.S.; Townshend, J.R.G. An assessment of support vector machines for land cover classification. Int. J. Remote Sens. 2002, 23, 725–749. [Google Scholar] [CrossRef]
- Wang, A.X.; Zheng, H.; Chen, Y.; Liu, H.; Liu, L.; Huang, H.; Liu, K. Mapping snow cover variations using a MODIS daily cloud-free snow cover product in northeast China. J. Appl. Remote Sens. 2014, 8. [Google Scholar] [CrossRef]
- Thakuri, S.; Salerno, F.; Smiraglia, C.; Bolch, T.; D’Agata, C.; Viviano, G.; Tartari, G. Tracing glacier changes since the 1960s on the south slope of Mt. Everest (central Southern Himalaya) using optical satellite imagery. Cryosphere 2014, 8, 1297–1315. [Google Scholar] [CrossRef]
- Ye, Q.; Kang, S.; Chen, F.; Wang, J. Monitoring glacier variations on Geladandong mountain, central Tibetan Plateau, from 1969 to 2002 using remote-sensing and GIS technologies. J. Glaciol. 2006, 52, 537–545. [Google Scholar] [CrossRef]
- Hall, D.K.; Bayr, K.J.; Schöner, W.; Bindschadler, R.A.; Chien, J.Y.L. Consideration of the errors inherent in mapping historical glacier positions in Austria from the ground and space (1893–2001). Remote Sens. Environ. 2003, 86, 566–577. [Google Scholar] [CrossRef]
- Wang, K.; Lo, C.P. An Assessment of the Accuracy of Triangulated Irregular Networks (TINs) and Lattices in ARC/INFO. Trans. GIS 1999, 3, 161–174. [Google Scholar] [CrossRef]
- Jenness, J.S. Calculating landscape surface area from digital elevation models. Wildl. Soc. Bull. 2004, 32, 829–839. [Google Scholar] [CrossRef]
- Zhang, Y.; Zhang, L.N.; Yang, C.D.; Bao, W.D.; Yuan, X.X. Surface area processing in GIS for different mountain regions. For. Ecosyst. 2011, 13, 311–314. [Google Scholar] [CrossRef]
- Petrakov, D.; Shpuntova, A.; Aleinikov, A.; Kääb, A.; Kutuzov, S.; Lavrentiev, I.; Stoffel, M.; Tutubalina, O.; Usubaliev, R. Accelerated glacier shrinkage in the Ak-Shyirak massif, Inner Tien Shan, during 2003–2013. Sci. Total Environ. 2016, 562, 364–378. [Google Scholar] [CrossRef] [PubMed]
- Aizen, V.B.; Kuzmichenok, V.A.; Surazakov, A.B.; Aizen, E.M. Glacier changes in the Tien Shan as determined from topographic and remotely sensed data. Glob. Planet. Chang. 2007, 56, 328–340. [Google Scholar] [CrossRef]
- Raup, B.; Kargel, J.S.; Bishop, M.P.; Hamilton, G.; Lee, E.; Paul, F.; Rau, F.; Soltesz, D.; Khalsa, S.J.S.; Beedle, M.; et al. Remote sensing and GIS technology in the Global Land Ice Measurements from Space (GLIMS) Project. Comput. Geosci. 2007, 33, 104–125. [Google Scholar] [CrossRef]
- Paul, F.; Barrand, N.E.; Baumann, S.; Berthier, E.; Bolch, T.; Casey, K.; Frey, H.; Joshi, S.P.; Konovalov, V.; Le Bris, R.; et al. On the accuracy of glacier outlines derived from remote-sensing data. Ann. Glaciol. 2013, 54, 171–182. [Google Scholar] [CrossRef]
- Farinotti, D.; Huss, M. An upper-bound estimate for the accuracy of volume-area scaling. Cryosphere 2013, 7, 1707–1720. [Google Scholar] [CrossRef]
- Farinotti, D.; Huss, M.; Bauder, A.; Funk, M.; Truffer, M. A method to estimate the ice volume and ice-thickness distribution of alpine glaciers. J. Glaciol. 2009, 55, 422–430. [Google Scholar] [CrossRef]
- Meier, M.F.; Dyurgerov, M.B.; Rick, U.K.; O’Neel, S.; Pfeffer, W.T.; Anderson, R.S.; Anderson, S.P.; Glazovsky, A.F. Glaciers dominate eustatic sea-level rise in the 21st century. Science 2007, 317, 1064–1067. [Google Scholar] [CrossRef] [PubMed]
- Bahr, D.B.; Pfeffer, W.T.; Kaser, G. A review of volume-area scaling of glaciers. Rev. Geophys. 2015, 53, 95–140. [Google Scholar] [CrossRef] [PubMed]
- Bahr, D.B.; Mark, D.; Meier, M.F. Sea-level rise from glaciers and ice caps: A lower bound. Geophys. Res. Lett. 2009, 36, 151–157. [Google Scholar] [CrossRef]
- Li, Z.; Li, K.; Wang, L. Study on Recent Glacier Changes and Their Impact on Water Resources in Xinjiang, North Western China. Quat. Sci. 2010, 30, 96–106. [Google Scholar]
- Bolch, T. Climate change and glacier retreat in northern Tien Shan (Kazakhstan/Kyrgyzstan) using remote sensing data. Glob. Planet. Chang. 2007, 56, 1–12. [Google Scholar] [CrossRef]
- Narama, C.; Kääb, A.; Duishonakunov, M.; Abdrakhmatov, K. Spatial variability of recent glacier area changes in the Tien Shan Mountains, Central Asia, using Corona (~1970), Landsat (~2000), And ALOS (~2007) satellite data. Glob. Planet. Chang. 2010, 71, 42–54. [Google Scholar] [CrossRef]
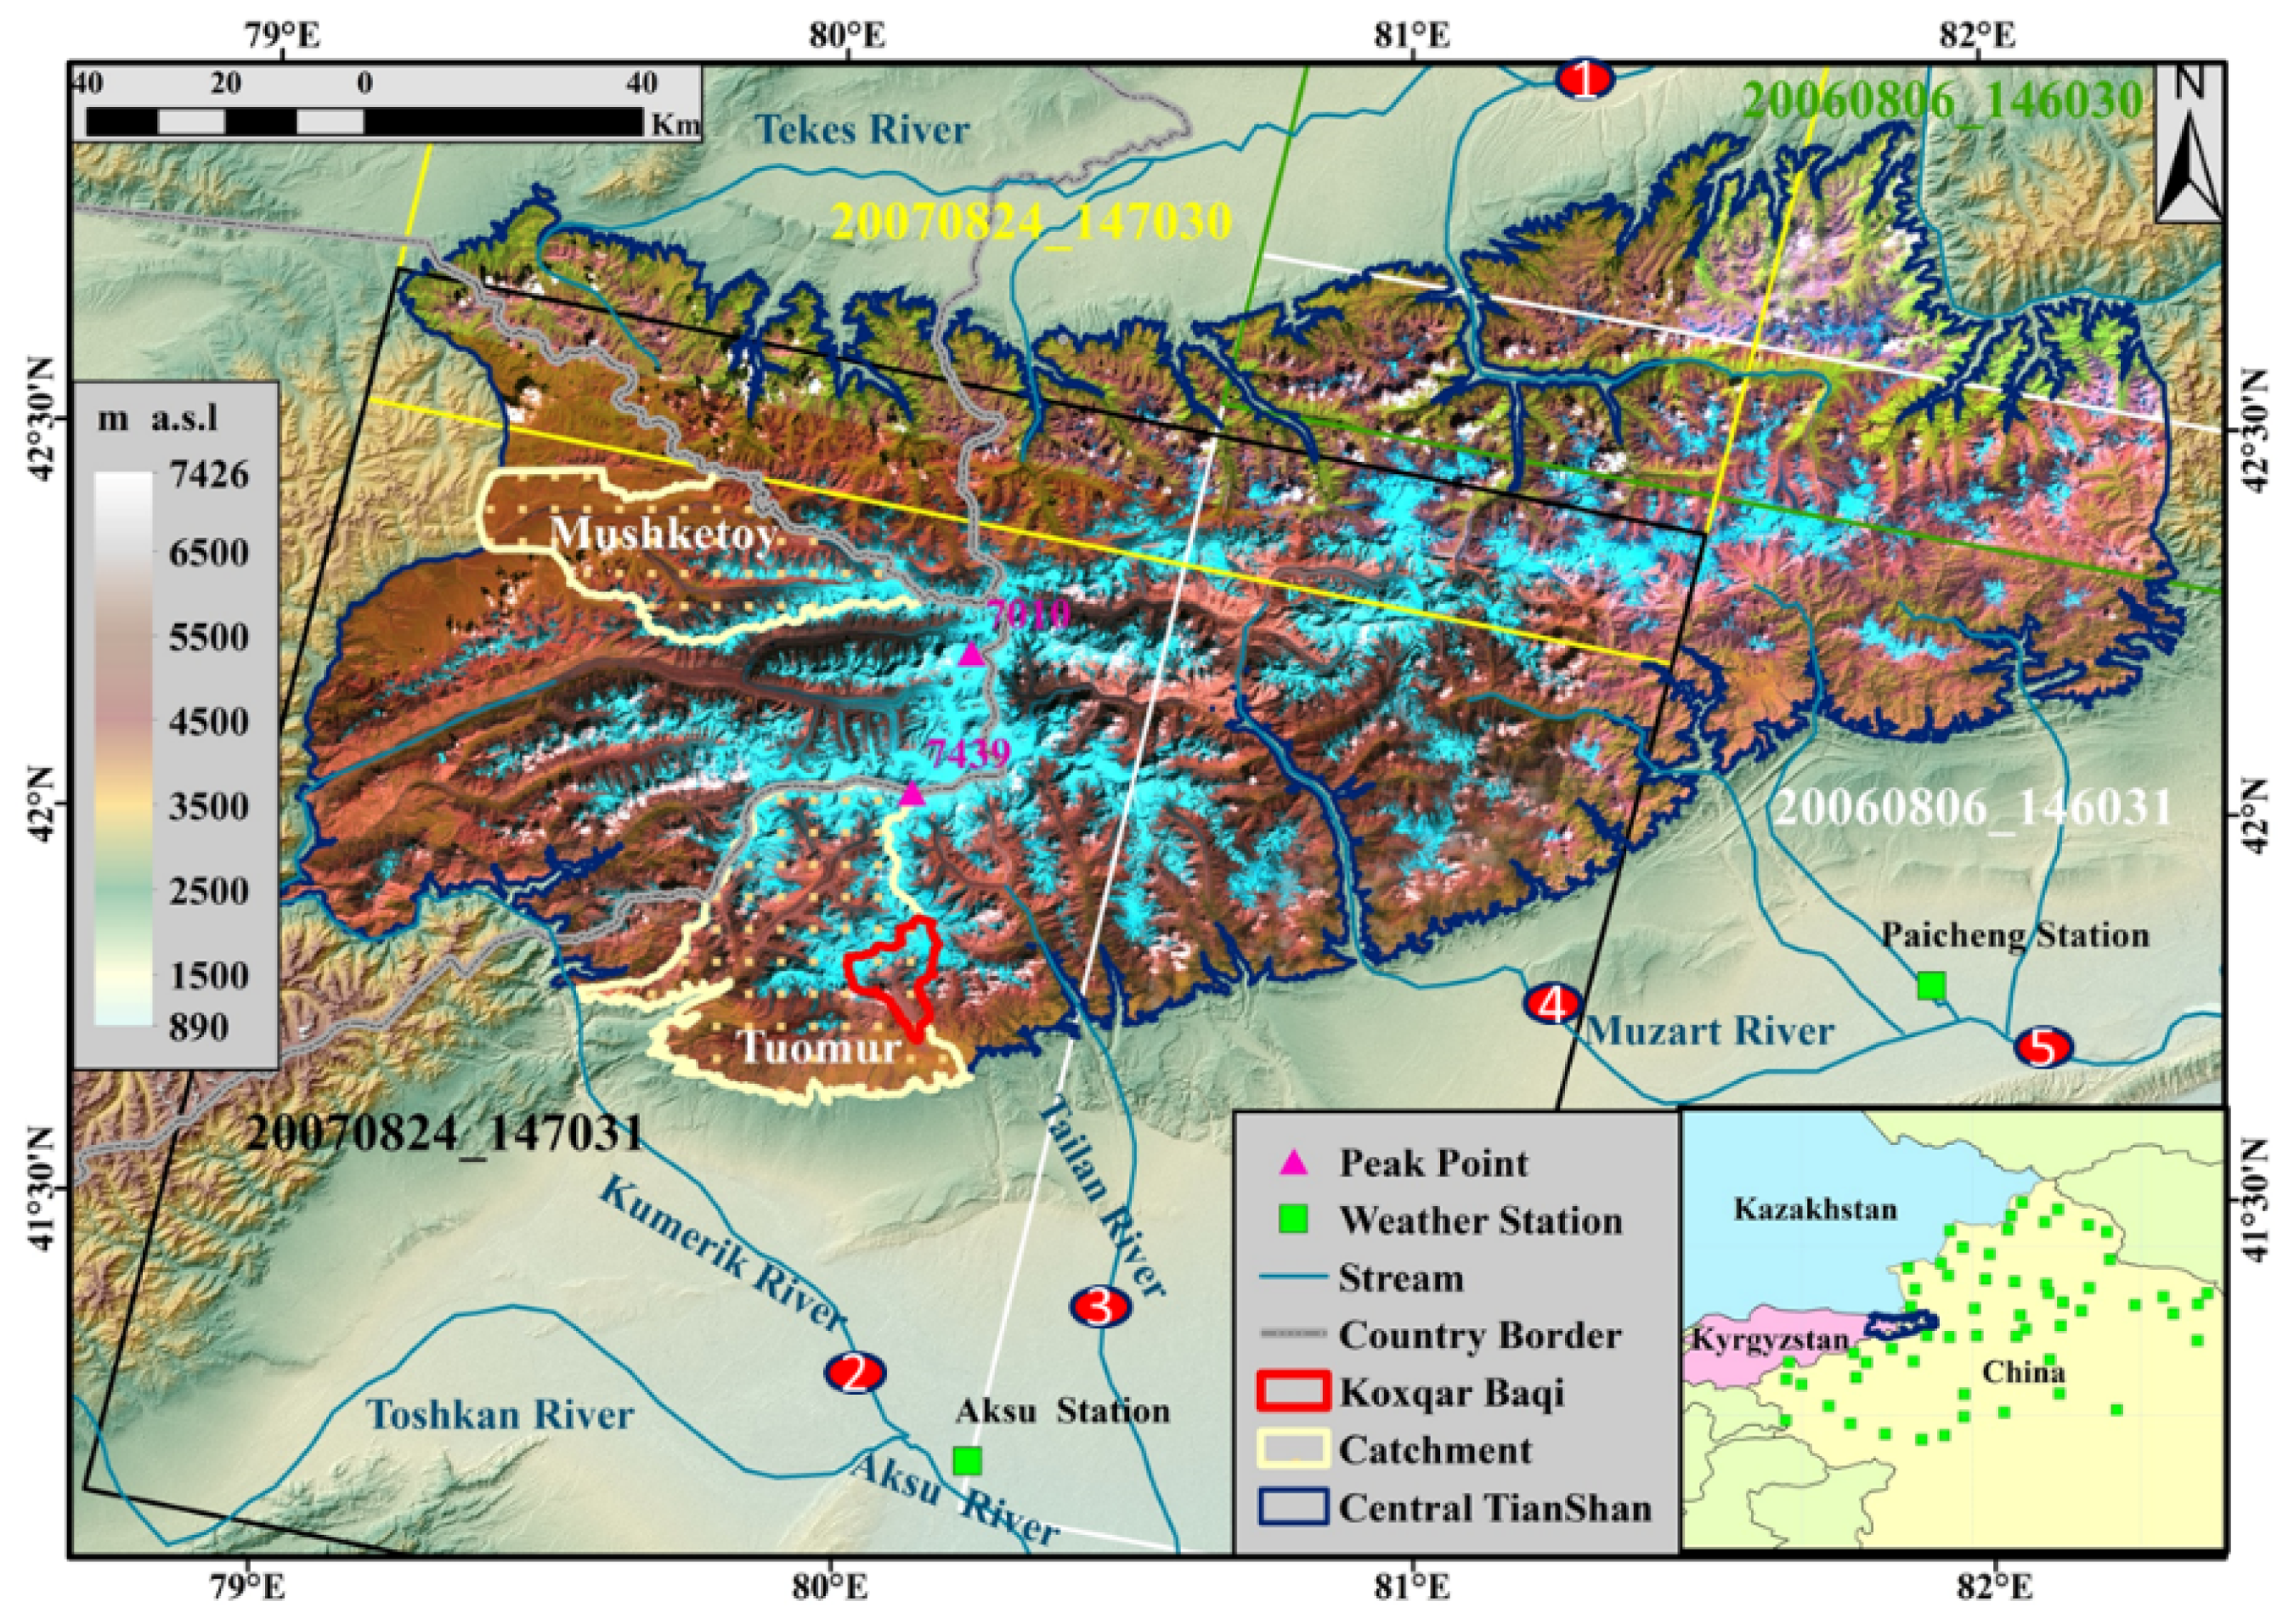


| Landsat Image Tiles (Path/Row) | 146/030 | 146/031 | 147/030 | 147/031 | |
|---|---|---|---|---|---|
| Glacier 2D areas in 2007 (km²) | 60 | 498 | 126 | 4016 | |
| Percentage to total glaciers | 1.3% | 10.6% | 3.1% | 85.1% | |
| Acquiring year and dates of Landsat images | 1989 | 1990/8/2 | 1990/8/2 | 1989/8/22 | 1989/8/22 |
| 2002 | 2000/8/5 | 2000/8/5 | 2002/8/18 | 2002/8/18 | |
| 2007 | 2006/8/6 | 2006/8/6 | 2007/8/24 | 2007/8/24 | |
| 2015 | 2013/8/1 | 2013/8/1 | 2016/9/1 | 2015/8/14 | |
| Short Name | Full Name | Image Time | Agency/Source | Resolution (m) | Area(km²) |
|---|---|---|---|---|---|
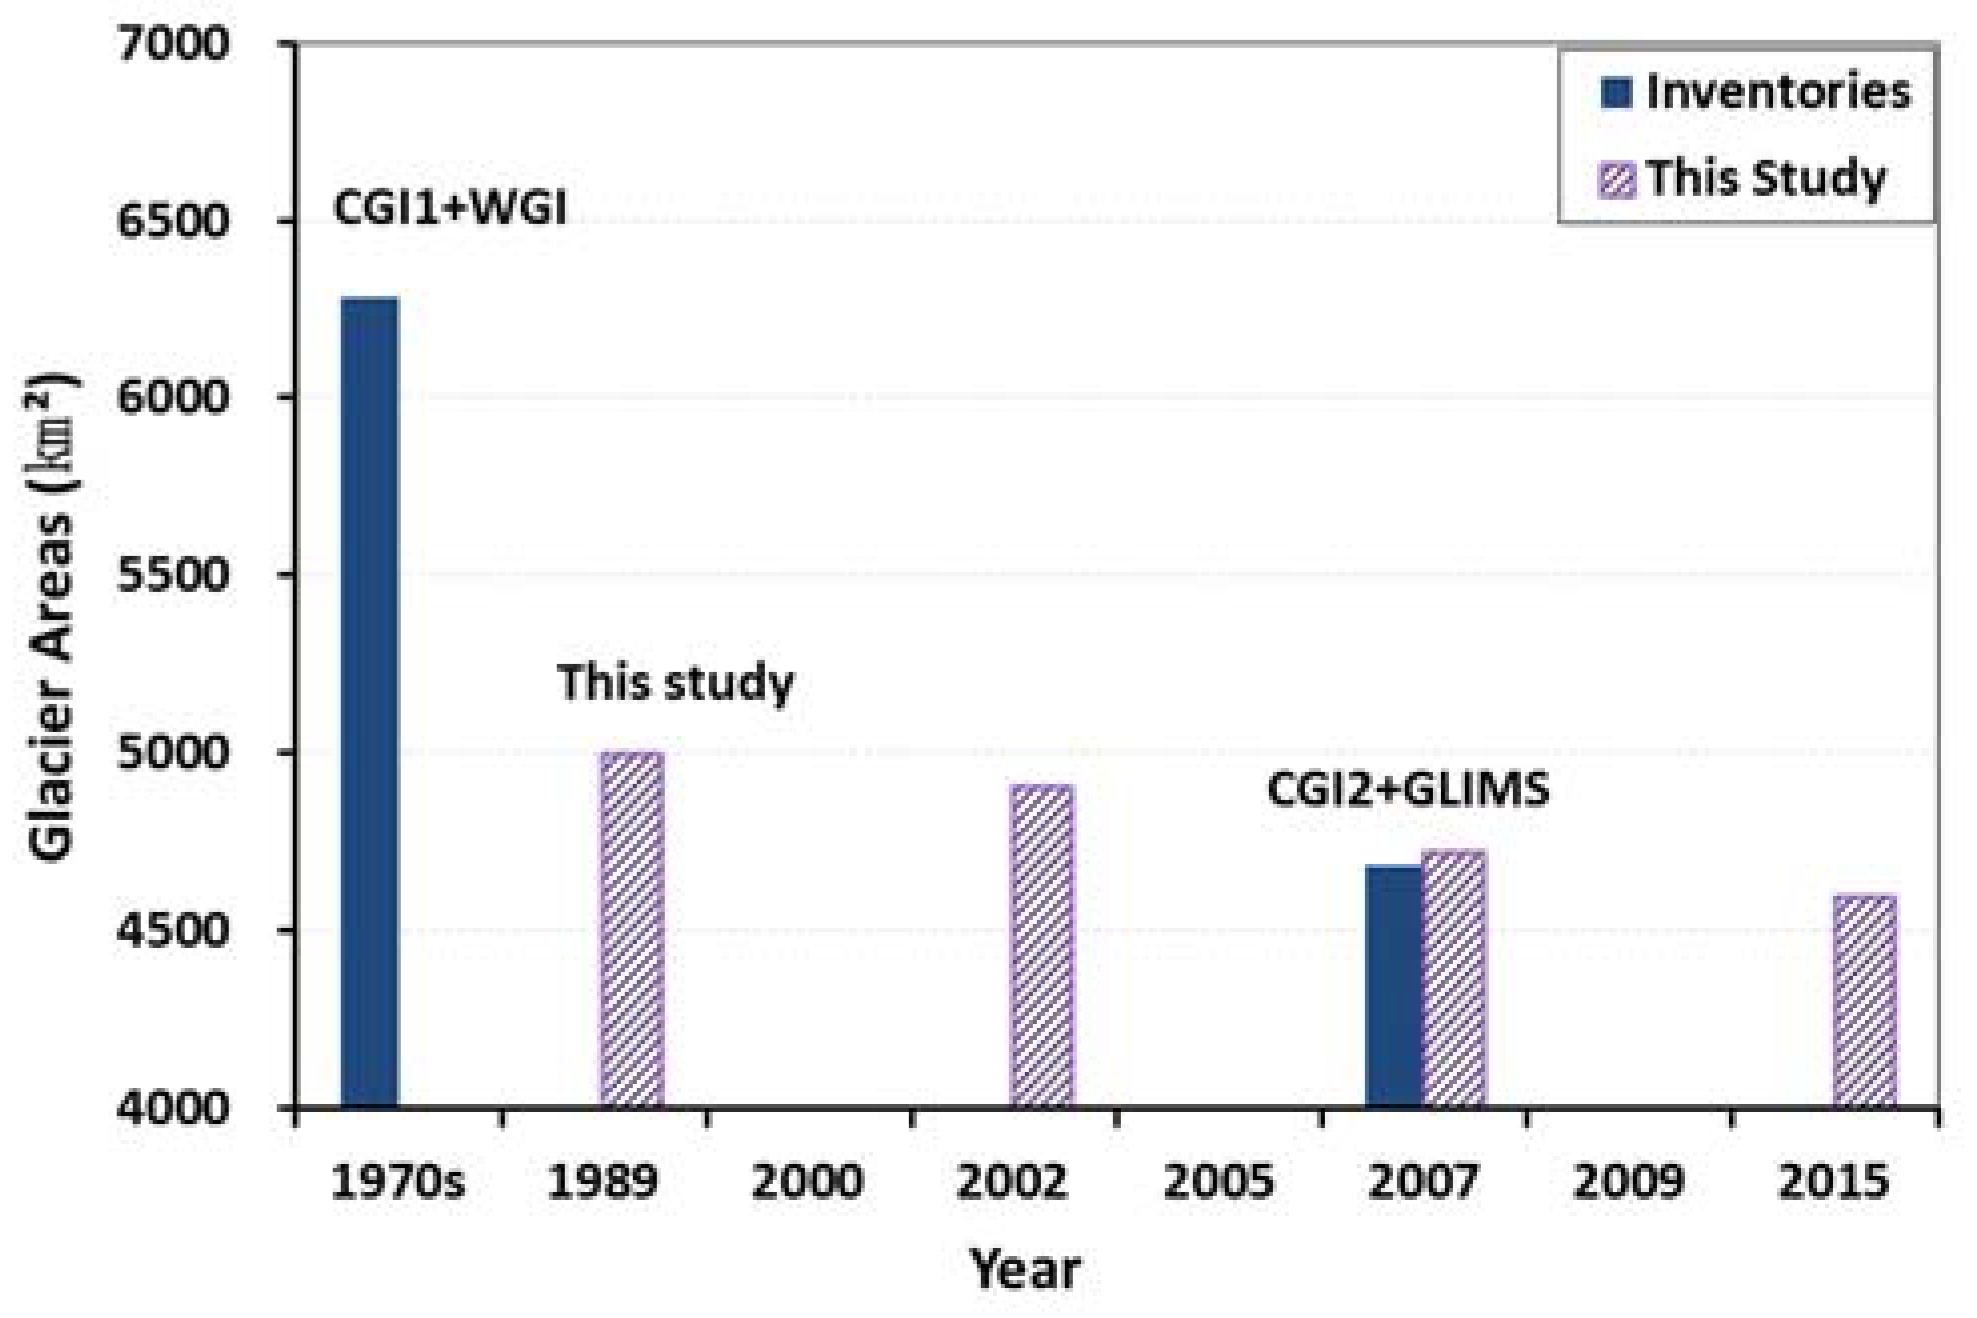
| CGI1 +WGI | World Glacier Inventory | 1950–1980s | USGS/China Aerial photos | - | 7233 |
| CGI2 | The 2nd Chinese Glacier Inventory | 2007 | WDCGG, China, Landsat images | 30 | 5415 * |
| GLIMS | GLIMS Inventory | 2002–2007 | GLIMS, ASTER, Landsat images | 30 | 5415 * |
| Reference | GeoEye01 on 29 July 2013 (km2) | CGI2 from Landsat on 24 Augst 2007 (km2) | |||
|---|---|---|---|---|---|
| Glacier | Non-Glacier | Glacier | Non-Glacier | ||
| 54.4 | 56.3 | 67.4 | 43.3 | ||
| Landsat on 31 July 2013 | Glacier | 49.4 | 9.4 | 56.6 | 2.2 |
| 90.8% | 16.7% | 84.0% | 5.1% | ||
| Non-glacier | 5.0 | 46.9 | 10.8 | 41.1 | |
| 9.2% | 83.3% | 16.0% | 94.9% | ||
| Glacier Catchments | Sources | All (km2) Glaciers | Clean Ice (km2) | Intersection (km2) | Intersection Agreement | Total Area Agreement |
|---|---|---|---|---|---|---|
| Mushketoy (Hanging glaciers) | GLIMS in 2002 | 236 | 213 | 208 | 97.7% | 104.2% |
| This study in 2002 | n/a | 222 | ||||
| Tuomuer (Valley glaciers) | CGI2 in 2007 | 613 | 497 | 464 | 93.4% | 98.8% |
| This study in 2007 | n/a | 491 | ||||
| Central Tianshan | GLIMS + CGI2 in 2002/2007 | 5415 | 4686 | 4151 | 88.6% | 100.7% |
| This study in 2007 | n/a | 4720 |
| Glaciers | Central Tianshan (km2) | |||
|---|---|---|---|---|
| 2D Area (km2) | 3D Area (km2) | Relative Difference (RD) (3D-2D)/2D | ||
| WGI+CGI1 (all) in 1970s | 7233 | n/a | n/a | |
| GLIMS+CGI2 (all) in 2002/2007 | 5415 | 6862 | 26.7% | |
| GLIMS+CGI2 (clean ice) | 4686 | n.a. | n.a. | |
| Differencece (CGI2-CGI1) | −1818 | |||
| RD: (CGI2-CGI1)/CGI1 | −25.1% | |||
| This study | 1989 | 4997 | 6497 | 30.0% |
| 2002 | 4906 | 6395 | 30.4% | |
| RD: (2002–1989)/1989 | −1.8% | −1.6% | ||
| 2007 | 4720 | 6149 | 30.3% | |
| RD: (2007–2002)/2002 | −3.8% | −3.8% | ||
| 2015 | 4593 | 5982 | 30.2% | |
| RD: (2007–2015)/2015 | −2.7% | −2.7% | ||
| Difference (2015–1989) RD: (2015–1989)/1989 | −404 | −516 | 27.6% | |
| −8.1% | −7.9% | |||
| Methods | Polygon 2D Areas (km2) | Raster 2D Areas (km2) | Area Loss | 3D Area (km2) | (3D-2D)/2D |
|---|---|---|---|---|---|
| Raster Surface | 4593 | 4341 | −5.5% | 5630 | 29.7%, * 22.6% |
| Polygon Surface | 4593 | n.a. | n.a. | 5982 | 30.3% |
| (Raster-Polygon)/Polygon | −5.9% | ||||
| Catchment Name | Tekes | Kumerik | Tailan | Muzart | Karasu | Total/Mean |
|---|---|---|---|---|---|---|
| TS 2D area (km2) | 8142 | 6336 | 1602 | 2552 | 3703 | 22,336 |
| TS 3D area (km2) | 9851 | 7798 | 2056 | 3462 | 4695 | 27,862 |
| TS land slope (degree) | 27.9 | 26.6 | 30.6 | 32.6 | 31.3 | 28.78 |
| TS glacier slope (degree) | 26.0 | 28.6 | 31.5 | 31.3 | 27.2 | 28.82 |
| TS land 3D/2D | 1.21 | 1.23 | 1.28 | 1.36 | 1.27 | 1.25 |
| TS glacier 3D/2D | 1.23 | 1.30 | 1.34 | 1.39 | 1.25 | 1.30 |
| Gla 2D area 1989 (km2) | 1214 | 1883 | 465 | 1035 | 400 | 4997 |
| Gla 2D area 2015 (km2) | 1007 | 1832 | 456 | 954 | 343 | 4593 |
| Gla 3D area 1989 (km2) | 1492 | 2444 | 623 | 1435 | 503 | 6497 |
| Gla 3D area 2015 (km2) | 1234 | 2382 | 612 | 1326 | 427 | 5982 |
| Gla 2D fraction 2015 | 12.4% | 28.9% | 28.5% | 37.4% | 9.3% | 20.6% |
| Gla 3D fraction 2015 | 12.5% | 30.5% | 29.8% | 38.3% | 9.1% | 21.5% |
| 2D(2015–1989)/1989 | −17.0% | −2.7% | −2.0% | −7.7% | −14.2% | −8.1% |
| 3D(2015–1989)/1989 | −17.3% | −2.5% | −1.7% | −7.6% | −15.1% | −7.9% |
| Glaciers/Location | Region | Period | * Area 1 (km2) | * Area 2 (km2) | Area Chg. (%) | Chg. Rate (%.a−1) | Document Source |
|---|---|---|---|---|---|---|---|
| Jinghe River Basin | Eastern TS | 1964–2004 | 91.3 | 77.4 | −15.2 | −0.38 | Wang et al., 2014 |
| Urumqi River No.1 | Eastern TS | 1964–2005 | 48.7 | 32.1 | −34.1 | −0.83 | Li et al., 2010 |
| Mt. Karlik | Eastern TS | 1977–2013 | 136.8 | 106.8 | −21.9 | −0.61 | Du et al., 2014 |
| Mt. Karlik | Eastern TS | 2007–2013 | 118.6 | 106.8 | −9.9 | −1.66 | Du et al., 2014 |
| Karatal River Basin | Northern TS | 1989–2012 | 142.8 | 109.3 | −23.5 | −1.02 | Kaldybayev et al., 2016 |
| Ili-Kungoy | Northern TS | 1970–2007 | 672.2 | 564.2 | −16.1 | −0.43 | Narama et al., 2010 |
| Kungey Alatau | Northern TS | 1955–1999 | 243.5 | 165.4 | −32.1 | −0.73 | Bolch, 2007 |
| At-Bashy region | Western TS | 1970–2007 | 113.6 | 95.7 | −15.8 | −0.43 | Narama et al., 2010 |
| Ak-Shirak glacier | Central TS, W | 2003–2013 | 373.2 | 351.2 | −5.9 | −0.59 | Petrakov et al., 2016 |
| Ak-shirak glacier | Central TS, W | 1944–2003 | 424.7 | 371.6 | −12.5 | −0.20 | Aizen et al., 2007b |
| Ak-Shirak glacier | Central TS, W | 1975–2008 | 381.0 | 348 | −8.7 | −0.26 | Pieczonka et al., 2015 |
| E. Terskey Ala-Too | Central TS, W | 1990–2003 | 341.7 | 328 | −4.0 | −0.31 | Kutuzov & Shahgedanova, 2009 |
| S. Muzart Glacier | Central TS, S | 2007–2013 | 1036 | 953 | −8.0 | −1.14 | Wang et al., 2017 |
| S. Muzart Glacier | Central TS, S | 1989–2015 | 1035 | 954 | −7.7 | −0.30 | This study |
| Qinbingtan No. 72 | Central TS | 1964–2008 | 7.27 | 5.62 | −22.7 | −0.52 | Li et al., 2010 |
| Qinbingtan No. 74 | Central TS, SW | 2002–2010 | 6.2 | 6.6 | 6.5 | 0.81 | Pieczonka et al., 2013 |
| Tekes River Basin | Central TS, N | 1970s–2007 | 1511 | 1179 | −22.0 | −0.59 | Xu et al., 2015 |
| Tekes River Basin | Central TS, N | 1989–2015 | 1214 | 1007 | −17.0 | −0.66 | This study |
| Ili River Basin | Central TS | 1970s–2007 | n.a. | n.a. | −15.5 | −0.42 | Wang et al., 2011a |
| Inylchek Glacier | Central TS | 1975–2007 | 665 | 666.3 | 0.2 | 0.01 | Shangguan et al., 2015 |
| Tuomuer Glacier | Central TS | 1964–2003 | 310.4 | 309.4 | −0.3 | −0.01 | Li et al., 2010 |
| Tuomuer region | Central TS | 1964–2003 | 2268 | 2067 | −8.8 | −0.23 | Li et al., 2010 |
| Aksu Catchment | Central TS | 1975–2008 | 3539 | 3410 | −3.6 | −0.11 | Pieczonka et al., 2015 |
| Kumerik/Aksu | Central TS | 1989–2015 | 1883 | 1832 | −2.7 | −0.10 | This study |
| Tianshan | TS in China | 1960–2009 | n.a. | n.a. | −11.5 | −0.23 | Wang et al., 2011a |
| Central Tianshan | Central TS | 2002–2007 | 4906 | 4720 | −3.8 | −0.76 | This study |
| Central Tianshan | Central TS | 1989–2015 | 4997 | 4593 | −8.1 | −0.31 | This study |
© 2018 by the authors. Licensee MDPI, Basel, Switzerland. This article is an open access article distributed under the terms and conditions of the Creative Commons Attribution (CC BY) license (http://creativecommons.org/licenses/by/4.0/).
Share and Cite
Wang, X.; Chen, H.; Chen, Y. Topography-Related Glacier Area Changes in Central Tianshan from 1989 to 2015 Derived from Landsat Images and ASTER GDEM Data. Water 2018, 10, 555. https://doi.org/10.3390/w10050555
Wang X, Chen H, Chen Y. Topography-Related Glacier Area Changes in Central Tianshan from 1989 to 2015 Derived from Landsat Images and ASTER GDEM Data. Water. 2018; 10(5):555. https://doi.org/10.3390/w10050555
Chicago/Turabian StyleWang, Xianwei, Huijiao Chen, and Yaning Chen. 2018. "Topography-Related Glacier Area Changes in Central Tianshan from 1989 to 2015 Derived from Landsat Images and ASTER GDEM Data" Water 10, no. 5: 555. https://doi.org/10.3390/w10050555
APA StyleWang, X., Chen, H., & Chen, Y. (2018). Topography-Related Glacier Area Changes in Central Tianshan from 1989 to 2015 Derived from Landsat Images and ASTER GDEM Data. Water, 10(5), 555. https://doi.org/10.3390/w10050555


