Transformation between Phreatic Water and Soil Water during Freeze–Thaw Periods

 ,
, 
Abstract
1. Introduction
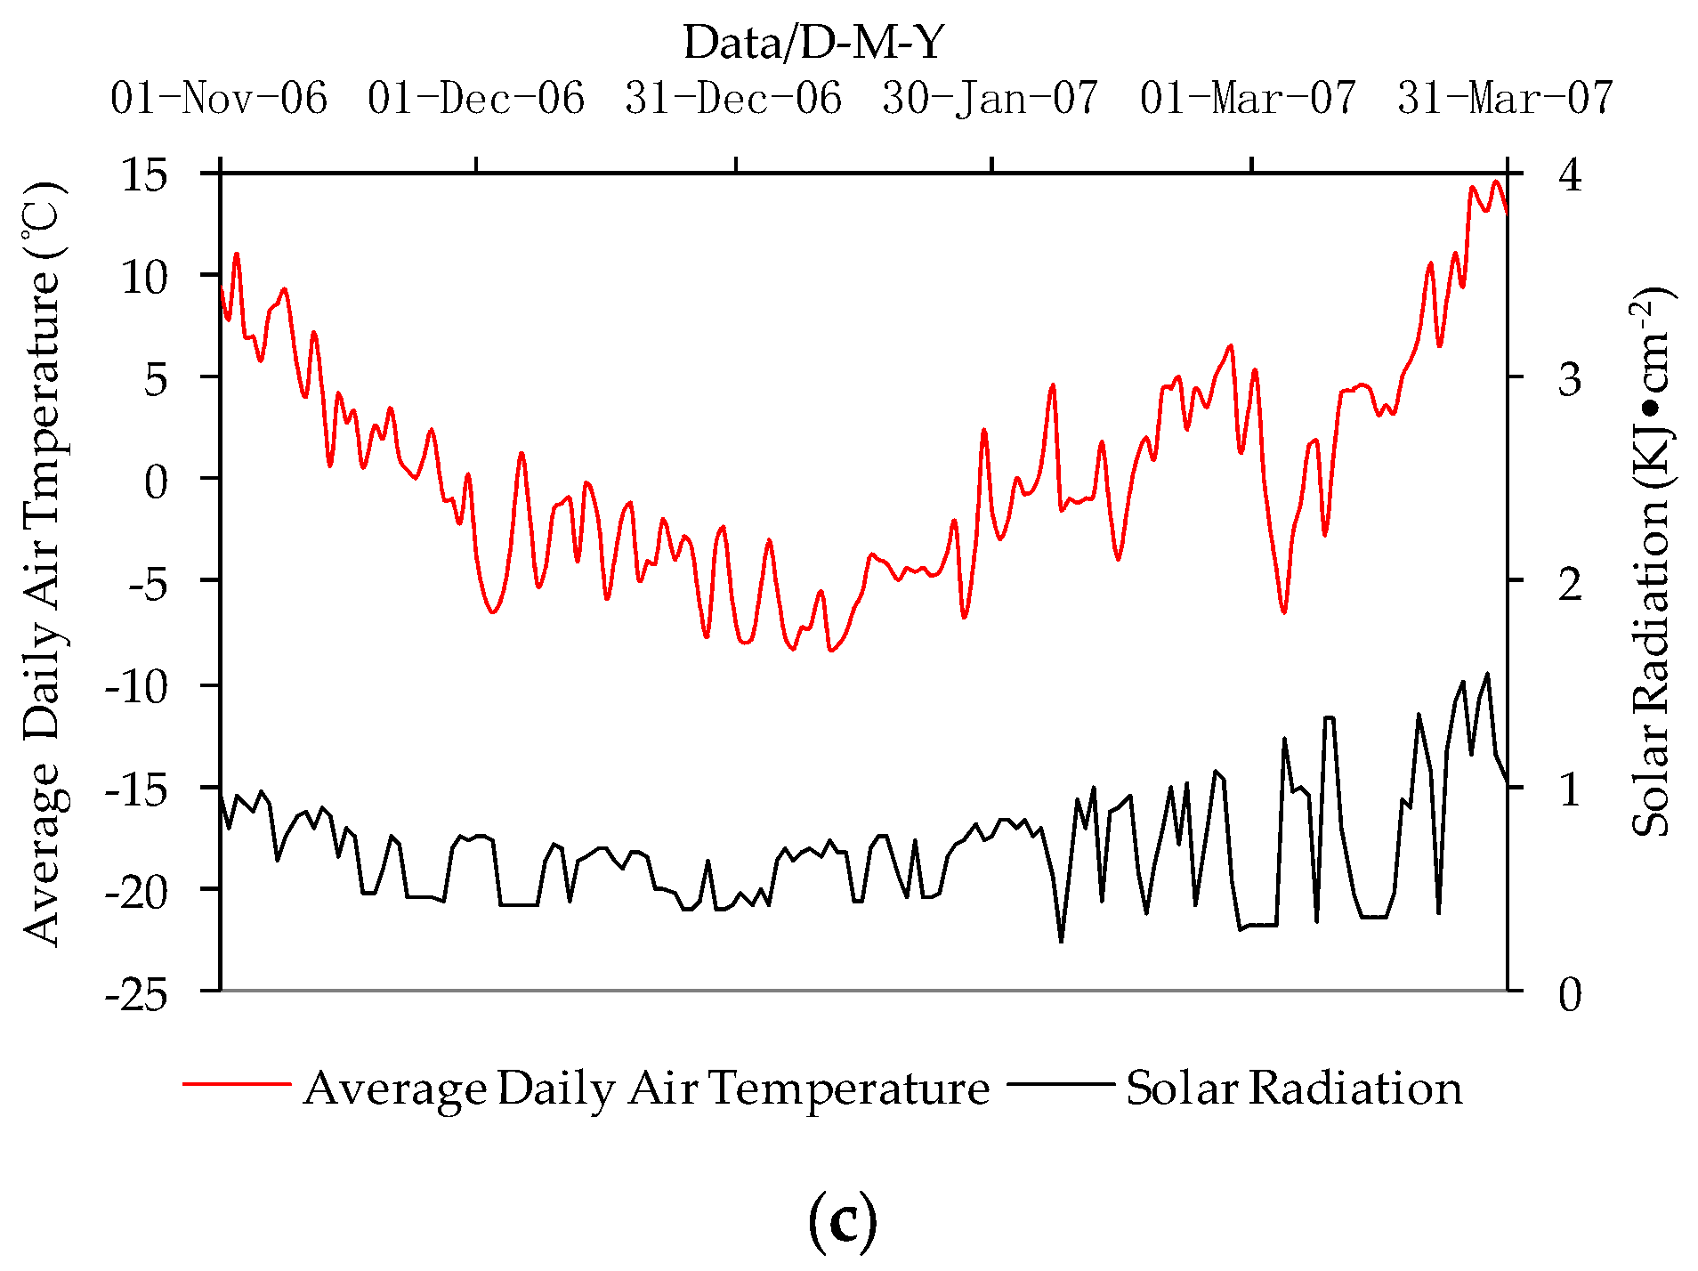
2. Test Conditions and Methods
3. Results and Discussion
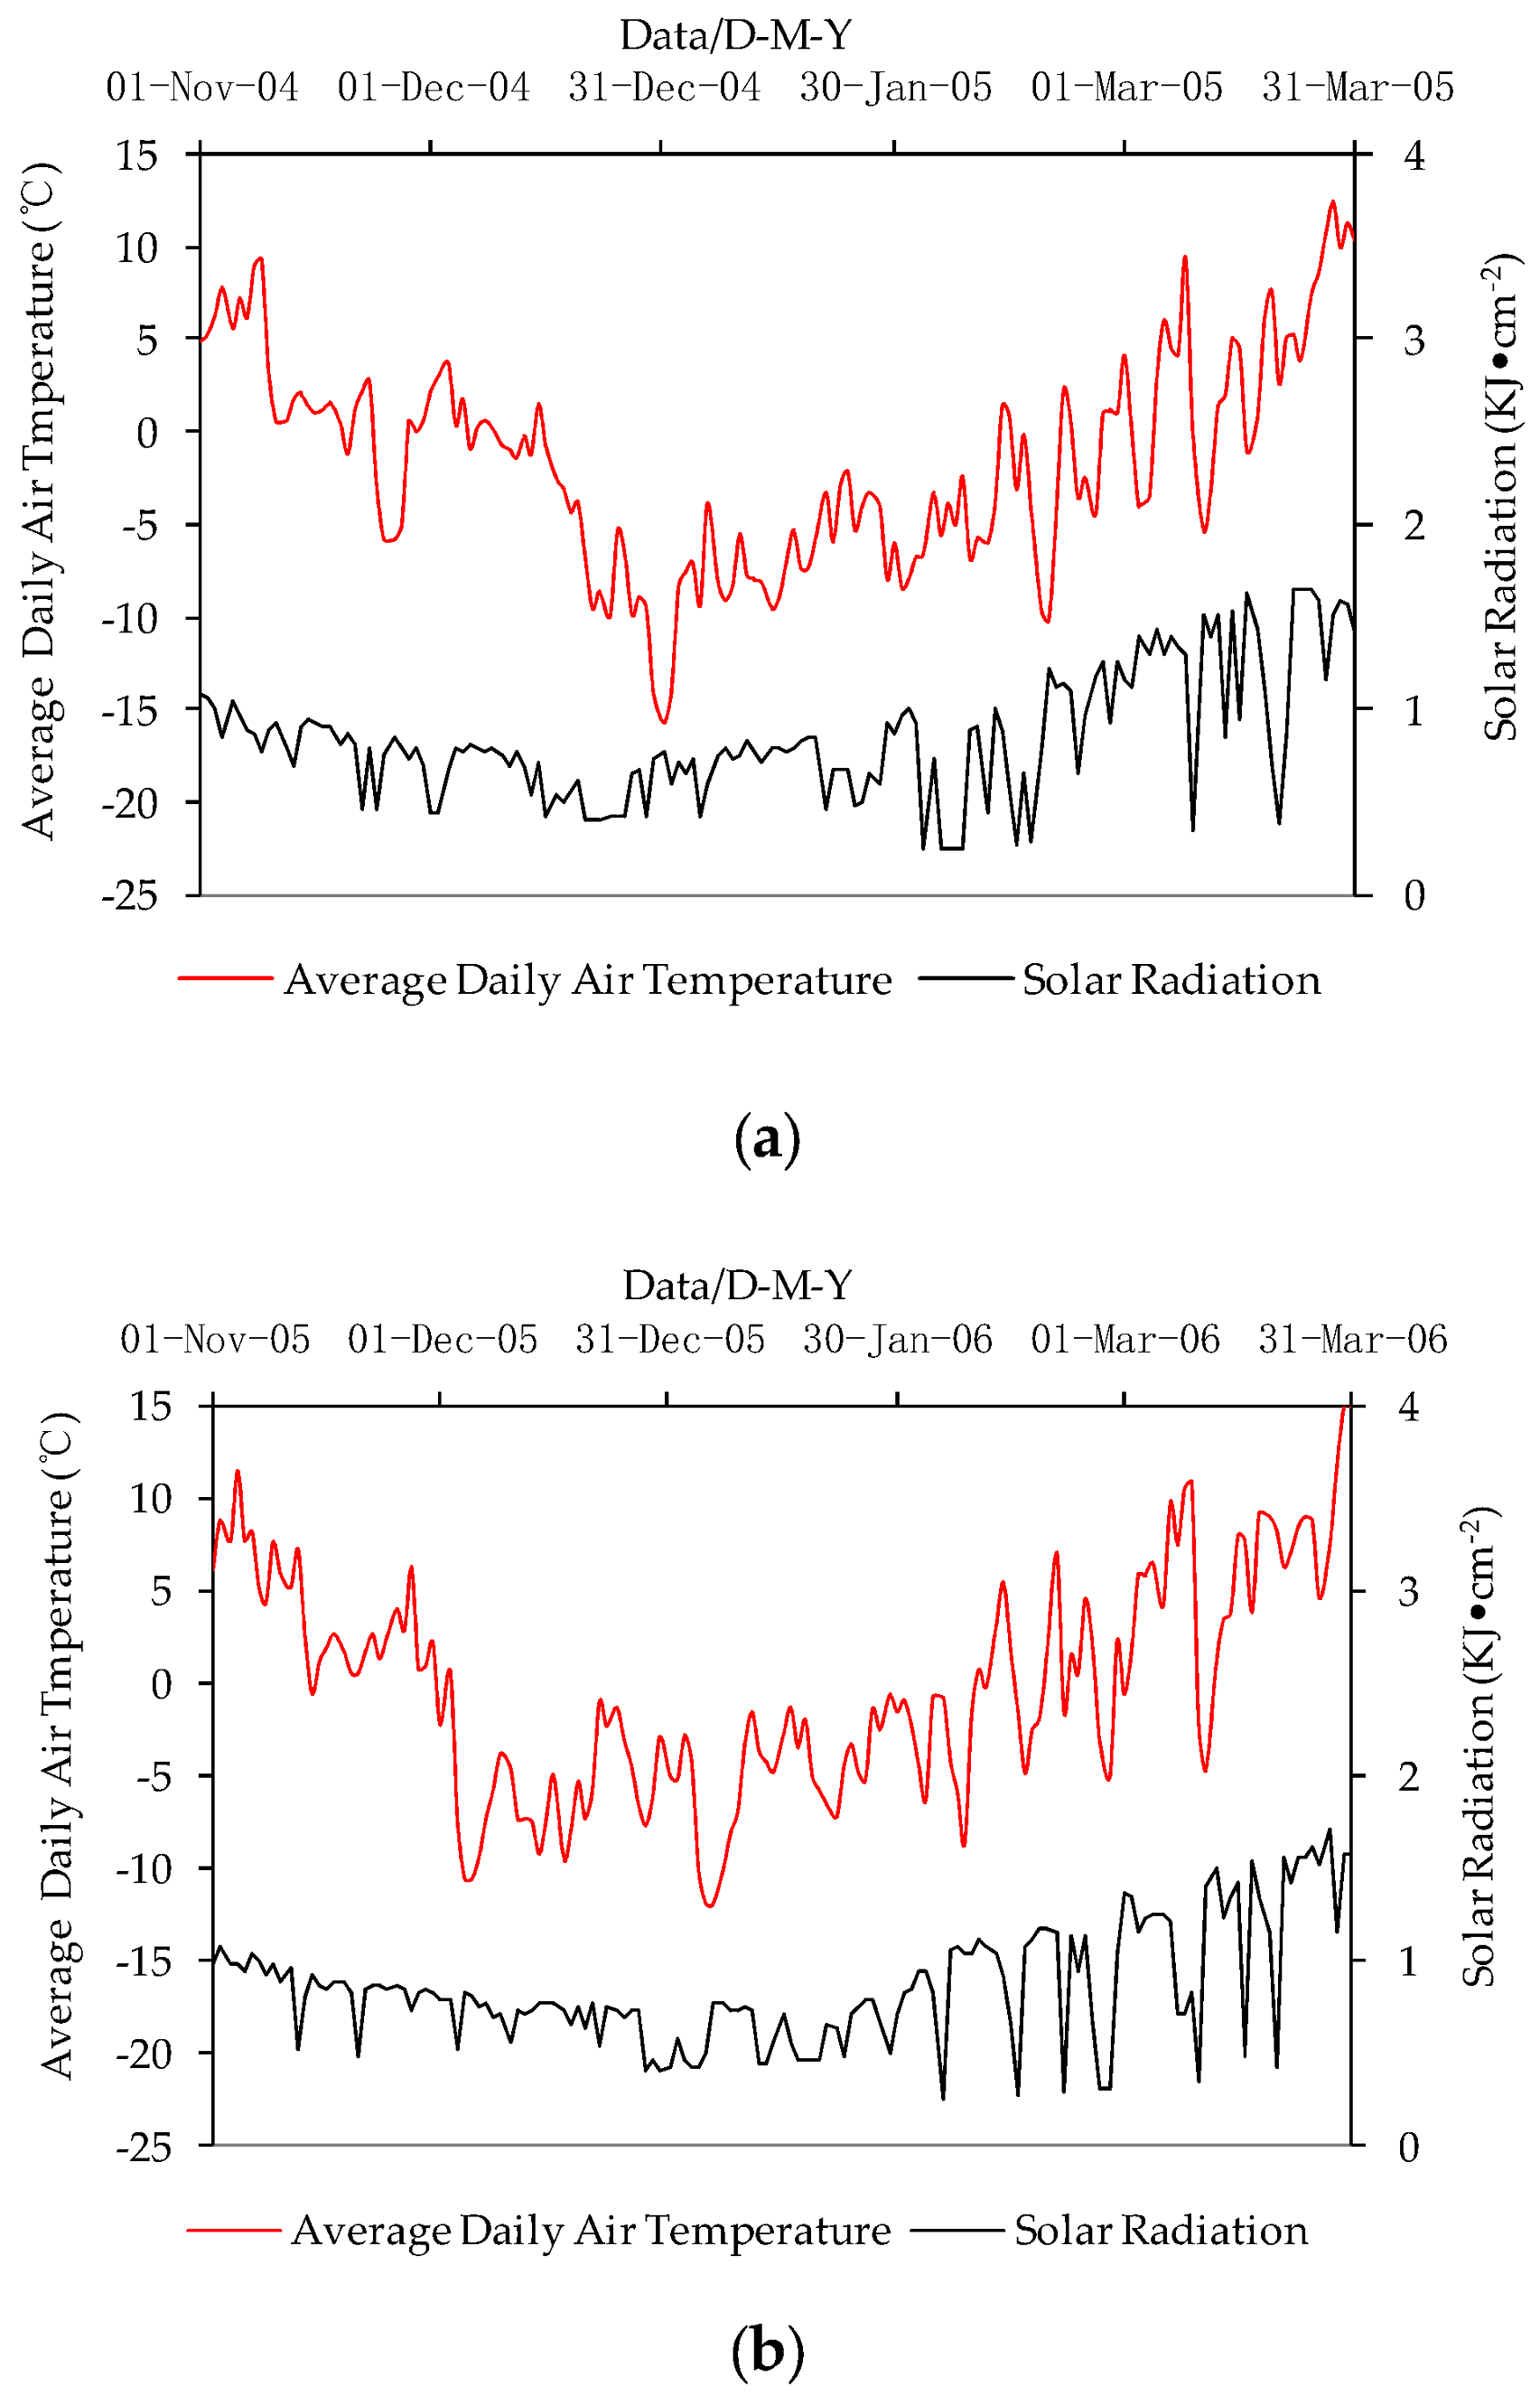
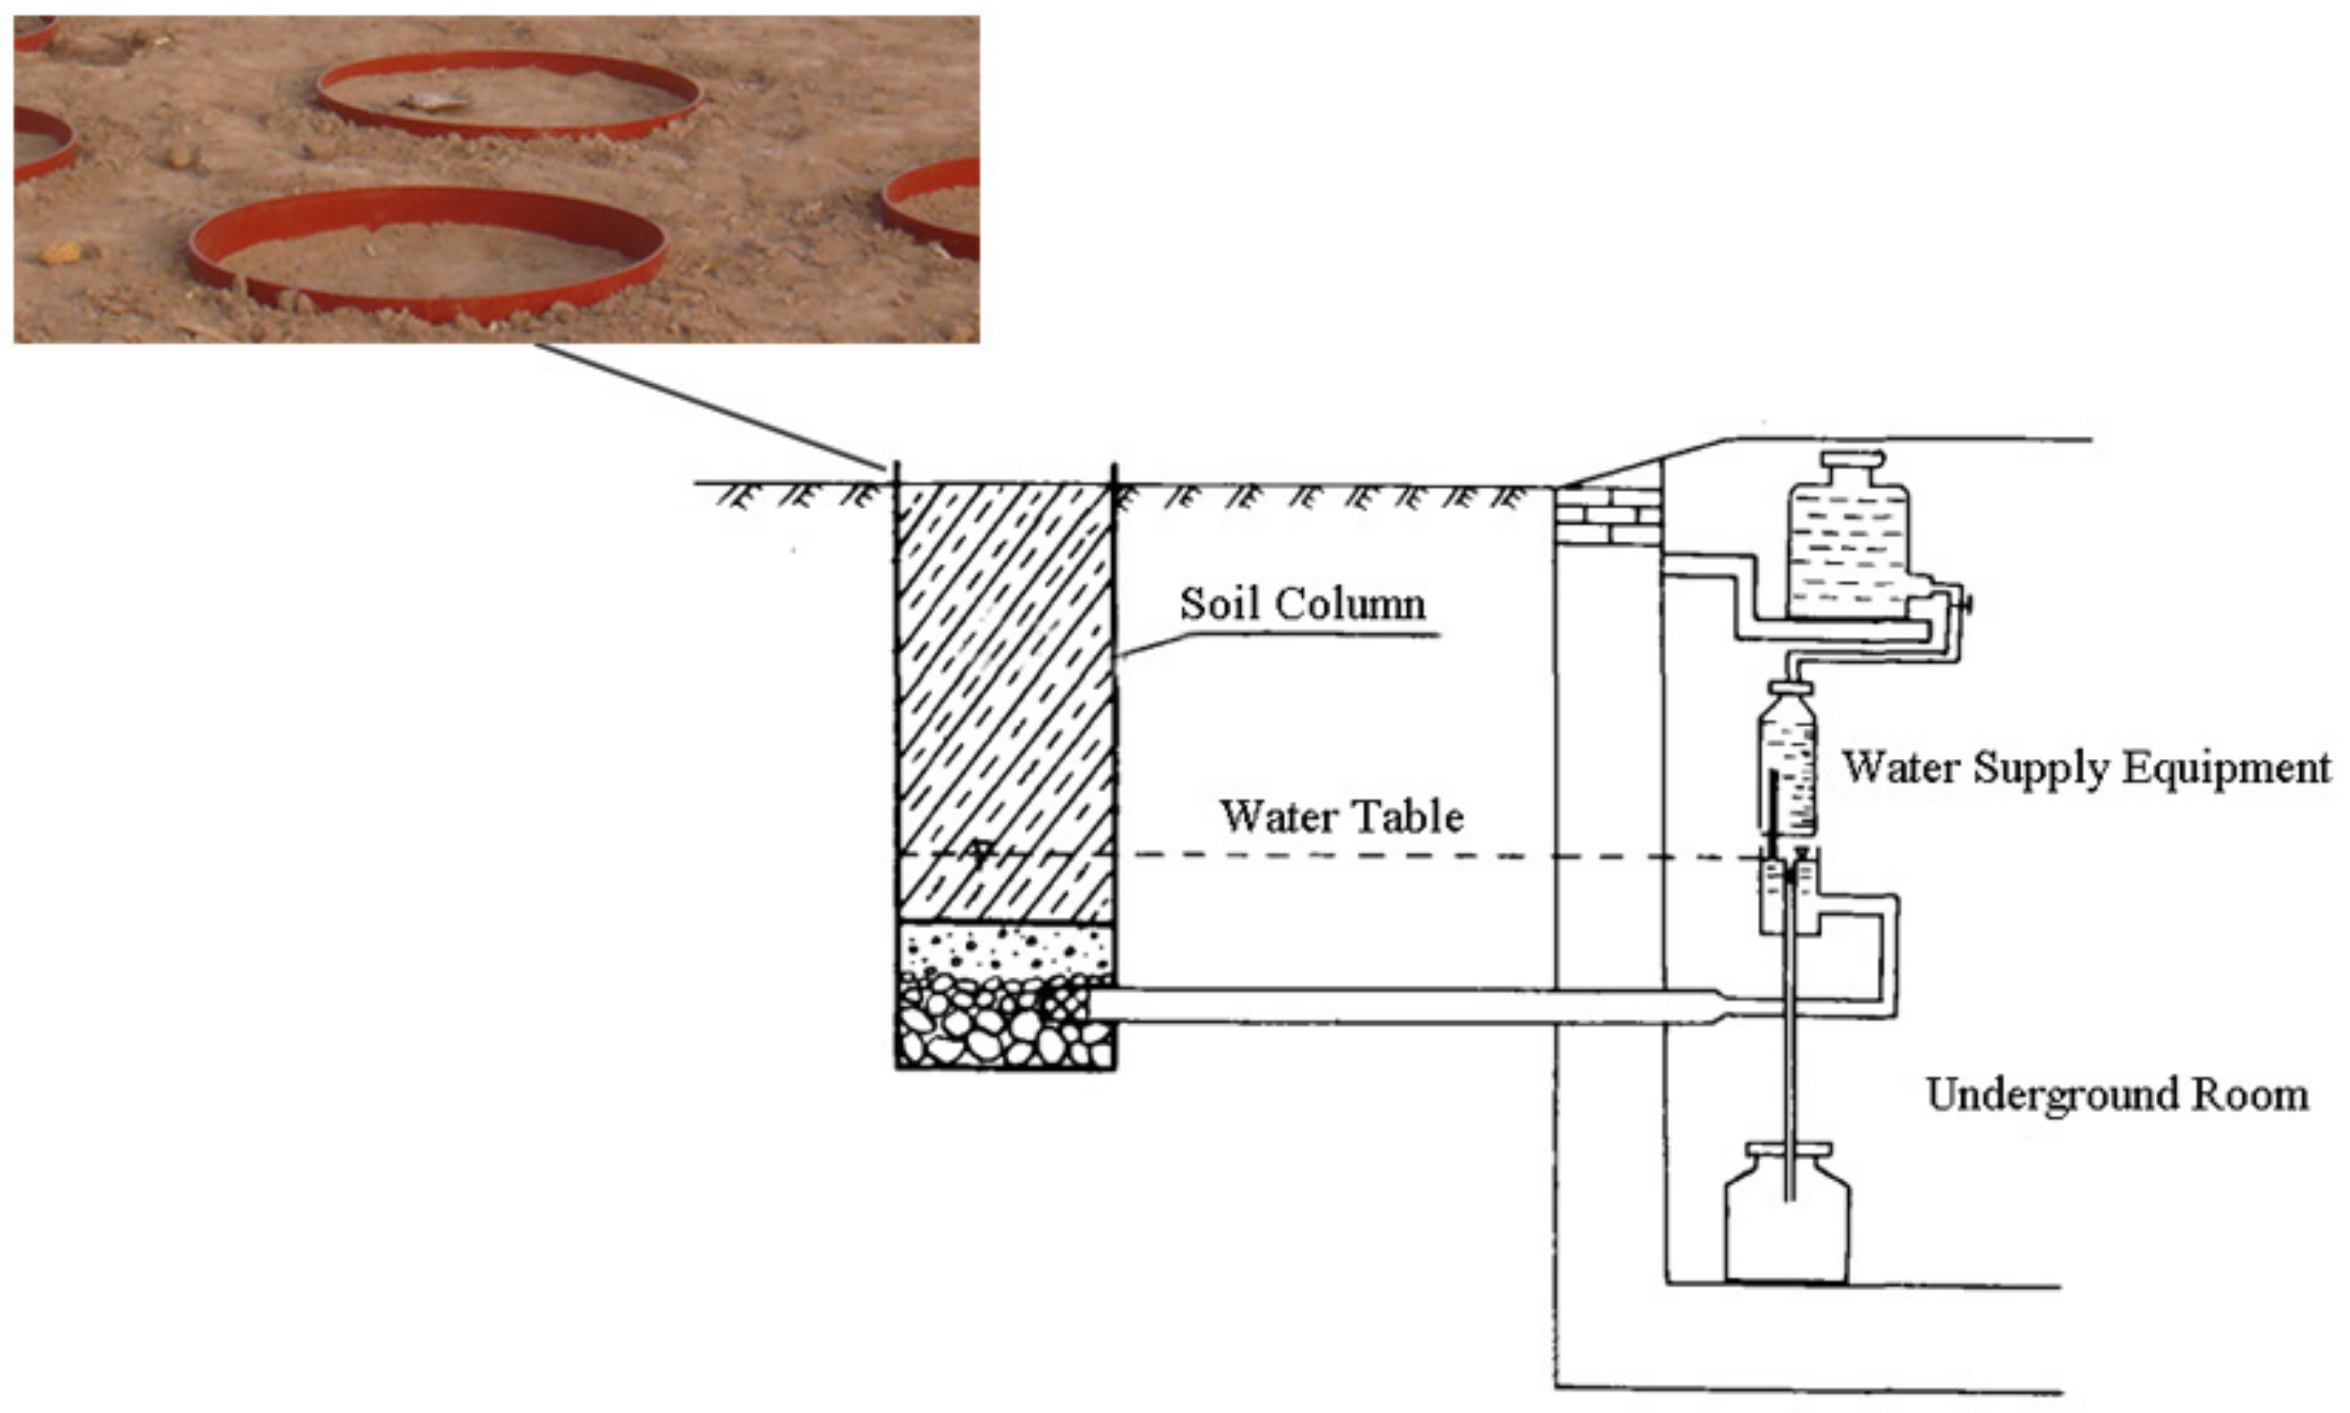
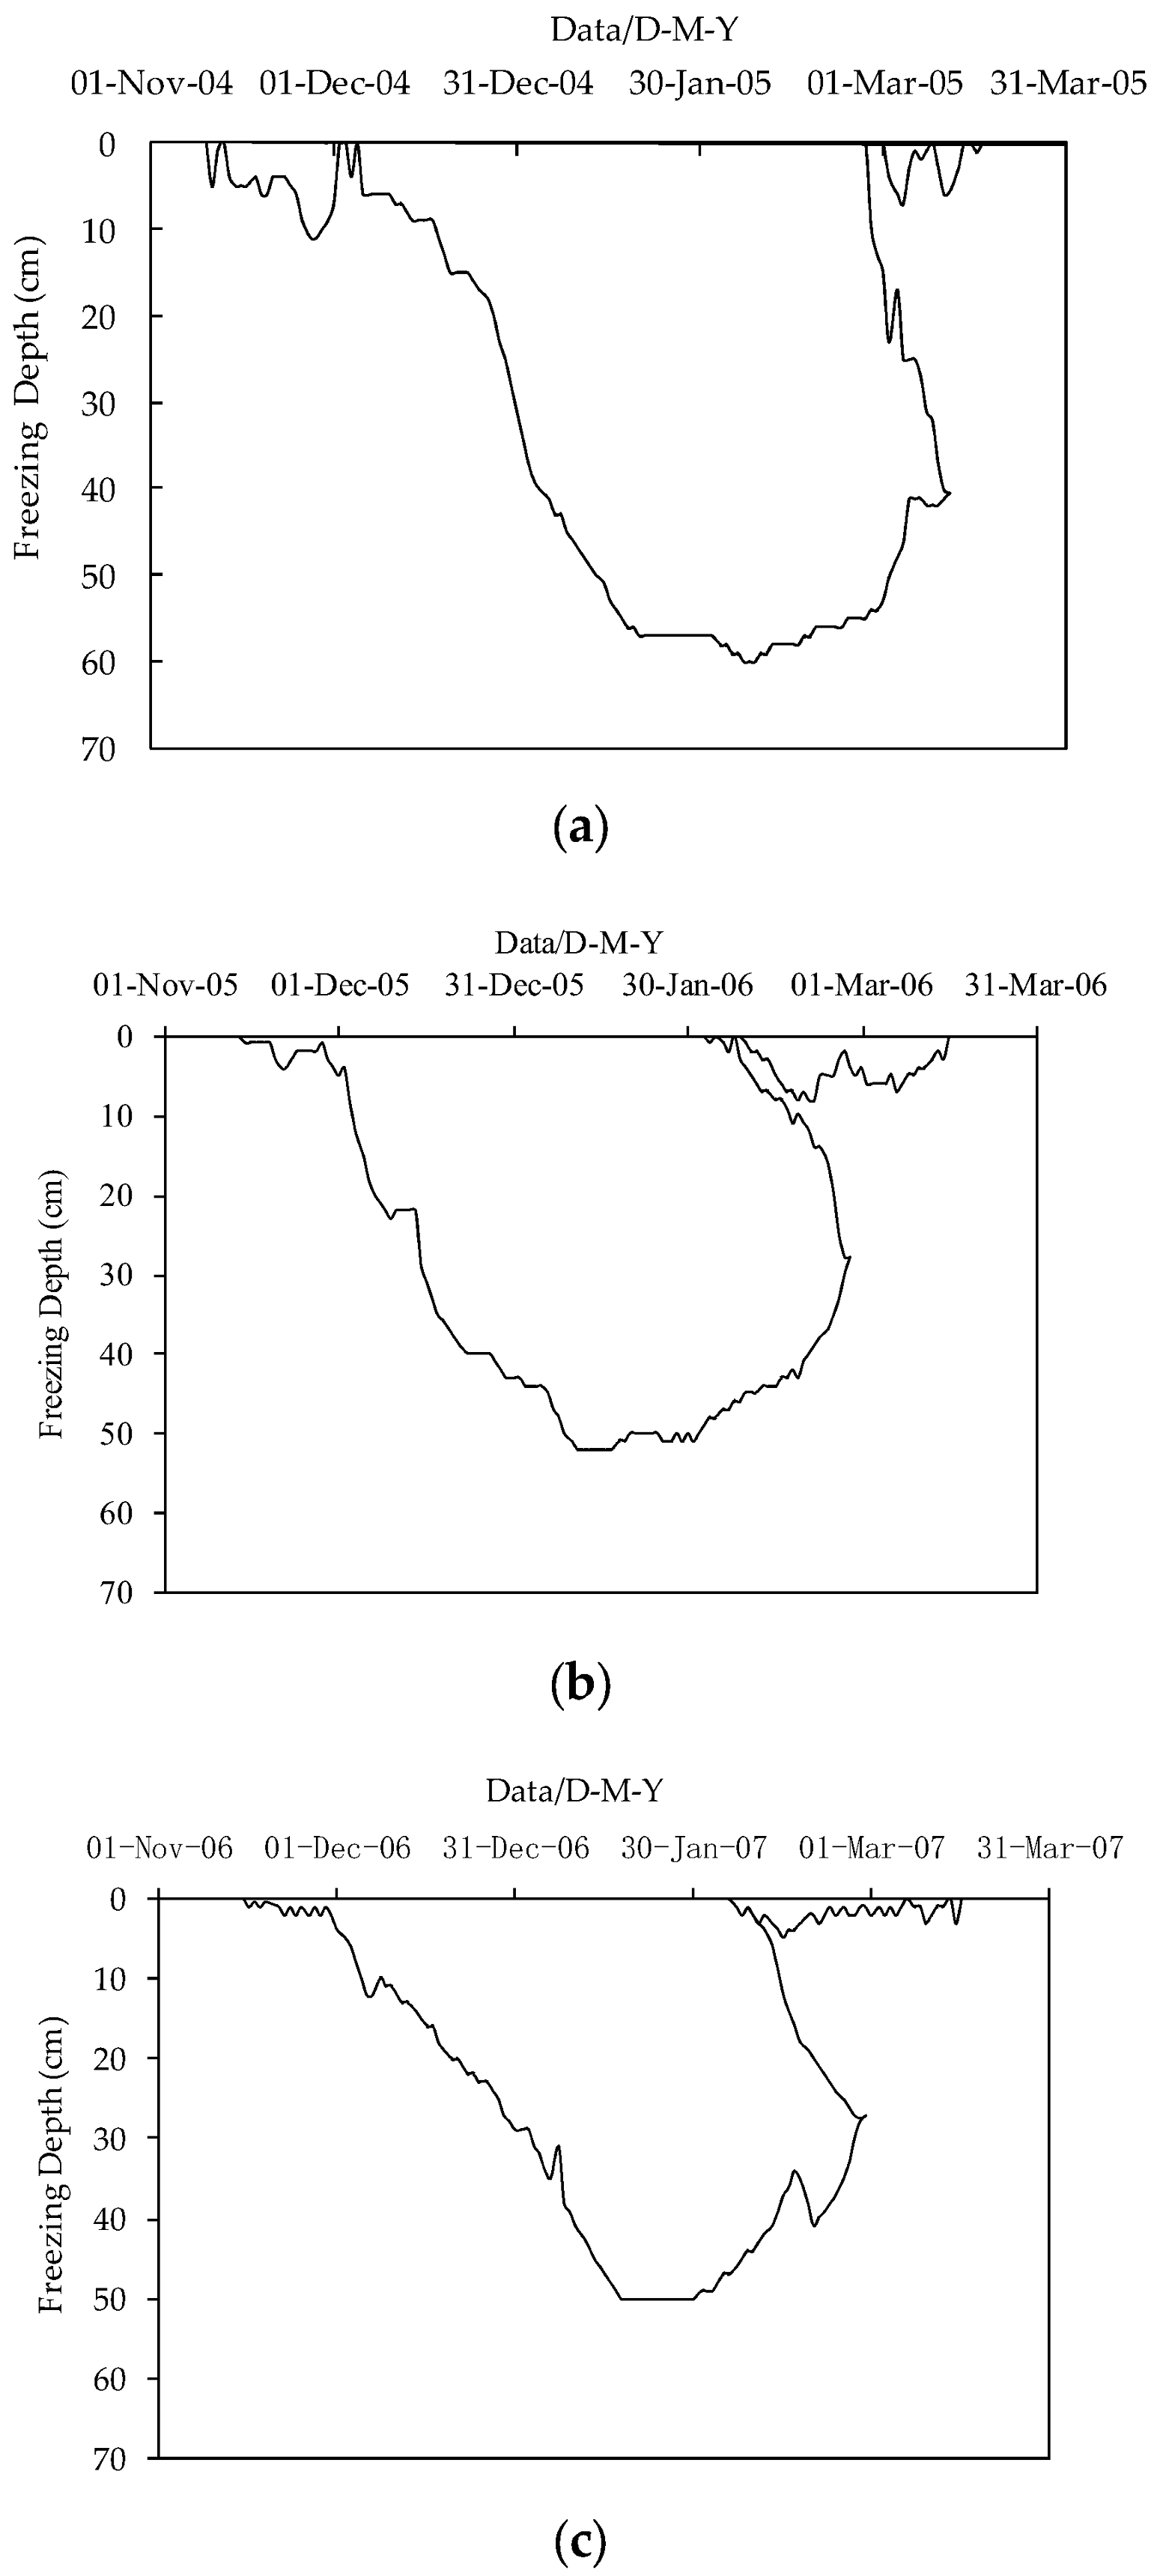
3.1. The Soil Freezing and Thawing Process at the Experimental Station
3.2. Phreatic Evaporation
3.3. Transformation of Soil Water to Groundwater
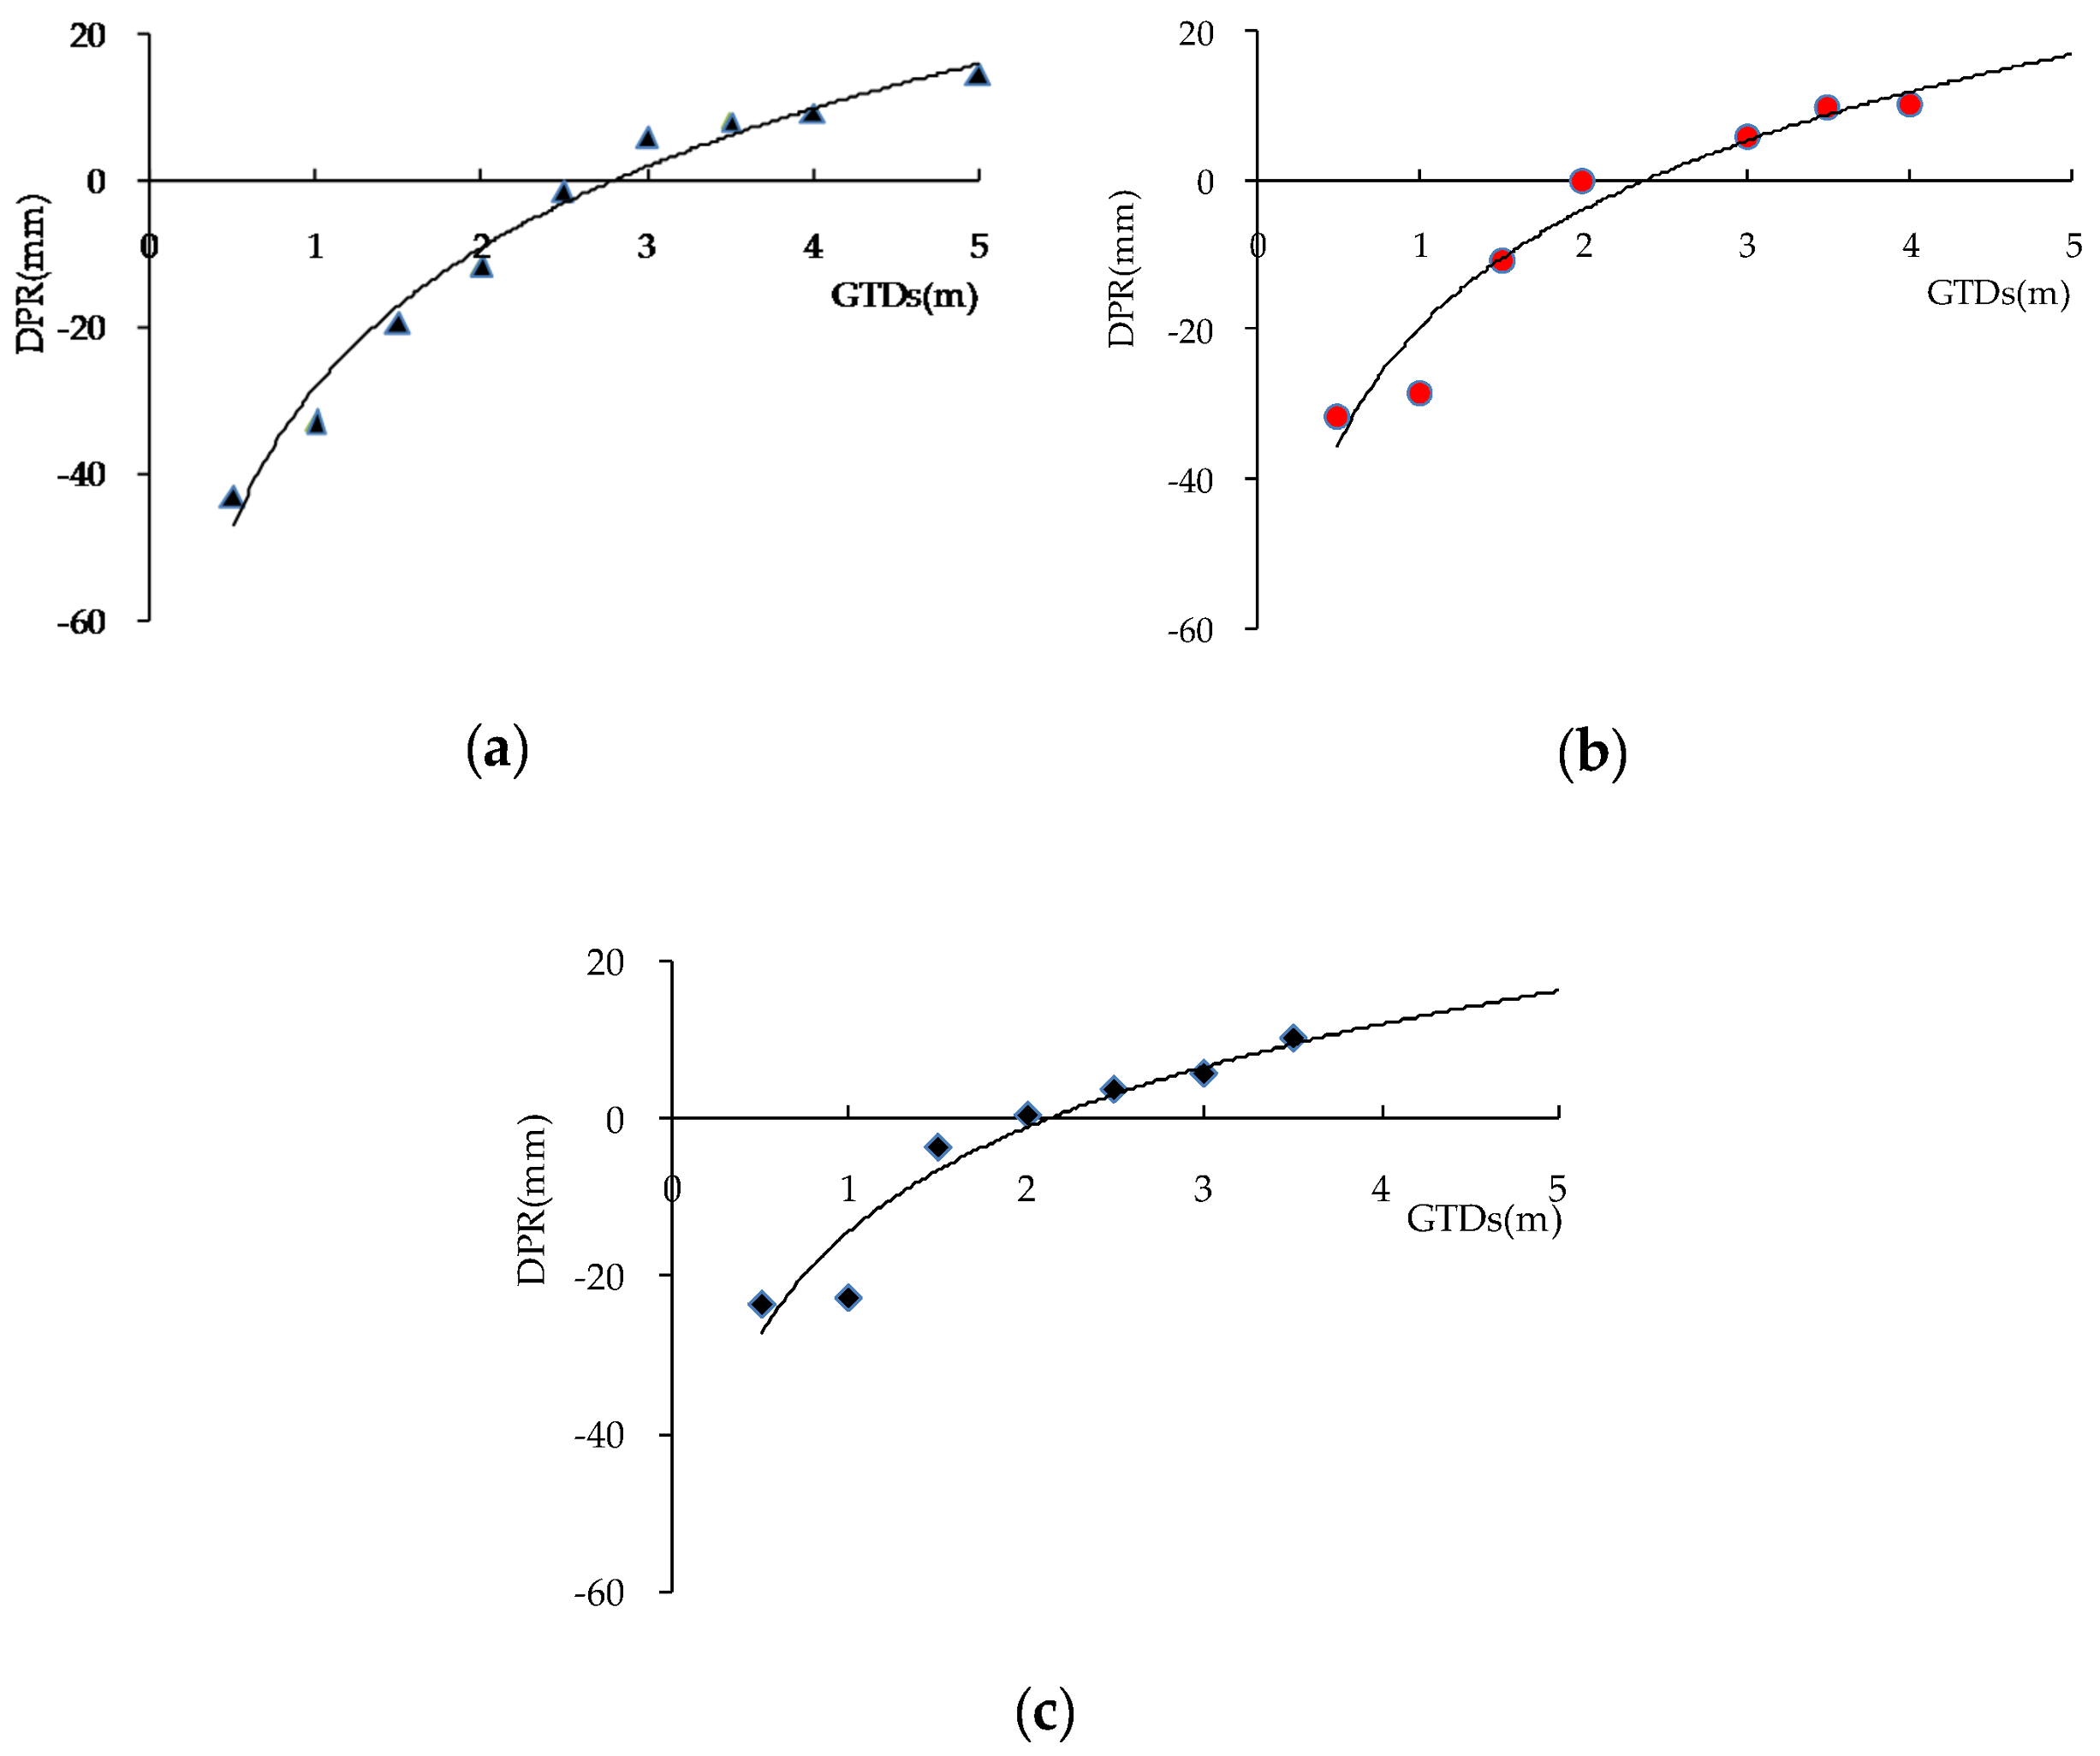
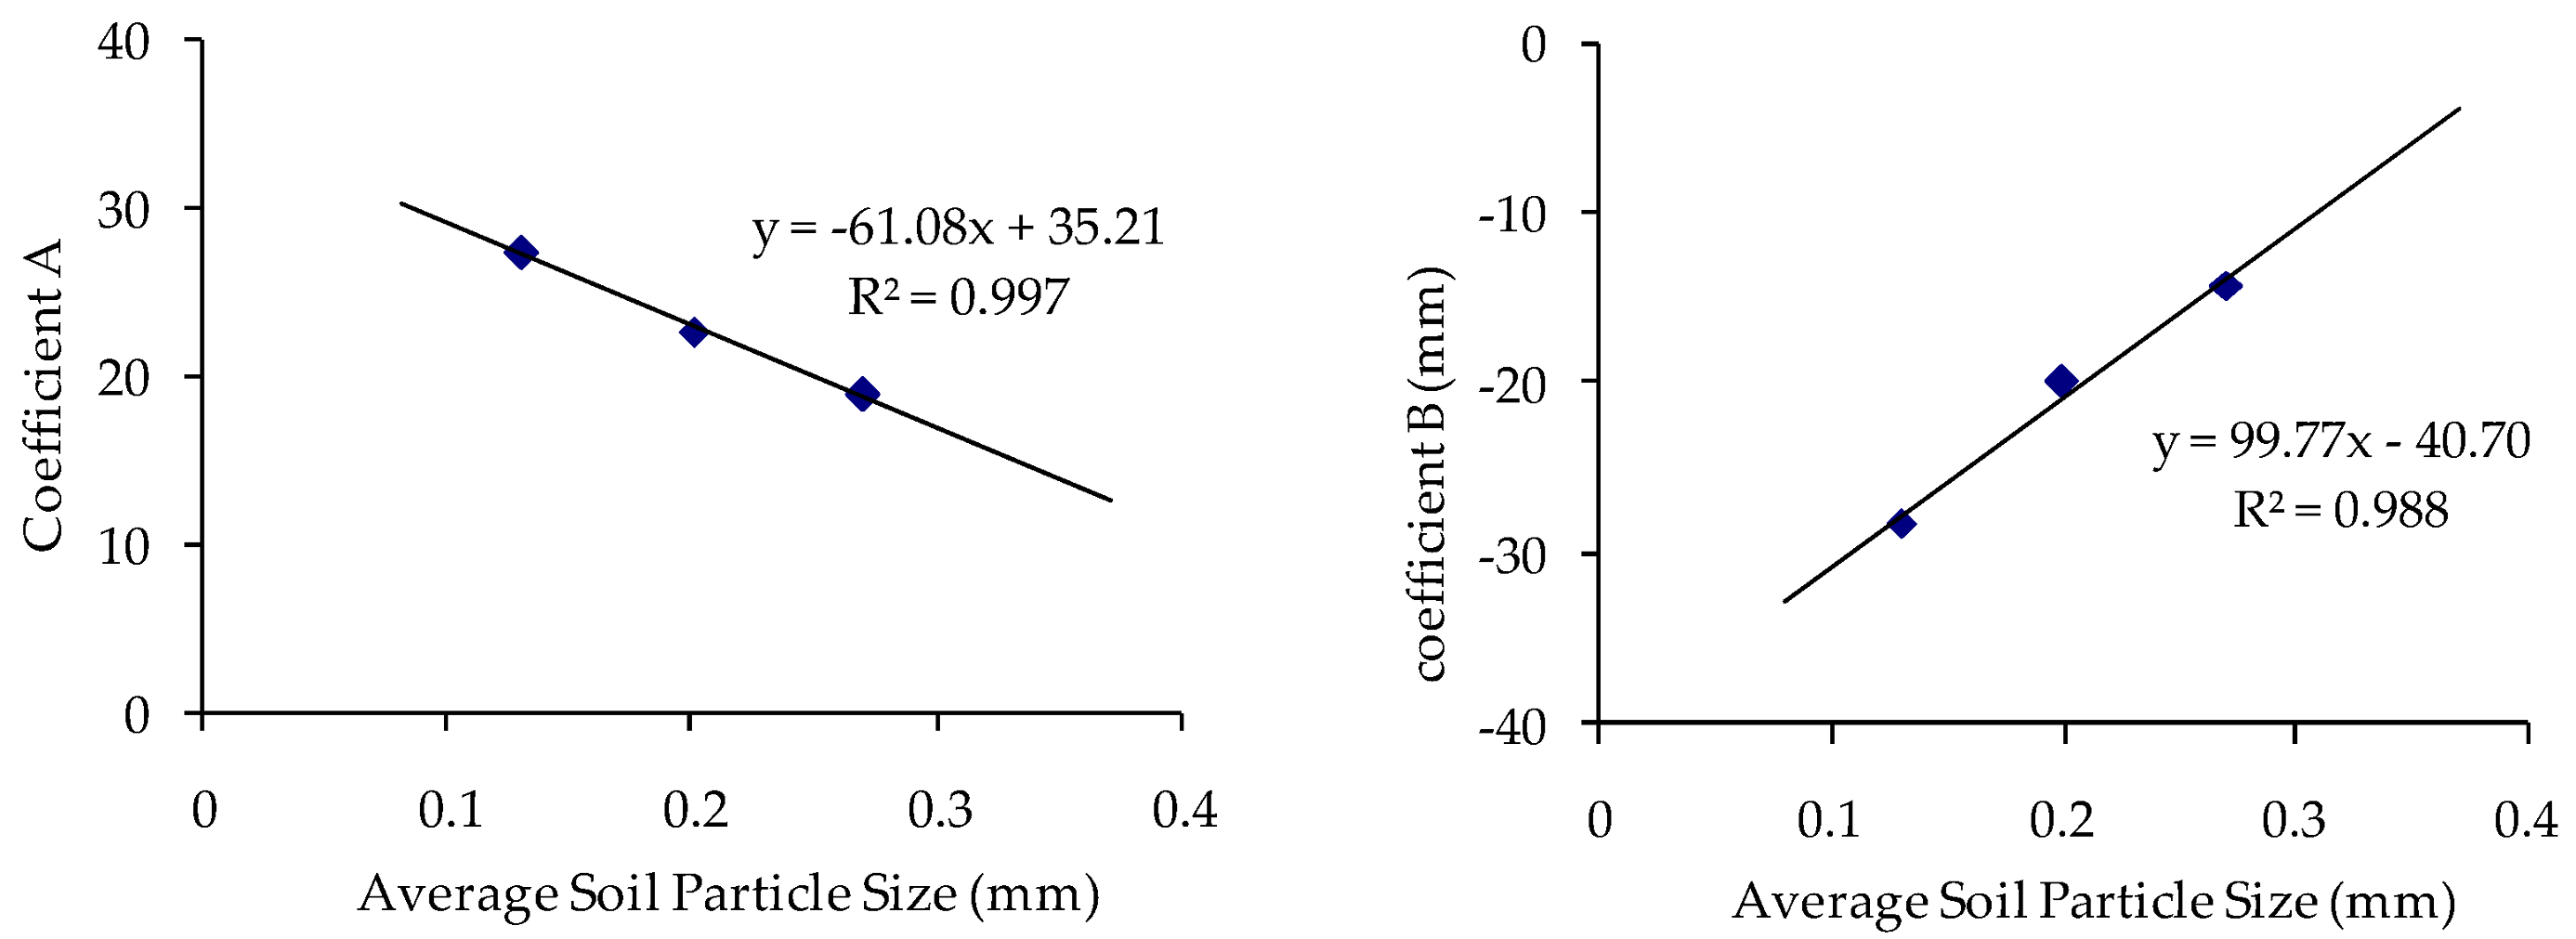
3.4. The Difference between Phreatic Evaporation and Recharge to Groundwater
4. Conclusions
Acknowledgments
Author Contributions
Conflicts of Interest
References
- Brunner, P.; Li, H.T.; Kinzelbach, W.; Li, W.P.; Dong, X.G. Extracting phreatic evaporation from remotely sensed maps of evapotranspiration. Water Resour. Res. 2008, 44, 381–392. [Google Scholar] [CrossRef]
- Northey, J.E.; Christen, E.W.; Ayars, J.E.; Jankowski, J. Occurrence and measurement of salinity stratification in shallow groundwater in the Murrumbidgee Irrigation Area, south-eastern Australia. Agric. Water Manag. 2006, 81, 23–40. [Google Scholar] [CrossRef]
- Ibrahimi, M.K.; Miyazaki, T.; Nishimura, T.; Imoto, H. Contribution of shallow groundwater rapid fluctuation to soil salinization under arid and semiarid climate. Arab. J. Geosci. 2014, 7, 3901–3911. [Google Scholar] [CrossRef]
- Ren, J.G.; Wu, Q.Q.; Zheng, X.L.; Xu, M. The Studies of Regional Water Circulation Patterns in the Yerqiang River Basin. J. Ocean Uiv. China 2006, 5, 357–362. [Google Scholar] [CrossRef]
- Hu, S.J.; Kang, S.Z.; Song, Y.D.; Ceng, X.B. Calculating phreatic water evaporation from bare soil for the Tarim River basin, Xinjiang. In Proceedings of the International Conference on Water-Saving Agriculture and Sustainable Use of Water and Land Resources, Yangling, China, 26–29 October 2003. [Google Scholar]
- Loheide, S.P.; Butler, J.J.; Gorelick, S.M. Estimation of groundwater consumption by phreatophytes using diurnal water table fluctuations: A saturated-unsaturated flow assessment. Water Resour. Res. 2005, 41, 372–380. [Google Scholar] [CrossRef]
- Sanderson, J.S.; Cooper, D.J. Ground water discharge by evapotranspiration in wetlands of an arid intermountain basin. J. Hydrol. 2008, 351, 344–359. [Google Scholar] [CrossRef]
- Lhomme, J.P.; Guilioni, L. On the link between potential evaporation and regional evaporation from a CBL perspective. Theor. Appl. Climatol. 2010, 101, 143–147. [Google Scholar] [CrossRef]
- Hu, S.; Tian, C.; Song, Y.; Chen, X.; Li, Y. Models for calculating phreatic water evaporation on bare and tamarix-vegetated lands. Chin. Sci. Bull. 2006, 51, 43–50. [Google Scholar] [CrossRef]
- Lam, A.; Karssenberg, D.; van den Hurk, B.J.J.M.; Bierkens, M.F.P. Spatial and temporal connections in groundwater contribution to evaporation. Hydrol. Earth Syst. Sci. 2011, 15, 2621–2630. [Google Scholar] [CrossRef]
- Su, L.; Wang, J.; Qin, X.; Wang, Q. Approximate solution of a one-dimensional soil water infiltration equation based on the Brooks-Corey model. Geoderma 2017, 297, 28–37. [Google Scholar] [CrossRef]
- Gomez, M.L.; Aranibar, J.N.; Wuilloud, R. Hydrogeology and hidrogeochemical modeling in phreatic aquifer of NE Mendoza Argentina. J. Iber. Geol. 2014, 40, 521–538. [Google Scholar] [CrossRef]
- Shang, M.T.; Liu, P.G.; Lei, C.; Liu, M.C.; Wu, L. Effect of climate change on the trends of evaporation of phreatic water from bare soil in Huaibei Plain, China. J. Groundwater Sci. Eng. 2017, 5, 213–221. [Google Scholar]
- Zhang, Y.K.; Schilling, K.E. Effects of land cover on water table, soil moisture, evapotranspiration, and groundwater recharge: A field observation and analysis. J. Hydrol. 2006, 319, 328–338. [Google Scholar] [CrossRef]
- Costelloe, J.F.; Irvine, E.C.; Western, A.W.; Tyler, M. Identifying fluvial recharge and artesian upwards leakage contributions to arid zone shallow, unconfined groundwater. Chem. Geol. 2012, 326, 189–200. [Google Scholar] [CrossRef]
- El Fergougui, M.M.; Boutoutaou, D.; Meza, N. Study of evaporation of the water table in arid lands: Case of Ouargla (Algeria). Hydrol. Sci. J. 2017, 62, 1067–1077. [Google Scholar]
- Li, H.S.; Wu, F.S.; Zhan, H.T. The Effect of Precipitation Pulses on Evaporation of Deeply Buried Phreatic Water in Extra-Arid Areas. Vadose Zone. J. 2016, 15. [Google Scholar] [CrossRef]
- Tan, H.; Liu, Z.; Rao, W. Stable isotopes of soil water: Implications for soil water and shallow groundwater recharge in hill and gully regions of the Loess Plateau, China. Agric. Ecosyst. Environ. 2017, 243, 1–9. [Google Scholar] [CrossRef]
- Costelloe, J.F.; Matic, V.; Western, A.W. Determining vertical leakage from the Great Artesian Basin, Australia, through up-scaling field estimates of phreatic evapotranspiration. J. Hydrol. 2015, 529, 1079–1094. [Google Scholar] [CrossRef]
- Costelloe, J.F.; Irvine, E.C.; Western, A.W. Uncertainties around modelling of steady-state phreatic evaporation with field soil profiles of δ18O and chloride. J. Hydrol. 2014, 511, 229–241. [Google Scholar] [CrossRef]
- Hu, S.J.; Lei, J.Q.; Xu, X.W. Theoretical analysis of the limiting rate of phreatic evaporation for Aeolian sandy soil in Taklimakan Desert. Chin. Sci. Bull. 2008, 53, 119–124. [Google Scholar] [CrossRef]
- Hu, S.J.; Zhao, R.F.; Tian, C.Y. Empirical models of calculating phreatic evaporation from bare soil in Tarim river basin, Xinjiang. Environ. Earth. Sci. 2009, 59, 663–668. [Google Scholar] [CrossRef]
- Dam, J.C.V.; Feddes, R.A. Numerical simulation of infiltration, evaporation and shallow groundwater levels with the Richards equation. J. Hydrol. 2000, 233, 72–85. [Google Scholar]
- Chen, X.; Ling, M.H.; Zhou, Q. Numerical modeling the role of rubber dams on groundwater recharge and phreatic evaporation loss in riparian zones. Environ. Earth. Sci. 2012, 65, 345–352. [Google Scholar] [CrossRef]
- Chen, Z.; Nie, Z.; Zhang, G.; Wan, L.; Shen, J. Environmental isotopic study on the recharge and residence time of groundwater in the Heihe River Basin, Northwestern China. Hydrogeol. J. 2016, 14, 1635–1651. [Google Scholar] [CrossRef]
- Ping, W.; Yu, J.; Zhang, Y.; Liu, C. Groundwater recharge and hydrogeochemical evolution in the Ejina Basin, Northwest China. J. Hydrol. 2013, 476, 72–86. [Google Scholar]
- Gates, J.B.; Edmunds, W.M.; Ma, J.; Scanlon, B.R. Estimating groundwater recharge in a cold desert environment in northern China using chloride. Hydrogeol. J. 2008, 16, 893–910. [Google Scholar] [CrossRef]
- Romano, E.; Giudici, M. Experimental and Modeling Study of the Soil-Atmosphere Interaction and Unsaturated Water Flow to Estimate the Recharge of a Phreatic Aquifer. J. Hydrol. Eng. 2007, 12, 573–584. [Google Scholar] [CrossRef]
- Ma, J.; Ding, Z.; Edmunds, W.M.; Gates, J.B.; Huang, T. Limits to recharge of groundwater from Tibetan plateau to the Gobi desert, implications for water management in the mountain front. J. Hydrol. 2008, 364, 128–141. [Google Scholar] [CrossRef]
- Aksenov, V.I.; Bubnov, N.G.; Klinova, G.I.; Iospa, A.V.; Gevorkyan, S.G. Water phase transformations in frozen soil under the effect of cryopegs. Water Resour. 2011, 38, 934–943. [Google Scholar] [CrossRef]
- Li, H.S.; Wang, W.F. Determination and analysis of phreatic water evaporation in extra-arid dune region. Acta Ecol. Sin. 2014, 34, 116–122. [Google Scholar] [CrossRef]
- Li, H.S.; Wang, W.; Liu, B. The daily evaporation characteristics of deeply buried phreatic water in an extremelyarid region. J. Hydrol. 2014, 514, 172–179. [Google Scholar] [CrossRef]
- Li, X.W.; Zhou, J.L.; Jin, M.G.; Liu, Y.F.; Li, Q. Experiments on Evaporation of High-TDS Phreatic Water in an Arid Area. Adv. Mater. Res. 2012, 446–449, 2815–2823. [Google Scholar]
- Li, R.; Shi, H.; Flerchinger, G.N. Modeling the effect of antecedent soil water storage on water and heat status in seasonally freezing and thawing agricultural soils. Geoderma 2013, 206, 70–74. [Google Scholar] [CrossRef]
- Wang, W.; Li, Y.; Yang, F.; Hou, L.; Zhao, G.; Li, J. Experimental and numerical study of coupled flow and heat transport. Proc. Inst. Civ. Eng. Water Manag. Impact Factor 2015, 164, 533–547. [Google Scholar] [CrossRef]
- Bittelli, M.; Ventura, F.; Campbell, G.S.; Campbell, G.S.; Snyder, R.L.; Gallegati, F.; Pisa, P.R. Coupling of heat, water vapor, and liquid water fluxes to compute evaporation in bare soils. J. Hydrol. 2008, 362, 191–205. [Google Scholar] [CrossRef]
- Wang, K.; Wu, M.S.; Zhang, R.D. Water and solute fluxes in soils undergoing freezing and thawing. Soil Sci. 2016, 181, 193–201. [Google Scholar] [CrossRef]
- Min, L.; Shen, Y.; Pei, H.; Jing, B. Characterizing deep vadose zone water movement and solute transport under typical irrigated cropland in the north China plain. Hydrol. Process. 2017, 31, 31. [Google Scholar] [CrossRef]
- Chen, H.; Hu, K.; Nie, Y.; Wang, K. Analysis of soil water movement inside a footslope and a depression in a karst catchment, southwest China. Sci. Rep. 2017, 7. [Google Scholar] [CrossRef] [PubMed]
- Liu, W.; Wang, S.; Luo, W.; Dai, W.; Bai, E. Characteristics of soil water movement in a grass slope in a karst peak-luster region, China. Hydrol. Process. 2017, 31, 1331–1348. [Google Scholar] [CrossRef]
- Watanabe, K.; Kito, T.; Dun, S.; Wu, J.Q.; Greer, R.C.; Flury, M. Water infiltration into a frozen soil with simultaneous melting of the frozen layer. Vadose Zone. J. 2013, 12, 1048–1060. [Google Scholar] [CrossRef]
- Sun, S.M.; Dai, C.L.; Liao, H.C. A Conceptual Model of Soil Moisture Movement in Seasonal Frozen Unsaturated Zone. Appl. Mech. Mater. 2011, 90–93, 2612–2618. [Google Scholar] [CrossRef]
- Miao, C.Y.; Chen, J.F.; Zheng, X.Q.; Zhang, Y.B.; Xu, Y.X.; Du, Q. Soil Water and Phreatic Evaporation in Shallow Groundwater during a Freeze–Thaw Period. Water 2017, 9, 396. [Google Scholar] [CrossRef]
- Chen, J.F.; Zheng, X.Q.; Zang, H.F.; Liu, P.; Sun, M. Numerical Simulation of Moisture and Heat Coupled Migration in Seasonal Freeze-thaw Soil Media. J. Pure Appl. Microbiol. 2013, 7, 151–158. [Google Scholar]
- Zheng, X.Q.; Chen, J.F.; Xing, S.Y. Soil infiltration capacity and infiltration parameters of freezing and thawing soil under different surface coverages. Trans. Chin. Soc. Agric. Eng. 2009, 25, 23–28. [Google Scholar]
- Zheng, X.Q.; Flerchinger, G.N. Infiltration into freezing and thawing soils under different field management. J. Irrig. Drain. Eng. 2001, 127, 176–182. [Google Scholar]
- Li, R.; Shi, H.; Flerchinger, G.N.; Akae, T.; Wang, C. Simulation of freezing and thawing soils in Inner Mongolia Hetao Irrigation District, China. Geoderma 2012, 173, 28–33. [Google Scholar] [CrossRef]
- Zhao, Y.; Si, B.; He, H.; Xu, J.; Peth, S.; Horn, R. Modeling of coupled water and heat transfer in freezing and thawing soils, Inner Mongolia. Water 2016, 8, 424. [Google Scholar] [CrossRef]
- Cheng, Q.; Sun, Y.; Qin, Y.; Xue, X.; Cai, X.; Sheng, W.; Zhao, Y. In situ measuring soil ice content with a combined use of dielectric tube sensor and neutron moisture meter in a common access tube. Agric. For. Meteorol. 2013, 171, 249–255. [Google Scholar] [CrossRef]
- Seyfried, M.S.; Murdock, M.D. Use of air permeability to estimate infiltrability of frozen soil. J. Hydrol. 1997, 202, 95–107. [Google Scholar] [CrossRef]
- Hansson, K.; Šimůnek, J.; Mizoguchi, M.; Lundin, L.C.; van Genuchten, M.T. Water flow and heat transportin frozen soil: Numerical solution and freeze-thaw applications. Vadose Zone J. 2004, 3, 693–704. [Google Scholar]
- Wu, M.; Huang, J.; Wu, J.; Tan, X.; Jansson, P.E. Experimental study on evaporation from seasonally frozen soils under various water, solute and groundwater conditions in Inner Mongolia, China. J. Hydrol. 2016, 535, 46–53. [Google Scholar] [CrossRef]
- Walvoord, M.A.; Striegl, R.G. Increased groundwater to stream discharge from permafrost thawing in the Yukon River basin: Potential impacts on lateral export of carbon and nitrogen. Geophys. Res. Lett. 2007, 34, L12402. [Google Scholar] [CrossRef]


| Freeze–Thaw Period | Year | Precipitation (mm) | |||||||
|---|---|---|---|---|---|---|---|---|---|
| From 2004 to 2005 (2004–2005) | 2004 | 23 November | 24 November | 1 December | 2 December | 21 December | 22 December | ||
| 4.4 | 2.8 | 0.5 | 1.4 | 2 | 2.5 | ||||
| 2005 | 1 January | 25 January | 5 February | 6 February | 7 February | 14 February | 15 February | 17 February | |
| 0.1 | 0.7 | 0.3 | 0.4 | 0.3 | 0.5 | 2.4 | 1.5 | ||
| From 2005 to 2006 (2005–2006) | 2005 | 31 December | |||||||
| 0.3 | |||||||||
| 2006 | 4 January | 19 January | 20 January | 5 February | 27 February | 28 February | |||
| 0.5 | 1.4 | 0.6 | 0.3 | 5.6 | 0.4 | ||||
| From 2006 to 2007 (2006–2007) | 2006 | 23 November | 24 November | 25 November | 27 November | 8 December | 29 December | 30 December | |
| 4.5 | 4.4 | 3.1 | 0.6 | 0.2 | 0.4 | 0.7 | |||
| 2007 | 7 February | 28 February | 4 March | 15 March | |||||
| 6.8 | 0.5 | 3.6 | 0.3 | ||||||
| Lithology | Mass Percentage of Different Soil Particle Diameter (%) | Average Particle Size (mm) | Maximum Capillary Height (cm) | Porosity (m3·m−3) | Specific Yield (m3·m−3) | Bulk Density (×103 kg·m−3) | ||||
|---|---|---|---|---|---|---|---|---|---|---|
| 0.5–2 mm | 0.25–0.5 mm | 0.1–0.25 mm | 0.05–0.1 mm | <0.05 mm | ||||||
| Sandy Loam | 1.3 | 19.7 | 36.1 | 24.4 | 18.5 | 0.13 | 185 | 0.53 | 0.08 | 1.53 |
| Fine Sand | 1.6 | 22.4 | 45.7 | 24.5 | 5.8 | 0.20 | 77 | 0.45 | 0.12 | 1.61 |
| Sandy Soil | 8.1 | 26.9 | 50.1 | 9.6 | 5.3 | 0.27 | 52 | 0.40 | 0.14 | 1.62 |
| Soil Freezing and Thawing Stage | From 2004 to 2005 (2004–2005) | From 2005 to 2006 (2005–2006) | From 2006 to 2007 (2006–2007) |
| Unstable Freezing Stage | From 11 November to 24 December 2004 | From 14 November to 2 December 2005 | From 15 November to 4 December 2006 |
| Stable Freezing Stage | From 25 December 2004 to 12 February 2005 | From 3 December 2005 to 1 February 2006 | From 5 December 2006 to 5 February 2007 |
| Thawing Stage | From 13 February to 19 March 2005 | From 2 February to 16 March 2006 | From 6 February to 15 March 2007 |
| Maximum Depth and Time of the Frozen Soil | 60 cm, 6 February 2005 | 52 cm, 17 January 2006 | 50 cm, 18 January 2007 |
| Freeze–Thaw Period | Data | Groundwater Table Depth (GTD) | ||||||||
|---|---|---|---|---|---|---|---|---|---|---|
| 0.5 m | 1.0 m | 1.5 m | 2.0 m | 2.5 m | 3.0 m | 3.5 m | 4.0 m | 5.0 m | ||
| 2004–2005 | November 2004 | 11.99 | 6.64 | 5.16 | 2.61 | 3.28 | 0.24 | |||
| December 2004 | 27.15 | 17.26 | 8 | 4 | 0.26 | 0.01 | ||||
| January 2005 | 0.39 | 28.5 | 18.67 | 6.52 | 0.44 | 0.13 | ||||
| February 2005 | 0.29 | 6.57 | 5.22 | 8.53 | 0.56 | 2.21 | ||||
| March 2005 | 21.34 | 0.27 | 0.02 | 1.71 | 0.48 | 1.23 | ||||
| Total | 61.16 | 59.24 | 37.07 | 23.37 | 5.02 | 3.82 | ||||
| 2005–2006 | November 2005 | 15.39 | 4.99 | 5.78 | 1.31 | 0.32 | 0.06 | 0.18 | ||
| December 2005 | 17.16 | 24.58 | 10.29 | 5.14 | 0.74 | 0.29 | 0.71 | |||
| January 2006 | 1.89 | 16.15 | 17.76 | 5.62 | 1.64 | 0.18 | 1.09 | |||
| February 2006 | 10.13 | 3.93 | 1.76 | 2.11 | 0.79 | 1.69 | 0.88 | |||
| March 2006 | 8.93 | 1.47 | 0.49 | 0.38 | 0.52 | 1.21 | 0.61 | |||
| Total | 53.5 | 51.12 | 36.08 | 14.56 | 4.01 | 3.43 | 3.47 | |||
| 2006–2007 | November 2006 | 7.77 | 5.35 | 4.74 | 1.25 | 0.61 | 0.26 | 0.12 | 0.06 | 0.06 |
| December 2006 | 21.58 | 22.56 | 10.66 | 4.56 | 1.21 | 0.77 | 0.55 | 0.13 | 0.1 | |
| January 2007 | 2.77 | 9.67 | 17.66 | 5.43 | 1.88 | 1.39 | 1.23 | 0.59 | 0.25 | |
| February 2007 | 12.51 | 3.52 | 1.79 | 1.45 | 0.88 | 0.77 | 0.92 | 0.57 | 0.34 | |
| March 2007 | 5.86 | 0.2 | 0.06 | 1.07 | 0.51 | 0.69 | 0.42 | 0.2 | 0.14 | |
| Total | 50.49 | 41.3 | 34.91 | 13.76 | 5.09 | 3.88 | 3.24 | 1.55 | 0.89 | |
| Freeze–Thaw Period | Data | GTD | |||||||
|---|---|---|---|---|---|---|---|---|---|
| 0.5 m | 1.0 m | 1.5 m | 2.0 m | 3.0 m | 3.5 m | 4.0 m | 5.0 m | ||
| 2004–2005 | November 2004 | 6.95 | 3.39 | 2.62 | 0.39 | 0.01 | |||
| December 2004 | 21.43 | 21.7 | 3.21 | 0.5 | 0.14 | ||||
| January 2005 | 0.12 | 32.75 | 6.79 | 1.44 | 0.57 | ||||
| February 2005 | 0.34 | 1.19 | 3.8 | 0.78 | 0.43 | ||||
| March 2005 | 26.17 | 4.91 | 0.1 | 0.6 | 0.71 | ||||
| Total | 55.01 | 63.94 | 16.52 | 3.71 | 1.86 | ||||
| 2005–2006 | November 2005 | 11.15 | 1.94 | 2.17 | 0.2 | 0 | 0.01 | ||
| December 2005 | 13.25 | 41.92 | 5.07 | 0.49 | 0.17 | 0.48 | |||
| January 2006 | 1.21 | 17.12 | 4.12 | 1.17 | 0.3 | 0.1 | |||
| February 2006 | 5.53 | 3.51 | 1.61 | 0.42 | 1.52 | 0.52 | |||
| March 2006 | 16.34 | 0.35 | 0.76 | 0.12 | 0.23 | 0.13 | |||
| Total | 47.48 | 64.84 | 13.73 | 2.4 | 2.22 | 1.24 | |||
| 2006–2007 | November 2006 | 6.32 | 6.2 | 2.16 | 0.58 | 0.21 | 0.15 | 0.06 | 0.05 |
| December 2006 | 14.39 | 30.1 | 5.3 | 1.44 | 0.57 | 0.36 | 0.15 | 0.13 | |
| January 2007 | 0.78 | 8.16 | 6.69 | 0.85 | 0.85 | 0.45 | 0.26 | 0.23 | |
| February 2007 | 13.04 | 2.88 | 0.06 | 0.29 | 0.22 | 0.15 | 0.11 | 0.12 | |
| March 2007 | 6.89 | 1.51 | 0.04 | 0.12 | 0.21 | 0.12 | 0.06 | 0.05 | |
| Total | 41.42 | 48.85 | 14.25 | 3.28 | 2.06 | 1.23 | 0.64 | 0.58 | |
| Freeze–Thaw Period | Data | GTD | ||||||
|---|---|---|---|---|---|---|---|---|
| 0.5 m | 1.0 m | 1.5 m | 2.0 m | 2.5 m | 3.0 m | 3.5 m | ||
| 2004–2005 | November 2004 | 8.67 | 3.67 | 0.34 | 0.54 | 0.01 | 0.01 | |
| December 2004 | 13.25 | 13.68 | 0.36 | 0.01 | 0.01 | 0.02 | ||
| January 2005 | 0.23 | 30.86 | 2.19 | 0.43 | 0.44 | 0.34 | ||
| February 2005 | 0.61 | 1.86 | 1.53 | 0.56 | 0.56 | 0.16 | ||
| March 2005 | 22.44 | 0.03 | 1.34 | 0.48 | 0.48 | 0.09 | ||
| Total | 45.2 | 50.1 | 5.76 | 2.02 | 1.5 | 0.62 | ||
| 2005–2006 | November 2005 | 4.5 | 1.27 | 0.73 | 0.09 | 0.04 | 0 | 0 |
| December 2005 | 8.91 | 24.82 | 1.35 | 0.22 | 0.2 | 0.07 | 0.14 | |
| January 2006 | 1.72 | 20.05 | 2.6 | 1.19 | 0.44 | 0.31 | 0.19 | |
| February 2006 | 12.47 | 1.83 | 0.69 | 0.63 | 0.4 | 0.19 | 0.22 | |
| March 2006 | 16.14 | 0.82 | 0.04 | 0.04 | 0.13 | 0.11 | 0.1 | |
| Total | 43.74 | 48.79 | 5.41 | 2.17 | 1.21 | 0.68 | 0.65 | |
| 2006–2007 | November 2006 | 4.02 | 9.31 | 0.56 | 0.55 | 0.25 | 0.03 | 0.02 |
| December 2006 | 8.8 | 19.09 | 1.72 | 0.57 | 0.12 | 0.17 | 0.15 | |
| January 2007 | 0.78 | 6.58 | 1.63 | 0.57 | 0.41 | 0.23 | 0.21 | |
| February 2007 | 14.74 | 1.61 | 1.66 | 0.39 | 0.36 | 0.11 | 0.12 | |
| March 2007 | 7.9 | 0.28 | 0.1 | 0.19 | 0.12 | 0.09 | 0.04 | |
| Total | 36.24 | 36.87 | 5.67 | 2.27 | 1.26 | 0.63 | 0.54 | |
| Freeze–Thaw Period | Data | GTD | ||||||||
|---|---|---|---|---|---|---|---|---|---|---|
| 0.5 m | 1.0 m | 1.5 m | 2.0 m | 2.5 m | 3.0 m | 3.5 m | 4.0 m | 5.0 m | ||
| 2004–2005 | November 2004 | 2.63 | 0.5 | 0.02 | 0.13 | 0.27 | 0.38 | |||
| December 2004 | 2.48 | 0 | 0 | 1.04 | 0.69 | 5.12 | ||||
| January 2005 | 0.46 | 0.04 | 0 | 0.53 | 0.78 | 2.87 | ||||
| February 2005 | 0.52 | 0.92 | 0 | 0.58 | 0.69 | 0.78 | ||||
| March 2005 | 9.73 | 19.27 | 15.1 | 5.34 | 0.53 | 1.12 | ||||
| Total | 15.82 | 20.73 | 15.12 | 7.62 | 2.96 | 10.27 | ||||
| 2005–2006 | November 2005 | 0 | 0 | 0 | 0.26 | 0.27 | 3.09 | 3.16 | ||
| December 2005 | 2.59 | 0 | 0 | 0.3 | 0.98 | 2.95 | 3.19 | |||
| January 2006 | 2.48 | 0.18 | 0 | 0 | 0.84 | 2.81 | 0.92 | |||
| February 2006 | 0.84 | 6.19 | 3.2 | 0.18 | 0.71 | 1.55 | 3.22 | |||
| March 2006 | 3.66 | 10.49 | 12.7 | 3.3 | 0.32 | 0.72 | 2.25 | |||
| Total | 9.57 | 16.86 | 15.9 | 4.04 | 3.12 | 11.12 | 12.74 | |||
| 2006–2007 | November 2006 | 0 | 0 | 0 | 0.08 | 0.68 | 0.55 | 0.98 | 2.11 | 2.65 |
| December 2006 | 0 | 0 | 0 | 0.05 | 0.57 | 1.32 | 1.66 | 2.25 | 2.37 | |
| January 2007 | 0.62 | 1.19 | 0.89 | 0.37 | 0.72 | 1.42 | 2.74 | 3.06 | 5.37 | |
| February 2007 | 0.53 | 3.26 | 3.2 | 1.18 | 0.71 | 1.55 | 3 | 2.31 | 3.88 | |
| March 2007 | 9.21 | 10.68 | 14.82 | 3.05 | 0.66 | 2.26 | 2.05 | 1.26 | 1.25 | |
| Total | 10.36 | 15.13 | 18.91 | 4.73 | 3.34 | 7.1 | 10.43 | 10.99 | 15.52 | |
| Freeze–Thaw Period | Data | GTD | |||||||
|---|---|---|---|---|---|---|---|---|---|
| 0.5 m | 1.0 m | 1.5 m | 2.0 m | 3.0 m | 3.5 m | 4.0 m | 5.0 m | ||
| 2004–2005 | November 2004 | 1.35 | 2.74 | 0.03 | 0.25 | 0.94 | |||
| December 2004 | 5.65 | 0 | 0.06 | 1.45 | 3.4 | ||||
| January 2005 | 3.2 | 0.99 | 0.1 | 0.65 | 1.61 | ||||
| February 2005 | 2.34 | 1.93 | 0.67 | 0.8 | 1.43 | ||||
| March 2005 | 10.0 | 24.02 | 4.12 | 0.71 | 1.64 | ||||
| Total | 22.54 | 29.68 | 4.98 | 3.86 | 9.02 | ||||
| 2005–2006 | November 2005 | 0 | 0 | 0.03 | 0.27 | 1.74 | 3.74 | ||
| December 2005 | 6.25 | 0 | 0.01 | 0.72 | 1.95 | 2.58 | |||
| January 2006 | 4.09 | 0.15 | 0 | 0.37 | 1.71 | 1.47 | |||
| February 2006 | 0.43 | 19.12 | 3.57 | 0.39 | 1.33 | 2.84 | |||
| March 2006 | 4.25 | 16.81 | 1.61 | 0.36 | 1.61 | 0.92 | |||
| Total | 15.02 | 36.08 | 5.22 | 2.11 | 8.34 | 11.55 | |||
| 2006–2007 | November 2006 | 2.48 | 0.23 | 0 | 0.2 | 1.34 | 1.82 | 1.5 | 2.99 |
| December 2006 | 0 | 0.81 | 0 | 0.01 | 1.89 | 2.73 | 3.25 | 3.64 | |
| January 2007 | 4.09 | 0.99 | 0.03 | 0.65 | 1.61 | 2.74 | 2.6 | 5.75 | |
| February 2007 | 1.03 | 12.13 | 0.67 | 0.8 | 1.43 | 2.3 | 2.23 | 3.21 | |
| March 2007 | 4.26 | 12.37 | 1.74 | 1.36 | 0.56 | 1.05 | 1.24 | 1.44 | |
| Total | 11.86 | 26.53 | 2.44 | 3.02 | 6.83 | 10.64 | 10.82 | 17.03 | |
| Freeze–Thaw Period | Data | GTD | ||||||
|---|---|---|---|---|---|---|---|---|
| 0.5 m | 1.0 m | 1.5 m | 2.0 m | 2.5 m | 3.0 m | 3.5 m | ||
| 2004–2005 | November 2004 | 0.2 | 0.06 | 0.01 | 0.31 | 0.72 | 0.96 | |
| December 2004 | 6.96 | 0 | 1.65 | 1.92 | 2.62 | 1.32 | ||
| January 2005 | 3.22 | 0 | 0 | 0.1 | 0.79 | 0.16 | ||
| February 2005 | 3.3 | 5.29 | 0 | 0.25 | 0.65 | 0.11 | ||
| March 2005 | 5.08 | 18.99 | 0.27 | 0.28 | 0.58 | 1.82 | ||
| Total | 18.76 | 24.34 | 1.93 | 2.86 | 5.36 | 4.37 | ||
| 2005–2006 | November 2005 | 0 | 0 | 0 | 0.8 | 2.21 | 3.47 | 3.81 |
| December 2005 | 7.74 | 0 | 0 | 0 | 0.92 | 1.02 | 2.46 | |
| January 2006 | 5.89 | 0.1 | 0.1 | 0.01 | 0.96 | 1.64 | 1.93 | |
| February 2006 | 4.3 | 21.03 | 0 | 0.52 | 1.04 | 1.19 | 2.02 | |
| March 2006 | 1.05 | 3.52 | 0.47 | 0.75 | 0.95 | 0.1 | 0.22 | |
| Total | 18.98 | 24.65 | 0.57 | 2.08 | 6.08 | 7.42 | 10.44 | |
| 2006–2007 | November 2006 | 3.12 | 0.04 | 0.08 | 0.34 | 1.26 | 2.59 | 1.53 |
| December 2006 | 0 | 0 | 0 | 0.01 | 0.46 | 1.36 | 4.94 | |
| January 2007 | 7.28 | 0 | 0 | 0.06 | 0.72 | 0.32 | 1.93 | |
| February 2007 | 2.02 | 5.56 | 0.76 | 0.65 | 0.43 | 1.39 | 2.02 | |
| March 2007 | 4.58 | 13.01 | 2.5 | 1.34 | 0.7 | 1.57 | 0.47 | |
| Total | 17.0 | 18.61 | 3.34 | 2.4 | 3.57 | 7.23 | 10.89 | |
| Freeze–Thaw Period | Period | GTD | ||||||||
|---|---|---|---|---|---|---|---|---|---|---|
| 0.5 m | 1.0 m | 1.5 m | 2.0 m | 2.5 m | 3.0 m | 3.5 m | 4.0 m | 5.0 m | ||
| 2004–2005 | Freezing | −34.11 | −57.27 | −36.86 | −14.47 | −2.46 | 7.69 | |||
| Thawing | −11.23 | 18.76 | 14.91 | −1.28 | 0.4 | −1.24 | ||||
| Total | −45.34 | −38.51 | −21.95 | −15.75 | −2.06 | 6.45 | ||||
| 2005–2006 | Freezing | −29.42 | −45.99 | −24.97 | −12.38 | −0.66 | 8.09 | 5.29 | ||
| Thawing | −14.51 | 11.73 | 4.79 | 1.86 | −0.23 | −0.4 | 3.98 | |||
| Total | −43.93 | −34.26 | −20.18 | −10.52 | −0.89 | 7.69 | 9.27 | |||
| 2006–2007 | Freezing | −31.81 | −47.16 | −32.68 | −11.51 | −1.79 | 0.87 | 3.48 | 6.64 | 9.98 |
| Thawing | −8.32 | 20.99 | 16.68 | 2.48 | 0.04 | 2.35 | 3.71 | 2.8 | 4.65 | |
| Total | −40.13 | −26.17 | −16 | −9.03 | −1.75 | 3.22 | 7.19 | 9.44 | 14.63 | |
| Average | −43.13 | −32.98 | −19.38 | −11.77 | −1.57 | 5.79 | 8.23 | 9.44 | 14.63 | |
| Freeze–Thaw Period | Period | GTD | |||||||
|---|---|---|---|---|---|---|---|---|---|
| 0.5 m | 1.0 m | 1.5 m | 2.0 m | 3.0 m | 3.5 m | 4.0 m | 5.0 m | ||
| 2004–2005 | Freezing | −18.33 | −54.29 | −16 | −0.27 | 5.23 | |||
| Thawing | −14.14 | 20.03 | 4.46 | 0.42 | 1.93 | ||||
| Total | −32.47 | −34.26 | −11.54 | 0.15 | 7.16 | ||||
| 2005–2006 | Freezing | −15.39 | −61.51 | −11.62 | −0.55 | 4.93 | 7.2 | ||
| Thawing | −17.07 | 32.75 | 3.11 | 0.26 | 1.19 | 3.11 | |||
| Total | −32.46 | −28.76 | −8.51 | −0.29 | 6.12 | 10.31 | |||
| 2006–2007 | Freezing | −14.92 | −42.93 | −14.14 | −2.08 | 3.21 | 6.33 | 6.88 | 11.97 |
| Thawing | −14.64 | 20.61 | 2.33 | 1.82 | 1.56 | −1.56 | 2.53 | −1.79 | |
| Total | −29.56 | −22.32 | −11.81 | −0.26 | 4.77 | 9.41 | 10.18 | 16.45 | |
| Average | −31.50 | −28.45 | −10.62 | −0.13 | 6.02 | 9.86 | 10.18 | 16.45 | |
| Freeze–Thaw Period | Period | GTD | ||||||
|---|---|---|---|---|---|---|---|---|
| 0.5 m | 1.0 m | 1.5 m | 2.0 m | 2.5 m | 3.0 m | 3.5 m | ||
| 2004–2005 | Freezing | −11.93 | −48.83 | −2.0 | 1.13 | 3.45 | 2.07 | |
| Thawing | −14.51 | 23.07 | −1.83 | −0.29 | 0.41 | 1.68 | ||
| Total | −26.44 | −25.76 | −3.83 | 0.84 | 3.86 | 3.75 | ||
| 2005–2006 | Freezing | −1.76 | −47.13 | −4.73 | −0.98 | 3.39 | 5.75 | 7.87 |
| Thawing | −23 | 22.99 | −0.11 | 0.89 | 1.48 | 0.99 | 1.92 | |
| Total | −24.76 | −24.14 | −4.84 | −0.09 | 4.87 | 6.74 | 9.79 | |
| 2006–2007 | Freezing | −3.2 | −35.35 | −4.16 | −1.34 | 1.59 | 3.84 | 8.02 |
| Thawing | −16.04 | 17.09 | 1.83 | 1.47 | 0.72 | −1.53 | −1.42 | |
| Total | −19.24 | −18.26 | −2.33 | 0.13 | 2.31 | 6.6 | 10.35 | |
| Average | −23.48 | −22.72 | −3.67 | 0.29 | 3.68 | 5.70 | 10.07 | |
| Soil Texture | Regressive Coefficient | Significance Test of Regression Equation | |||||||||
|---|---|---|---|---|---|---|---|---|---|---|---|
| Deviation | Degrees of Freedom | Mean Square Deviation | F | ||||||||
| A | B (mm) | Qreg. (mm) | Qres. (mm) | Qtatal (mm) | p | n − p − 1 | n − 1 | Sreg. (mm) | Sres (mm) | ||
| Sandy Loam | 27.404 | −28.165 | 3238.111 | 74.740 | 3312.851 | 1 | 7 | 8 | 3238.111 | 10.677 | 303.275 |
| Fine Sand | 22.737 | −19.874 | 2211.305 | 111.071 | 2322.375 | 1 | 6 | 7 | 2211.305 | 18.512 | 119.454 |
| Sandy Soil | 18.852 | −14.196 | 1000.006 | 98.773 | 1098.779 | 1 | 5 | 6 | 1000.006 | 19.755 | 50.621 |
© 2018 by the authors. Licensee MDPI, Basel, Switzerland. This article is an open access article distributed under the terms and conditions of the Creative Commons Attribution (CC BY) license (http://creativecommons.org/licenses/by/4.0/).
Share and Cite
Chen, J.; Gao, X.; Zheng, X.; Miao, C.; Liu, P.; Du, Q.; Xu, Y. Transformation between Phreatic Water and Soil Water during Freeze–Thaw Periods. Water 2018, 10, 376. https://doi.org/10.3390/w10040376
Chen J, Gao X, Zheng X, Miao C, Liu P, Du Q, Xu Y. Transformation between Phreatic Water and Soil Water during Freeze–Thaw Periods. Water. 2018; 10(4):376. https://doi.org/10.3390/w10040376
Chicago/Turabian StyleChen, Junfeng, Xuguang Gao, Xiuqing Zheng, Chunyan Miao, Ping Liu, Qi Du, and Yongxin Xu. 2018. "Transformation between Phreatic Water and Soil Water during Freeze–Thaw Periods" Water 10, no. 4: 376. https://doi.org/10.3390/w10040376
APA StyleChen, J., Gao, X., Zheng, X., Miao, C., Liu, P., Du, Q., & Xu, Y. (2018). Transformation between Phreatic Water and Soil Water during Freeze–Thaw Periods. Water, 10(4), 376. https://doi.org/10.3390/w10040376