Assessment of Meteorological Drought Indices in Korea Using RCP 8.5 Scenario


Abstract
1. Introduction
2. Theoretical Background of SPI & RDI
2.1. Equation of SPI
2.2. Equation of RDI
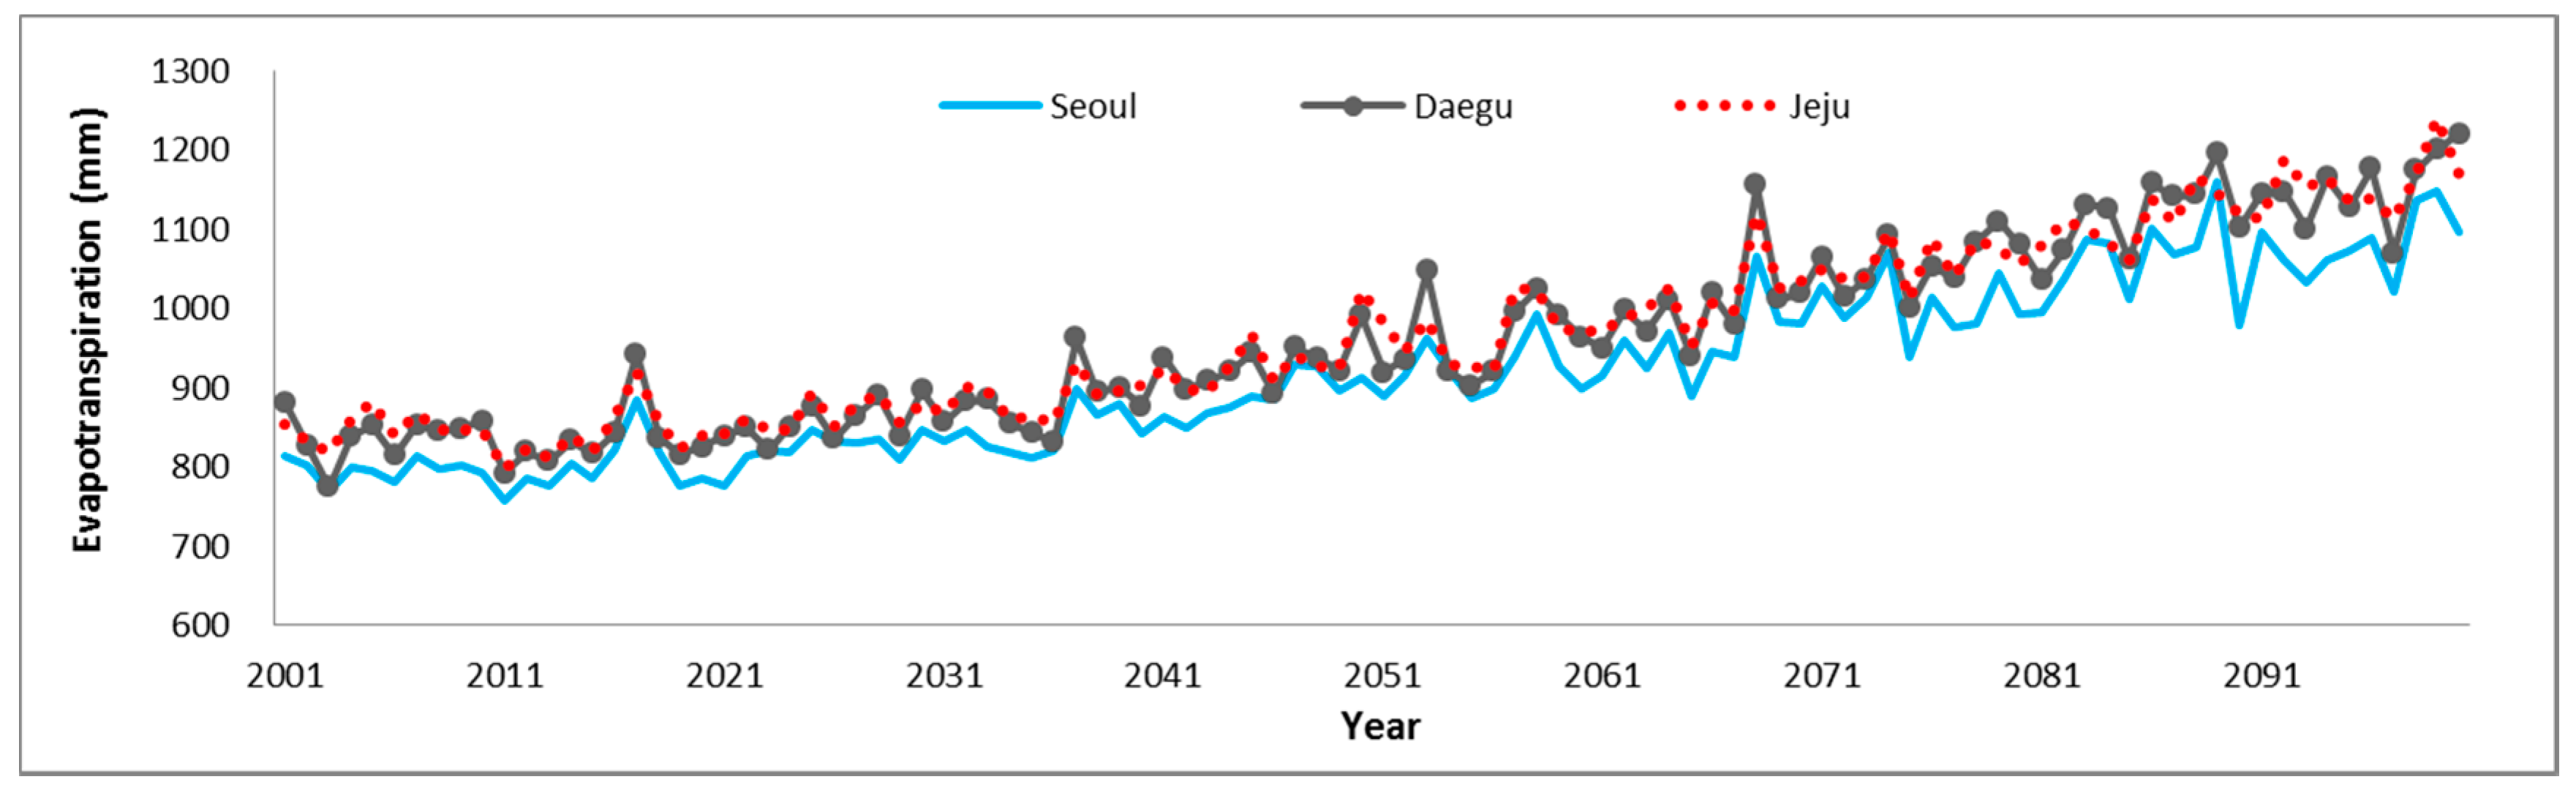
2.3. Calculation of PET
3. Data Collection and Analysis of Precipitation and Temperature using RCP Scenario
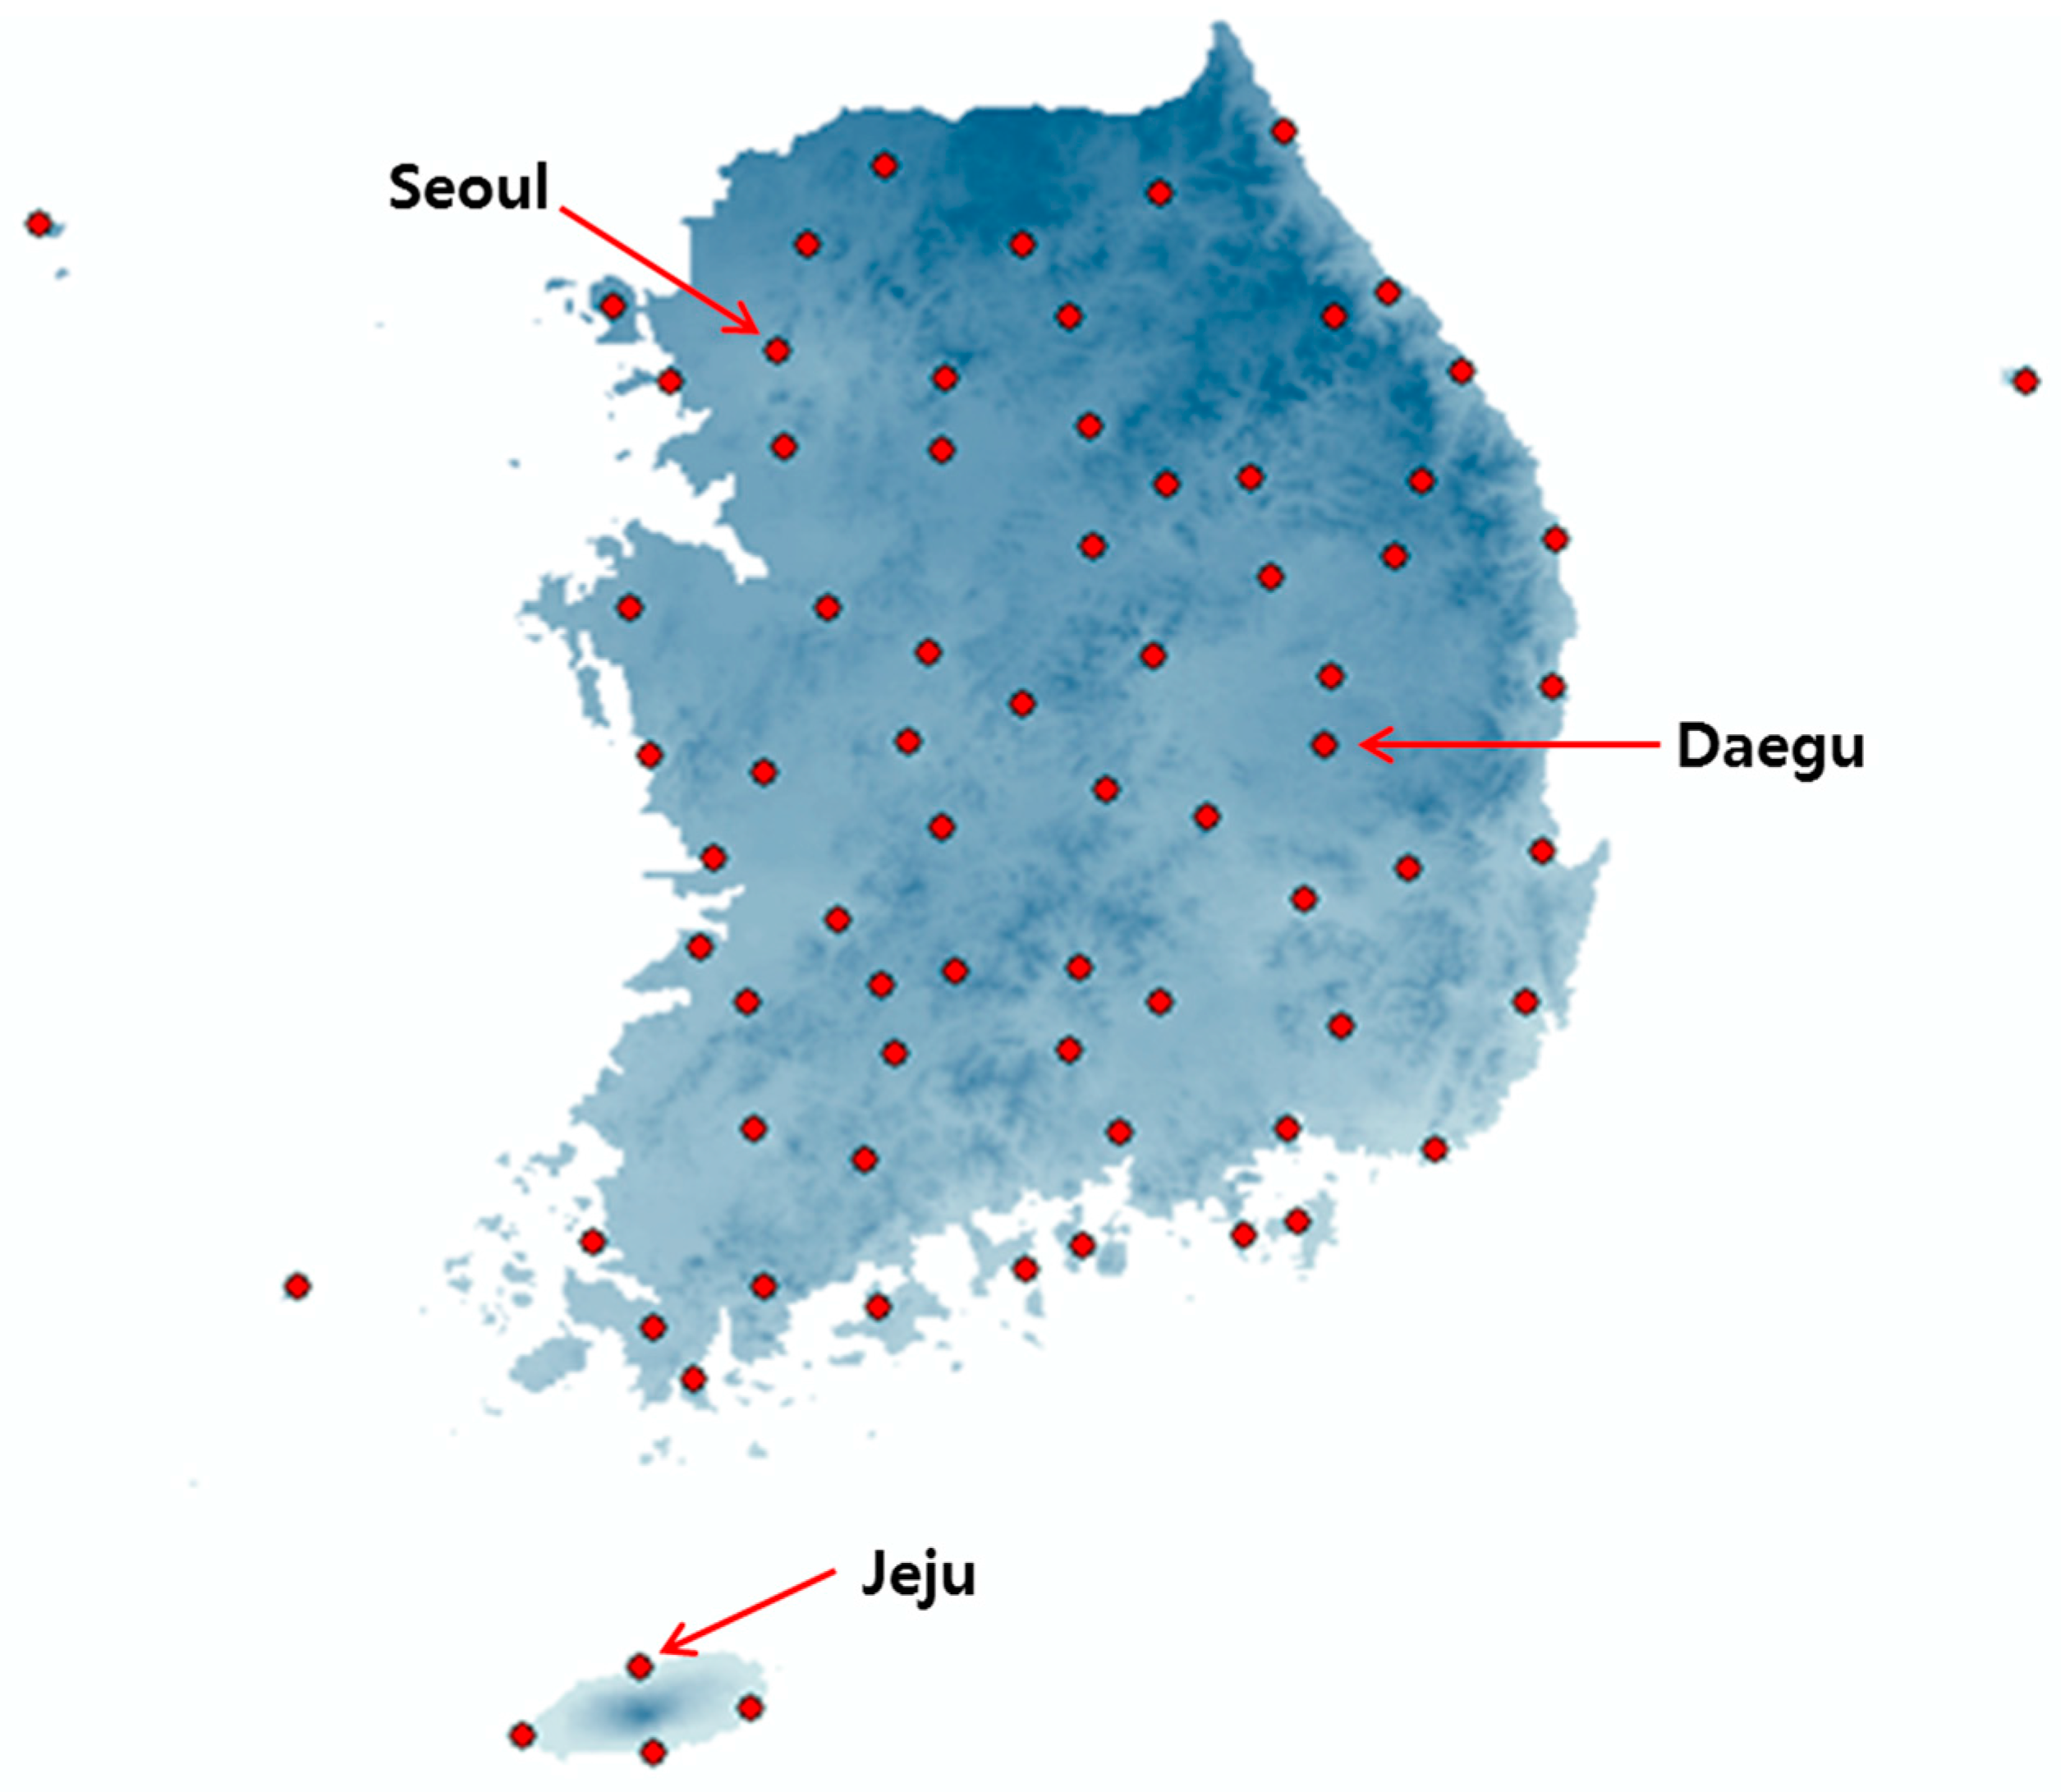
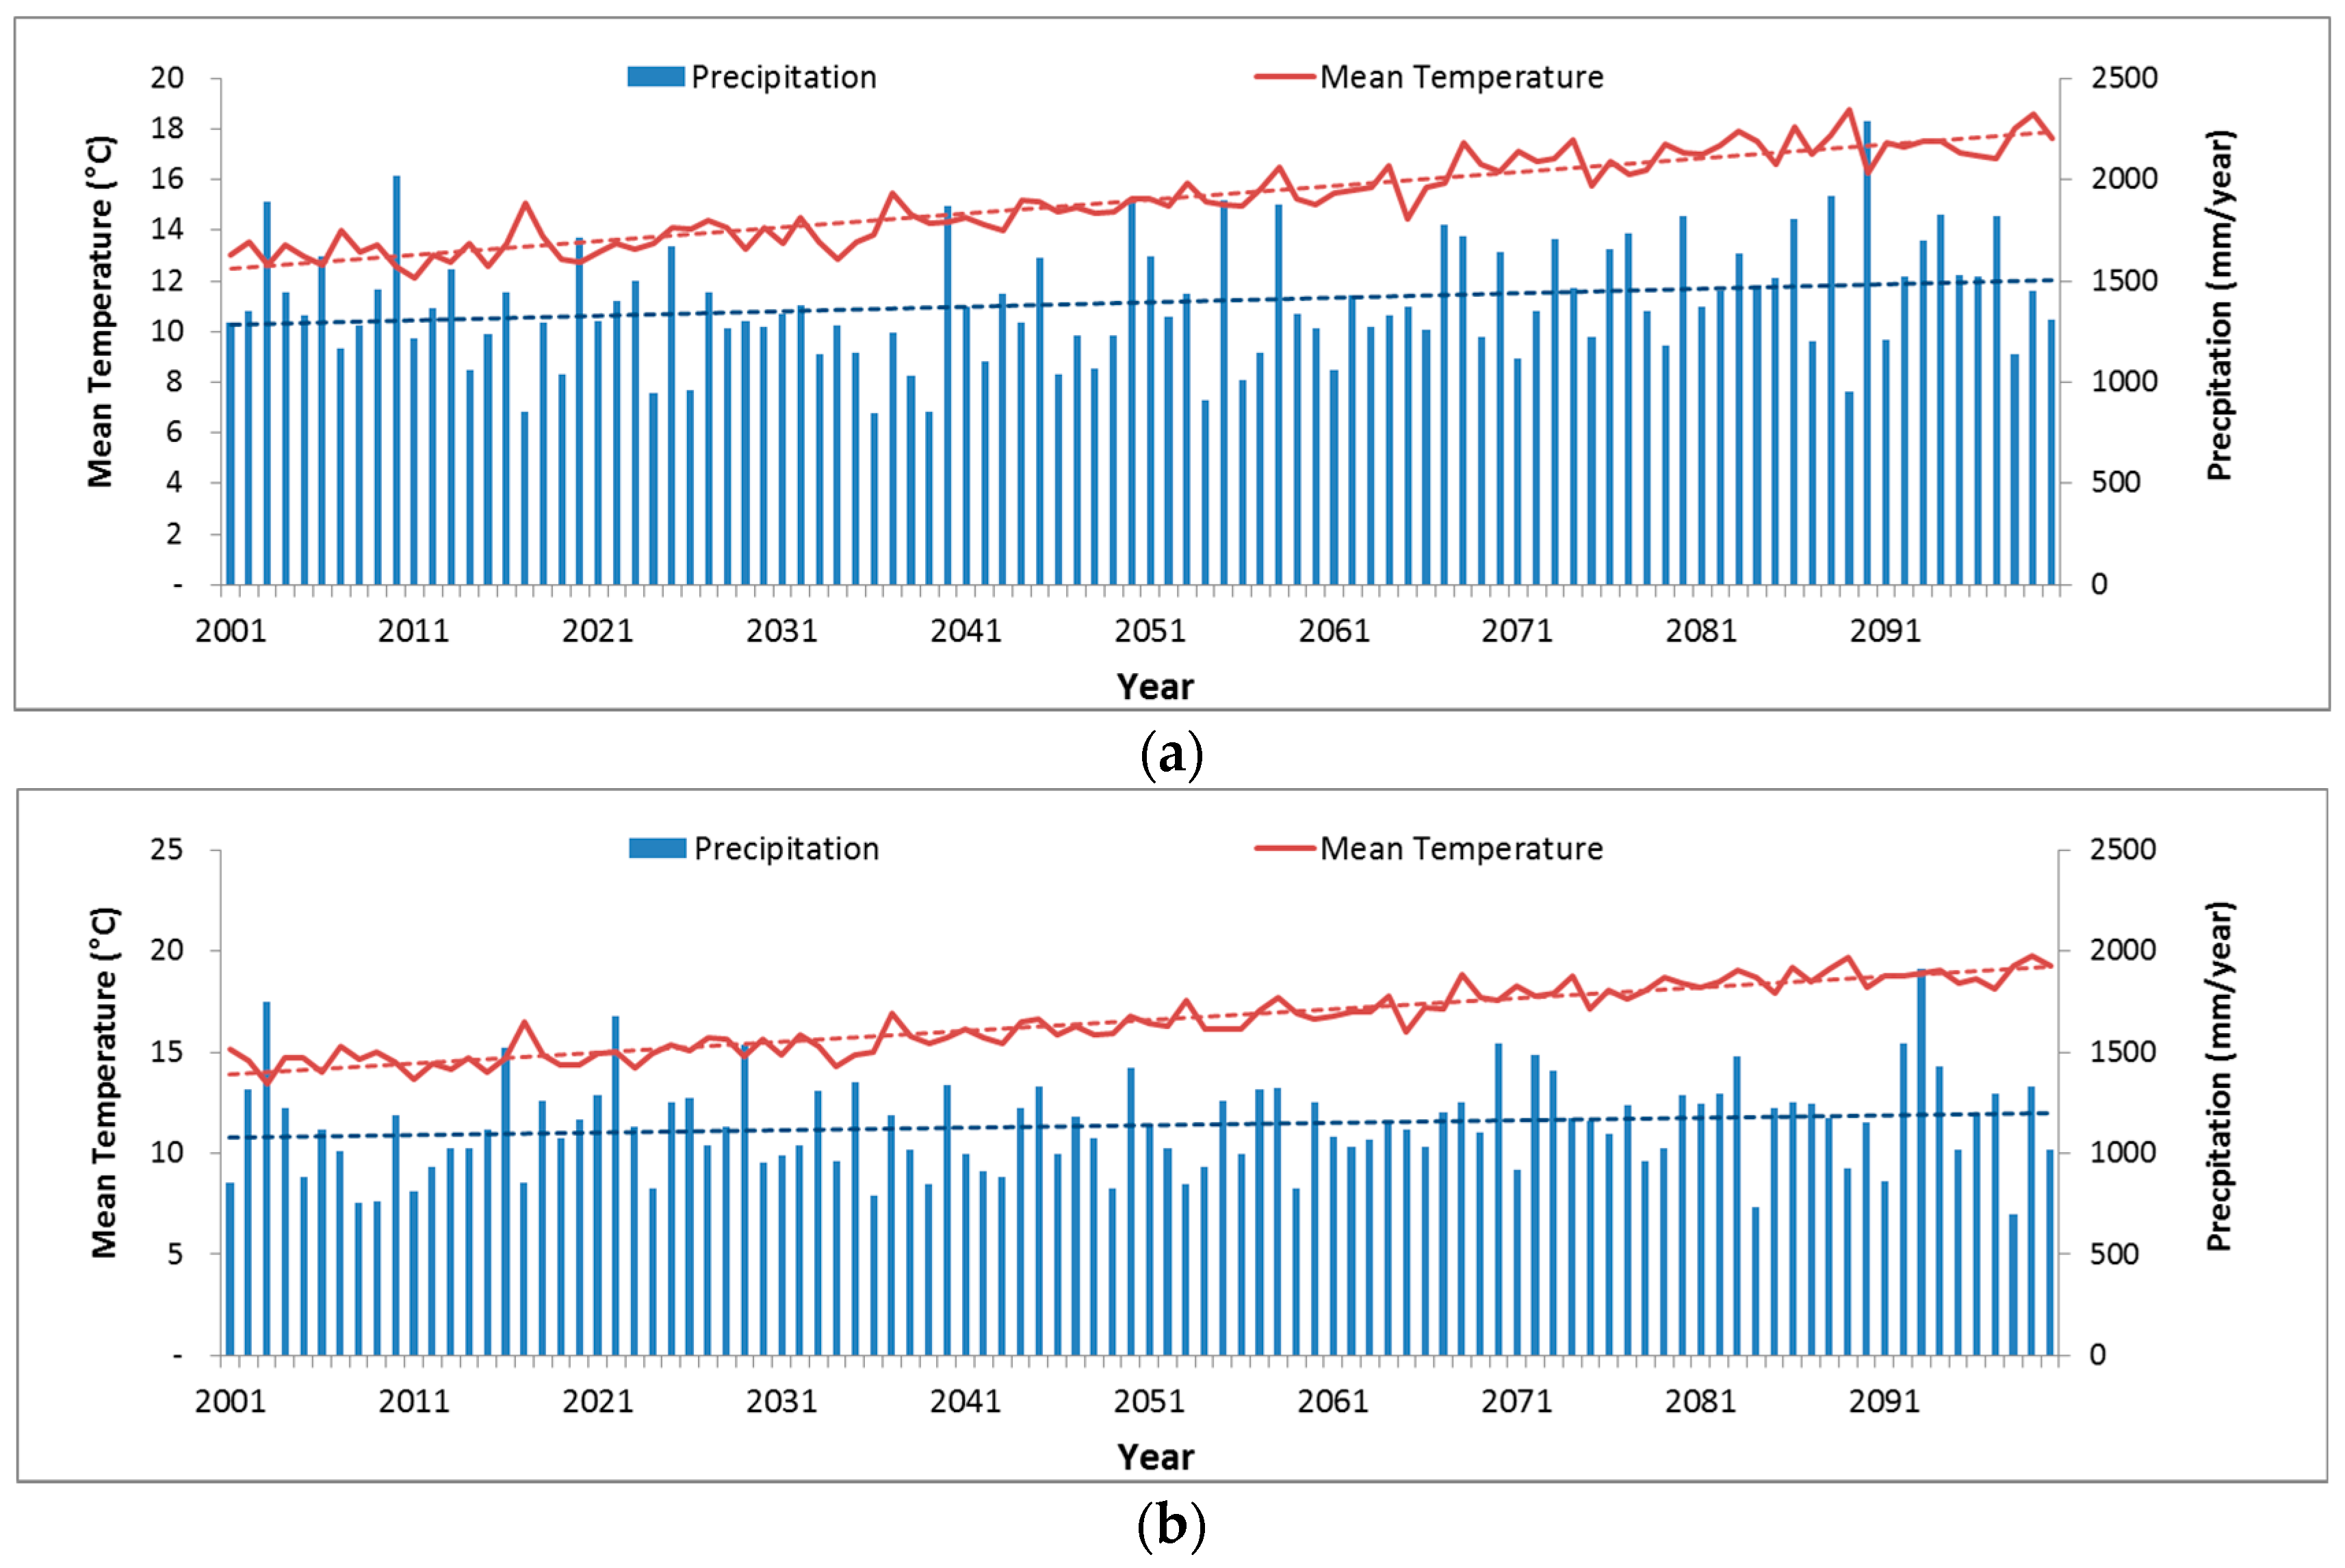
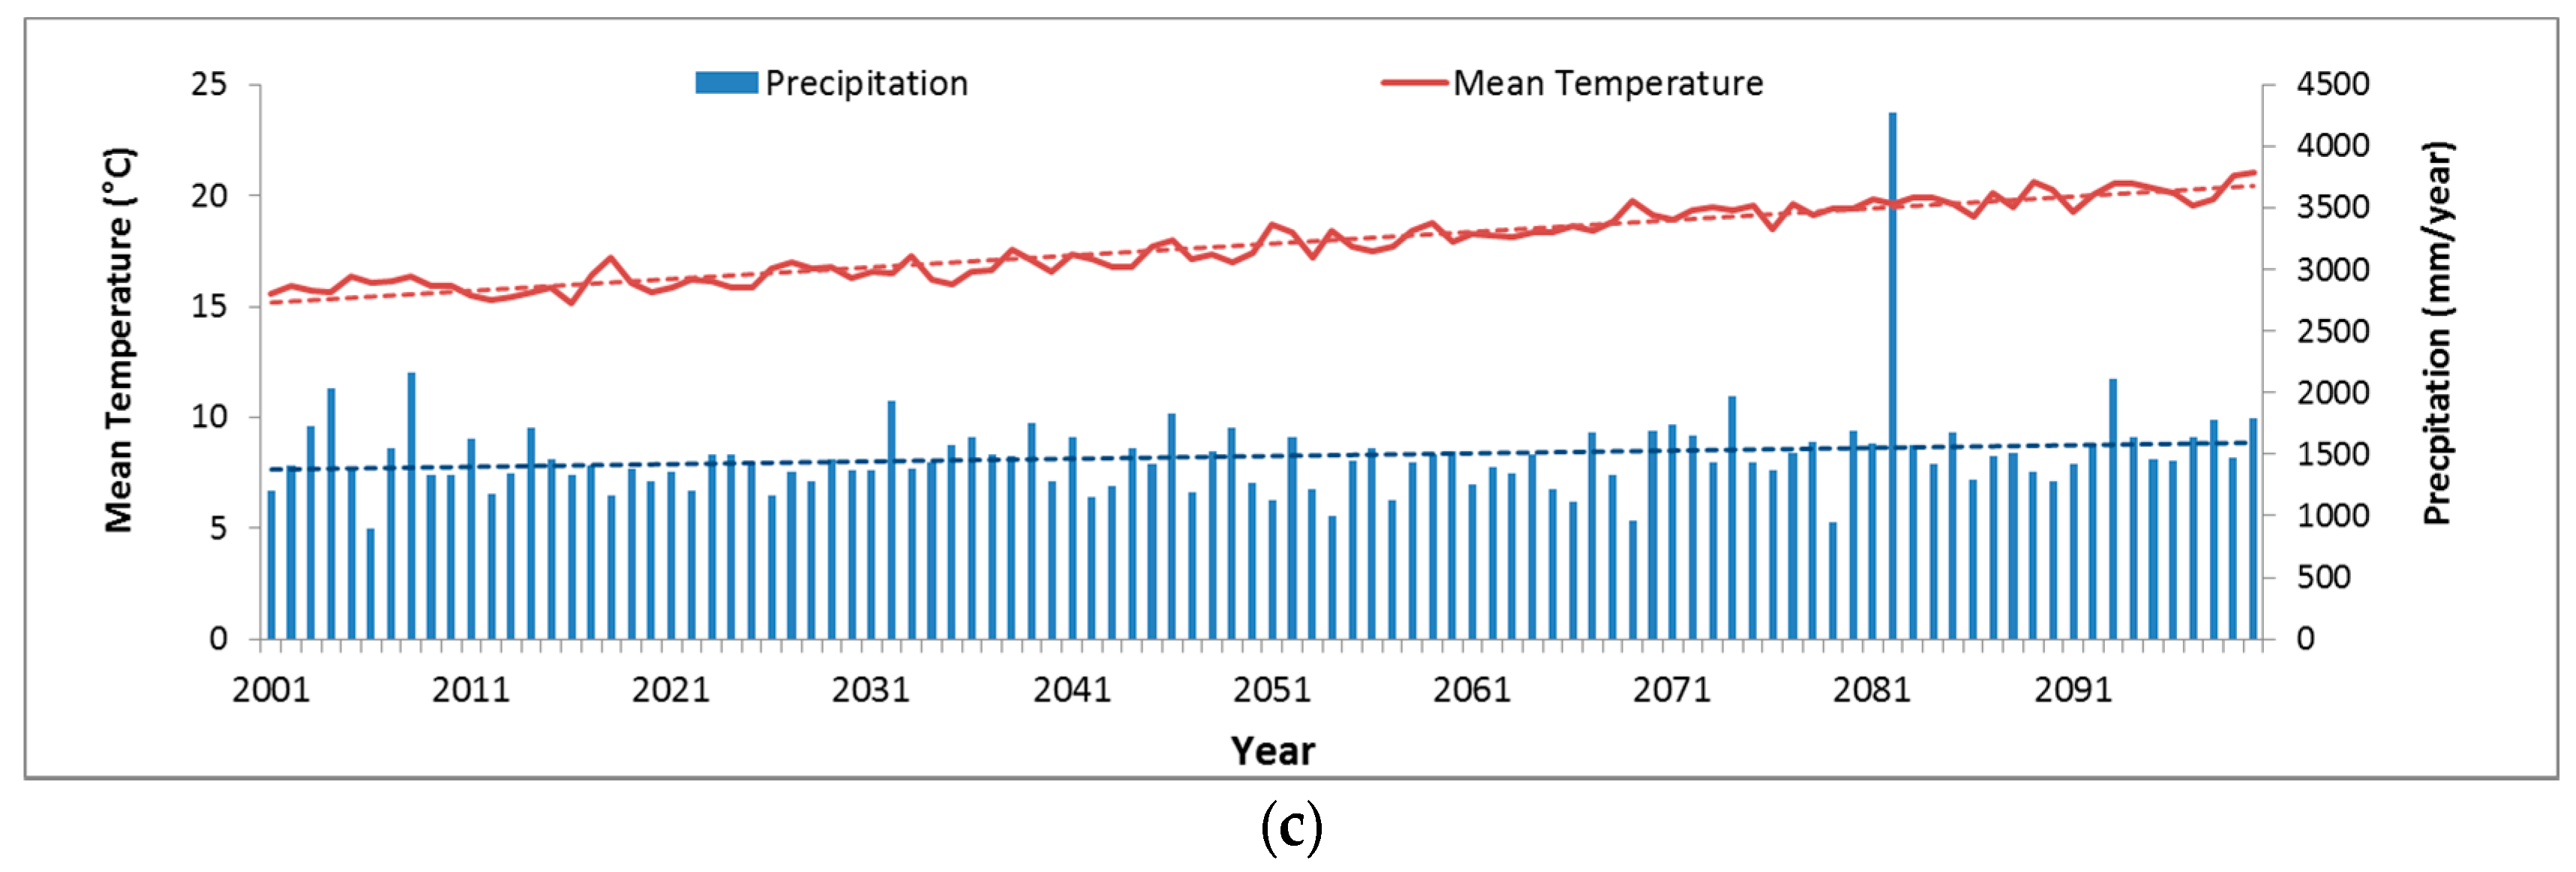
3.1. Time Series Data of Precipitation and Temperation in Major Observatories
3.2. Previous Research of Precipitation and Temperature Using GCM during 1976–2010
4. Calculation and Analysis of SPI and RDI
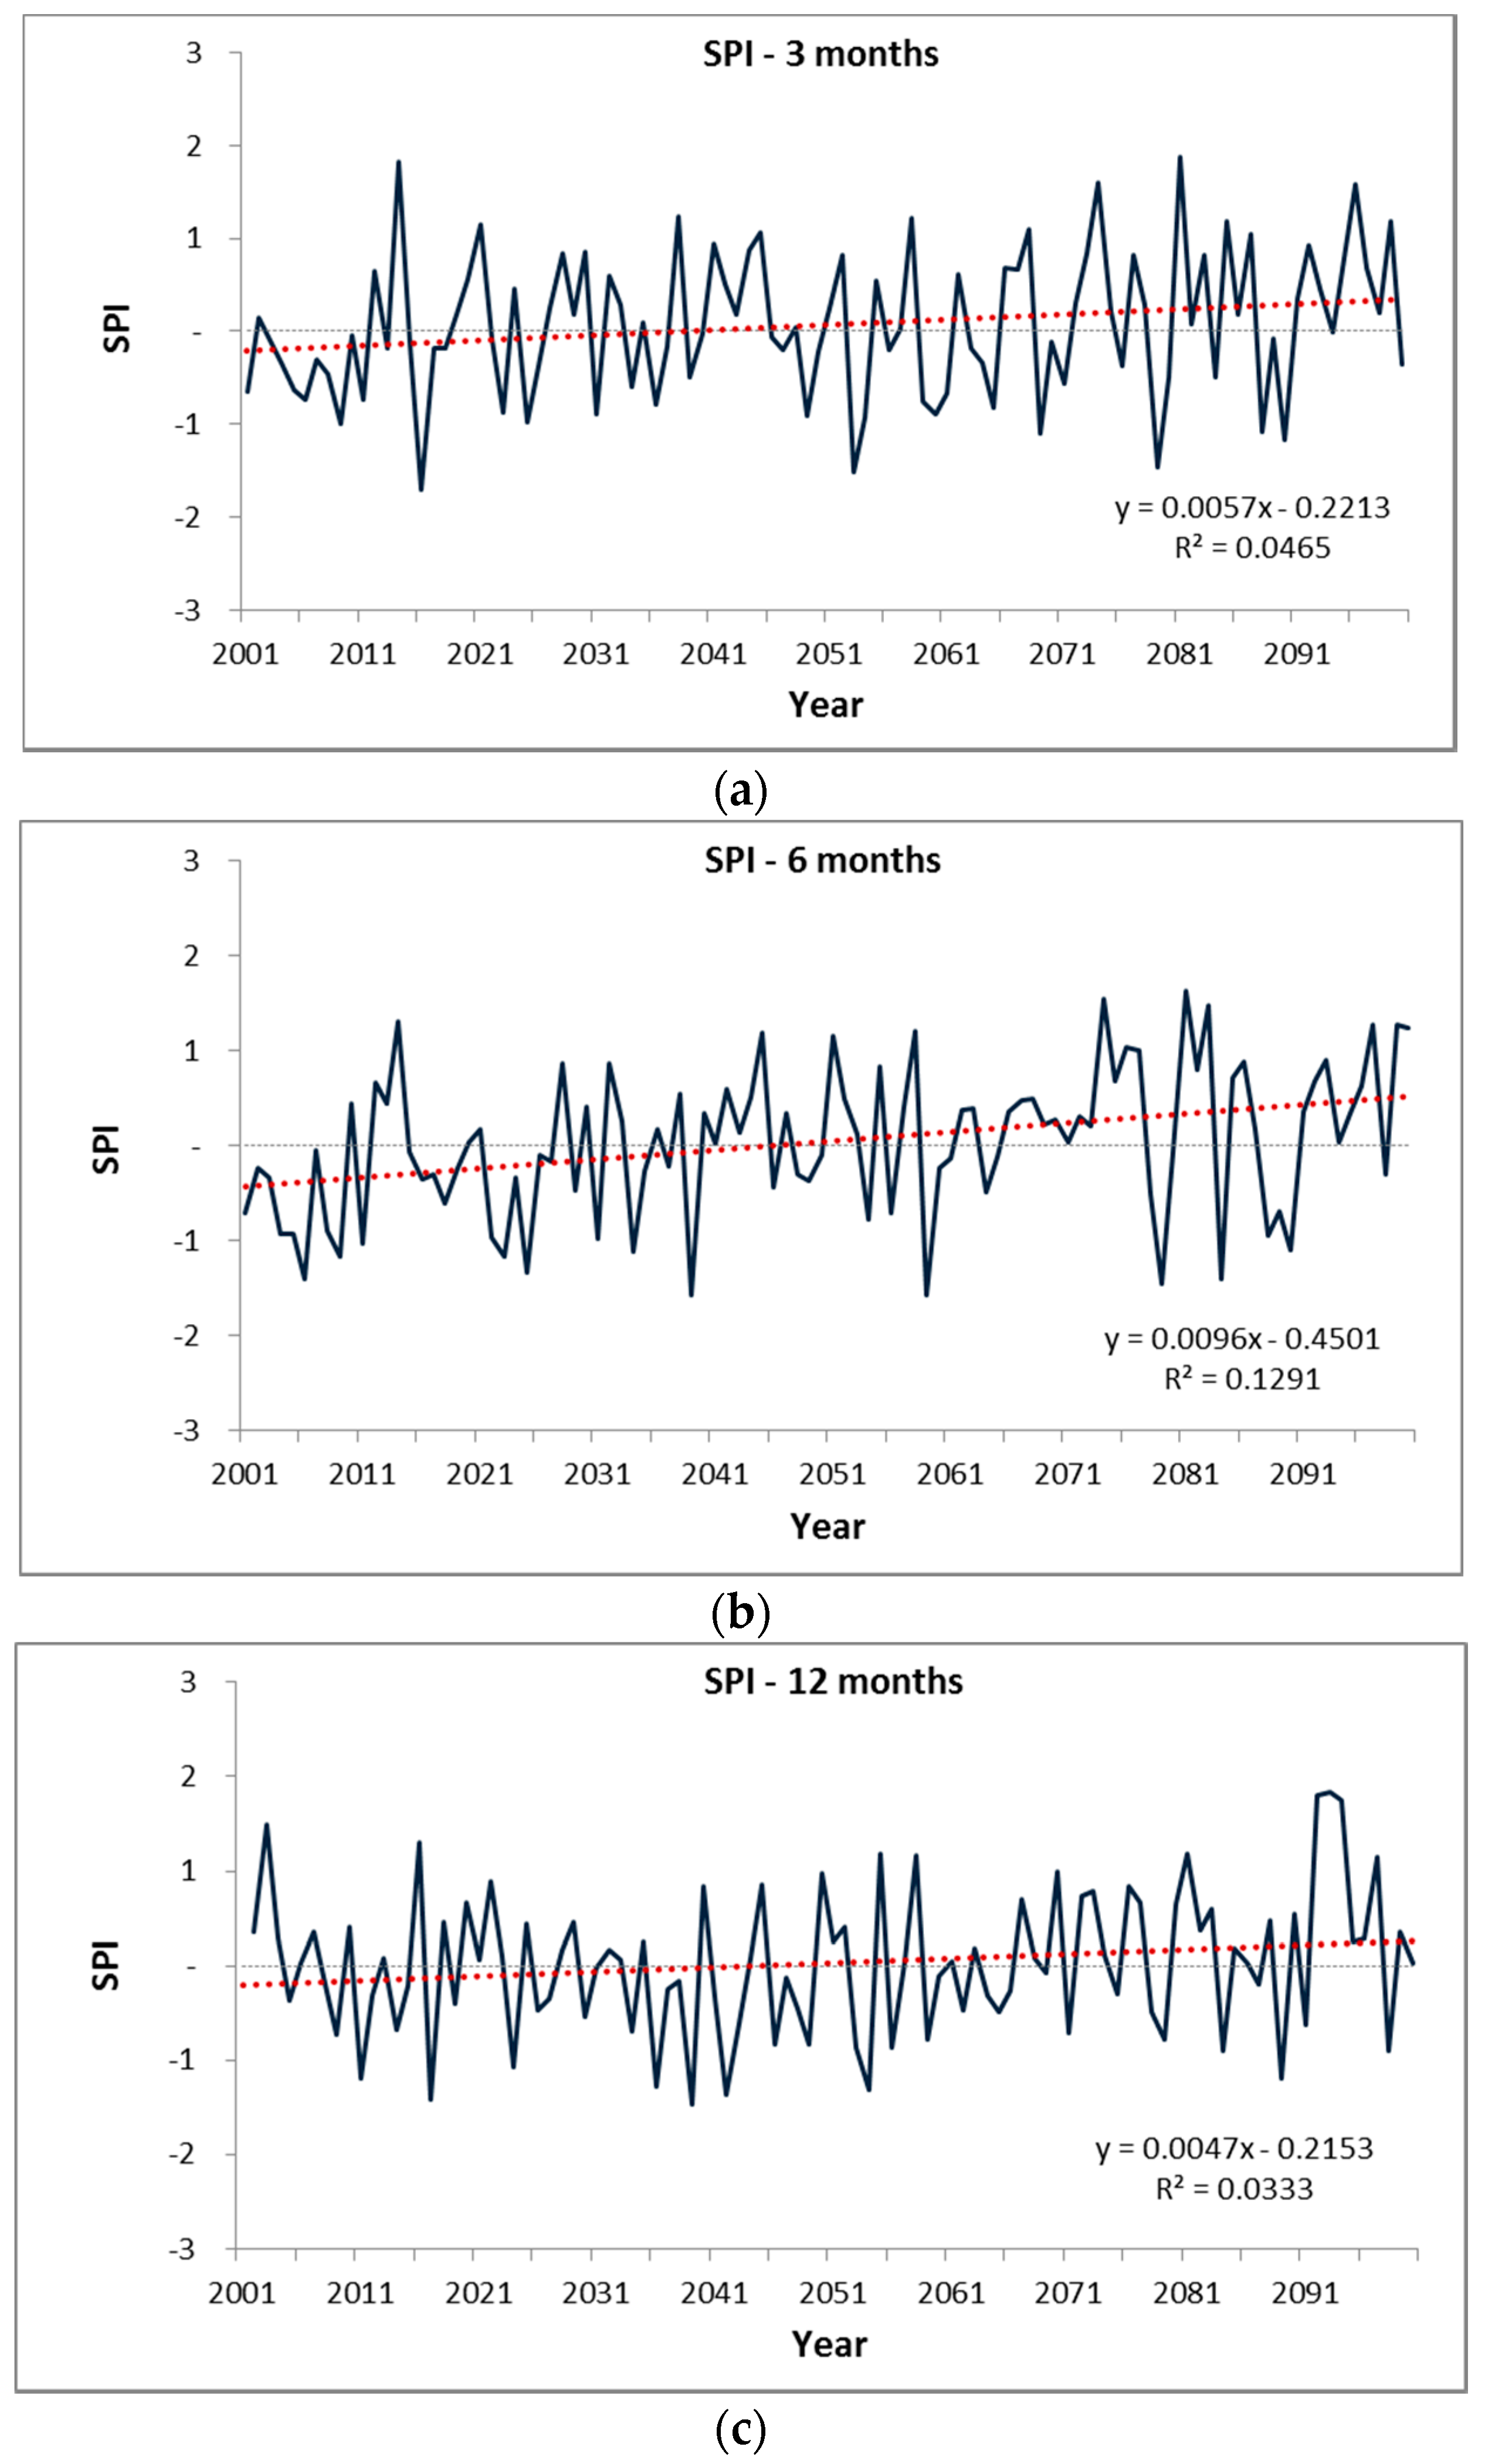
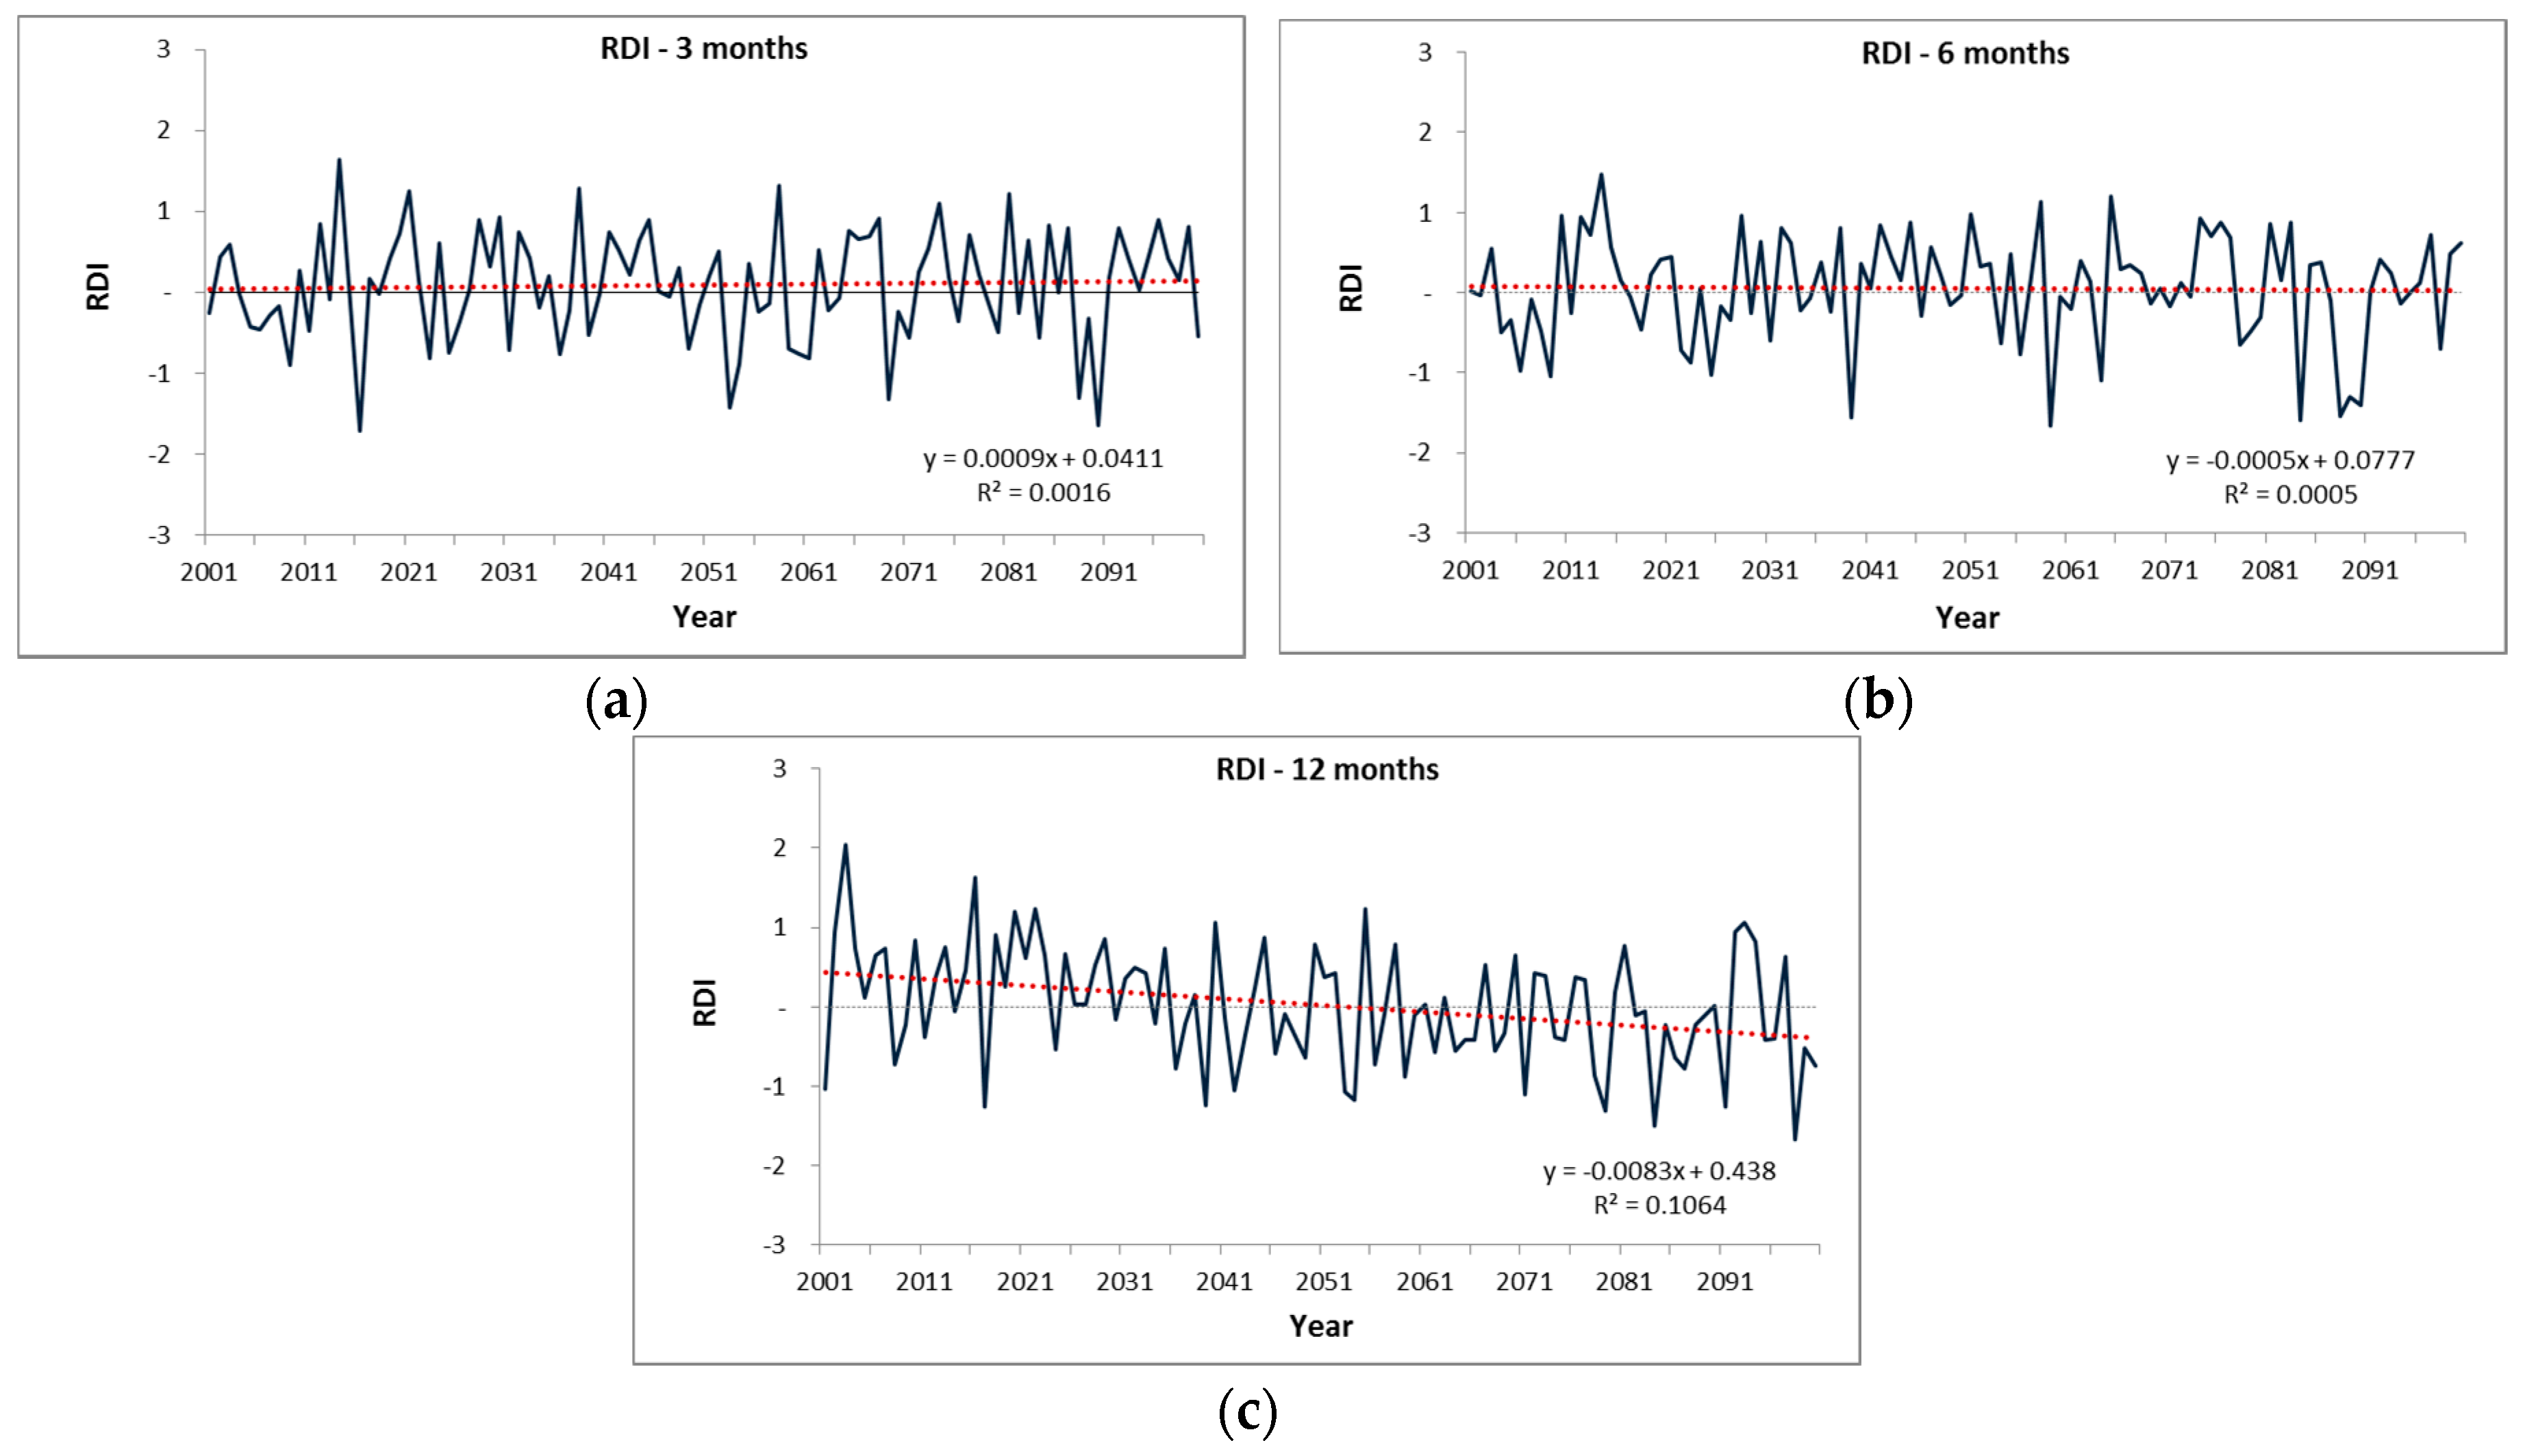
4.1. Change in Time Series of SPI and RDI
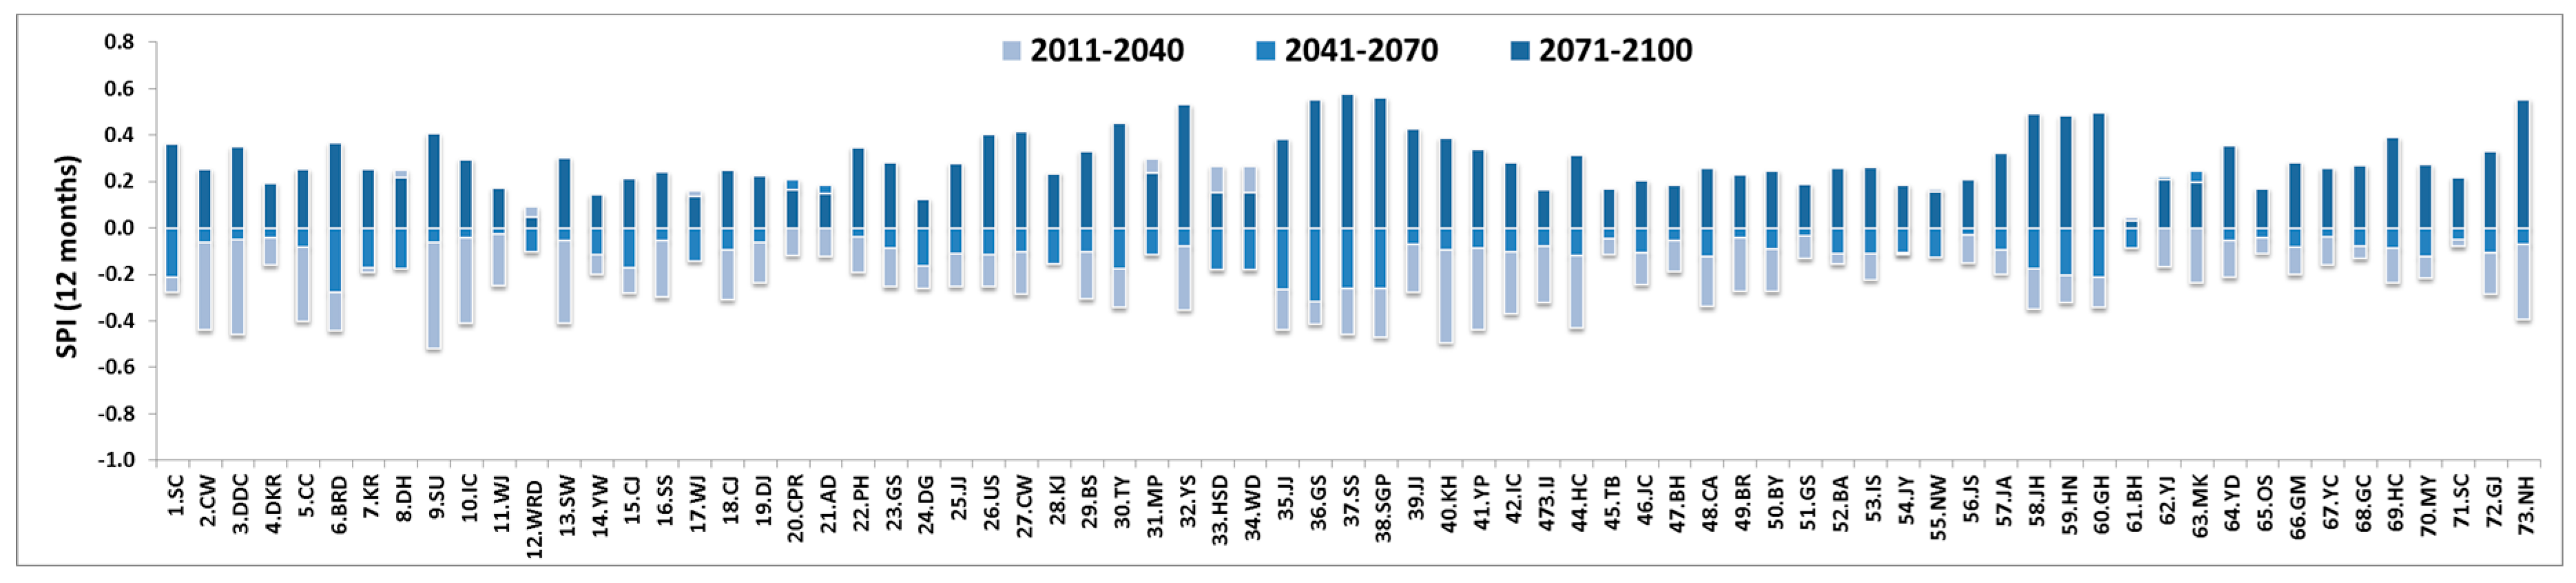
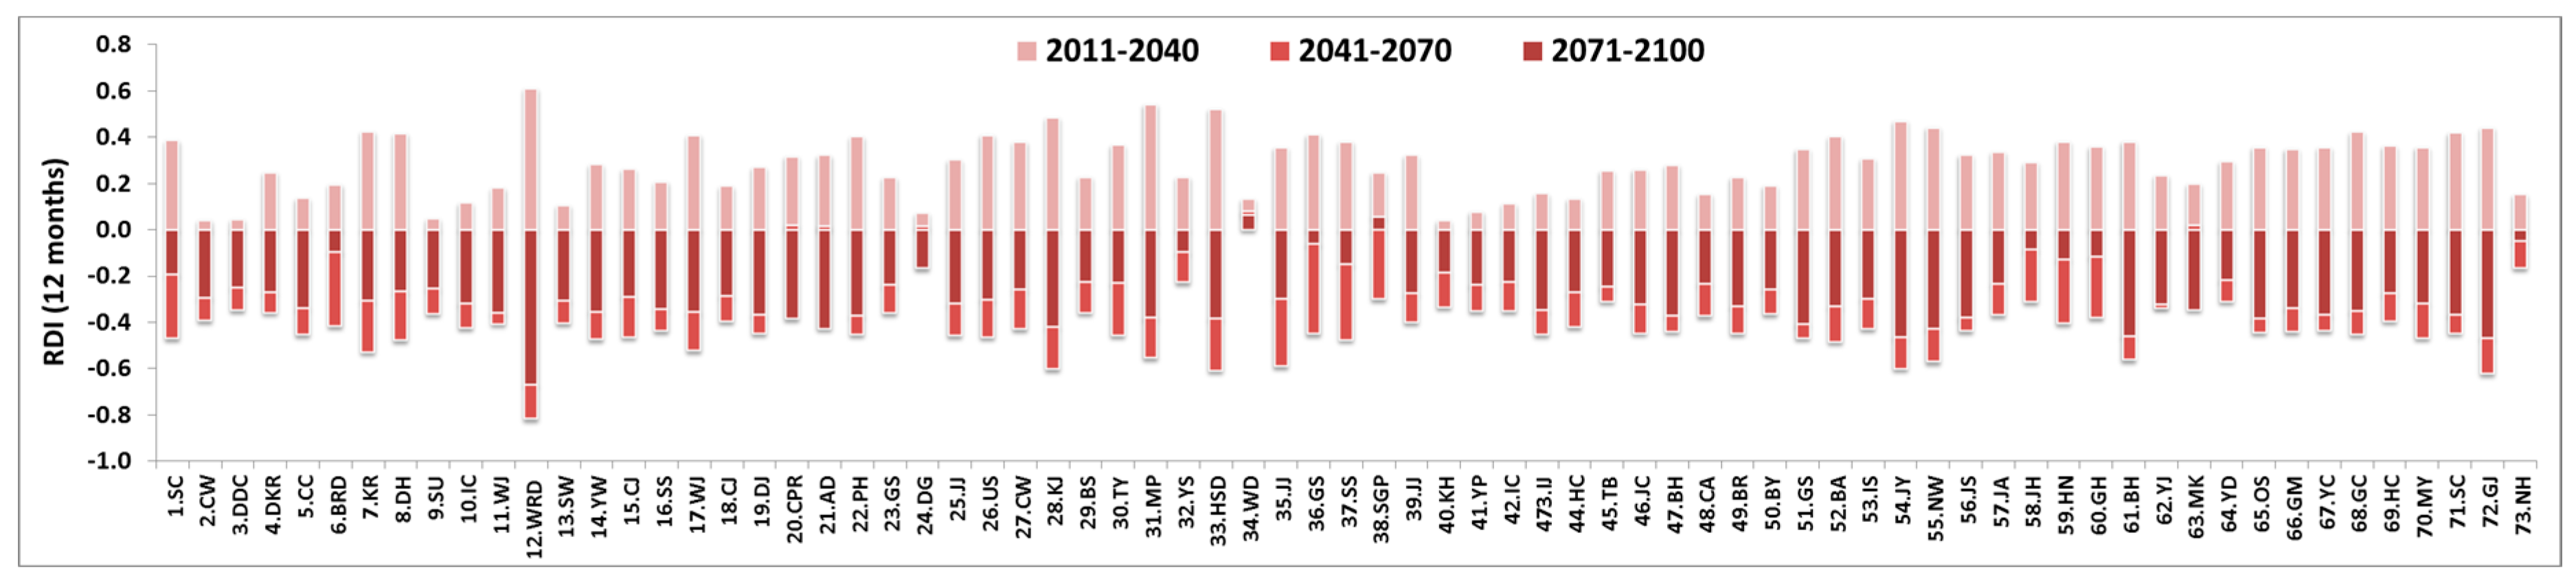
4.2. Analysis of Drought by SPI and RDI at Each Observatory
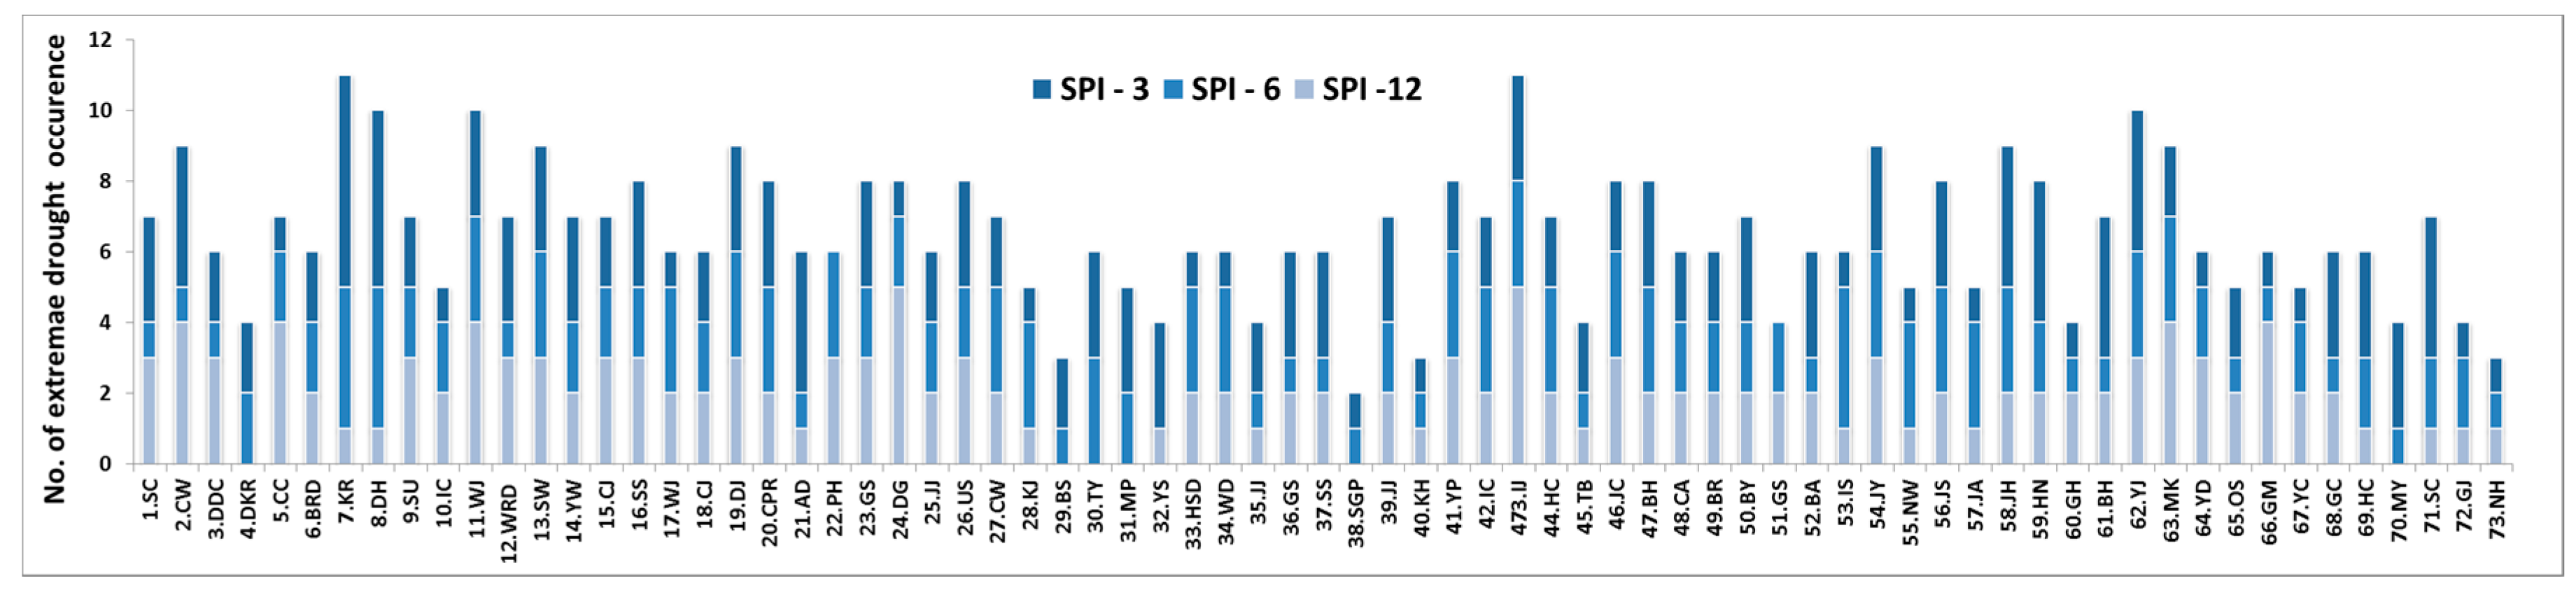
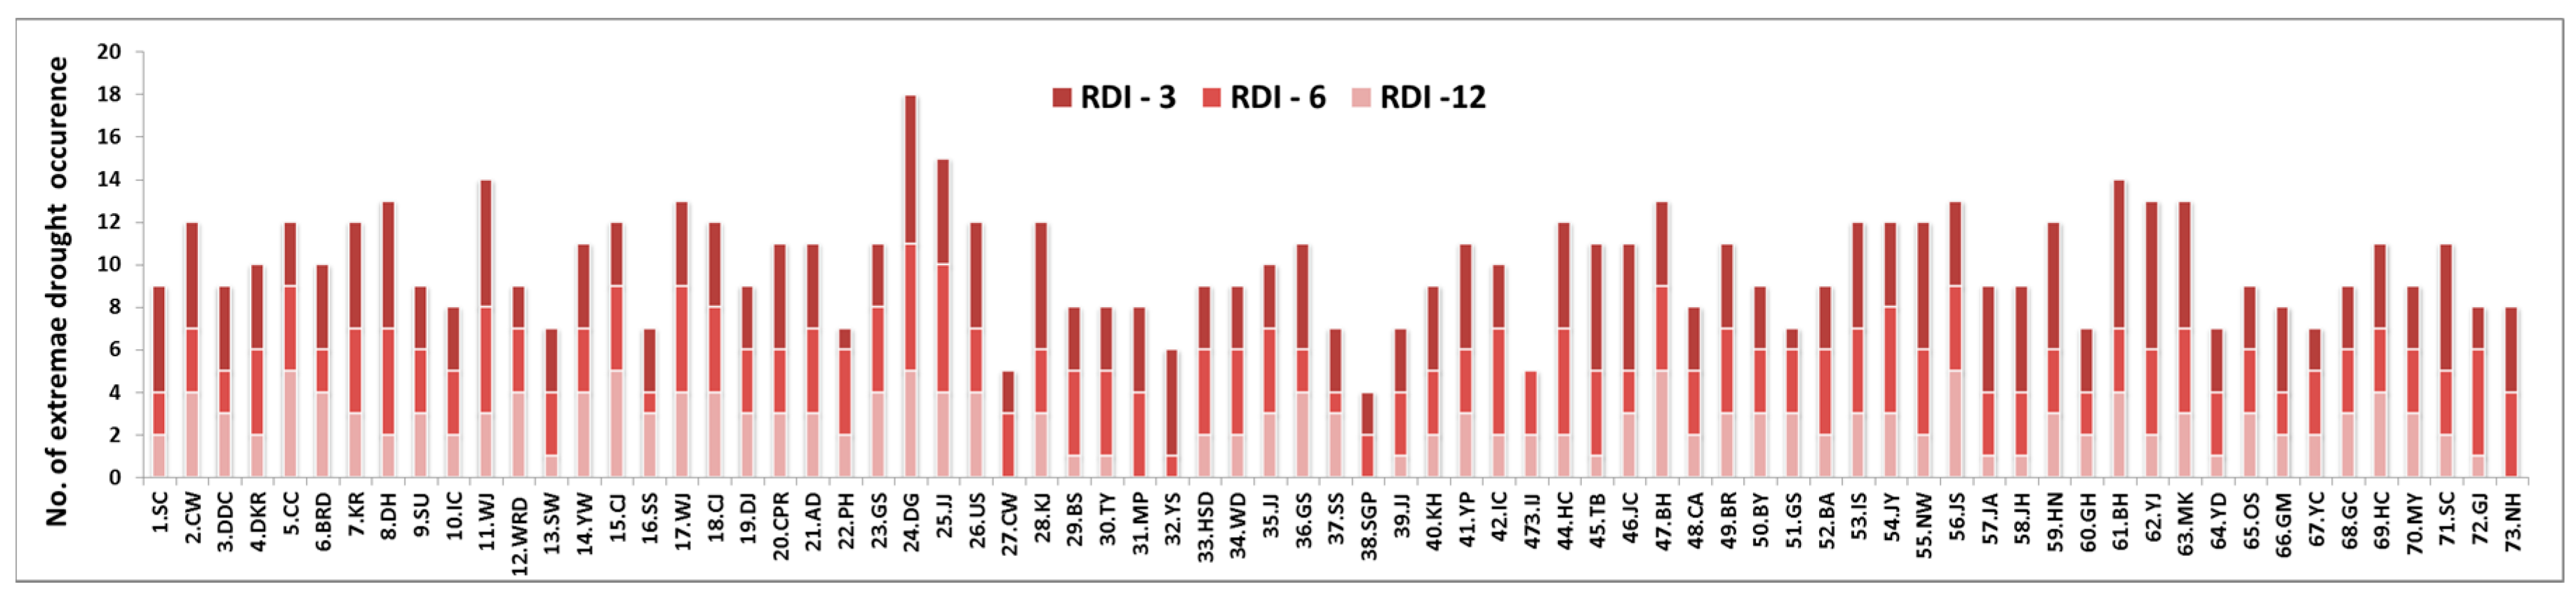
4.2.1. Occurrence of Extreme Drought at Each Observatory
4.2.2. Analysis of Extreme Drought for Each Season
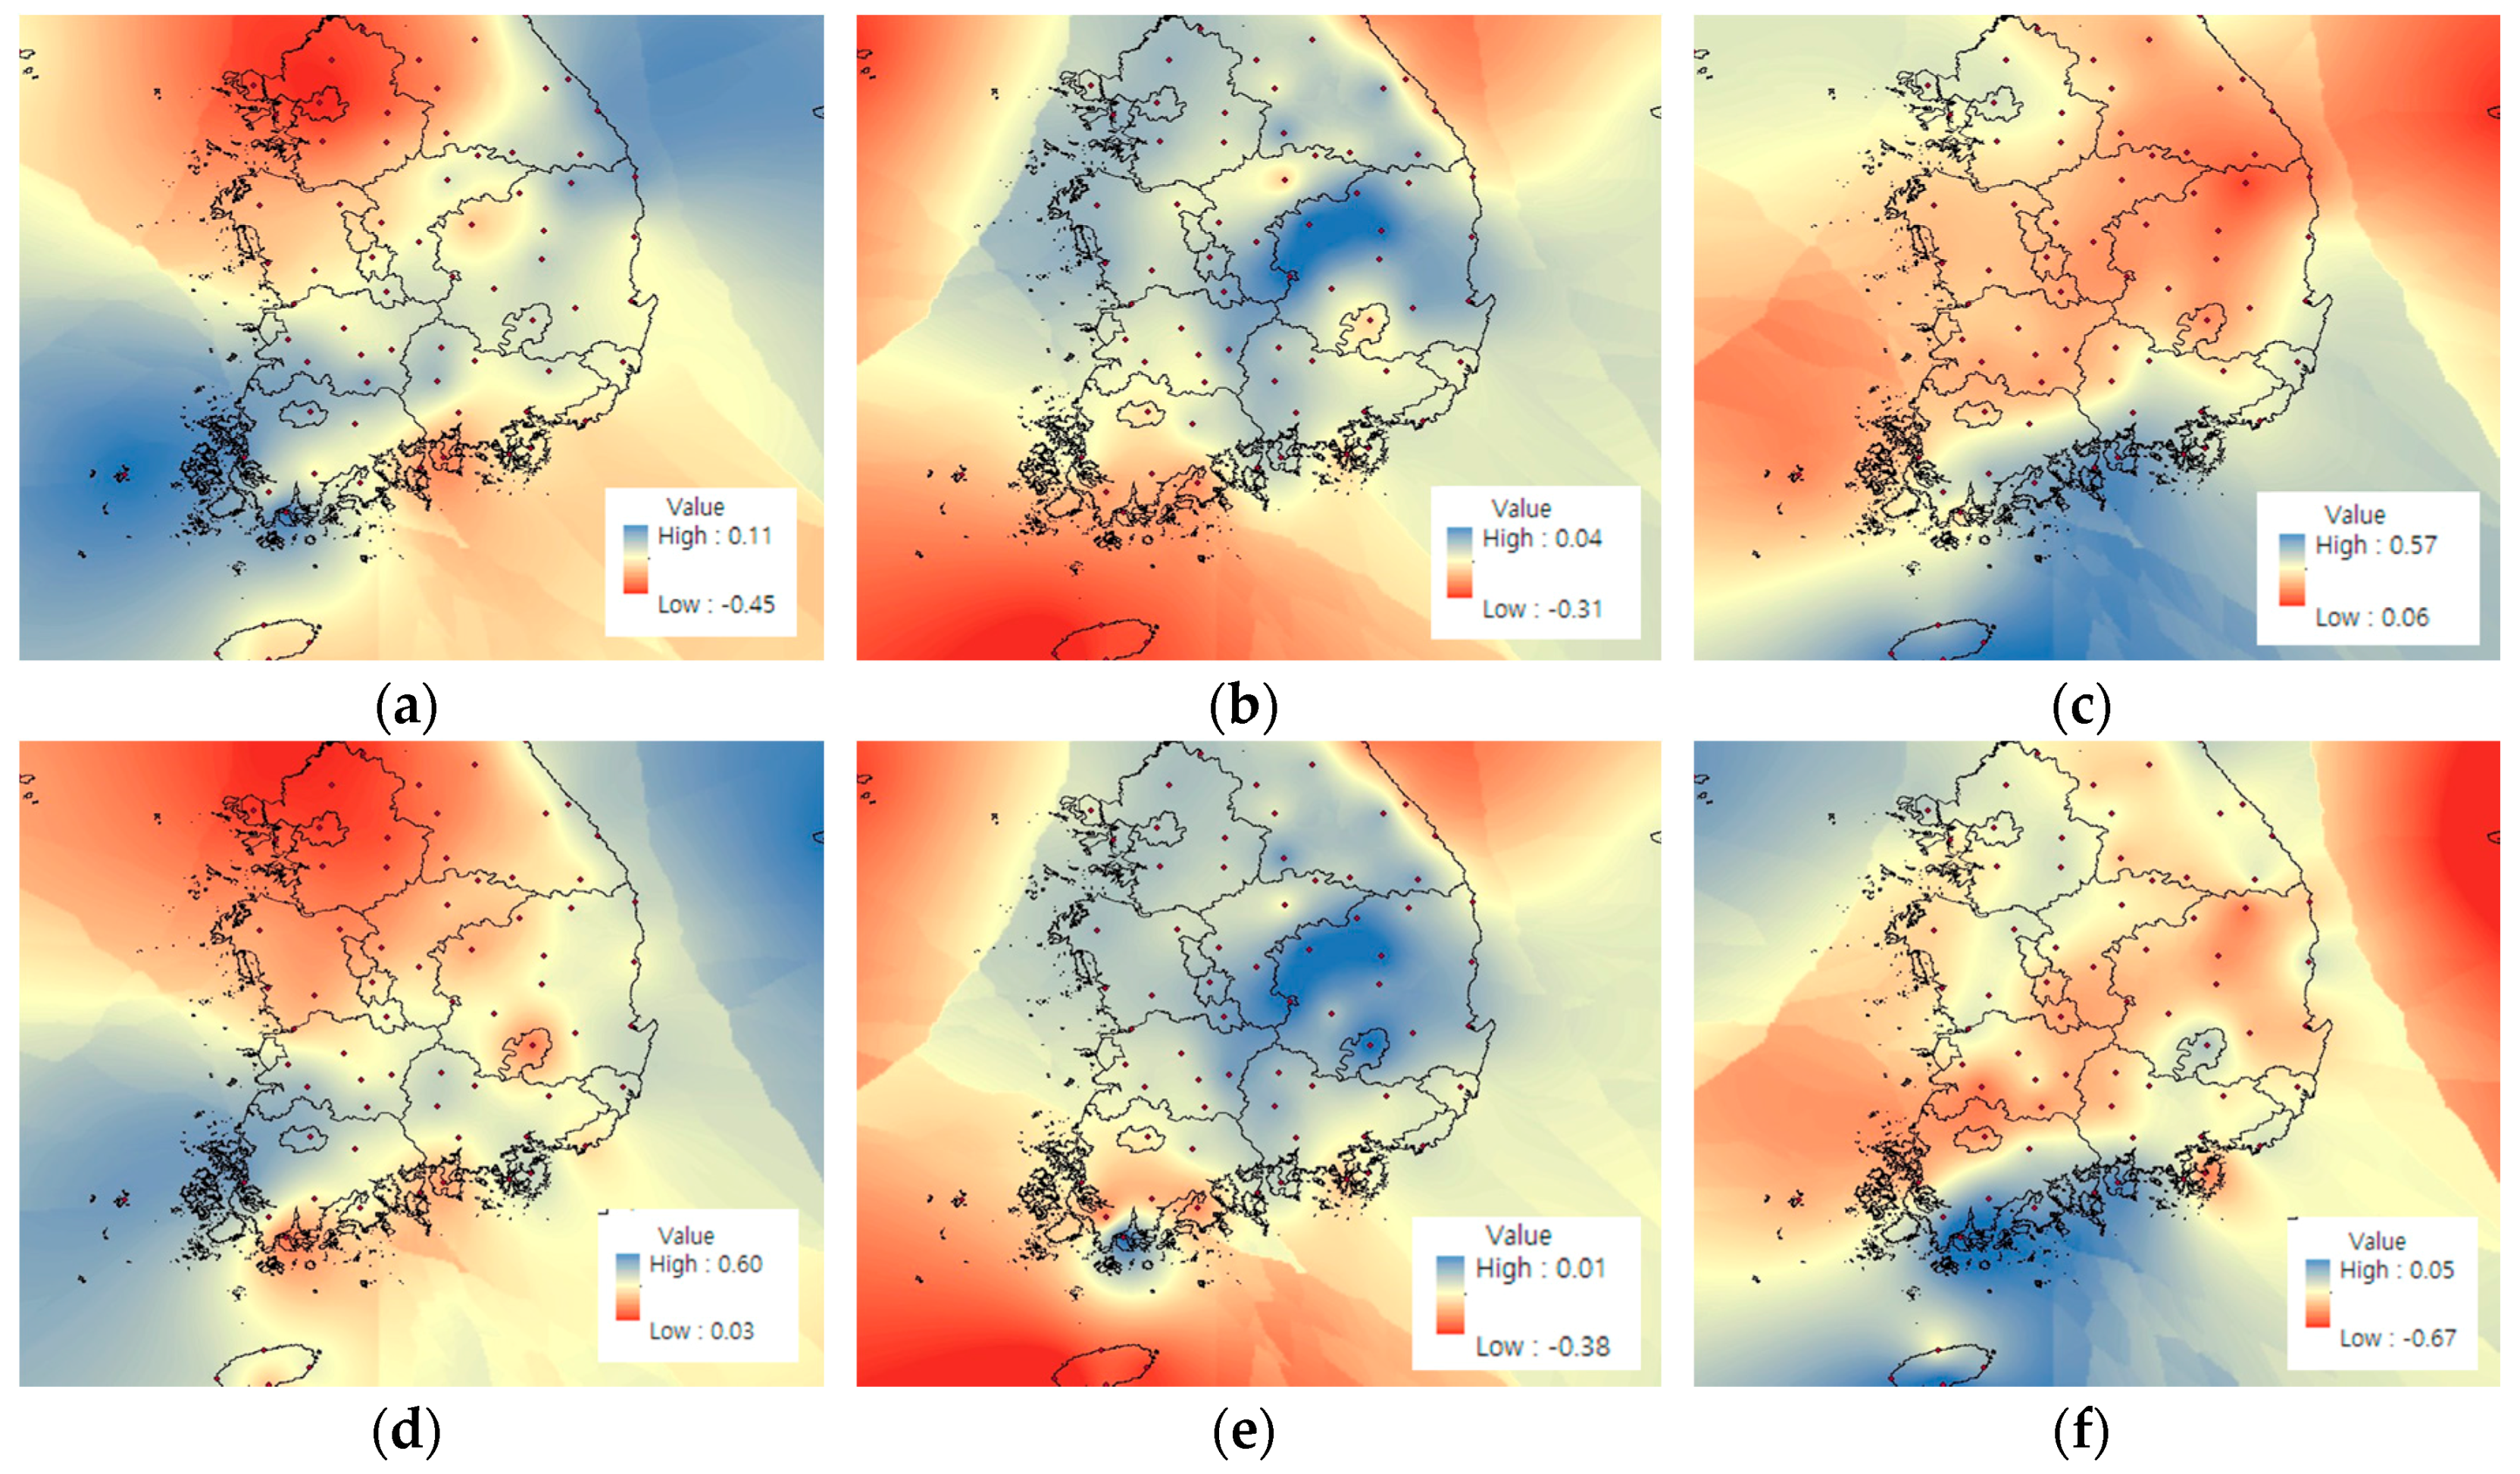
4.2.3. Distribution Map of Results by SPI & RDI
5. Conclusions
Conflicts of Interest
References
- Tigkas, D. Drought Characterisation and Monitoring in Regions of Greece. Eur. Water 2008, 23, 29–39. [Google Scholar]
- Rossi, G.; Benedini, M.; Tsakiris, G.; Giakoumakis, S. On Regional Drought Estimation and Analysis. Water Resour. Manag. 1992, 6, 249–277. [Google Scholar] [CrossRef]
- Hubbard, K. Monitoring Regional Drought Condition. In Drought Assessment, Management and Planning: Theory and Case Studies; Wilhite, D., Ed.; Kluwer Academic Publishers: Dordrecht, The Netherlands, 1993; pp. 17–30. [Google Scholar]
- Bonaccorso, B.; Bordi, I.; Cancelliere, A.; Rossi, G.; Sutera, A. Spatial Variability of Drought: An Analysis of the SPI in Sicily. Water Resour. Manag. 2003, 17, 273–396. [Google Scholar] [CrossRef]
- Cho, C.H. A Comparative Analysis of Drought Index on Major Station in Korea Using RDI. Master’s Thesis, Yonsei University, Seoul, Korea, 2008. [Google Scholar]
- Dracup, J.A.; Lee, K.S.; Paulson, E.G. On the Definition of Droughts. Water Resour. Res. 1980, 16, 297–302. [Google Scholar] [CrossRef]
- Wilhite, D.A.; Glantz, M.H. Understanding the Drought Phenomenon: The Role of Definition. Water Int. 1985, 10, 111–120. [Google Scholar] [CrossRef]
- Kim, S.M.; Park, S.W. Calculation and Comparison of Drought Indices on Major Weather Stations in Korea. J. Korean Soc. Agric. Eng. 1999, 41, 43–52. (In Korean) [Google Scholar]
- Nam, J.E.; Lee, Y.H.; Jung, K.Y. Analysis of Evapotranspiration Effect on Drought by Comparison of SPI and SPEI Drought Indices. In Proceedings of the Autumn Meeting of KMS, Daegu, Korea, 1–2 November 2012; pp. 390–391. (In Korean). [Google Scholar]
- A Kim, B.S.; Sung, J.H.; Kang, H.S.; Cho, C.H. Assessment of Drought Severity over South Korea using Standardized Precipitation Evapotranspiration Index (SPEI). J. Korea Water Resour. Assoc. 2012, 45, 887–900. (In Korean) [Google Scholar] [CrossRef]
- Mckee, T.B.; Doesken, N.J.; Kleist, J. The Relationship of Drought Frequency and Duration to Time Scales, Preprints. In Proceedings of the 8th Conference on Applied Climatology, Anaheim, CA, USA, 17–22 January 1993; pp. 179–184. [Google Scholar]
- Jang, Y.K.; Kim, S.D.; Choi, G.W. A Study of Drought Spatio-temporal Characteristics Using SPI-EOF Analysis. J. Korea Water Resour. Assoc. 2006, 39, 691–702. (In Korean) [Google Scholar]
- Yoon, Y.N.; Ahn, J.H.; Lee, D.R. An Analysis of Drought Using the Palmer’s Method. J. Korea Water Resour. Assoc. 1997, 30, 317–326. (In Korean) [Google Scholar]
- Ryu, J.H.; Lee, D.R.; Yoon, Y.N.; Ahn, J.H. A Comparative Study on the Drought Indices for Drought Evaluation. J. Korea Water Resour. Assoc. 2002, 35, 397–410. (In Korean) [Google Scholar] [CrossRef]
- Dubrovsky, M.; Svoboda, M.D.; Trnka, M.; Hayes, M.J.; Wilhite, D.A.; Zalud, Z.; Hlavinka, P. Application of Relative Drought Indices in Assessing Climate Change Impacts on Drought Conditions in Czechia. Theor. Appl. Climatol. 2008, 96, 155–171. [Google Scholar] [CrossRef]
- Vincente, S.M.; Begueria, S.; Lopez-Moreno, J.I. A Multiscalar Drought Index Sensitive to Global Warming: The Standardized Precipitation Evapotranspiration Index. J. Clim. 2010, 23, 1696–1718. [Google Scholar]
- Kim, B.S.; Sung, J.H.; Lee, B.H.; Kim, D.J. Evaluation on the Impact of Extreme Droughts in South Korea using the SPEI and RCP8.5 Climate Change Scenario. J. Korean Soc. Hazard Mitig. 2013, 13, 97–109. (In Korean) [Google Scholar] [CrossRef]
- Abramopoulos, F.; Rosenzweig, C.; Choudhury, B. Improved Ground Hydrology Calculations for Global Climate Models (GCMs): Soil Water Movement and Evapotranspiration. J. Clim. 1988, 1, 921–941. [Google Scholar] [CrossRef]
- Hu, Q.; Willson, G.D. Effect of Temperature Anomalies on the Palmer Drought Severity Index in the Central United States. Int. J. Climatol. 2000, 20, 1899–1911. [Google Scholar] [CrossRef]
- Mavromatis, T. Drought Index Evaluation for Assessing Future Wheat Production in Greece. Int. J. Climatol. 2007, 27, 911–924. [Google Scholar] [CrossRef]
- Kempes, C.P.; Myers, O.B.; Breshears, D.D.; Ebersole, J.J. Comparing Response of Pinus Edulis Treering Growth to Five Alternate Moisture Indices Using Historic Meteorological Data. J. Arid Environ. 2008, 72, 350–357. [Google Scholar] [CrossRef]
- IPCC. Climate Change 2007: The Physical Science Basis, Contribution of Working Group I to the Fourth Assessment. In Report of the Inter-governmental Panel on Climate Change; Solomon, S., Qin, D., Manning, M., Chen, Z., Marquis, M., Averyt, K.B., Tignor, M., Miller, H.L., Eds.; Cambridge University Press: Cambridge, UK; New York, NY, USA, 2007. [Google Scholar]
- Moss, R.H.; Edmonds, J.A.; Hibbard, K.A.; Manning, M.R.; Rose, S.K.; Van Vuuren, D.P.; Carter, T.R.; Emori, S.; Kainuma, M.; Kram, T.; et al. The next generation of scenarios for climate change research and assessment. Nature 2010, 463, 747–756. [Google Scholar] [CrossRef] [PubMed]
- Van Vuuren, D.P.; Edmonds, J.; Kainuma, M.; Riahi, K.; Thomson, A.; Hibbard, K.; Hurtt, G.C.; Kram, T.; Krey, V.; Lamarque, J.F.; et al. Representative concentration pathways: An overview. Clim. Chang. 2011, 109, 5–31. [Google Scholar] [CrossRef]
- Fischer, G.; Tubiello, F.N.; Velthuizen, H.; Wiberg, D.A. Climate Change Impacts on Irrigation Water Requirements: Effects of Mitigation. Technol. Forecast. Soc. Chang. 2007, 74, 1083–1107. [Google Scholar] [CrossRef]
- IPCC. Towards New Scenarios for Analysis of Emissions, Climate Change, Impacts, and Response Strategies. In Proceedings of the IPCC Expert Meeting Report on New Scenarios, Intergovernmental Panel on Climate Change, Noordwijkerhout, The Netherlands, 19–21 September 2007. [Google Scholar]
- Riahi, K.; Rao, S.; Krey, V.; Cho, C.; Chirkov, V.; Fisher, G.; Kindermann, G.; Nakicenovic, N.; Rafaj, P. RCP 8.5—A Scenario of Comparatively High Greenhouse Gas Emissions. Clim. Chang. 2011, 109, 33–57. [Google Scholar] [CrossRef]
- Tsakiris, G.; Vangelis, H. Establishing a Drought Index Incorporating Evapotranspiration. Eur. Water 2005, 9, 3–11. [Google Scholar]
- Tsakiris, G.; Pangalou, D.; Vangelis, H. Regional Drought Assessment Based on the Reconnaissance Drought Index (RDI). Water Resour. Manag. 2007, 21, 821–833. [Google Scholar] [CrossRef]
- Khalili, D.; Farnoud, T.; Jamshidi, H.; Kamgar-Haghighi, A.A.; Zand-Parsa, S. Comparability Analyses of the SPI and RDI Meteorological Drought Indices in Different Climatic Zones. Water Resour. Manag. 2011, 25, 1737–1757. [Google Scholar] [CrossRef]
- Zarch, M.A.A.; Sivakumar, B.; Sharma, A. Droughts in a Warming Climate: A Global Assessment of Standardized Precipitation Index (SPI) and Reconnaissance Drought Index (RDI). J. Hydrol. 2015, 526, 183–195. [Google Scholar] [CrossRef]
- Xu, C.Y.; Singh, V.P. Evaluation of Three Complementary Relationship Evapotranspiration Models by Water Balance Approach to Estimate Actual Regional Evapotranspiration in Different Climatic Regions. J. Hydrol. 2005, 308, 105–121. [Google Scholar] [CrossRef]
- Droogers, P.; Allen, R.G. Estimating Reference Evapotranspiration under Inaccurate Data Conditions. Irrig. Drain. Syst. 2002, 16, 33–45. [Google Scholar] [CrossRef]
- Yin, Y.; Wu, S.; Zheng, D.; Yang, Q. Radiation Calibration of FAO56 Penman Monteith Model to Estimate Reference Crop Evapotranspiration in China. Agric. Water Manag. 2008, 95, 77–84. [Google Scholar] [CrossRef]
- Allen, R.G.; Pereira, L.S.; Raes, D.; Smith, M. Crop Evapotranspiration; FAO Irrigation and Drainage Paper, 56; Food and Agriculture Organization: Rome, Italiy, 1998. [Google Scholar]
- Maurer, E.P. Uncertainty in Hydrologic Impacts of Climate Change in the Sierra Nevada, California, Under Two Emissions Scenarios. Clim. Chang. 2007, 82, 309–325. [Google Scholar] [CrossRef]
- Park, B.S.; Lee, J.H.; Kim, C.J.; Jang, H.W. Projection of Future Drought of Korea Based on Probabilistic Approach Using Multi-model and Multi Climate Change Scenarios. J. Korean Soc. Civ. Eng. 2013, 33, 1871–1885. (In Korean) [Google Scholar] [CrossRef]
- Kim, G.S.; Lee, J.W. Evaluation of Drought Indices Using the Drought Records. J. Korea Water Resour. Assoc. 2011, 44, 639–652. (In Korean) [Google Scholar] [CrossRef]


| SPI and RDI Values | Classification |
|---|---|
| 2.0+ | Extremely Wet |
| 1.5 to 1.99 | Very Wet |
| 1.0 to 1.49 | Moderately Wet |
| −0.99 to 0.99 | Near Normal |
| −1.0 to −1.49 | Moderately Dry |
| −1.5 to −1.99 | Severely Dry |
| −2 and less | Extremely Dry |
© 2018 by the author. Licensee MDPI, Basel, Switzerland. This article is an open access article distributed under the terms and conditions of the Creative Commons Attribution (CC BY) license (http://creativecommons.org/licenses/by/4.0/).
Share and Cite
Jang, D. Assessment of Meteorological Drought Indices in Korea Using RCP 8.5 Scenario. Water 2018, 10, 283. https://doi.org/10.3390/w10030283
Jang D. Assessment of Meteorological Drought Indices in Korea Using RCP 8.5 Scenario. Water. 2018; 10(3):283. https://doi.org/10.3390/w10030283
Chicago/Turabian StyleJang, Dongwoo. 2018. "Assessment of Meteorological Drought Indices in Korea Using RCP 8.5 Scenario" Water 10, no. 3: 283. https://doi.org/10.3390/w10030283
APA StyleJang, D. (2018). Assessment of Meteorological Drought Indices in Korea Using RCP 8.5 Scenario. Water, 10(3), 283. https://doi.org/10.3390/w10030283