1. Introduction
The urbanization process and the disorganized occupation of urban centres to supply the needs of human beings have promoted the transformation of the environment, resulting in modifications and interferences in the ecosystems [
1]. The development of the road network combined with the growth of cities has led to impervious surfaces. As a result, the frequency and intensity of urban flood events, mainly when drainage systems are unable to completely drain urban stormwater runoff produced during intense rainfall, have been increasing [
2,
3,
4]. This scenario has led to the development of alternative techniques to increase the drainage capability of surfaces, such as the use of porous asphalt pavements [
3,
5,
6,
7].
The role assigned to permeable pavements consists of reducing pollution and stormwater runoff, and increasing stormwater infiltration into the soil. Porous asphalt pavements are specifically designed to promote the infiltration of stormwater through the paving and base courses where it is filtered through the layers [
1,
4,
6,
7,
8]. This particular pavement may also result in a reduction in the amount of pollutants entering the groundwater by filtering the stormwater [
5,
9]. Porous asphalt pavements are more sustainable alternatives to traditional impervious asphalt and concrete pavements. Interconnected void spaces in the pavement allow for water to infiltrate into a subsurface storage zone during rainfall events [
10,
11].
Stormwater is a water resource alternative that can bring benefits to urbanized communities. However, the wide range of stormwater runoff pollutants may present significant health risks [
3,
12]. In addition, stormwater runoff from urban impervious surfaces often carries contaminants, sediments, and nutrients that can degrade the water quality of streams, rivers, or other water bodies.
Kumar et al. [
13] measured the infiltration capacity in three permeable parking sections using different pavements over a period of four years. Porous concrete pavers, porous concrete, and porous asphalt were the pavements tested. It was observed that the infiltration rates decreased significantly due to the clogging of pores by the deposition of particles, mainly during the last two years. The porous concrete obtained the best performance while the porous asphalt was the worst. However, all porous pavements in parking lots have a great ecological importance due to their ability to infiltrate stormwater quickly, which reduces runoff in the catchment area and avoids floods.
The general principle of permeable pavement is to collect, treat, and/or infiltrate freely any surface stormwater to support groundwater recharge. These pavements provide a reduction of stormwater runoff volumes and discharge rates from paved surfaces [
7,
14,
15] which can potentially minimise the risk of flooding. Porous pavements also allow for considerable water quality improvements by filtering stormwater pollutants when stormwater infiltrates through the pavement layers [
14,
16].
Drake et al. [
17] examined the water quality of three permeable pavement systems over spring, summer, and fall in Ontario, Canada. The study showed that the use of porous asphalt pavements can mitigate the impact of urbanization on receiving surface water systems through quantity control and stormwater treatment.
Therefore, the objective of this study is to assess the filtering capability of porous asphalt pavement models and the quality of rainwater and stormwater filtered by such models.
Rainwater refers to the rain (rainfall) that falls, for example, on a roof and is then conducted to a storage tank, without contact with the ground. Stormwater is the water from rain that falls over a land area. When the rainfall intensity exceeds the evaporation rate and infiltration capacity of the surface, runoff occurs. This also happens when rainfall falls on impervious surfaces, such as roads, streets, parking lots, and other paved areas. The terms rainwater, stormwater, and stormwater runoff are used in this paper.
Permeable pavements are those that have a high voids content that are interconnected through which water can pass. In general, these pavements are used in parking lots, courtyards, sidewalks, and light-traffic roads. In the porous surface layer, some materials such as concrete blocks, Portland porous concrete, or porous asphalt, can be applied. When all layers of the pavement structure are permeable, it refers to a permeable system. Although both are generally referred to as permeable pavements, the term “permeable pavement” means the general system, while “porous pavement” is the term used to refer to permeable pavements with porous surfaces. The term “porous asphalt pavement” is used to refer to the model structures evaluated in this work (with porous asphalt surfaces).
2. Background
2.1. Porous Asphalt Pavements Structures
The porous asphalt pavements comprise a dual function, i.e., as a stormwater runoff management practice and to support traffic loads. These pavements can be composed of surface porous asphalt mixtures (open graded) over a permeable layer system (base and sub-base with course aggregate intercalated by a filter fabric) and the existing soil or subgrade material [
18]. Porous asphalt mixtures have higher air voids (18% to 22%). High-quality aggregates are needed to provide good aggregate interlock and long-term frictional properties [
19]. In New Zealand, these mixtures are specified with air voids varying from 20% to 30% [
20].
The high air voids lead to interconnected permeable voids, which create permeability in the pavement. Stormwater infiltrates through the pores and can be rapidly removed from the surface. This generates a permeable interconnected void structure that can work as a filter for stormwater. The base course layer typically consists of an open graded base comprised of unbound granular materials. A base course or stone recharge bed consists of clean single-size aggregates with about 40% of voids content. A stabilizing course (chokers course), which contains single-size aggregates smaller than a recharge bed, is also used [
21].
2.2. Pollutants
Stormwater and stormwater runoff contain pollutants and nutrients that can threaten soils, groundwater, rivers, and seas. But rainwater may also contain very high concentrations of sulphate, chloride, ammonia, and phosphate. Several categories of pollutants have been identified as important constituents, including: suspended solids, oxygen demand, nutrients, heavy metals, organic compounds, and petroleum products.
Table 1 shows the concentrations of pollutants found in stormwater runoff in the USA, India, and Spain [
22,
23,
24].
Highway stormwater runoff contains a variety of pollutants which, if left untreated, can impair water quality and pose a risk to aquatic organisms [
22,
25].
Table 2 shows the concentrations of pollutants from highway runoff in different places in the USA [
1,
22,
25,
26].
Yuen et al. [
27], in research conducted in Singapore, evaluated the amount of sediment stored on the surface of roads in industrial and residential areas. Concentrations of cobalt, chromium, iron, and nickel in roads in the industrial area were higher than those in the residential area. But scandium was higher in roads in the residential area. In contrast, significant enrichment signals were observed for copper, lead, antimony, and zinc in both industrial and residential areas.
In an experiment in Texas (United States), the researchers concluded that the quality of stormwater runoff from roads is generally similar to that for urban areas; it does not contain higher concentrations of toxic metals or oil and grease [
25]. In Maryland and Virginia (United States), a porous asphalt pavement was monitored in order to estimate the capability of this pavement to remove pollutants. The analysis showed that 82% to 95% of sediment was removed, as well as 65% of total phosphorus, and 80% to 85% of total nitrogen [
28].
The storage capacity and efficiency of the system are dependent on the degree of clogging within the porous asphalt pavement system [
29]. In France, hydraulic conductivity and the level of pollutants in stormwater runoff from porous and conventional (impervious) pavements were also studied. Concerning the quality of water, suspended solid sediments were detected. These particles were mostly fine sand. In the chemical analysis, the following pollutants were found: cadmium, copper, zinc, and lead. A reduction in the percentage (greater than 70% for all metals) of suspended solids when the conventional pavement was replaced with the porous one was observed [
30].
2.3. Water Quality Released into the Environment
Stormwater runoff quality is associated to aquatic toxicity, which is influenced by several inorganic and organic pollutants. High concentrations of some parameters (Fe, Al, Zn, Cu, Cd, Pb) in the stormwater runoff are caused by the atmospheric transport of human activities (industrial activity, coal combustion, and car exhaust) [
26].
In Brazil, the National Water Agency (ANA—
Agência Nacional de Águas, in Portuguese) [
31] establishes limits for the use of non-potable water for specific purposes such as cleaning outdoor areas, toilet flushing, and car washing, among others. Such limits are shown in
Table 3 for the following prevailing uses: toilet flushing, sidewalks cleaning, garden watering, and washing vehicles.
The National Environmental Council, Resolution No. 430, provides the classification of water bodies and environmental guidelines and establishes the effluent discharge conditions [
32]. Effluent discharge patterns from some pollution sources must follow the quality parameters and maximum values shown in
Table 3. Furthermore, for dissolved oxygen and dissolved aluminium, there are no established limits for non-potable water. Therefore, the limits used for comparison are those established for potable water in accordance to Resolution No. 357, i.e., not lower than 6.0 mg/L for dissolved oxygen and 0.10 mg/L for dissolved aluminium [
33].
3. Methodology
This study evaluated the efficiency of porous asphalt pavements in relation to their capacity to filter rainfall and stormwater. Three porous asphalt mixtures slabs were produced, and two pavement models with permeable layers were tested.
Data collection was performed in two phases. First, using rainfall directly from the sky, and then using stormwater runoff collected from a street. In order to evaluate the draining properties, the slabs and the pavement models were assembled in acrylic boxes and exposed first to rainfall events and then to stormwater runoff. The tests with rainwater were performed with the models outdoors, using only the surface asphalt layer in each model. In this case, the measurement was performed as a function of the rainfall intensity. The measurements and tests were performed only when the rainfall infiltrated through the asphalt layers into the boxes resulted in a water height greater than or equal to 5 mm. Samples of water heights lower than 5 mm were discarded as it was not possible to collect the water from the boxes.
The samples of stormwater runoff were collected manually, directly from the gutter using plastic bottles. The amount of stormwater collected in each event depended on the rainfall intensity, but, on average, 20 L were collected in each sampling. The first few minutes of stormwater was discarded to avoid debris. Then, the stormwater runoff was collected up to 15 min from the beginning of the rainfall event so that it would contain the maximum amount of contaminating materials deposited on the road surface. After that, the materials would be carried away by the runoff, and therefore fewer amounts of pollutants would be detected. Following this, the analyses were performed up to 30 min from the beginning of the rainfall event; this was possible as the laboratory where the analyses were performed is located near the place where the samples were collected. In the laboratory, the samples of stormwater runoff were spilled over the models by means of a sparger, simulating the rainfall falling over the pavement. The tests were performed separately for each rainfall event. The quality of water collected after infiltrating through the slabs and pavement models and being filtered by them was analysed. An empty box with the same dimensions was used as a control.
The procedure used to collect the samples complied with the Brazilian guide for water sample collection [
34]. The main recommendations are: (i) the collection bottle should be opened only at the time of use, for the time required to fill it, and be closed immediately after collection; (ii) the samples must be wrapped in a thermal box and sent to the laboratory in the shortest time possible; and (iii) the maximum time elapsing between the collection and the test must be 24 h. Furthermore, all boxes were sealed to prevent the infiltration of water through the lateral edges.
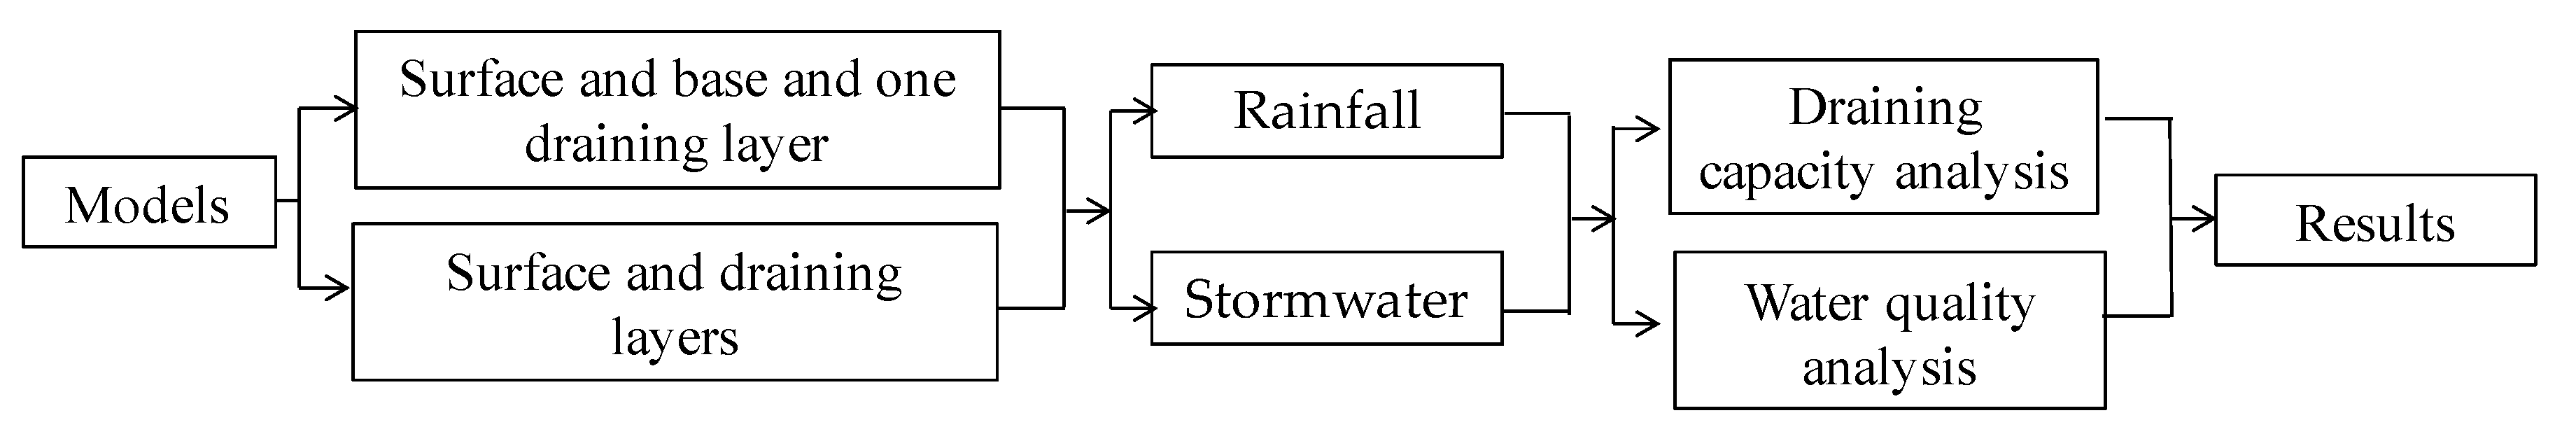
Figure 1 shows the scheme of the methodology.
3.1. Materials
The porous asphalt mixtures slabs were composed of coarse aggregate, fine aggregate, and rubber modified binder. The other layers that compose the models were crushed aggregates and sand. Each layer was wrapped in geotextile mats.
3.1.1. Porous Asphalt Mixtures
For the production of asphalt mixtures, granitic aggregates in the following maximum diameters: crushed coarse 3/4″ and 3/8″, and crushed fine (maximum nominal size of 4.75 mm) were used. The specific gravities and the absorption of the aggregates can be seen in the
Supplementary data (Table S1). The tests were performed in accordance with the Brazilian standards DNER-ME 081/98 and DNER-ME 084/95 [
35]. The mixtures were prepared using the terminal blending asphalt rubber, with 15% of incorporated rubber, whose characterization is shown in
Table S2 in the Supplementary data.
Porous asphalt mixtures were produced using open gradations, in which three specifications were used. The asphalt content and volumetric parameters of the mixtures were evaluated according to the SUPERPAVE
® method using a gyratory compactor (ASTM, 2002) [
36].
The gradation curves (See
Table S3 in the Supplementary data) were defined by following specifications and design from: (i) CALTRANS—California Department of Transportation (CT 368) Open Graded Friction Course (OGFC) ½ inch [
37], designed with 23% of voids content and 3.5% of binder content; (ii) CPA—DNER—ES 386/99 [
35] Porous Friction Course, grade IV (CPA—
Camada Porosa de Atrito, in Portuguese), with 29% of voids content and 3.5% of binder content; and (iii) PMQ—PMSP/SP-ESP10/92 [
38] Porous Asphalt Mixture, grade I (PMQ—
Pré-Misturado a Quente, in Portuguese) using 25% of voids content and 4.5% of binder content.
After being designed, the mixtures were produced and compacted in slabs using a French compactor (Institut Français des Sciences et Technologies des Transports, in French) to achieve the apparent density of the mixtures defined in the design. The CPA and Caltrans slabs were moulded with a 7.0 cm thickness and the PMQ with 5.0 cm. This was due to the fact that, in the pavement structures, the PMQ mixture is generally used as a binder layer and the others as a surface. The thicknesses adopted aimed at improving the mechanical strength of the structure.
The thickness of surface layers of porous asphalt pavements in Brazil range from 4.0 to 8.0 cm. In this study, a surface layer thickness equal to 7.0 cm and asphalt base layer (PMQ) thickness equal to 5.0 cm were used. The use of asphalt rubber as a binder was due to Brazilian regulations that require that porous asphalt mixtures should be made using polymeric asphalts; this is necessary because conventional asphalt does not meet the requirements of durability for mixtures with high voids content.
3.1.2. Porous Layers
Different structures were adopted in the models. The porous layers followed the New Hampshire Stormwater Center [
39] and Brazilian specifications [
35] (See
Table S4 in the Supplementary data).
3.1.3. Equipment for Assembly of Models
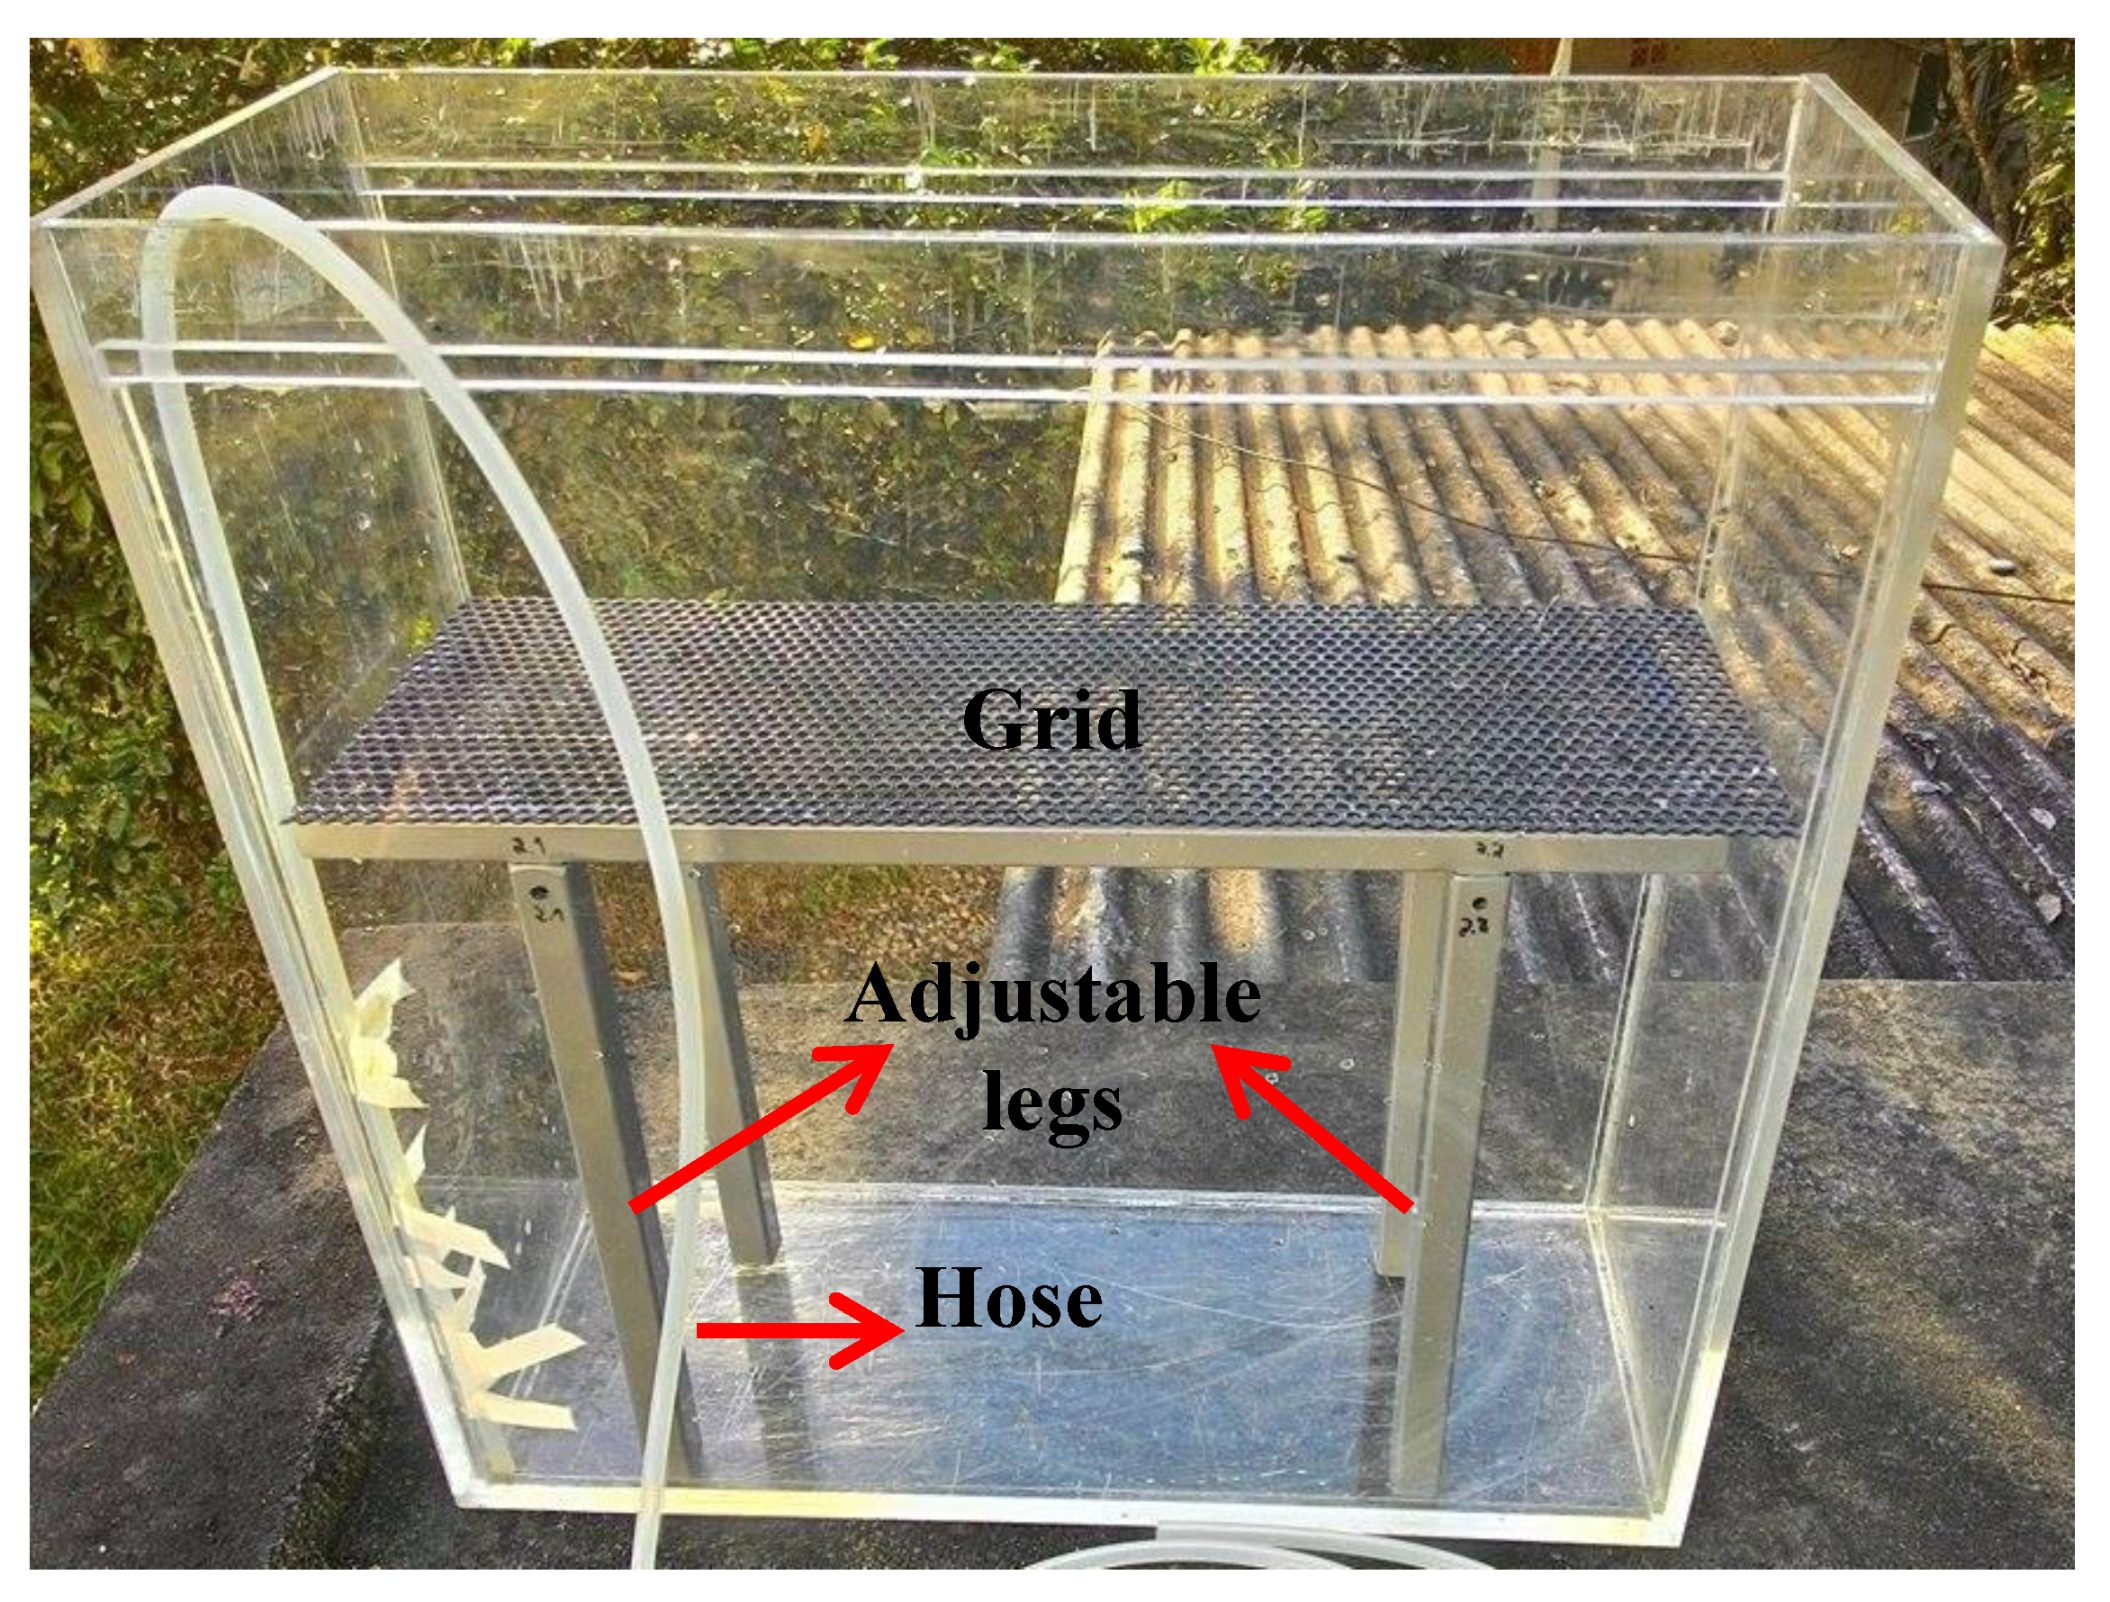
The models were assembled in acrylic boxes with an 8.0 mm wall thickness. The boxes have the following dimensions: 50.0 × 18.0 cm internal base and 53.0 cm height. Acrylic filets were installed to support the compacted porous asphalt mixtures and ensure a cross slope of 2.5% to represent the road cross slope, which serves to drain runoff from the road surface.
The metal legs system is adjustable to provide the different heights of the different models. A hose was fixed internally to allow for removing the water from the boxes after each rainfall event or stormwater sparging.
Figure 2 shows the system with adjustable legs, a fixed base, metal grid, and hose. An empty box was used as the control to measure the height of the rainwater stored in each rainfall event.
3.1.4. Models
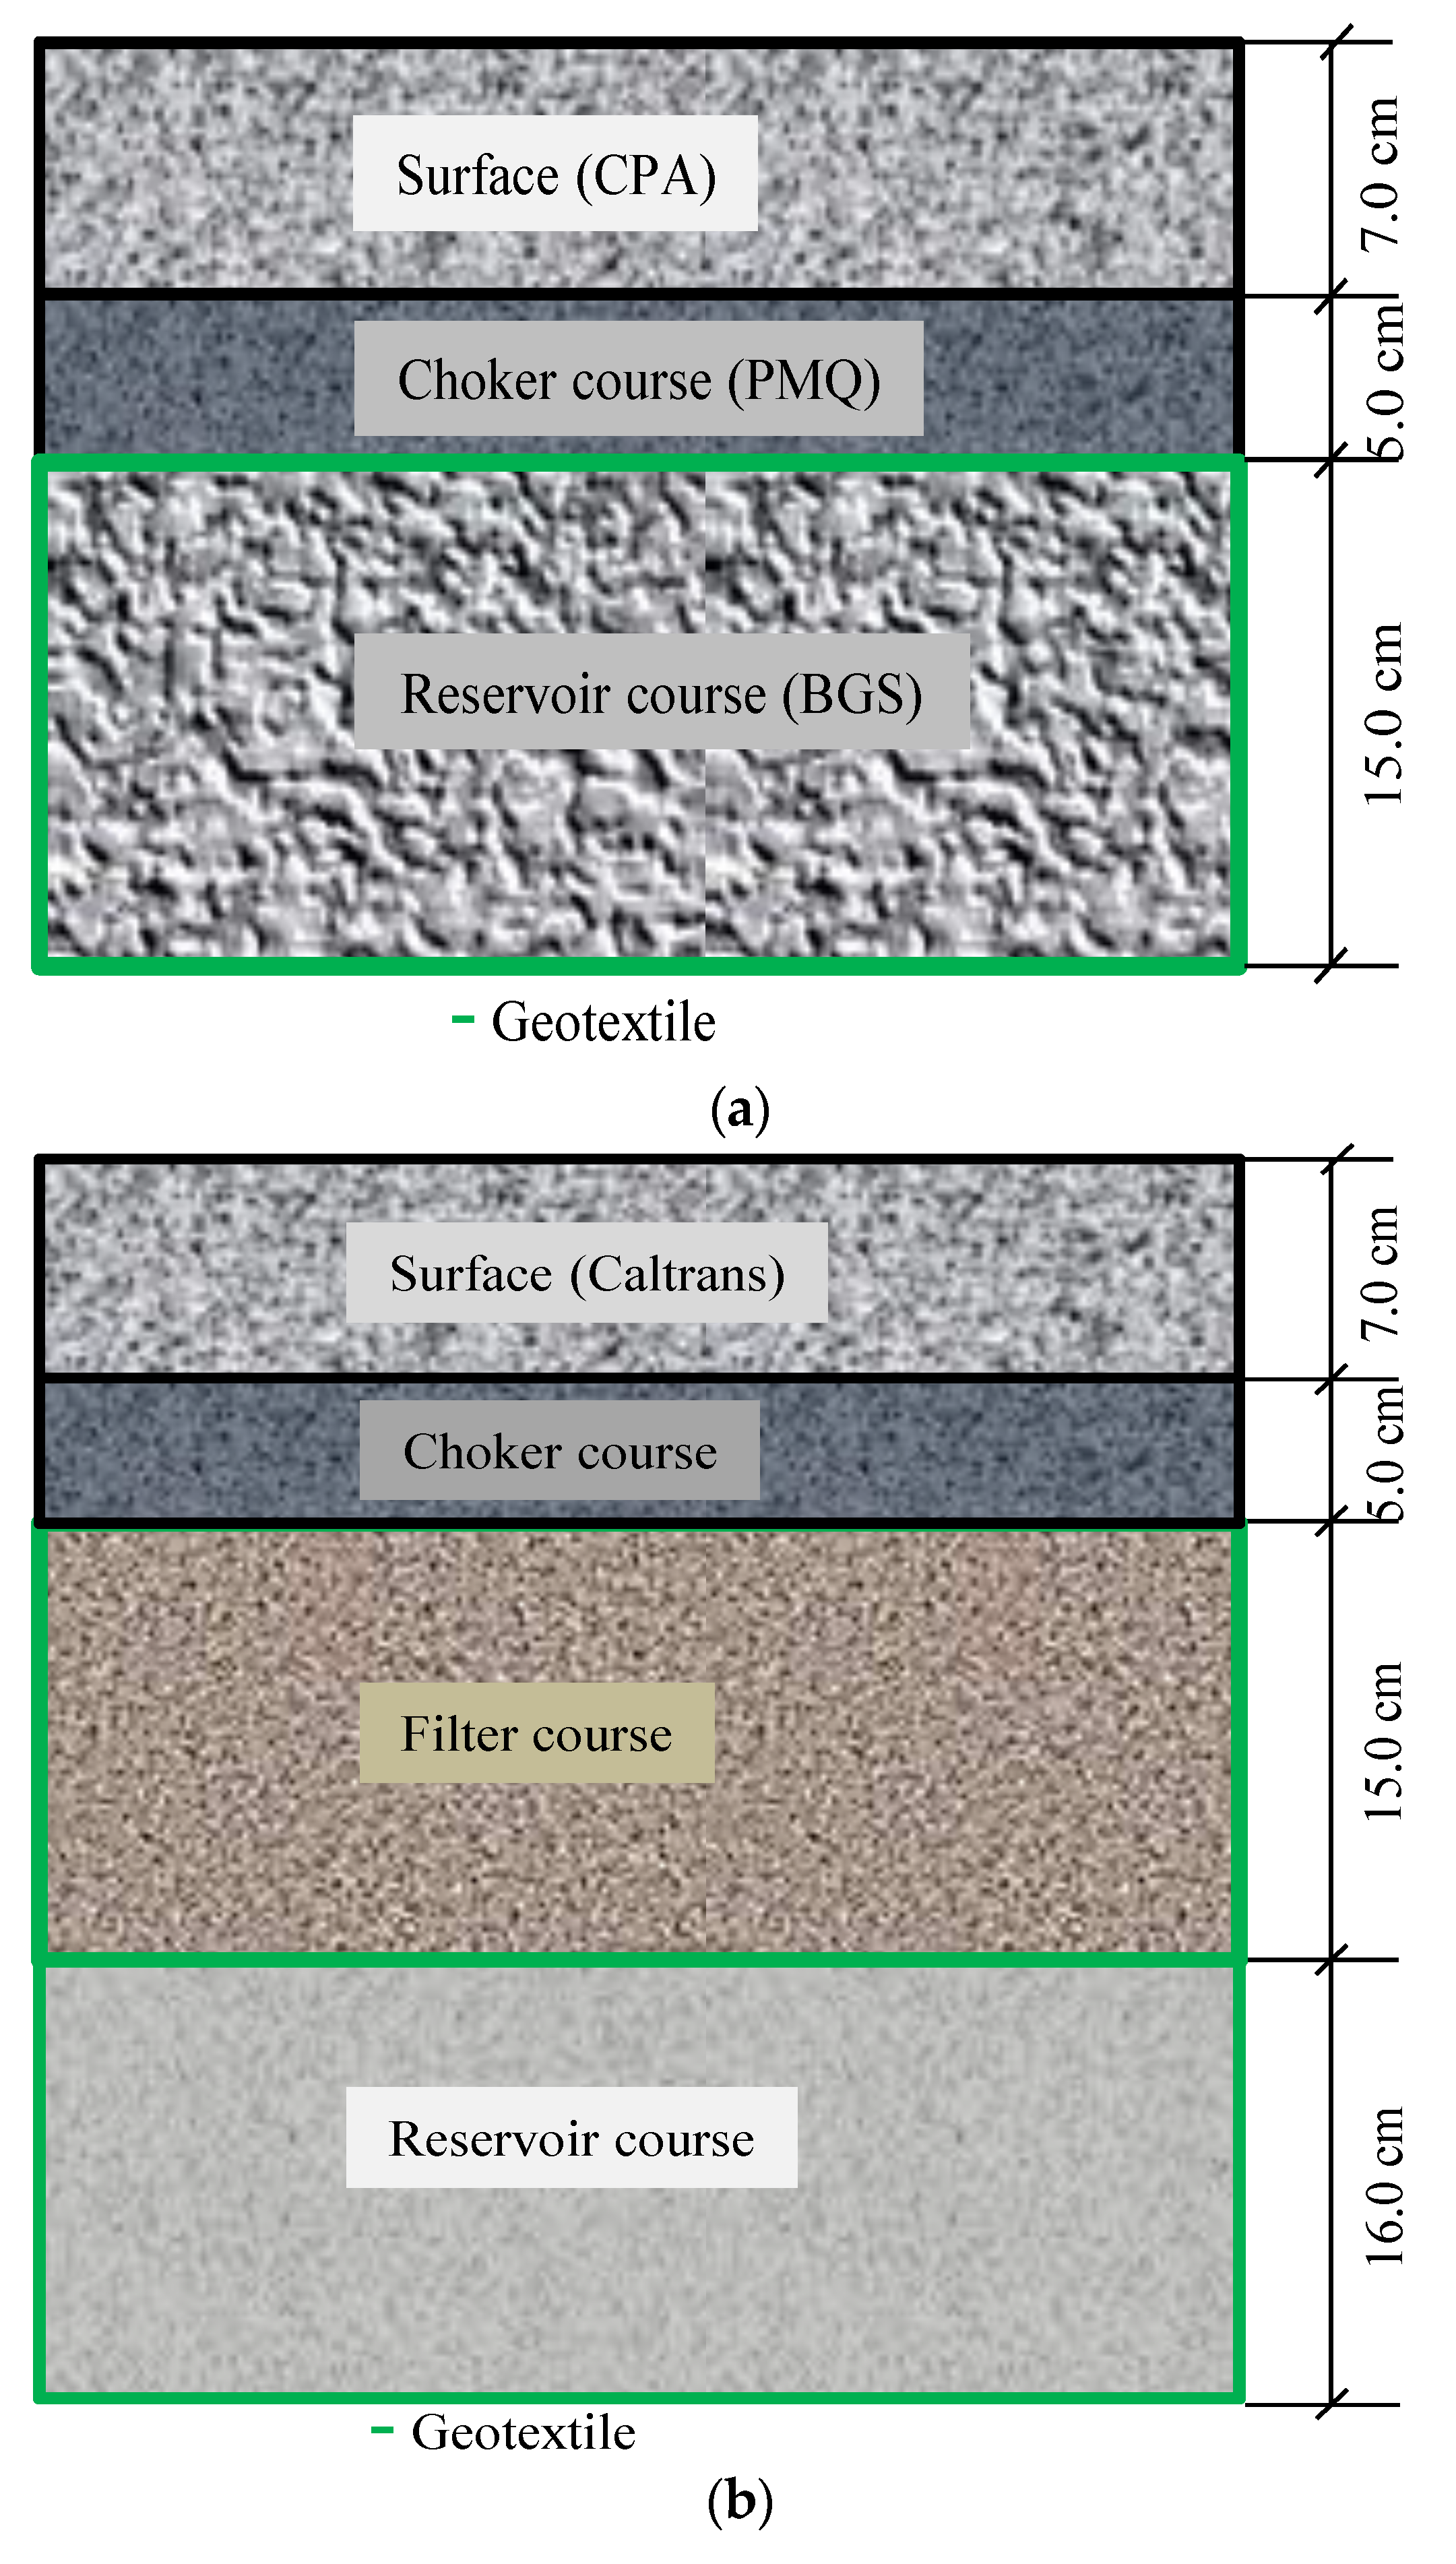
Two models of porous asphalt pavements structures were evaluated (A and B). The component layers of each model are shown in
Figure 3 and the specifications are shown in the
Supplementary data (Table S5).
In both models, a porous asphalt surface layer and the underlying layers called porous layers (base, filter, and reservoir) were used. The porous layers, except the PMQ layer (choker course in model A), were wrapped in geotextile mat. The geotextile was used to assembly the models for two main reasons. First, to confine the layers composed of materials without cohesion (aggregates) inside the box, and second, as an attempt to simulate the structure of a pavement in the field. Also, some studies have shown that the filtering capacity of porous asphalt pavement increases when geotextile is used [
40,
41].
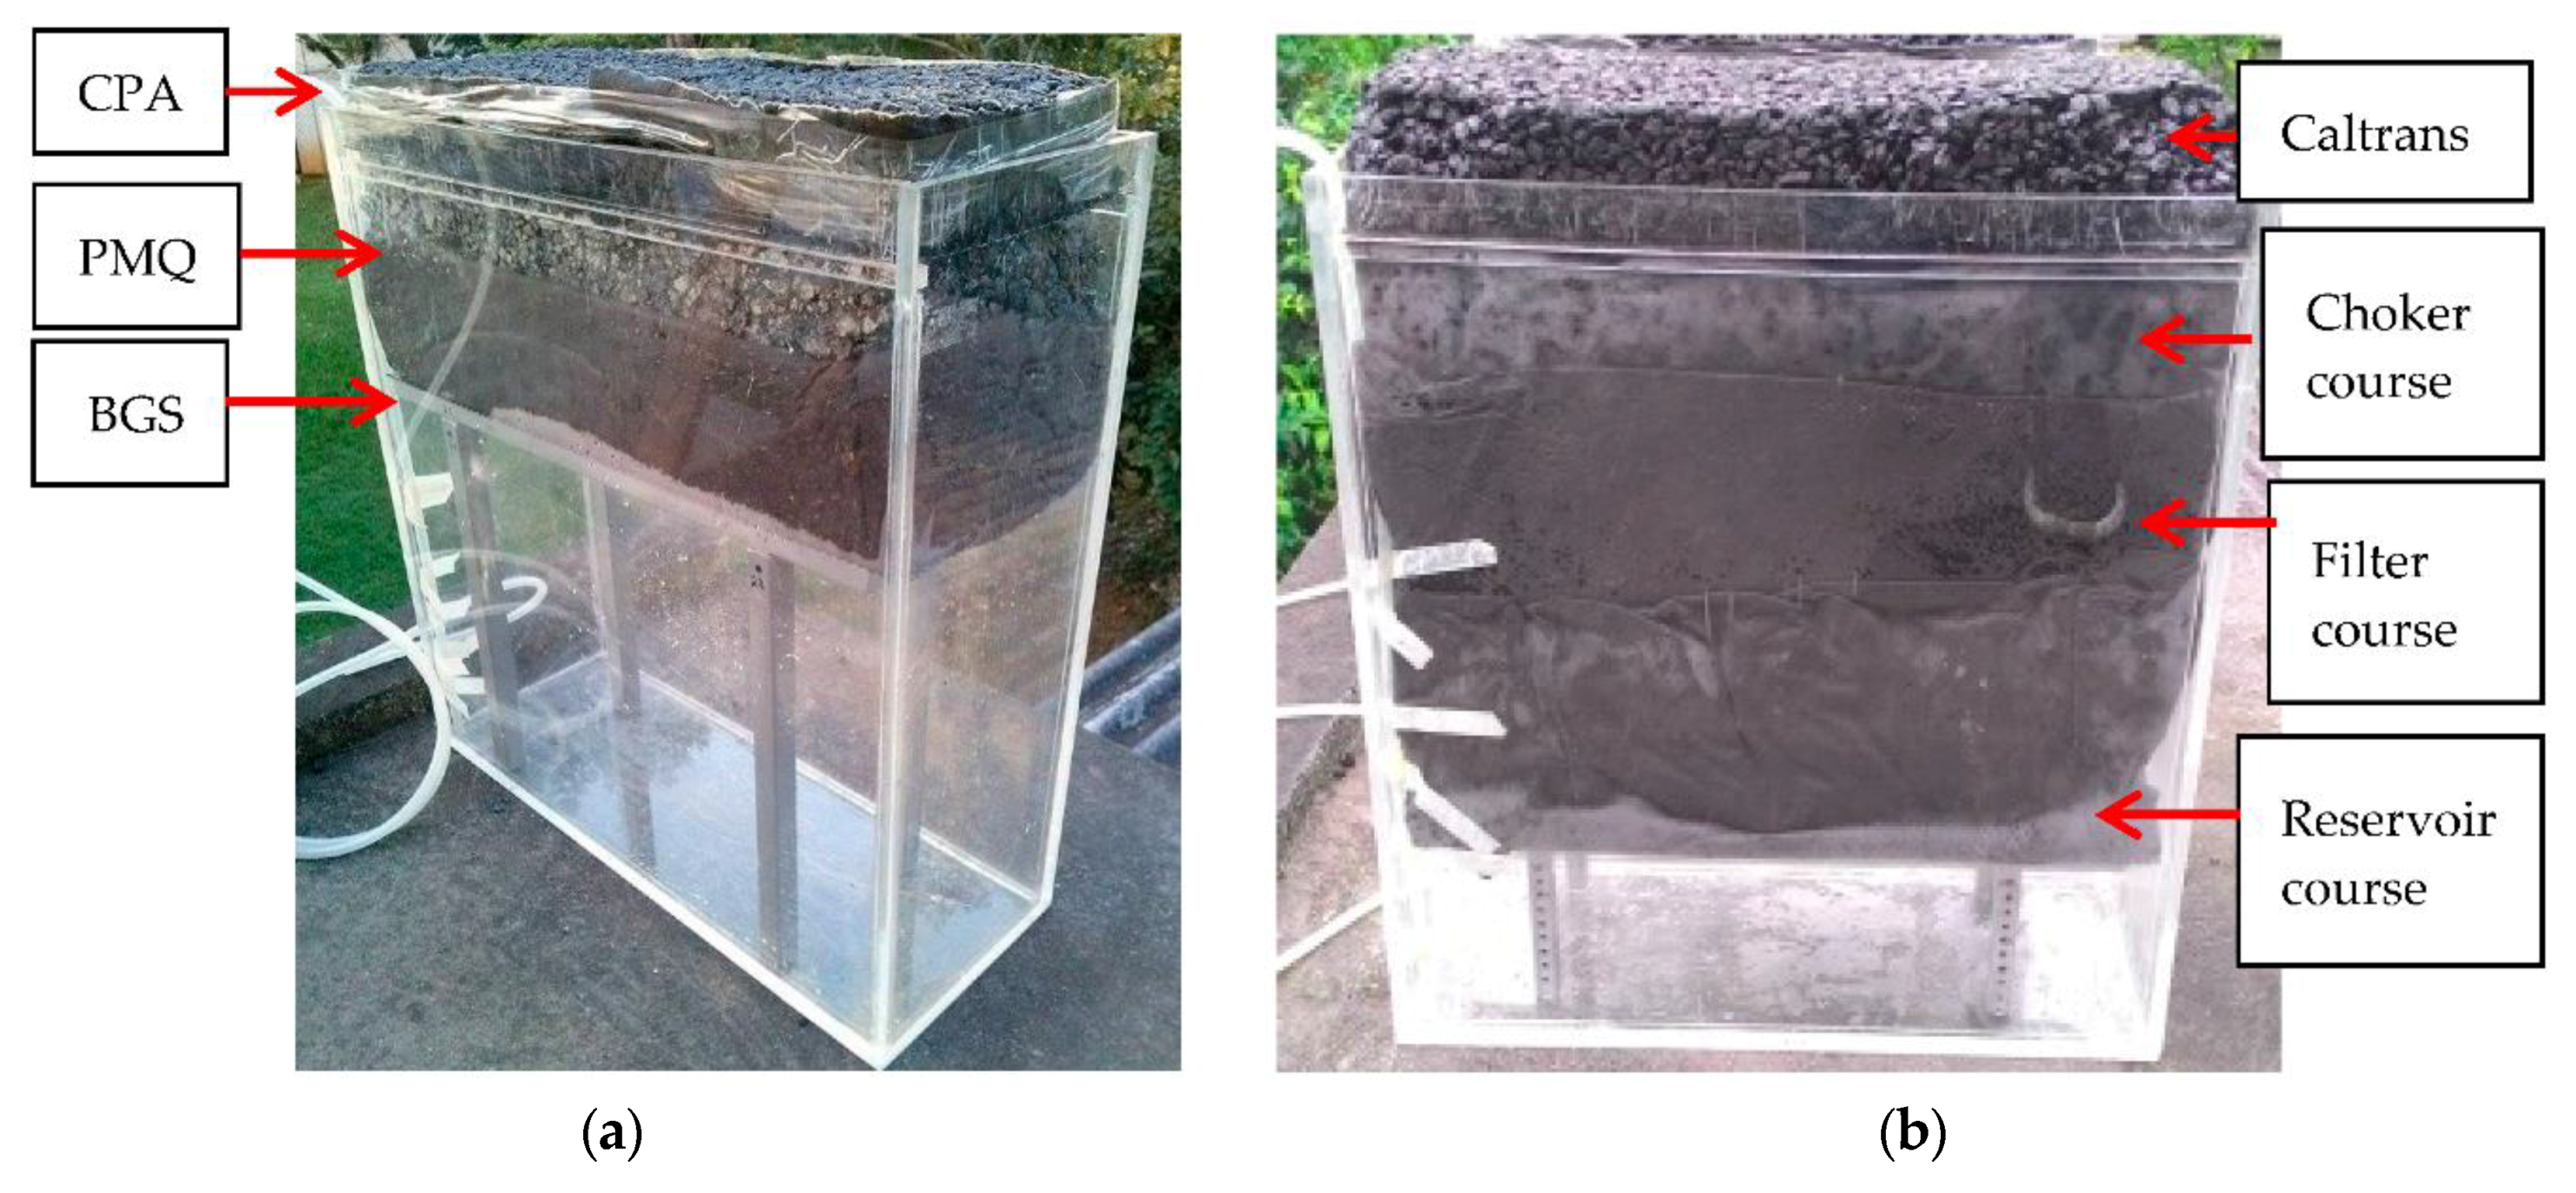
Figure 4 shows the models assembled in the boxes.
3.2. Method
3.2.1. Quantity Analysis
In order to assess the amount of water infiltrated through the models into the box, the amount of rainwater collected in the control box was compared to that infiltrated through the models after each rainfall event. Such an amount of water was obtained by using Equation (1). It was assessed for the three asphalt slabs and the two pavement models. This analysis shows the percentage of rainwater or stormwater filtered by the slabs and models that could be available for usage in buildings.
where: E is the amount of water infiltrated through the models (%); h
1 is the height of rainwater stored in the box that contains the model (mm); and h
2 is the height of rainwater stored in the control box (mm).
3.2.2. Quality Analysis
The quality analysis was performed in two stages: (i) using rainwater collected directly from the sky; (ii) using stormwater runoff collected from a street. This analysis was performed for the two pavement models only. Statistical analysis was performed to compare the performance of both models.
The parameters selected for water analysis were ammonia, phosphorus, nitrite, dissolved oxygen, pH, aluminium, copper, chromium, iron, and zinc. The analyses of these parameters were performed according to the guidelines of the chemical reagents supplier (Alfakit). A photocolorimeter AT 10P was used, except for the analyses that need colourimetric comparison. This instrument has a resolution of 0.01 mg/L, margin of error of 3%, and relative precision of 2%.
The total fecal coliforms were analysed according to the Brazilian standard CETESB L5.202/1993 [
42] using the multiple tubes method [
34].
4. Results and Discussion
4.1. Quantity Analysis
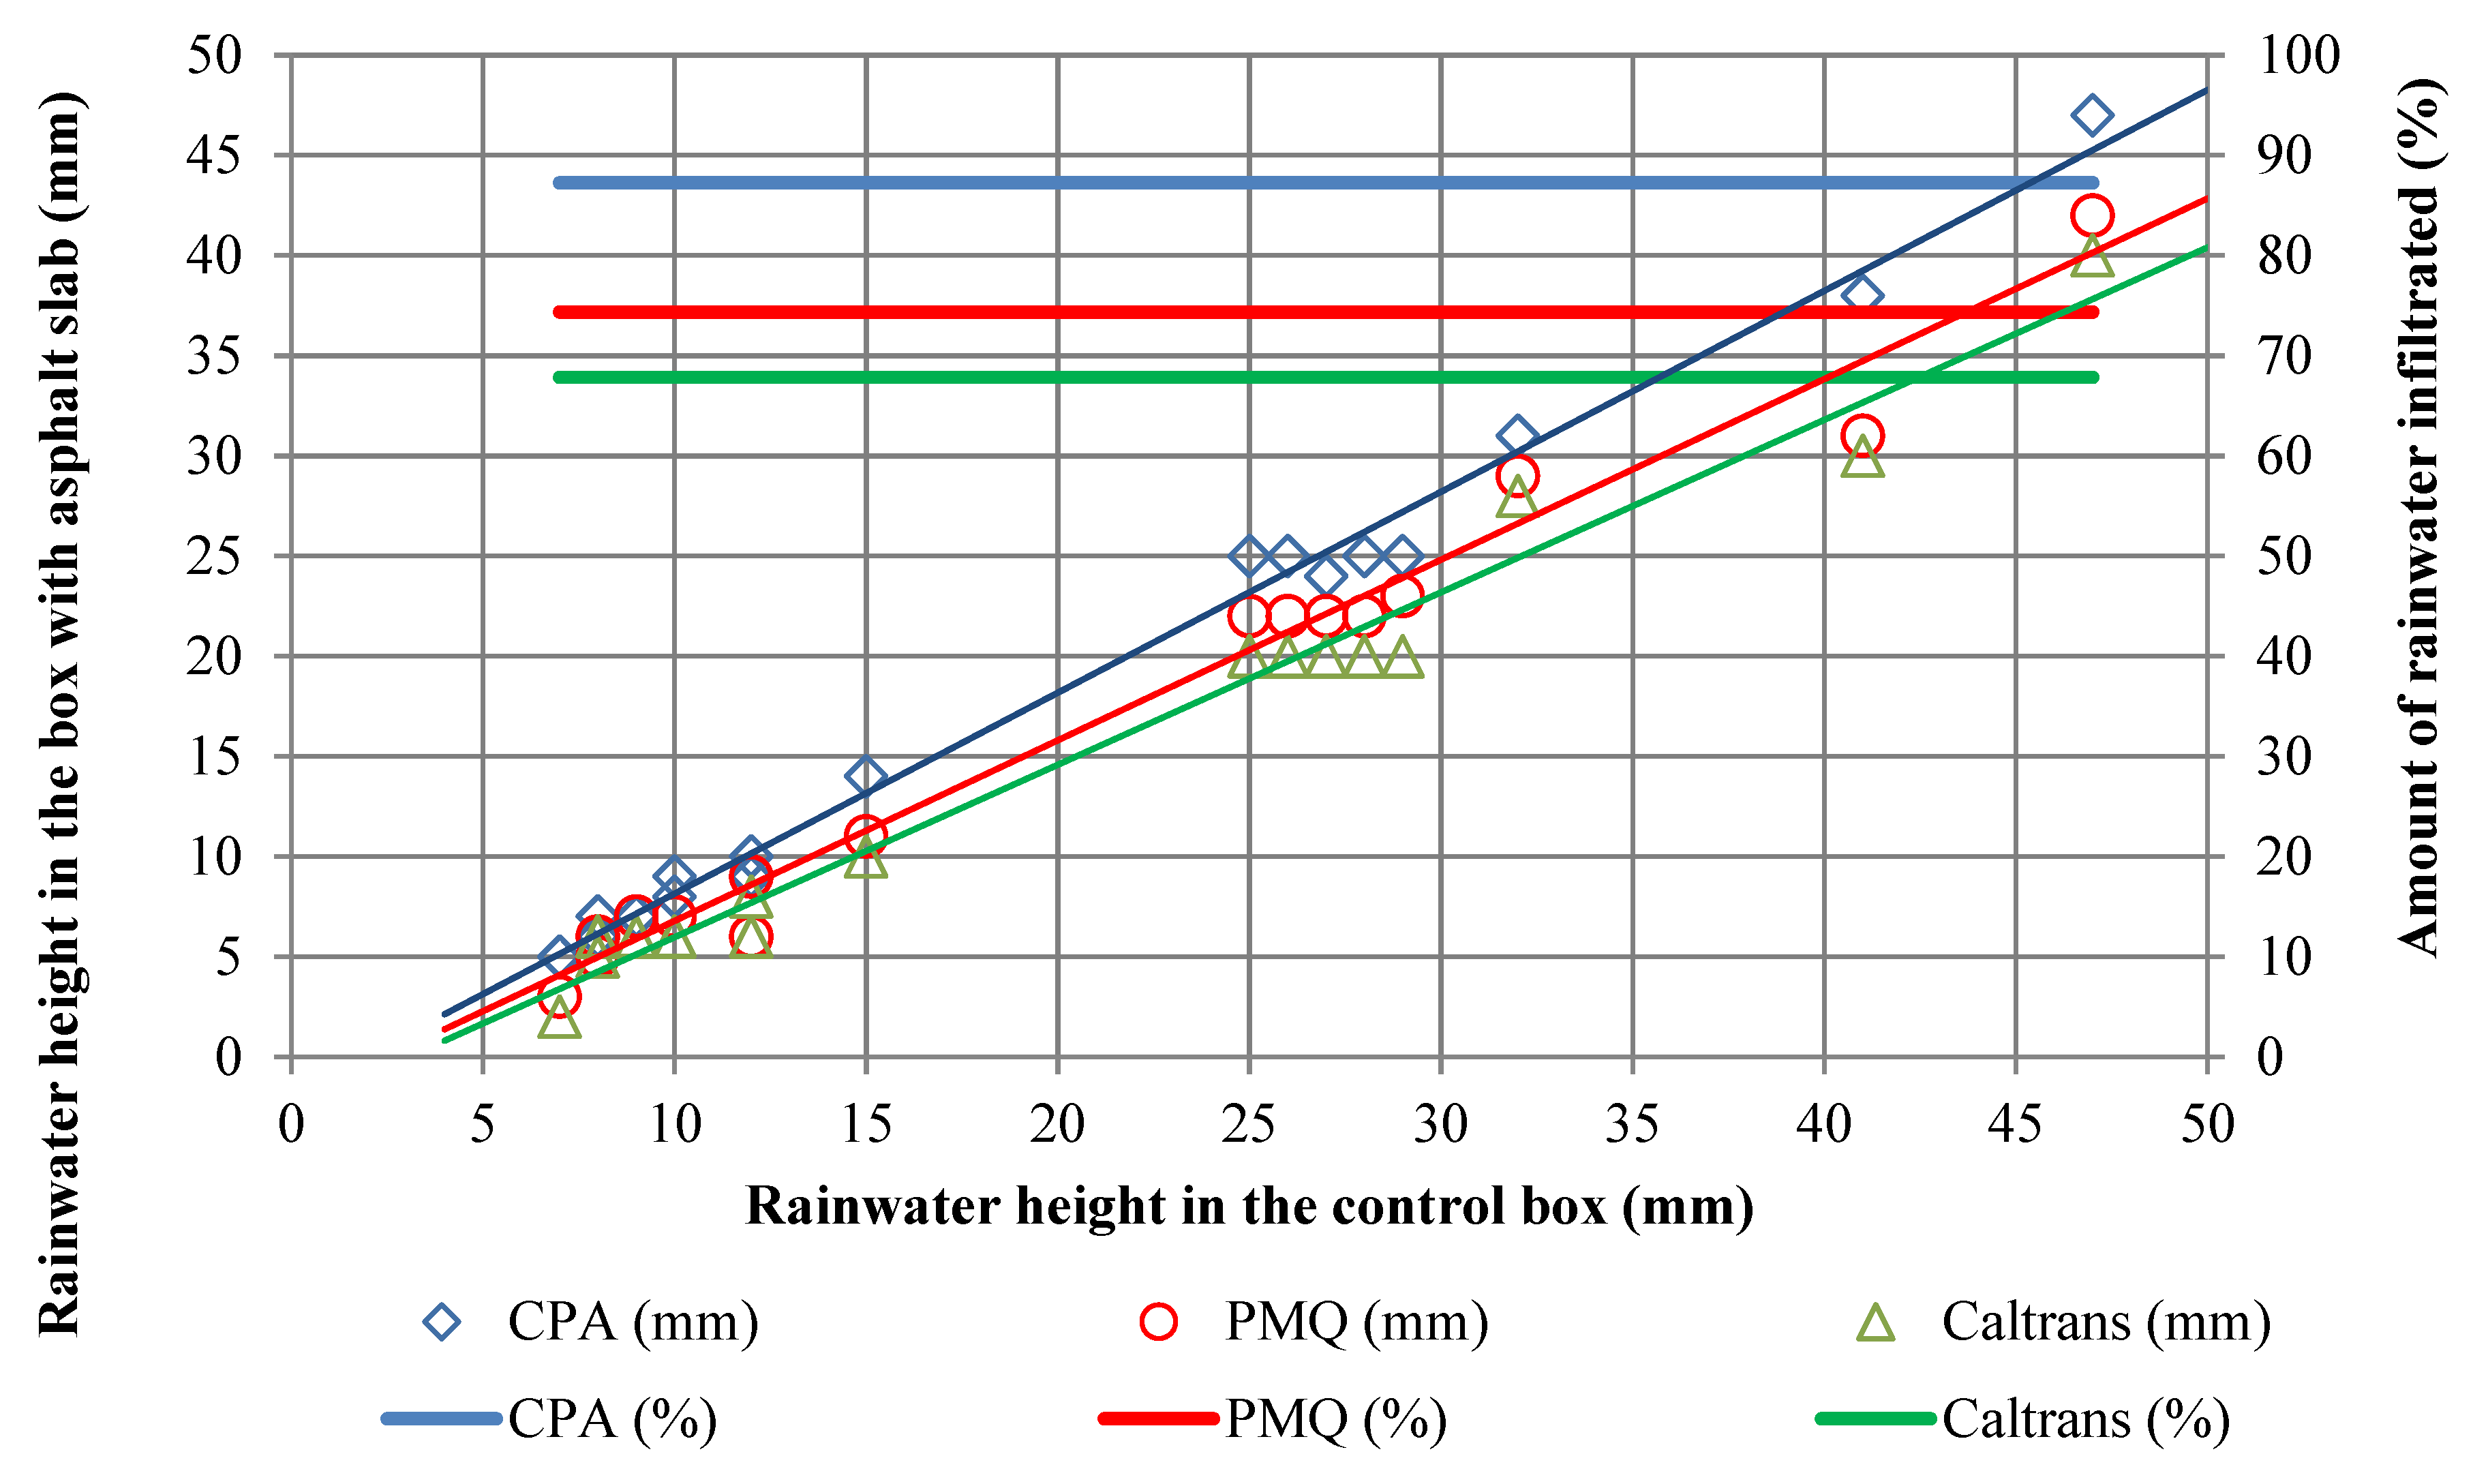
Figure 5 shows the relationship between rainwater height in the control box and rainwater height infiltrated through the slabs into the box, as well as the average amount of rainwater infiltrated through the slabs. It is observed that the slab with higher air voids (CPA) had the highest amount of rainwater infiltrated through the slabs (87.3%). All porous asphalt mixtures had a good amount of rainwater infiltrated through the slabs, i.e., above 67.0%.
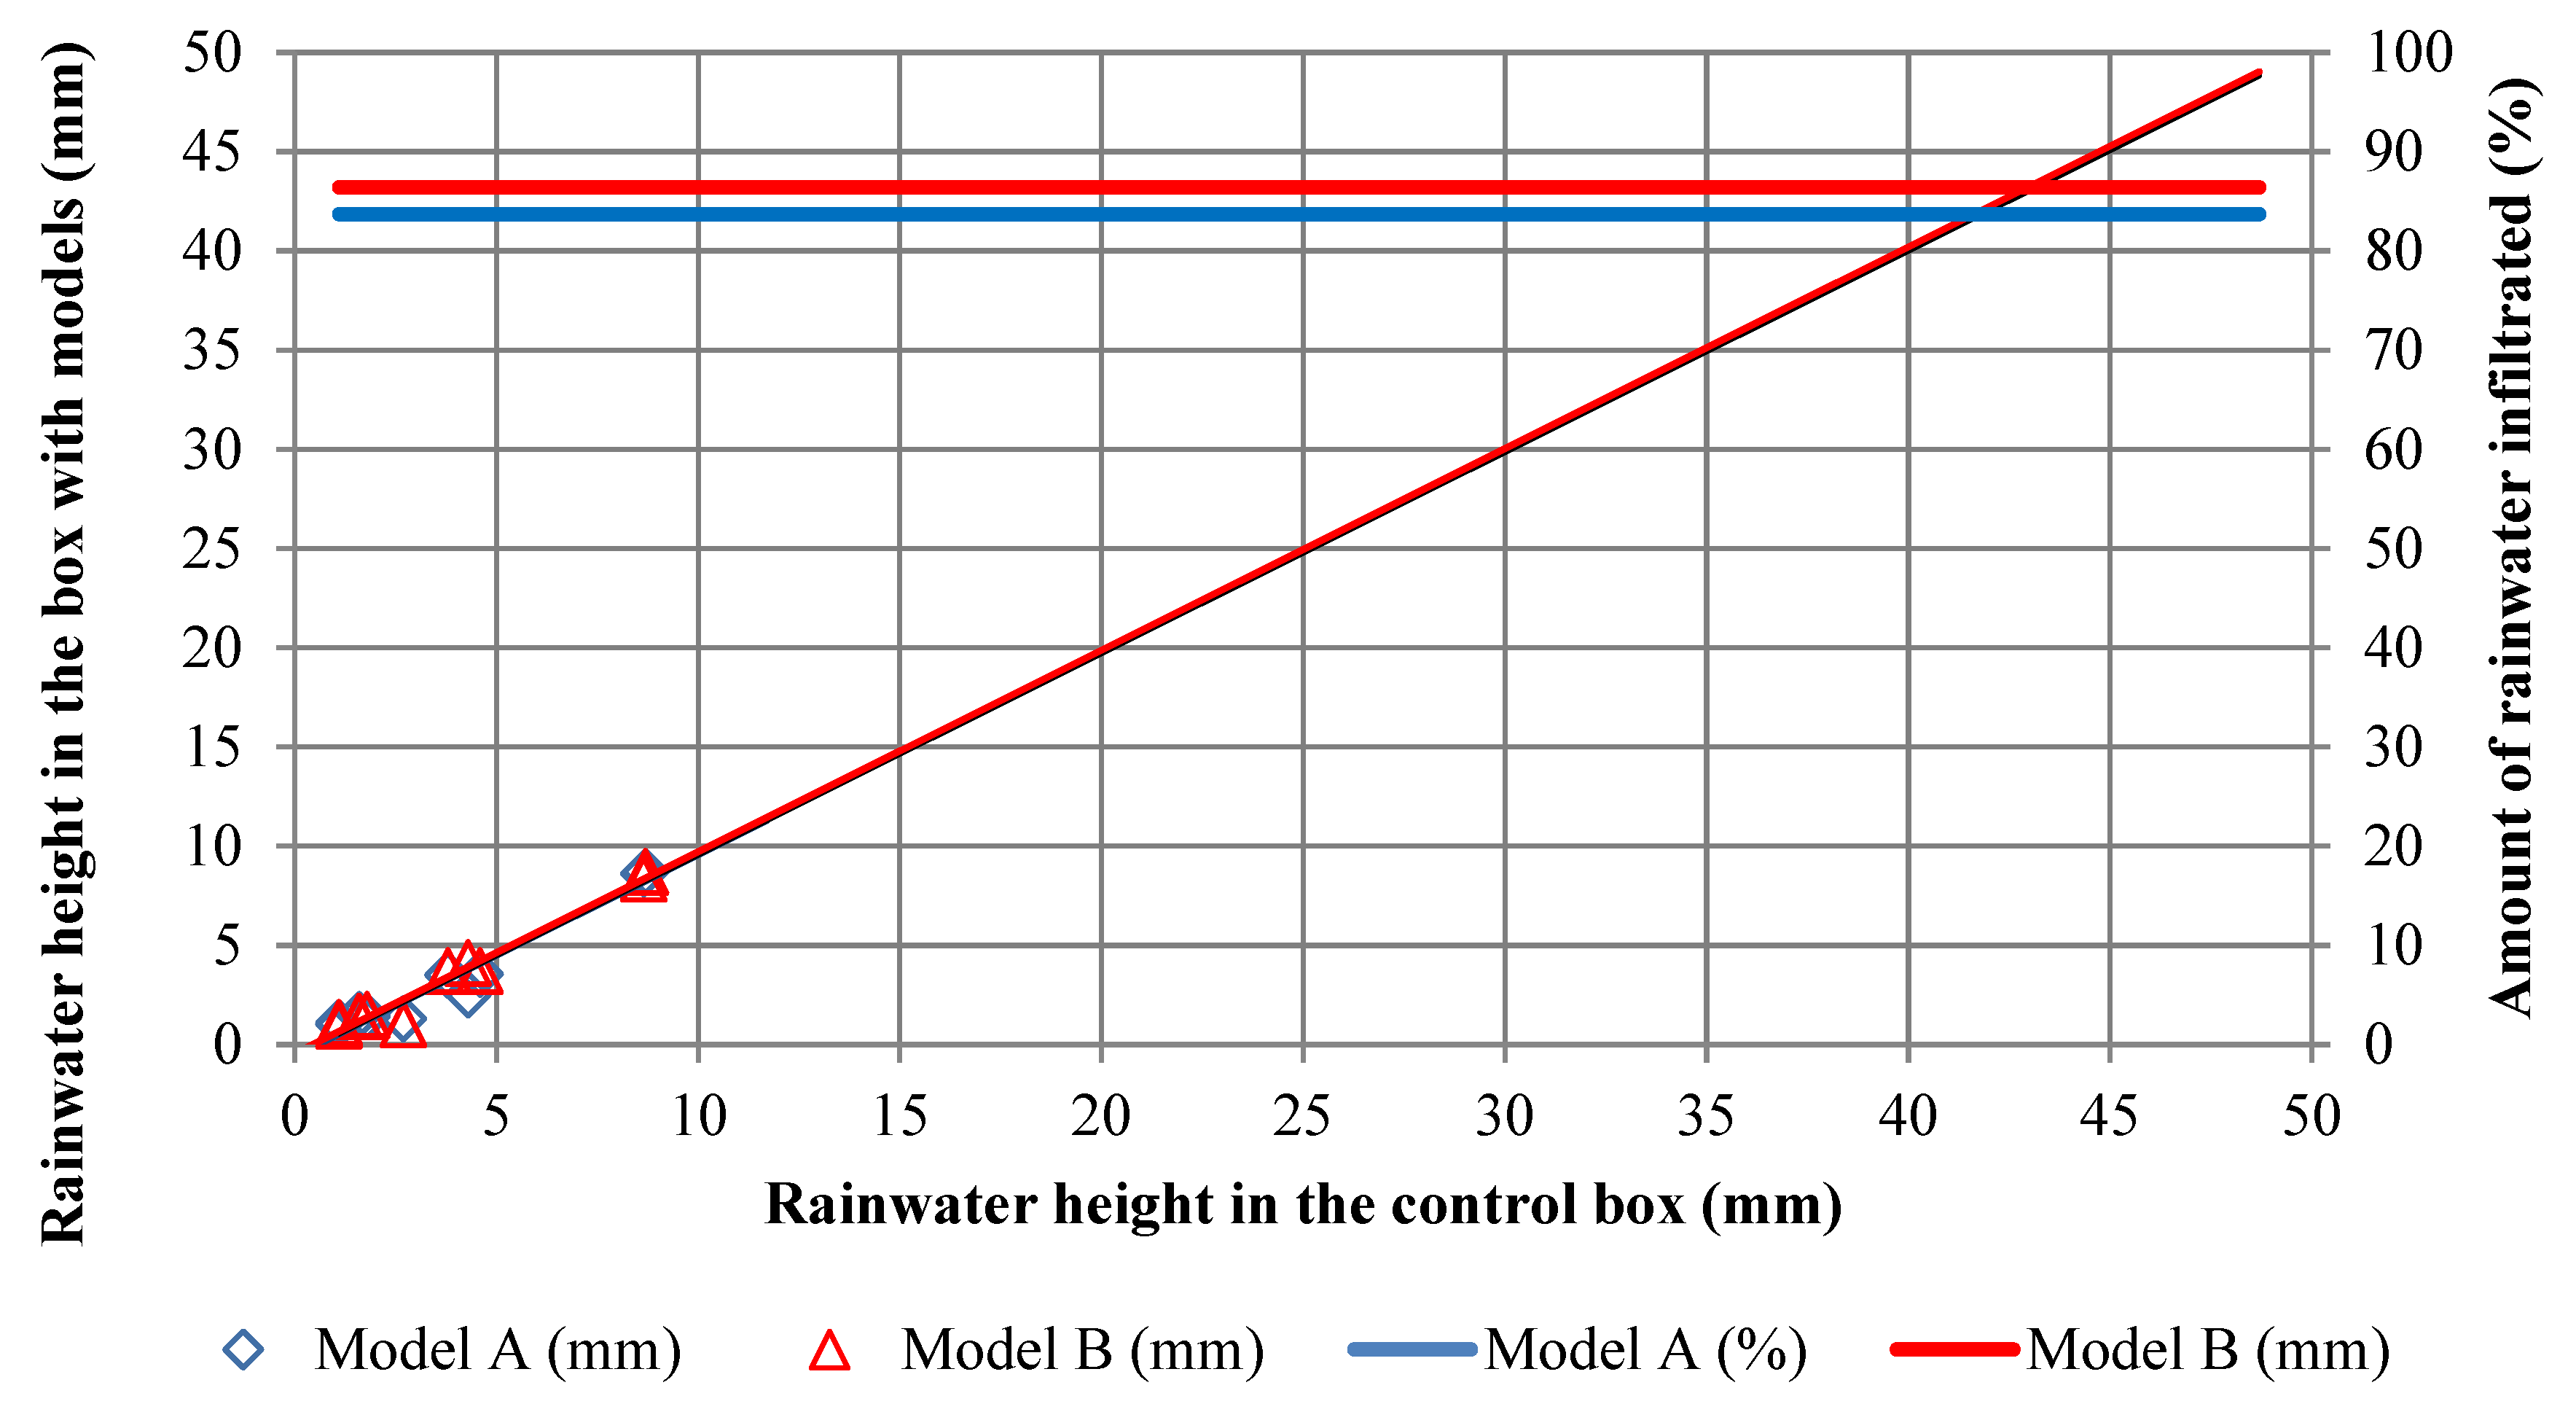
Models A and B were also exposed to rainfall events; results are shown in
Figure 6. Model B showed a slightly better performance than model A (86.4% and 83.7%, respectively). Model A has a porous layer (reservoir course) in BGS with a high amount of fines, which reduces the draining capacity and therefore decreases the amount of rainwater infiltrated through the layers. On the other hand, the layers in model B have a high permeability which results in a greater amount of rainwater infiltrated through the layers.
Based on the results for models A and B, it can be stated that at least 83.7% of the stormwater from any rainfall event would be filtered by the models and be available to be used in buildings, for example.
The possibility of water evaporation in the control box was not taken into account since the analyses were performed up to 30 min after each rainfall event. The amount of rainwater infiltrated through the asphalt mixtures slabs and the models is shown in the
Supplementary data (Tables S6 and S7). Although the standard deviation was high in the slabs and in the models, the same behaviour was observed in the control.
4.2. Quality Analysis
The water quality was analysed for models A and B in each rainfall event. Results were compared to the limits recommended by ANA (2005) [
31], CONAMA (2011) [
32], and CONAMA (2005) [
33].
4.2.1. Rainwater
The rainwater infiltrated through the models was collected and its quality was compared with the quality of the rainwater collected from the control box. There was an increase in the pH in models A and B; it was 5.8 in the control and it increased to 7.7 in model A and 7.1 in model B (See
Figure S1 in the Supplementary data). As for phosphorus, there was a great variation in its concentration (See
Figure S2 in the Supplementary data). The average concentration was 0.20 mg/L in the control box, 0.54 in model A, and 0.94 in model B, all above the maximum (0.1 mg/L). The infiltration of rainwater through the layers of the models increased the pH, which is desirable. However, the increasing of the phosphorus concentration indicates that such water can only be used after filtering.
In both models, the concentrations of iron and aluminium were greater than the control and also greater than the maximum limit. The average concentration of iron was 0.018 mg/L in the control, 0.349 mg/L in model A, and 0.538 mg/L in model B (
Figure S3 in the Supplementary data); it increased in the pavement models, but it was still lower than the allowed limit (up to 15.0 mg/L [
32]). The rainwater in the control presented an average aluminium concentration equal to 0.026 mg/L, while it was 0.12 mg/L in model A and 0.08 mg/L in model B. There was an increase in aluminium concentration when rainwater infiltrated through the layers of the models, but this concentration was only lower than the limit (0.1 mg/L) in model B (
Figure S4 in the Supplementary data). There was also an increase of concentrations of zinc and nitrite in the models compared to the control (
Figures S5 and S6 in the Supplementary data). However, such concentrations were much lower than the limits of 5.0 mg/L [
32] for zinc and 1.0 mg/L [
35] for nitrite.
There was a great variation of ammonia concentration in the control box (
Figure S7 in the Supplementary data); this may be due to the fact that the site is close to the sea. It was observed, in some events, that the models could reduce the concentration of ammonia in comparison to the control. In some cases, the models were capable of filtering this pollutant totally. For ammonia, ANA [
31] established 20.0 mg/L as the maximum limit and such a limit was not exceeded. Regarding dissolved oxygen, there was a decrease in some events compared to the control, but they were all above the minimum limit (
Figure S8 in the Supplementary data).
For chromium concentrations, there were no significant changes after the infiltration of rainwater through the layers of the models (
Figure S9 in the Supplementary data). In both models, the measured values were above the maximum limits for this pollutant (1.0 mg/L [
32]). The presence of copper was not verified in the samples.
4.2.2. Stormwater
The stormwater infiltrated through the models was also collected and its quality was compared with the quality of the stormwater runoff from the control sample.
The pH values in both models and also in the control were within the limits (6.0 to 9.0 [
31]). Compared to the control, in general, the pH decreased in model B and increased in model A (
Figure S10 in the Supplementary data). The concentrations of phosphorus in both models and also in the control were above the allowable maximum (0.1 mg/L [
31]). Higher concentrations were observed in model B compared to the control. On the other hand, model A was capable of reducing the concentration of phosphorus in comparison to the control in some events (
Figure S11 in the Supplementary data).
The phosphorus concentrations were very high. The local conditions may have influenced the results, i.e., near the place where the samples were collected there is a stream (5 m wide, 3 m deep, and 2 km long), which is polluted by household waste. According to Quevedo [
43], the concentration of phosphorus is more significant in heavily populated areas due to domestic sewage, especially by the use of detergents and soap.
Although iron concentrations were higher than the control, they were very low in comparison to the limit (15.0 mg/L [
32]) (
Figure S12 in the Supplementary data). The metallic apparatus used to support the layers in the boxes may have contributed to the increase in iron contamination. This also resulted in high concentrations of aluminium, more than the limit (0.1 mg/L [
32]). Stormwater in the control had aluminium concentrations below the threshold, but the concentrations increased after stormwater infiltrated through the models (
Figure S13 in the Supplementary data). It was observed that iron and aluminium concentrations in some measurements in model A were lower than in model B.
In general, zinc concentrations increased after stormwater infiltrated through the layers of the models. On the other hand, the models were able to reduce the concentration of nitrite in comparison to the control; model B was more effective in filtering nitrite than model A.
There was an increase of dissolved oxygen in all samples (
Figure S16 in the Supplementary data). However, the models were able to reduce the concentration of ammonia in comparison to the control (
Figure S17 in the Supplementary data). Although dissolved oxygen in model B was lower than in model A, its concentration was above the minimum limit (6.0 mg/L [
33]) in both models and also in the control.
For chromium, the concentrations were lower than the maximum limit (1.0 mg/L [
32]). In some cases, the models were capable of reducing copper concentrations in relation to the control. In many measurements, the copper concentration was lower than the limit (1.0 mg/L [
32]) (
Figures S18 and S19 in the Supplementary data).
4.2.3. Discussion
Table 4 shows a summary of the results for rainwater and also stormwater quality. After the rainwater was filtered in the layers of the models, the pH value was patterned between the limits. These results are similar to those found by Dierkes et al. [
22] and Llopart-Mascaró et al. [
24] shown in
Table 1. The average and standard deviation (
Table 4) showed that there was no high dispersion in the results. The same was observed for the stormwater analysis.
Bean et al. [
41] also observed that the concentrations of total phosphorus from rainwater were significantly lower than for stormwater. Tota-Maharaja et al. [
40] verified that the phosphorus in stormwater filtered by the pavement system has to be removed via mechanical filtration and biological treatment in case such water is to be used.
Iron concentrations both in the rainwater and the stormwater were very low. The results were different than those found in the literature. It is important to consider that there was an increase in iron concentration in the water. Such an increase may be due to the metal support used in the boxes.
In relation to aluminium concentrations, rainwater and stormwater presented values lower than the limit. However, the concentration in model A was, on average, a little higher than the limit for rainwater. For both models, concentrations in stormwater were higher than the control. The standard deviation was similar to the average. In research conducted in Australia, the stormwater runoff monitoring resulted in aluminium concentrations ranging from 0.032 to 0.056 mg/L [
41], higher than the concentrations obtained in this study.
The concentration of zinc increased after the rainwater was filtrated in the layers of the models. However, this was insignificant in comparison to the limits. The concentration in the control was lower than that found in the literature (0.52 mg/L). As for stormwater, the concentration of zinc decreased. As for nitrite concentrations found in the rainwater and the stormwater, the values did not reach the limits. The models were able to retain that parameter. Nitrite concentration in the stormwater can range from 0.005 to 0.012 mg/L [
41].
The concentration of phosphorus found in rainwater was higher than the limit but similar to that found in the literature (0.01 to 0.23 mg/L). As for stormwater, the concentrations were higher than those found in the literature, which may indicate the influence of the region (next to the sea, where rainfall may contain more phosphorus concentrations). The models were unable to reduce phosphorus concentrations. However, the standard deviation was high, so the sample values were not homogeneous.
Ammonia concentrations measured in the rainwater and the stormwater were much lower than the limit. These values match those found in the literature, i.e., 0.10 to 2.0 mg/L for stormwater runoff and 0.5 to 2.3 mg/L for rainwater [
22]. The models were shown to be able to filter ammonia.
In a parking lot located in New Jersey, the U.S. Environmental Protection Agency constructed porous pavement sections (54.9 m
2 each) that direct stormwater runoff into 5.7 m
3 tanks. The sections were: porous interlocking concrete pavement (PICP), porous concrete (PC), and porous asphalt (PA). Brow and Borst [
44] collected samples in the tanks and in situ from 13 rainfall/runoff events over 12 months. The water was analysed for nitrogen species, orthophosphate, and organic carbon. According to the authors, opposite to assumptions based on the literature, the PA samples had significantly greater total nitrogen concentrations than runoff and samples from the other porous pavement types, indicating that nitrogen leached from materials in the PA layer. Also, there was no great difference in total nitrogen concentration between runoff and samples from either PICP or PC, but total nitrogen was significantly higher in stormwater runoff than in rainwater. Nitrate was the dominant nitrogen species in the samples. The PA sample had significantly higher nitrite and ammonia concentrations than PICP and PC. Contrary to the nitrogen results, the PA sample had significantly lower orthophosphate concentrations than rainwater, stormwater runoff, and samples from PICP and PC. The results have shown that such porous pavement systems do not reduce total nitrogen concentrations from stormwater runoff due to the lack of anaerobic conditions.
Dissolved oxygen refers to the level of free, non-compound oxygen present in water. According to Brazilian regulations, the minimum limit is 6.0 mg/L. Results indicate that dissolved oxygen remained above the limit. In rainwater, the values measured by Chughtai et al. [
45] varied from 6.3 to 8.2 mg/L, i.e., similar to those found in this study.
For chromium and copper, the measured concentrations were lower than the limits. For rainwater, the concentration was similar to that found by Llopart-Mascaró et al. [
24].
Based on the analysis of pollutants performed herein, it was observed that rainwater and stormwater runoff are not significantly contaminated in Florianópolis.
The data presented in this work are part of a greater research project still in progress. The next steps of the research include measurements that will be performed in several places where the presence of contaminants may differ from those shown herein. Also, each pavement material layer will be tested separately in order to quantify the effects of each material in the testing setup. Many different layers will be tested. Distilled water will also be used.
Another important assessment that has to be made is the measurement of water quality in different seasons, as Drake et al. [
17] and Cederkvist et al. [
46] studied.
In order to compare the results between the models, a statistical analysis of the pollutants concentration in the rainwater and stormwater samples filtered by the models was performed (
Figures S20 and S21 in the Supplementary data). It was observed that there is no significant difference between the filtering capability of the models that could indicate that one is better than the other.
5. Conclusions
This study assessed porous asphalt pavement structures in order to evaluate their capability to reduce pollutants concentrations. After rainwater was filtered through the layers of the models, the concentration of the following parameters, on average, increased in comparison to the control: phosphorus, iron, aluminium, zinc, nitrite, chromium, and copper. As for phosphorus and aluminium, their concentrations exceeded the established limits; phosphorus concentration also exceeded the limit in the control. Regarding pH, it increased and was within the established limits, but in the control, it was below the established limit. In relation to dissolved oxygen, there was no significant difference between the models and the control. Model A was able to reduce the concentration of ammonia.
As for the analyses regarding stormwater, there was no significant difference between the results for both models. The concentration of phosphorus, iron, aluminium, zinc, nitrite, chromium, and copper increased in comparison to the control. The pH value increased after stormwater was filtered through the layers of the models. The concentrations only exceeded the limits for phosphorus and aluminium. Both models were capable of filtering and reducing the ammonia concentration.
No odours in the rainwater and stormwater were detected in comparison to the control. Also, no fecal coliforms were detected either in the rainwater or stormwater tests.
It was observed that the rainwater and the stormwater runoff collected in Florianópolis are not significantly polluted. It was also possible to conclude that stormwater filtered through asphalt porous surfaces and porous asphalt pavements could be used for non-potable purposes in buildings. From this study, it was possible to identify and quantify what pollutants are present in rainwater and stormwater runoff. However, the standards used herein are meant for non-potable uses and therefore restrictive. Nevertheless, it was possible to quantify several pollutants whose concentrations could either be increased or decreased after being filtered through the layers of pavement models, allowing for the selection of proper treatment in case such water is to be used.
The models tested showed to be able to filter out, from stormwater runoff and rainwater, a few pollutants, but not all of them. However, porous asphalt pavements are still an alternative to harvest stormwater for non-potable uses in buildings and to recharge the water table. Additionally, for the implementation of porous asphalt pavements, it is important to avoid their proximity to potential sources of pollutants such as sewers, polluted rivers, and landfills.


