Article

Empirical Characterization of Particle Size Distribution Spatial Dynamics for Helminth Eggs Detection in Waste Stabilization Ponds (WSP) †

1
College of Engineering and Technology, Department of Water Resources Engineering, University of Dar es Salaam, Dar es Salaam P.O. Box 35131, Tanzania
2
School of Engineering, Institute for Infrastructure and Environment, The University of Edinburgh, Edinburgh EH8 9YL, UK
*
Author to whom correspondence should be addressed.
This paper is an extended version of our paper published in 2nd International Electronic Conference on Water Sciences (ECWS-2), 16–30 November 2017.
Water 2018, 10(2), 138; https://doi.org/10.3390/w10020138
Submission received: 13 December 2017 / Revised: 12 January 2018 / Accepted: 24 January 2018 / Published: 1 February 2018

Abstract

:
This study assesses seasonal particle size distribution (PSD) dynamics inside a waste stabilization ponds (WSP) (Buguruni, Tanzania) to understand settling dynamics of wastewater particles with an interest in helminth eggs. Results indicate that particles coming into the pond are mainly supracolloidal and settleables with 52.9% and 45.6%, respectively, in dry season and 48.9% and 49.9%, respectively, in wet season. Inflow PSD is a unimodal distribution that splits into settling and suspended PSDs, with an indication of particle breakage, as shown by the increased volume of smaller particles and hence the appearance of a bimodal distribution for the suspended particles. Up to 61.5% and 45.2% of particles that fall within the size range of helminths eggs are suspended during dry and wet seasons, respectively, with the potential to be carried in the effluent and to cause contamination.

1. Introduction

Wastewater contains a mixture of particles with sizes ranging from 0.001 to more than 1000 microns. Among them are parasites and parasite eggs. Parasites in wastewater are a public health concern [1,2], since they cause diseases such as helminthiasis, a serious health condition affecting nearly a quarter of the world’s population [3]. Helminthiasis caused by ascaris, trichiura, and taenia, for example, result in poor health and retarded growth in school children, epileptic seizures, maternal death, and lower efficacy of tuberculosis (TB) vaccination, leading to the placental transfer of TB by pregnant women [3,4]. The major infection mechanisms of these parasites are via their eggs found abundantly in wastewater in developing countries and food crops irrigated with contaminated water [5]. The development of efficient wastewater treatment systems that are able to remove these eggs completely is crucial to controlling their spread.
Helminths eggs’ sizes in wastewater range between 20 and 80 μm, and their specific gravity ranges between 1.056 and 1.3 [5,6,7,8]. Complete removal of the eggs is by sedimentation in waste stabilization ponds (WSP) [8,9,10,11] when a hydraulic retention time (HRT) of about 20 days has been achieved [9,12,13]. However, actual HRT in WSP is normally lower than the designed HRT, thereby compromising their performance [14,15,16], including the removal of helminth eggs [16]. Moreover, WSP are not designed for sedimentation, despite the universal acceptance that this is the main mechanism for helminth eggs removal, as well as a large percent of other pollutants. Also, primary facultative ponds are designed to receive particle-free raw wastewater (suspended solids concentrations less than 300 mg/L); therefore, the processes that normally take place in anaerobic and facultative ponds occur simultaneously here. In this case sedimentation of helminth eggs is also expected to occur in the primary facultative pond. These ponds are shallower than anaerobic ponds and contain algae that introduce other particles into the wastewater. Furthermore, literature shows that particles in wastewater can interact with parasite eggs and cysts and affect their sedimentation [8,17,18,19,20]. How these other particles influence the settling characteristics of eggs is still not clear, as both reduced and increased settling velocities in wastewater have been observed [8,19]. As a consequence of the lack of design for sedimentation and a fundamental understanding of the interactions between particles and helminth eggs in WSP, helminth eggs have been found in WSP effluents, even for ones with a HRT higher than 20 days, causing contamination and disease outbreaks. Since sedimentation leads to the modification of particle size distribution (PSD), studies on how particles sizes vary inside the pond may be used to study the sedimentation process in the ponds. This study explores particle size variations inside a facultative pond of an operating WSP to study how sedimentation occurs. The Buguruni WSP receives a daily influent of around 691 m3. After treatment, the effluent is discharged into Msimbazi River, which is highly encroached with people building houses and gardening very close to it. The river water is used for irrigation of vegetables along its course, and therefore the removal of helminth eggs and cysts is important to prevent their spread.

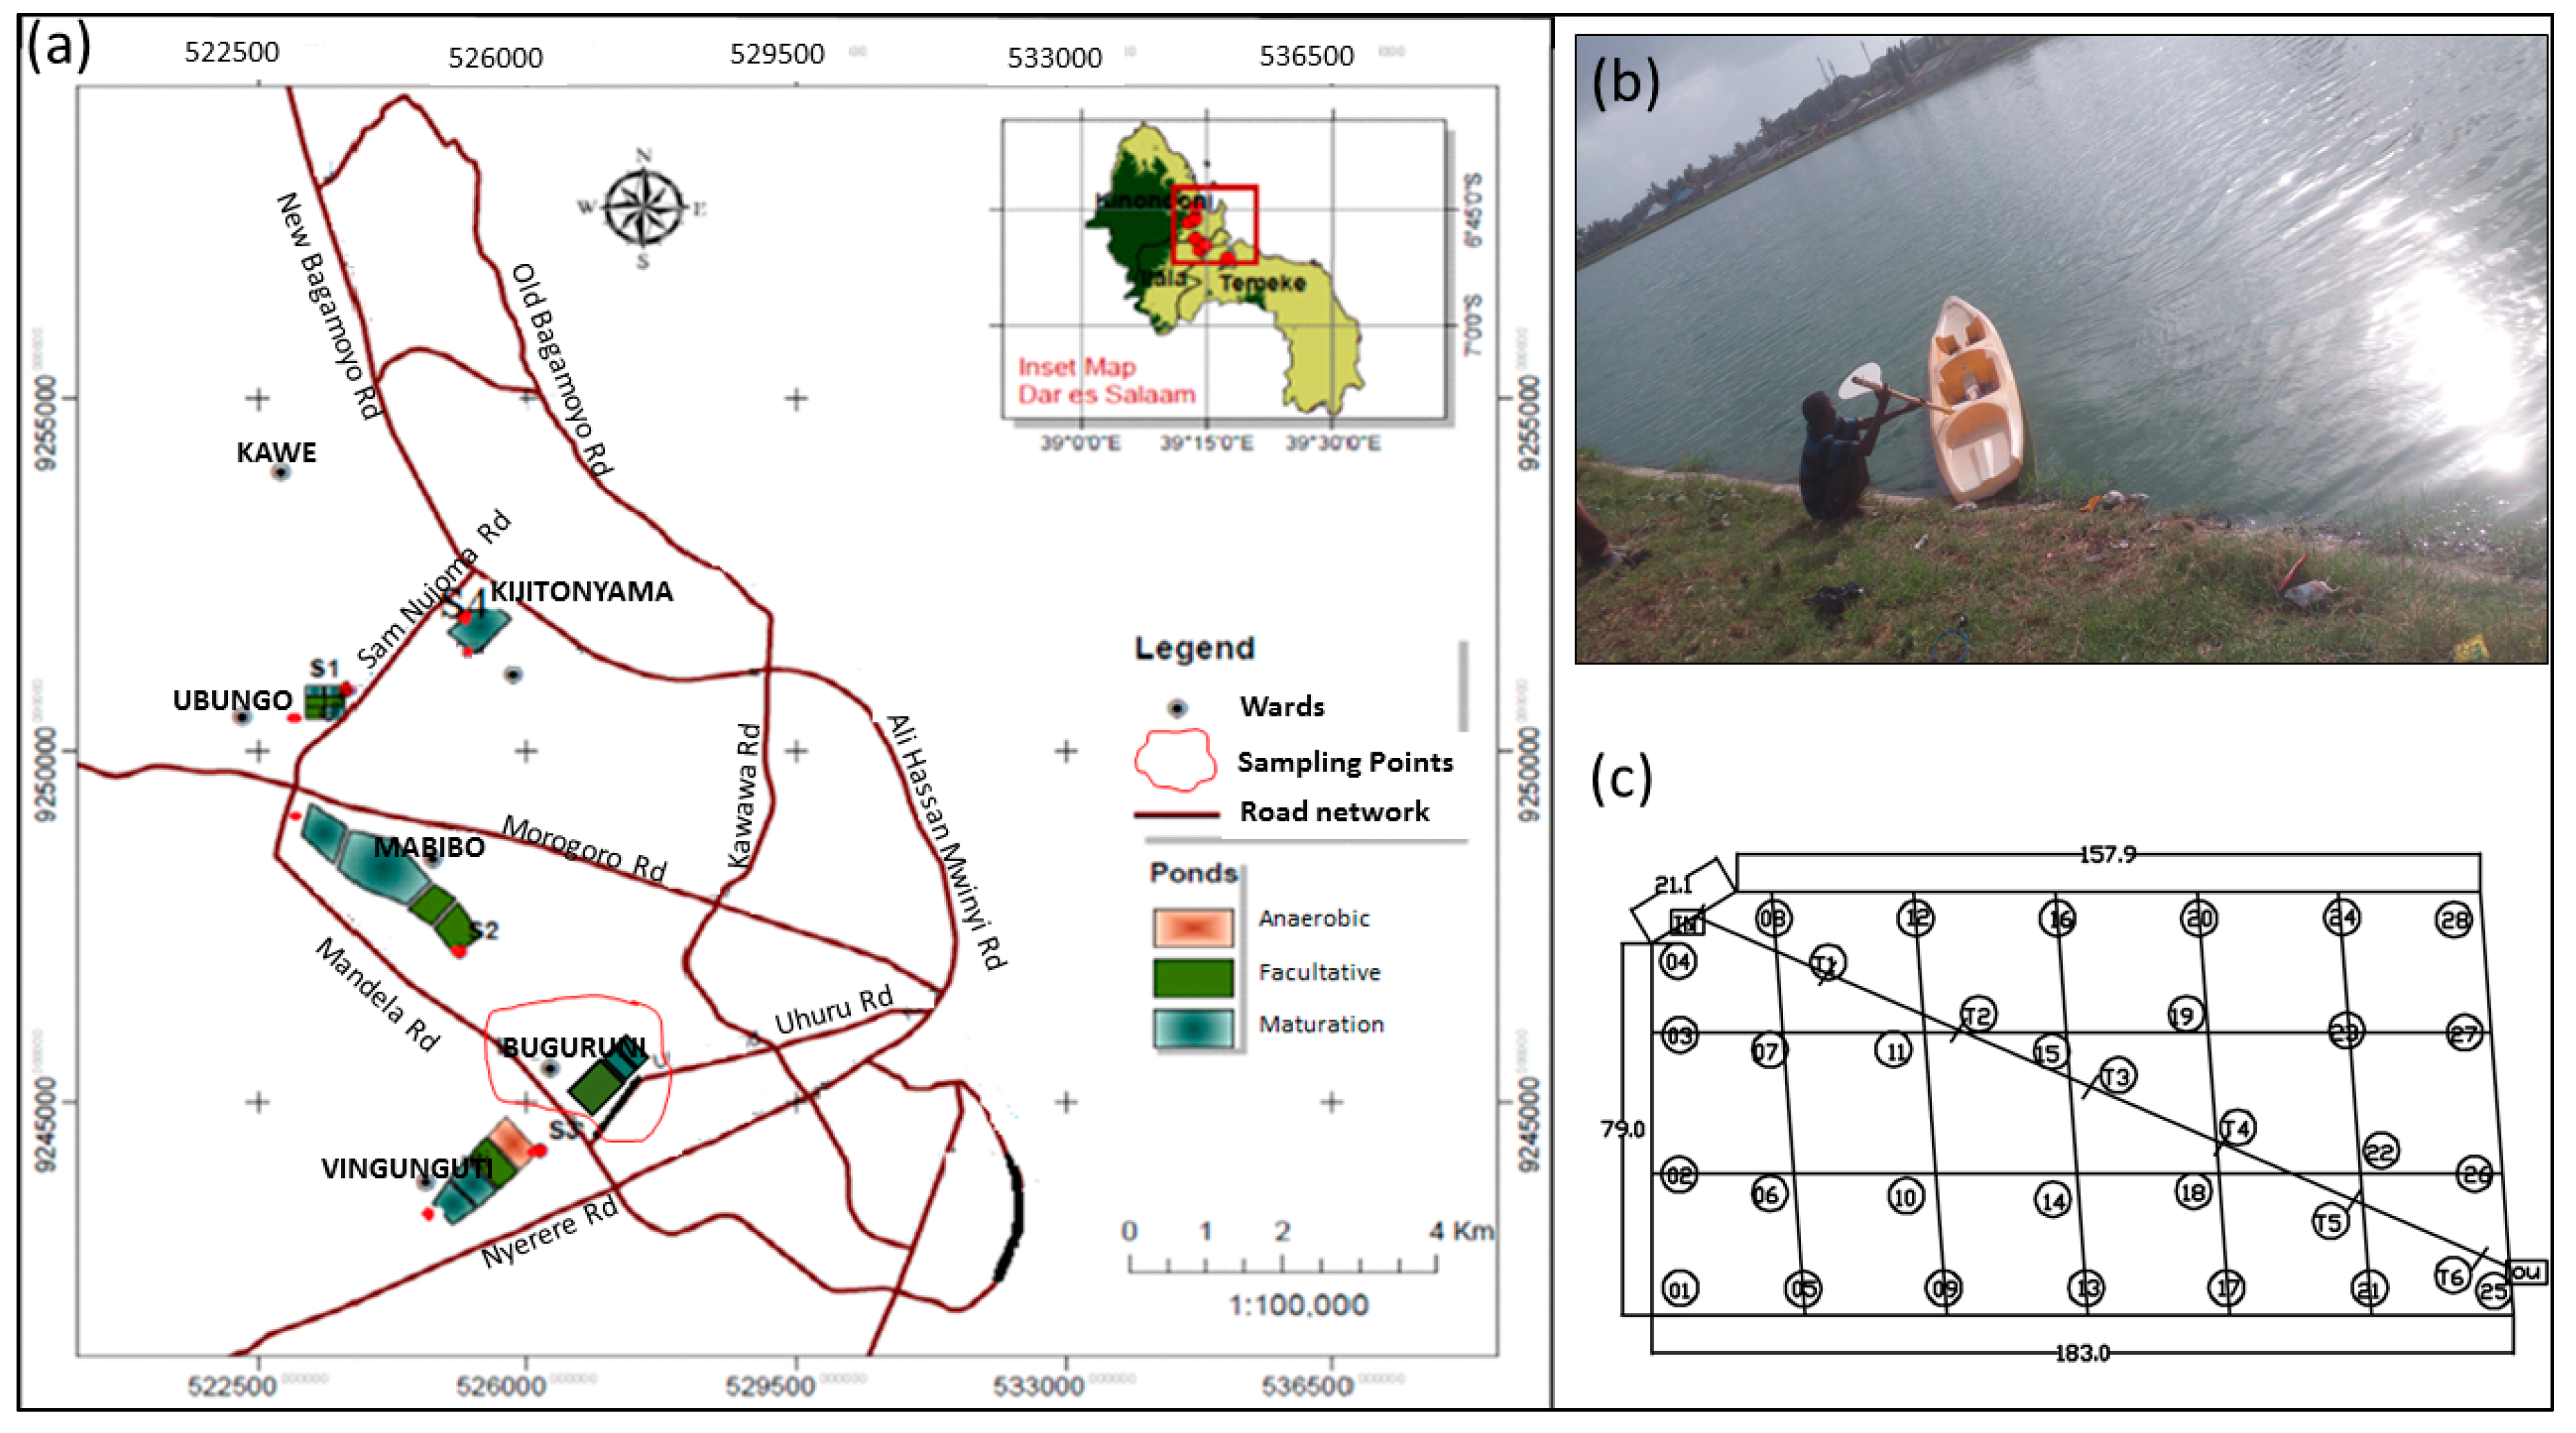
2. Materials and Methods

The study was conducted in Buguruni pond, Dar es Salaam, Tanzania (Figure 1a). The pond receives domestic waste water from the nearby areas of Buguruni and Tazara. The treatment system consists of one (1) facultative pond and two (2) maturation ponds, and sedimentation of helminth eggs is expected to occur mainly in the facultative ponds.
Water samples were collected from the facultative pond between December 2016 and January 2017 and again between May and June 2017, i.e., in the dry and in the wet seasons, respectively. Using a 6.2 L van Dorn water sampler with marks on the rope to show different depths, water samples were collected at nodes (circled numbers in Figure 1c) from top, at depths of about 25 cm below water surface and near the pond bottom. The pond has dimensions of 183 × 90 m and therefore the cell size was chosen such that it was sufficient to capture the spatial characteristic without creating too many sampling points. A marked rope secured to the sides of the pond was used to mark the nodes, and navigation was done using a non-motorized boat. Immediately after collection, samples were taken to the Chemical and processing Engineering laboratory of the University of Dar es Salaam for particle size distribution analysis by Malvern 2000 Mastersizer (Malvern Instruments, Malvern, UK). A hydrodynamic model was run in Delft3D (Deltares Open Source Community, Delft, The Netherlands) software using characteristic data (discharge, length, width, and depth) from the pond to obtain its hydrodynamic characteristics. Pond depth measured at the nodes was used to create bathymetry data in Delft3D QUICKIN function. Regular grids and pond boundaries were created using the RGFGRID functions in Delft3D. To create a 3D model, the pond was divided into five layers of 22 cm each, and the initial bathymetry was obtained by subtracting water depth from total depth. No slip boundary conditions were assumed, while the friction coefficient was set to 65 for both x and y directions. The resulted travel times, intended as the time particles take to be advected to that location in the pond (not included).

3. Results and Discussion

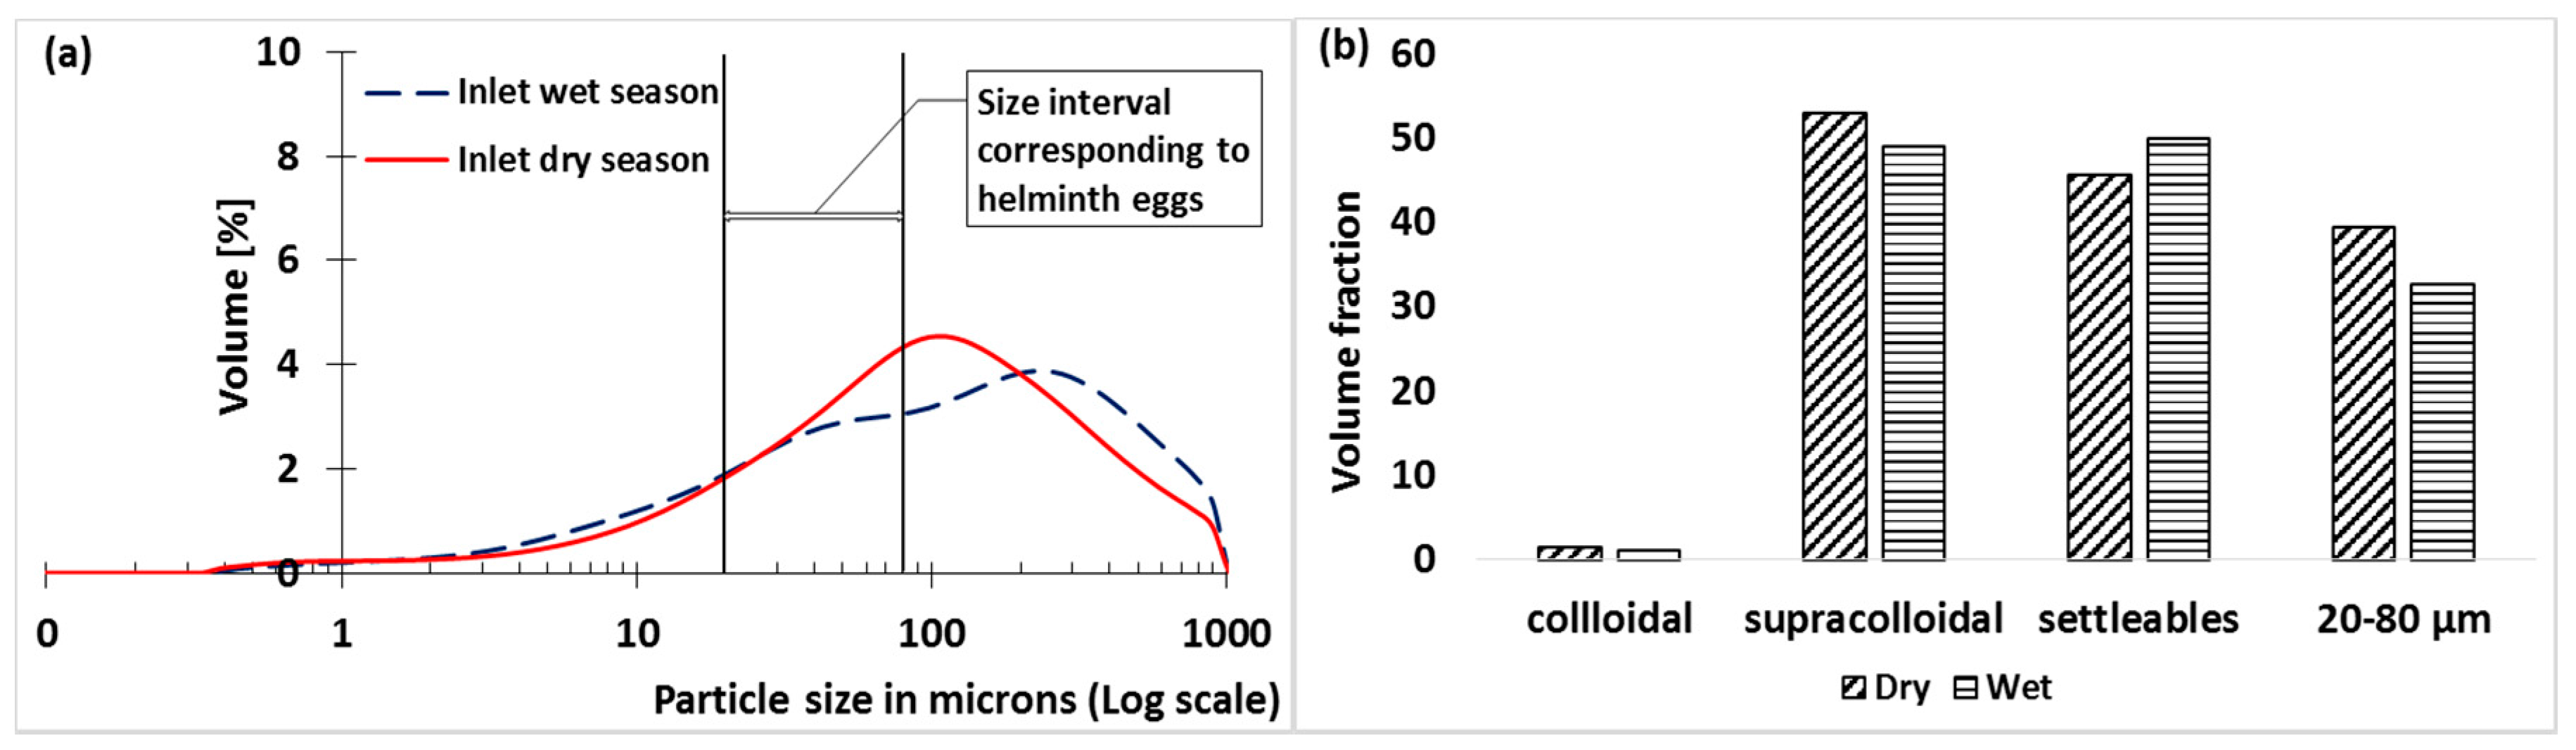
3.1. Inflow Volume Fraction Particle Size Distribution
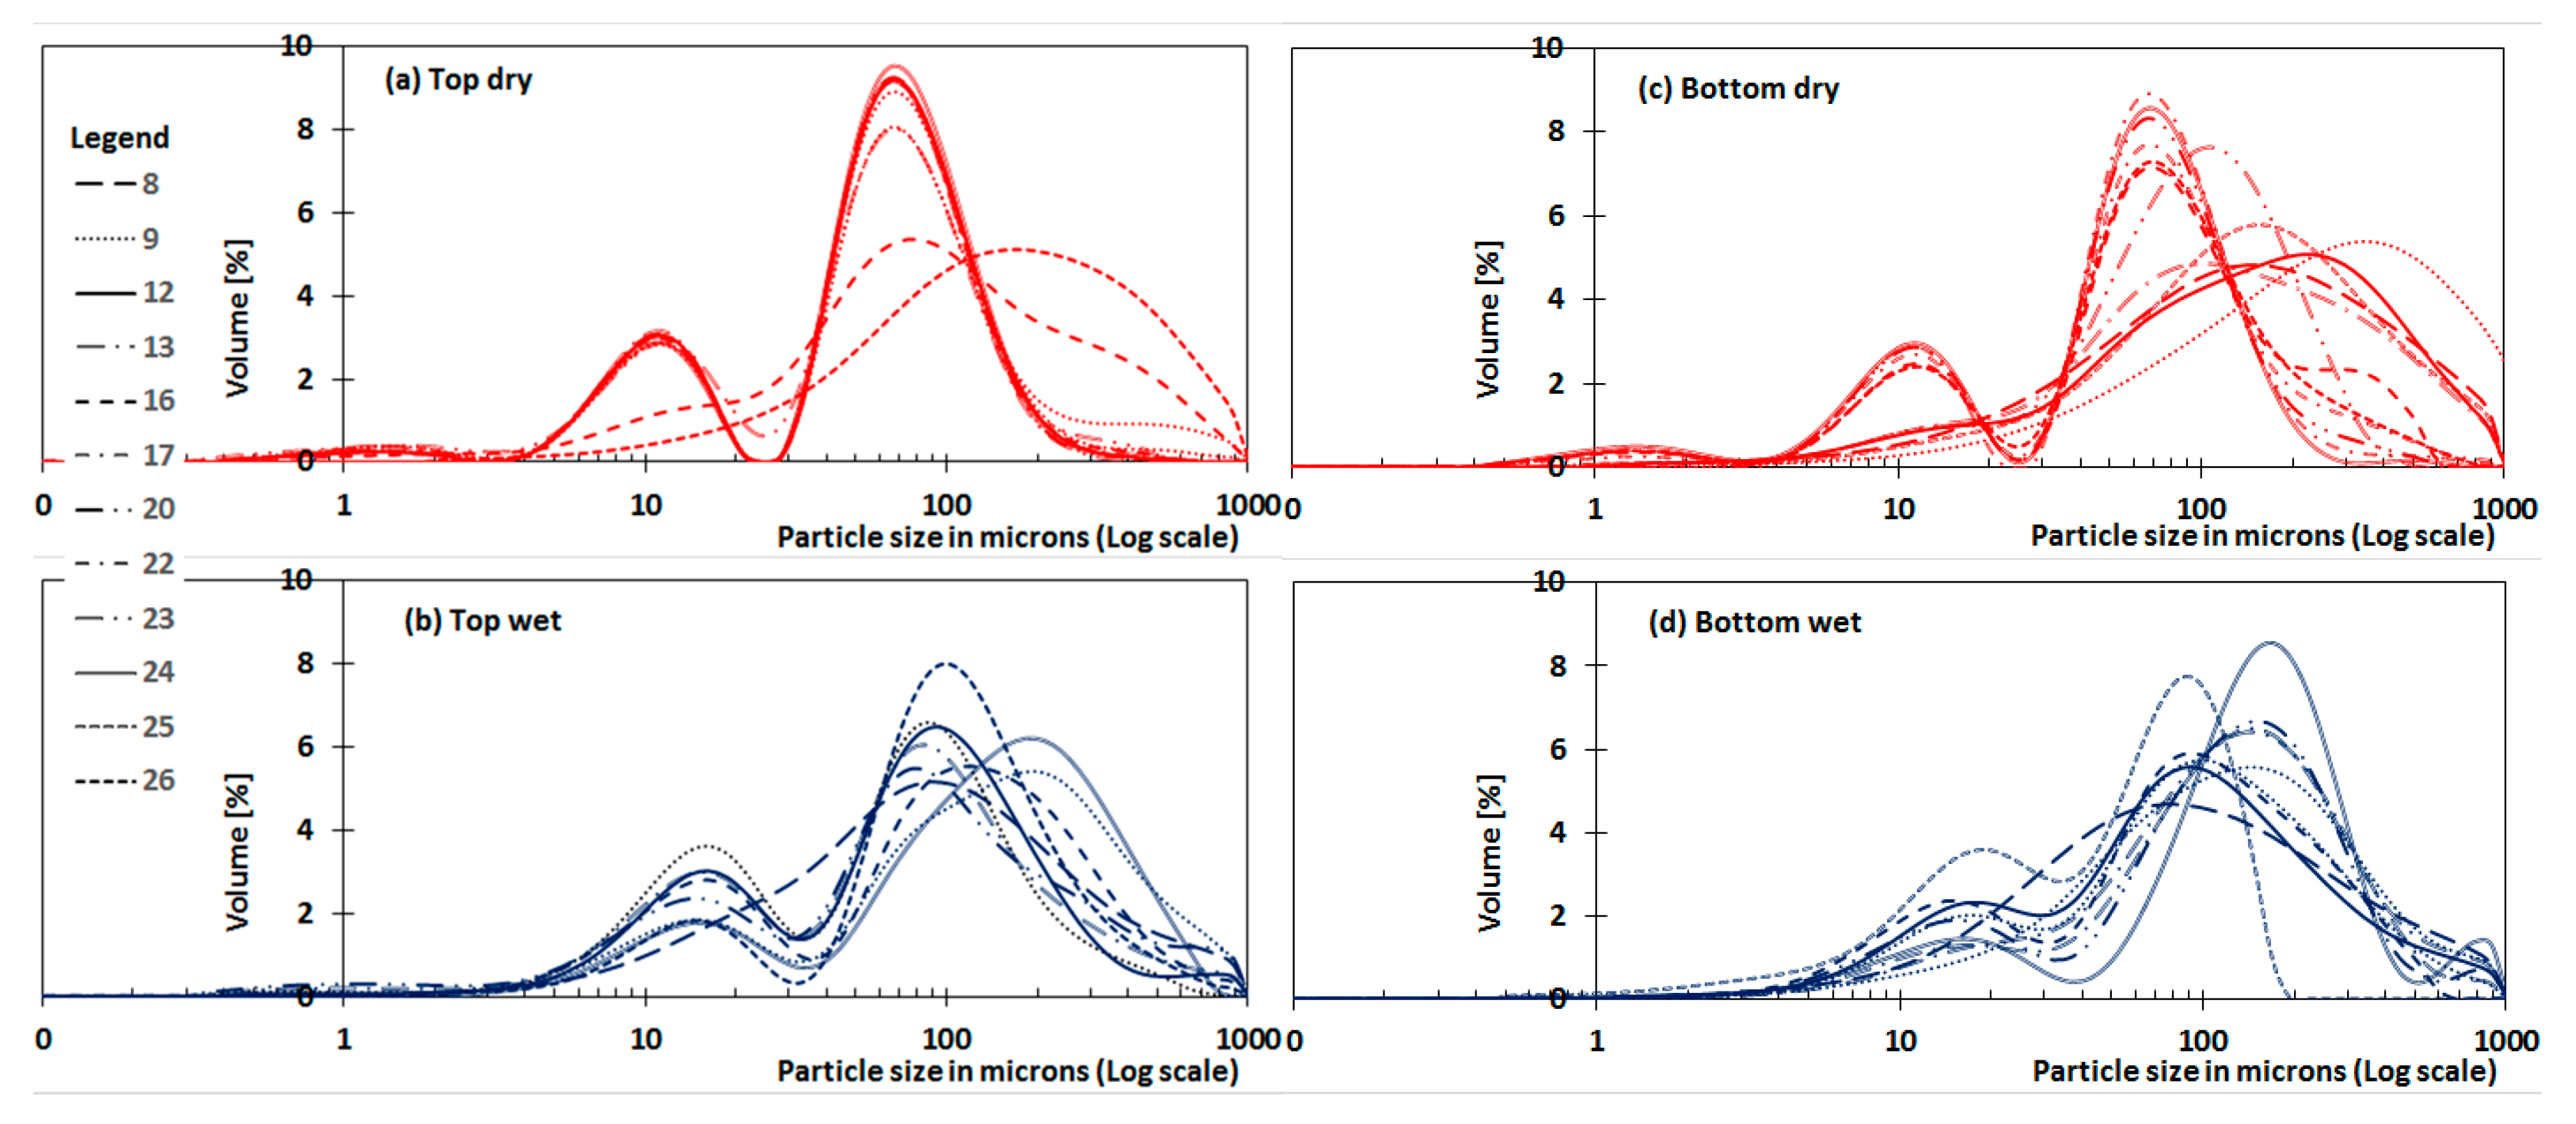
The Particle Size Distribution (henceforth referred to as PSD), in terms of diameter of volume-equivalent spherical particles at the WSP inlet for both seasons, is unimodal distribution skewed towards larger particles of 100 microns or more (Figure 2a). In the rainy season, the mode shifts to the right, likely due to defect pipes, which can introduce sand particles in the inflow to the WSP, resulting in higher average particle sizes. Samples collected in different days within the same season did not show significant differences, indicating no in-season PSD variations.
The volume of particles corresponding to a prescribed size interval was obtained by calculating the area under the curve between the size intervals. Categorizing particles into their size fractions, i.e., dissolved (<0.001 microns), colloidal (0.001–1 microns), supracolloidal (1–100 microns), and settleable (>100 microns) showed no significant variation for dry and wet weather (Figure 2b). Surprisingly, particles with sizes <1 microns (i.e., dissolved and colloidal) are almost non-existent (1.5% and 1.1% in dry and wet weather, respectively), in contrast to existing literature where they contribute the largest percent of particles [21]. The values for dissolved, colloidal, supracolloidal, and settleable fractions are 0%, 1.5%, 52.9%, and 45.6%, and 0%, 1.1%, 48.9%, and 49.9% in dry and in wet weather, respectively. Therefore, wastewater flow into Buguruni WSP is composed largely of supracolloidal (possibly containing Helminth’s eggs) and settleable particles. This is in contrast to the reported fractions in literature, whereby dissolved and colloidal particles form the largest fraction of particles. However, it was observed that most of the toilets in the area are unlined pit latrines, which have a tendency to erode and introduce sand particles into the sewerage. Also, more than one-third (30 percent) of inflow particles in the Buguruni ponds fall within size class of helminth eggs (20–80 microns) (Figure 2b). Therefore, efficient sedimentation of these particles will guarantee an efficient removal of helminth eggs.

3.2. In-Pond PSD

Two types/groups of PSDs exist inside the pond for both wet and dry season, as well as top and bottom (Figure 3). These PSDs are either represented by a unimodal distribution (mainly samples collected at the bottom hence sedimenting particles) or a bimodal distribution (mainly for samples collected at the top hence suspended particles). Dry weather bimodal distributions at the top and bottom have modes concentrated around a similar size, with the first peak around 10 microns and the second peak around 67 microns (Figure 3a,c). The similar modes on both top and bottom could be a result of well mixed conditions inside the pond as observed by [22]. In wet weather, the bimodal distribution shifts to the right, with peaks around 15 microns and 100 microns (Figure 3b,d), and the separation of the two peaks is not as clear as the separation for dry weather. The shift towards coarser particle sizes in wet weather could be a result of change in inflow PSD due to defect pipes, as well as possible erosion of deposited materials due to increased flow caused by broken sewage system.
The bimodal distributions are characterized by more supracolloidal particles than settleable particles. This is especially the case during dry weather, in which the bimodal distribution is found throughout the top layers of the pond, except for nodes 8 and 25. Node 8 is located close to the inlet, while node 25 is close to the outlet of the WSP. Typically, these are areas with vorticity created by change in cross sectional area, and therefore settled particles maybe resuspended, and a unimodal distribution may be obtained.
The bimodal distribution is also found in some nodes of the bottom layer, for both dry and wet weather, which could indicate that these are areas in which no sedimentation is taking place and there is the same bimodal PSD from top to bottom of these nodes (Figure 4c). The increase in smaller particles inside the pond that leads to appearance of bimodal distributions, as opposed to the unimodal distribution at the inlet, may be due to breakage of larger weaker particles caused by shear stress [23].
The unimodal distribution is right skewed and is richer in settleable particles than supracolloidal. The distributions have modes at different diameters and long tails towards the smaller particle sizes (less than 10 microns) that disappear during wet weather probably due to the shift in inflow particles during this season. This distribution is found mostly in samples collected at the bottom and node 8 and 25 at the top (Figure 3c,d), indicating that these are depositing particles. The explanation for the existence of the unimodal distribution at the top for node 8 and 25 is given in the previous paragraphs. This distribution is found from the inlet to about half pond length (from inlet to nodes 12 and 13).

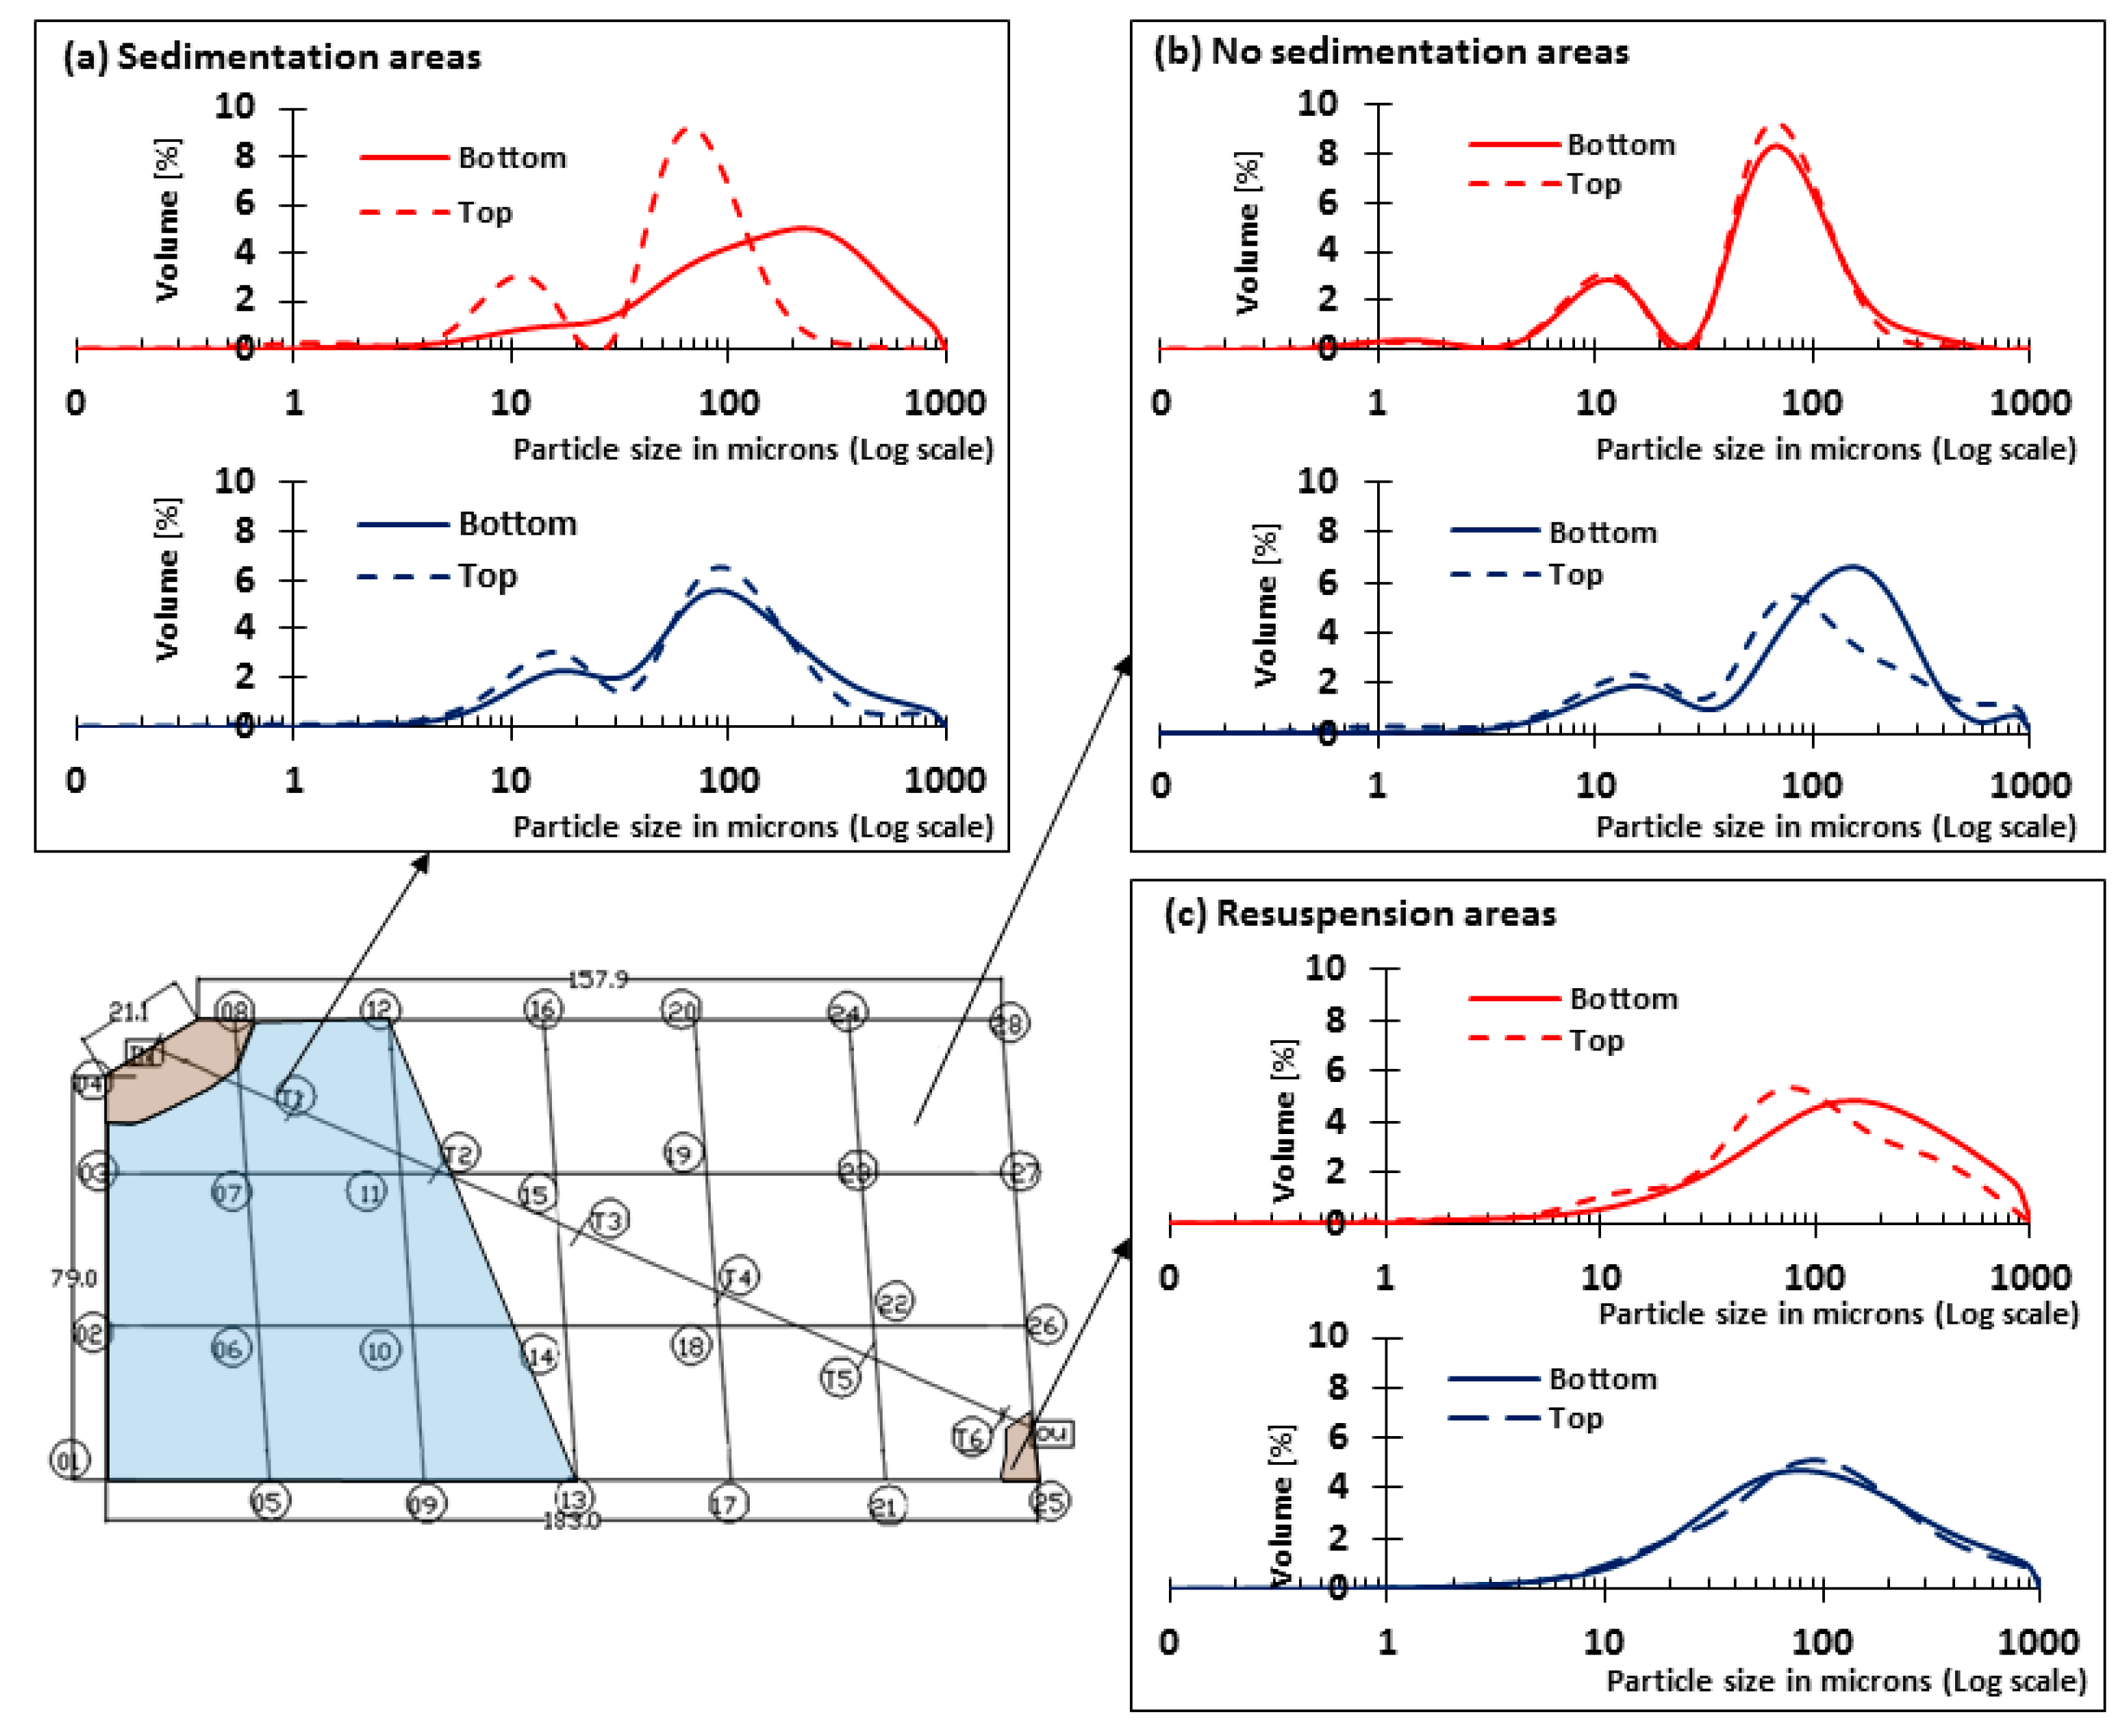
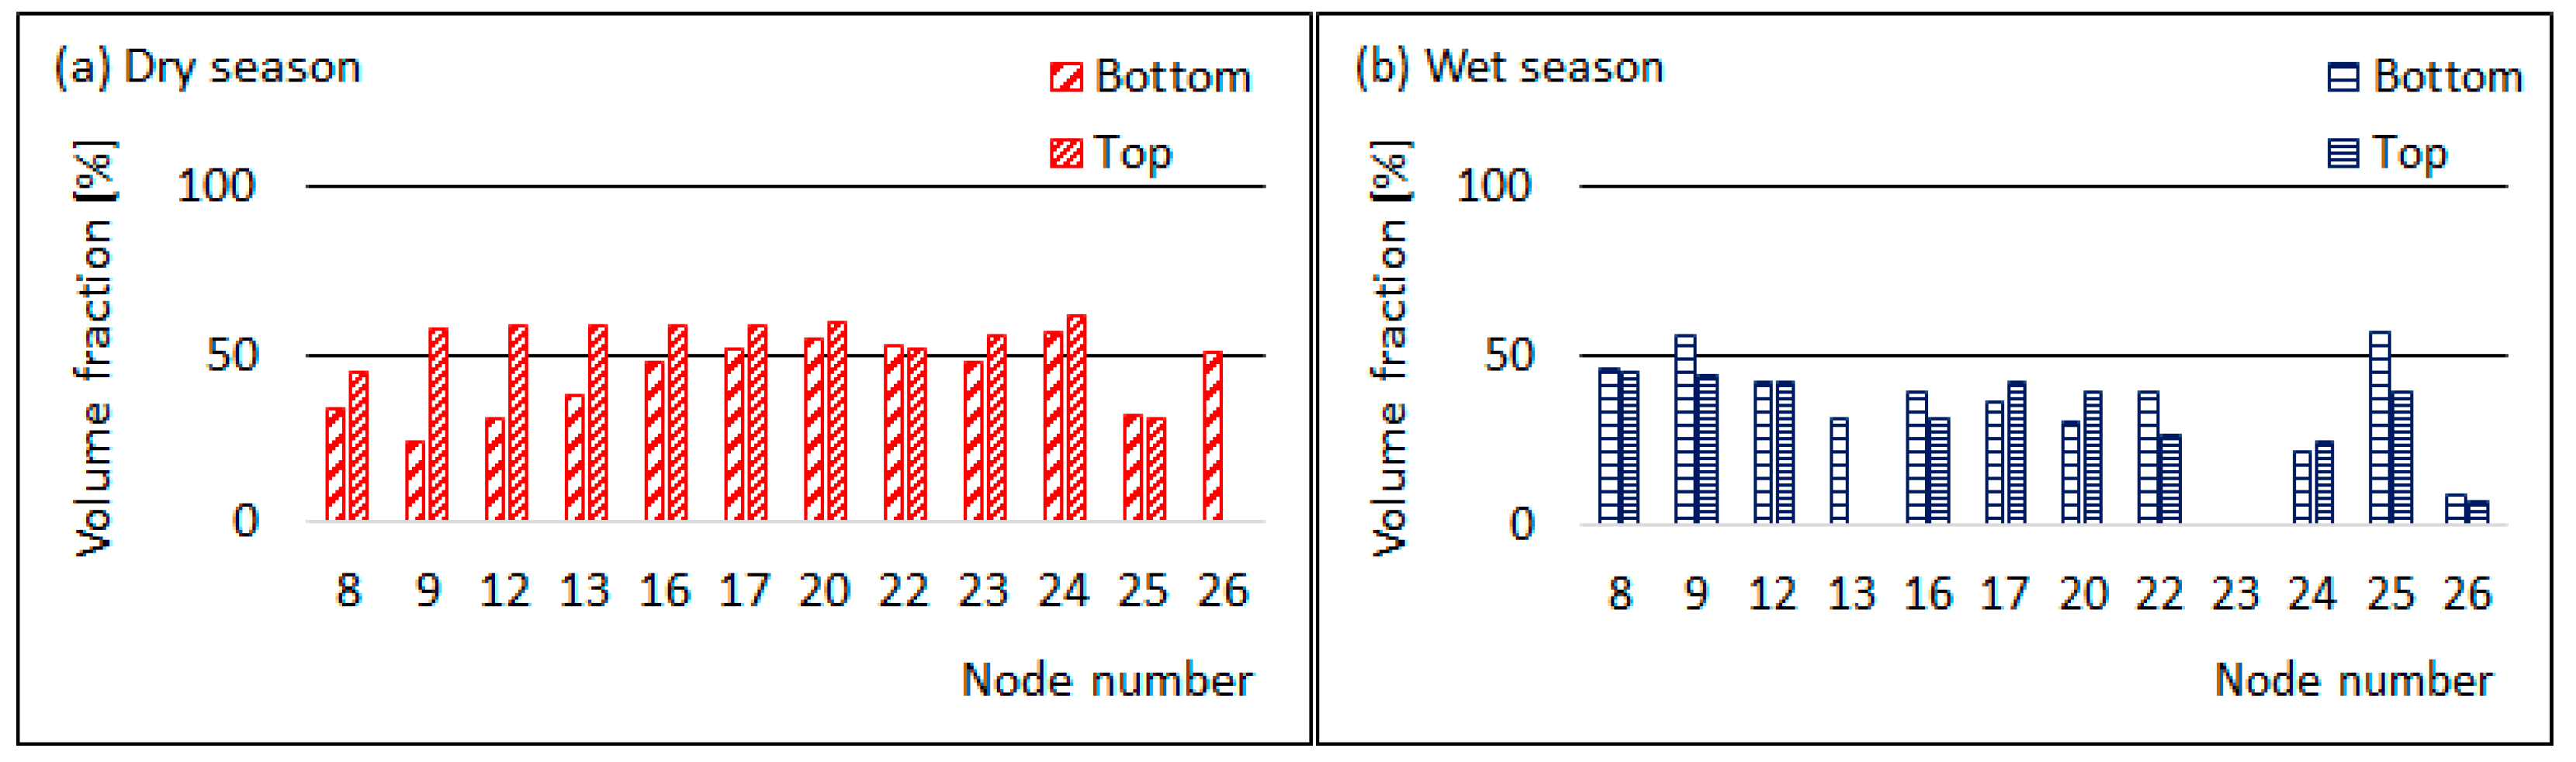
3.3. Comparison of Top and Bottom PSD

This analysis revealed areas in the pond where sedimentation is taking place, as well as those where resuspension of settled particles occurs. Locations with resuspension of settled particles were identified as those that had a unimodal PSD that represents settling particles at top and bottom (Figure 4a). As pointed out before, these are locations with turbulence that originates from changes in cross section area and convective acceleration of the flow at the outlet, and hence resulting resuspension of settled particles. Locations where sedimentation is taking place have different PSDs at top and bottom (Figure 4b). The top has a bimodal distribution (non-settling particles), while the bottom has a unimodal distribution (settling particles). Lastly, there are locations where no sedimentation is taking place, and they consist of similar bimodal distributions at the top and bottom (Figure 4c). These locations are found from about mid-pond to the end of the pond, except in areas close to the outlet. The similarity of PSD at the top and bottom indicates a mixing process driven by molecular diffusion due to temperature gradient, with top layers having much higher temperatures than the bottom layers as reported in [22], which take place along the vertical direction. The above-described trends and their locations are almost constant in both wet and dry season, as shown in Figure 4.

3.4. Particles with Sizes between 20 and 80 Microns

Among the objectives of this research was to study the sedimentation of particles with sizes between 20 and 80 microns, as they have the highest chance of containing parasite eggs and cysts that are detrimental to human health. Results show that these particles appear throughout the pond, both at top and bottom, with an increased volume compared to that of the incoming particles, indicating that they are generated by particle breakage inside the pond (Figure 5a,b). The particles do not exhibit any particular trend at the different locations, but their volumes are consistently higher at the top, especially during dry weather. Their total volume fraction is slightly lower during the wet season, perhaps due to shift of inflow particles towards the large particle sizes (>100 microns). Analysis of helminth eggs for water samples collected at the bottom was done using the modified Bailenger method described in [24], with formalin used instead of acetoacetic buffer, as the later tend to destroy the eggs [25]; however, very few eggs (only two eggs in 12 samples) were recovered.

4. Conclusions

This research looked at how incoming wastewater particle sizes change inside a primary facultative pond of a WSP and is of key importance for all those water treatment plants where a primary sedimentation pond is missing. It was observed that particles coming into the pond are mainly supracolloids and settleables, although information about their densities was missing. Once inside the pond, the incoming PSD split into settling and non-settling PSDs, with an indication of particle breakage, as shown by the increased volume of smaller particles and hence appearance of a bimodal distribution. Sedimentation takes place mostly in the first half part of the pond, while the remaining part has suspended particles only. Particles with sizes between 20 and 80 microns (the size of helminth eggs) as well as settleable particles (>100 microns) are in abundance in suspension. Although these may not necessarily contain helminth eggs, they indicate a large potential for the eggs to remain in suspension and be carried out of the system. Further research on particle density variations inside the pond may enable tracing of the eggs based on their characteristics. However, measuring particle density is an extremely demanding effort. This asks for developing an inverse modelling technique for reconstructing the particle density distribution starting from the PSD difference at the top and the bottom and the travel times where sedimentation can occur. Travel times (which result in the HRT of the pond) are crucial to the operation of WSP [14,15,16], and therefore the next task will be the development of a hydraulic model in Delft3D that is able to capture actual flow conditions in the Buguruni WSP. The PSD data presented here will be used, together with a hydrodynamic model developed in Delft3D, to derive the range of densities of wastewater particles at different nodes in the Buguruni WSP and hence trace where helminth eggs are most likely to be found.

Acknowledgments

I would like to thank The Commonwealth Scholarship Commission in the United Kingdom (CSC) for funding this research through its PhD scholarships for low and middle-income countries.

Author Contributions

Fides Izdori prepared and carried out sampling campaigns and laboratory analysis. Paolo Perona and Andrea J. C. Semiao provided guidance during data analysis as well as in the preparation and structuring of this manuscript.

Conflicts of Interest

The authors declare no conflict of interest.

References

  1. Mara, D.D.; Faechem, G.A. Water- and excreta-related diseases: Unitary environmental classification. Environ. Eng. 1999, 125, 334–339. [Google Scholar] [CrossRef]
  2. Lloyd, B.J.; Frederick, G.L. Parasite removal by waste stabilisation pond systems and the relationship between concentrations in sewage and prevalence in the community. Water Sci. Technol. 2000, 42, 375–386. [Google Scholar]
  3. Hotez, P.J.; Brindley, P.J.; Bethony, J.M.; King, C.H.; Pearce, E.J.; Jacobson, J. Helminth infections: The great neglected tropical diseases. J. Clin. Investig. 2008, 118, 1311–1321. [Google Scholar] [CrossRef] [PubMed]
  4. Mwanjali, G.; Kihamia, C.; Kakoko, D.V.; Lekule, F.; Ngowi, H.; Johansen, M.V.; Thamsborg, S.M.; Willingham, A.L. Prevalence and risk factors associated with human Taenia solium infections in Mbozi District, Mbeya Region, Tanzania. PLoS Negl. Trop. Dis. 2013, 7, e2102. [Google Scholar] [CrossRef] [PubMed]
  5. Jimenez-Cisneros, B.E. Helminth ova control in wastewater and sludge for agricultural reuse. In Water and Health; Grabow, W.O.K., Ed.; Eolss Publishers: Oxford, UK, 2007. [Google Scholar]
  6. David, E.D.; Lindquist, W.D. Determination of the specific gravity of certain Helminth eggs using sucrose density gradient centrifugation. J. Parasitol. 1982, 68, 916–919. [Google Scholar] [CrossRef] [PubMed]
  7. Shuval, H.I.; Adin, A.; Fattal, B.; Rawitz, E.; Yekutiel, P. Wastewater Irrigation in Developing Countries: Health Effects and Technical Solutions; World Bank: Washington, DC, USA, 1986. [Google Scholar]
  8. Sengupta, M.E.; Thamsborg, S.M.; Andersen, T.J.; Olsen, A.; Dalsgaard, A. Sedimentation of helminth eggs in water. Water Res. 2011, 45, 4651–4660. [Google Scholar] [CrossRef] [PubMed]
  9. Ayres, R.M.; Stott, R.; Lee, D.L.; Mara, D.D.; Silva, S.A. Comparison of techniques for the enumeration of human parasitic helminth eggs in treated wastewater. Environ. Technol. 1991, 12, 617–623. [Google Scholar] [CrossRef]
  10. Stott, R.; May, E.; Mara, D.D. Parasite removal by natural wastewater treatment systems, performance of wastewater stabilization ponds and constructed wetlands. Water Sci. Technol. 2003, 48, 97–104. [Google Scholar] [PubMed]
  11. Von Sperling, M.; Chernicharo, C.A.L.; Soares, A.M.E.; Zerbini, A.M. Evaluation and modelling of helminth eggs removal in baffled and unbaffled ponds treating anaerobic effluent. Water Sci. Technol. 2003, 48, 113–120. [Google Scholar] [PubMed]
  12. Ayres, R.M.; Alabaster, G.P.; Mara, D.D.; Lee, D.L. A design equation for human intestinal nematode egg removal in waste stabilization ponds. Water Res. 1992, 26, 863–865. [Google Scholar] [CrossRef]
  13. Shanthala, M.; Hosetti, B.B.; Stott, R. Removal helminth parasitic eggs from waste stabilization ponds at Shimoga. Bioscan 2007, 2, 9–14. [Google Scholar]
  14. Alvarado, A.; Vedantam, S.; Goethals, P.; Nopens, I. A compartmental model to describe hydraulics in a full-scale waste stabilization pond. Water Res. 2012, 46, 521–530. [Google Scholar] [CrossRef] [PubMed]
  15. Verbyla, M.E.; Iriarte, M.M.; Mercado Guzman, A.; Coronado, O.; Almanza, M.; Mihelcic, J.R. Pathogens and fecal indicators in waste stabilization pond systems with direct reuse for irrigation: Fate and transport in water, soil and crops. Sci. Total Environ. 2016, 551–552, 429–437. [Google Scholar] [CrossRef] [PubMed]
  16. Verbyla, M.E.; Oakley, S.M.; Lizima, L.A.; Zhang, J.; Iriarte, M.; Tejada-Martinez, A.E.; Mihelcic, J.R. Taenia eggs in a stabilization pond system with poor hydraulics: Concern for human cysticercosis? Water Sci. Technol. 2013, 68, 2698–2703. [Google Scholar] [CrossRef] [PubMed]
  17. Jimenez, B.; Alma, C. Low cost technology for reliable use of Mexico City’s wastewater for agricultural irrigation. J. Technol. 2002, 9, 95–108. [Google Scholar]
  18. Kihampa, C. Heavy metal contamination in water and sediment downstream of municipal wastewater treatment plants. Int. J. Environ. Sci. 2013, 3, 1407–1415. [Google Scholar]
  19. Sengupta, M.E.; Andersen, T.J.; Dalsgaard, A.; Olsen, A.; Thamsborg, S.M. Resuspension and settling of helminth eggs in water interaction with cohesive sediments. Water Res. 2012, 46, 3903–3912. [Google Scholar] [CrossRef] [PubMed]
  20. Sengupta, M.E.; Keraita, B.; Olsen, A.; Boateng, O.K.; Thamsborg, S.M.; Pálsdóttir, G.R.; Dalsgaard, A. Use of Moringa oleifera seed extracts to reduce helminth egg numbers and turbidity in irrigation water. Water Res. 2012, 46, 3646–3656. [Google Scholar] [CrossRef] [PubMed]
  21. Levine, A.D.; Tchobanoglous, G.; Asano, T. Size distributions of particulate contaminants in wastewater and their impact on treatability. Water Res. 1991, 25, 911–922. [Google Scholar] [CrossRef]
  22. Rodrigues, V.A.J.; Mac Conell, E.F.A.; Dias, D.F.C.; Von Sperling, M.; De Araújo, J.C.; Vasel, J.L. Nitrogen removal in a shallow maturation pond with sludge accumulated during 10 years of operation in Brazil. Water Sci. Technol. 2017, 76, 268–278. [Google Scholar] [CrossRef] [PubMed]
  23. Yuan, Y.; Farnood, R.R. Strength and breakage of activated sludge flocs. Powder Technol. 2010, 199, 111–119. [Google Scholar] [CrossRef]
  24. Ayres, R.M.; Mara, D.D. Analysis of Wastewater for Use in Agriculture–A Laboratory Manual of Parasitological and Bacteriological Techniques; World Health Organization: Geneva, Switzerland, 1996. [Google Scholar]
  25. Amoah, I.D.; Reddy, P.; Stenström, T.A. Effect of reagents used during detection and quantification of Ascaris suum in environmental samples on egg viability. Water Sci. Technol. 2017, 76, 2389–2400. [Google Scholar] [CrossRef] [PubMed]
Figure 1. (a) Location of the Buguruni WSP from the inset map of Africa and Dar es Salaam city (modified from [21]). (b)Photo of the facultative pond taken during a sampling campaign in December 2016. (c) Sampling points (node numbers in circles).
Water 10 00138 g001
Figure 2. Incoming particle sizes for wet and dry season (a) volume PSD and (b) volume fractions of different size classes.
Water 10 00138 g002
Figure 3. Particle size distribution for top and bottom samples collected inside the pond (node numbers shown in the legend); (a,c) Dry weather top and bottom respectively. (b,d) Wet weather top and bottom respectively.
Water 10 00138 g003
Figure 4. Comparison of PSD at the top and bottom of the pond for dry season(red) and wet season (blue) (a) Sedimentation areas; (b) Non-sedimentation areas; (c) Resuspension areas.
Water 10 00138 g004
Figure 5. Trend for particles with size corresponding to helminth eggs for (a) dry and (b) wet season.
Water 10 00138 g005

