Article

Quantification of Groundwater Discharge in a Subalpine Stream Using Radon-222

1
Department of Earth and Environmental Sciences, California State University East Bay, Hayward, CA 94542, USA
2
Lawrence Livermore National Laboratory, 7000 East Ave, Livermore, CA 94550, USA
*
Author to whom correspondence should be addressed.
Current affiliation: Department of Earth and Environmental Sciences, University of Kentucky, Lexington, KY 40506, USA
Water 2018, 10(2), 100; https://doi.org/10.3390/w10020100
Submission received: 4 November 2017 / Revised: 21 January 2018 / Accepted: 22 January 2018 / Published: 25 January 2018
(This article belongs to the Special Issue Isotopes in Hydrology and Hydrogeology)

Abstract

:
During the dry months of the water year in Mediterranean climates, groundwater influx is essential to perennial streams for sustaining ecosystem health and regulating water temperature. Predicted earlier peak flow due to climate change may result in decreased baseflow and the transformation of perennial streams to intermittent streams. In this study, naturally occurring radon-222 (222Rn) was used as a tracer of groundwater influx to Martis Creek, a subalpine stream near Lake Tahoe, CA. Groundwater 222Rn is estimated based on measurements of 222Rn activity in nearby deep wells and springs. To determine the degassing constant (needed for quantification of water and gas flux), an extrinsic tracer, xenon (Xe), was introduced to the stream and monitored at eight downstream locations. The degassing constant for 222Rn is based on the degassing constant for Xe, and was determined to be 1.9–9.0 m/day. Applying a simple model in which stream 222Rn activity is a balance between the main 222Rn source (groundwater) and sink (volatilization), the influx in reaches of the upstream portion of Martis Creek was calculated to be <1 to 15 m3/day/m, which cumulatively constitutes a significant portion of the stream discharge. Experiments constraining 222Rn emanation from hyporheic zone sediments suggest that this should be considered a maximum rate of influx. Groundwater influx is typically difficult to identify and quantify, and the method employed here is useful for identifying locations for focused stream flow measurements, for formulating a water budget, and for quantifying streamwater–groundwater interaction.

1. Introduction

Headwater basins are recognized as being critically important for generating runoff that is captured in reservoirs and used for irrigation and municipal water supplies. As climate change progresses, precipitation in subalpine regions will occur more frequently as rain rather than snow, which could have drastic impacts on stream flow and on groundwater recharge. Snowpack in the Sierra Nevada of California allows for slow melting and gradual groundwater recharge in basins; however, as more precipitation occurs as rain, more limited opportunity for groundwater recharge is likely to cause increased run-off as overland flow [1,2,3,4,5]. Groundwater is essential to the area as it provides baseflow to Martis Creek during the dry summer months, which is critically important for maintaining stream ecosystem health. Discharge that ends earlier in the summer or fall as a result of climate change or of groundwater pumping that continues into the summer and fall will put stress on the baseflow of the stream. Groundwater discharge to the stream also moderates stream temperature, especially in the late summer and fall, which is essential to the viability of the fish population in the stream [6,7,8,9,10].
Groundwater influx to streams is difficult to quantify, but changes in groundwater influx due to pumping will be regulated in California under the Sustainable Groundwater Management Act [11]. Lower order streams like Martis Creek are typically not gauged and gaining and losing reaches are not known. Geochemical methods like the one described here offer an alternative to physical measurements like stream gauging and to modeling methods that may be associated with high uncertainty.
A number of studies have used 222Rn as a tracer of groundwater influx in streams and a few of those used introduced tracers to determine the degassing constant in order to quantify groundwater influx to the river [12,13,14,15,16,17,18,19,20,21,22,23,24,25,26,27,28,29,30,31,32]. Most current studies utilizing 222Rn as a tracer use complementary methods to examine groundwater source, age of groundwater, or flowpath. Some studies use physical parameters such as flow measurements [12,13,14,15,16], temperature [14,15,17,18], or electrical conductivity [14,17,18,19] in addition to 222Rn to better constrain locations of groundwater inflow. Another method is to use multiple naturally occurring tracers, such as major ions [20], 4He [20,21], 87Sr/86Sr [15,20,22], Cl [14,20,23,24], and thoron [25], among others, to increase accuracy in groundwater inflow calculations. There have been few studies that use introduced tracers as a way to better characterize the system, though NaCl, propane [26], and SF6 [16,18,27,30] have been used successfully. Multitechnique approaches give a more complete picture of the interaction between groundwater and surface water [24] and lower prediction error for groundwater inflow [16]. For instance, resolutions of groundwater inflow rates can be as low as 5 mm/day for electrical conductivity and ion tracers and 2 mm/day for radon [28].
In this study, we identified reaches of Martis Creek with groundwater discharge by measuring the concentration of naturally occurring 222Rn and introduced xenon (Xe). Radon-222 is a radioactive (half-life 3.8 days) gaseous daughter product in the 238U decay series that accumulates in groundwater. Cox et al. [33] also used 222Rn as a tracer of groundwater influx in Squaw Creek in the nearby Olympic Valley. However, in that study, the degassing constant had to be estimated based on prior studies in similar streams. The introduction of a Xe tracer in this study allows direct quantification of the degassing parameter. Additional studies, such as those performed by Clark et al. [34] and Benson et al. [35], have used introduced tracers such as 3He and SF6 to examine gas exchange rates. In this study, groundwater influx is determined by two independent methods: geochemically (using 222Rn as a tracer) and physically (using measured stream discharge). The goals of the study are to compare these methods, and to quantify groundwater discharge in an area where climate change is likely to affect both groundwater recharge and runoff.

2. Materials and Methods
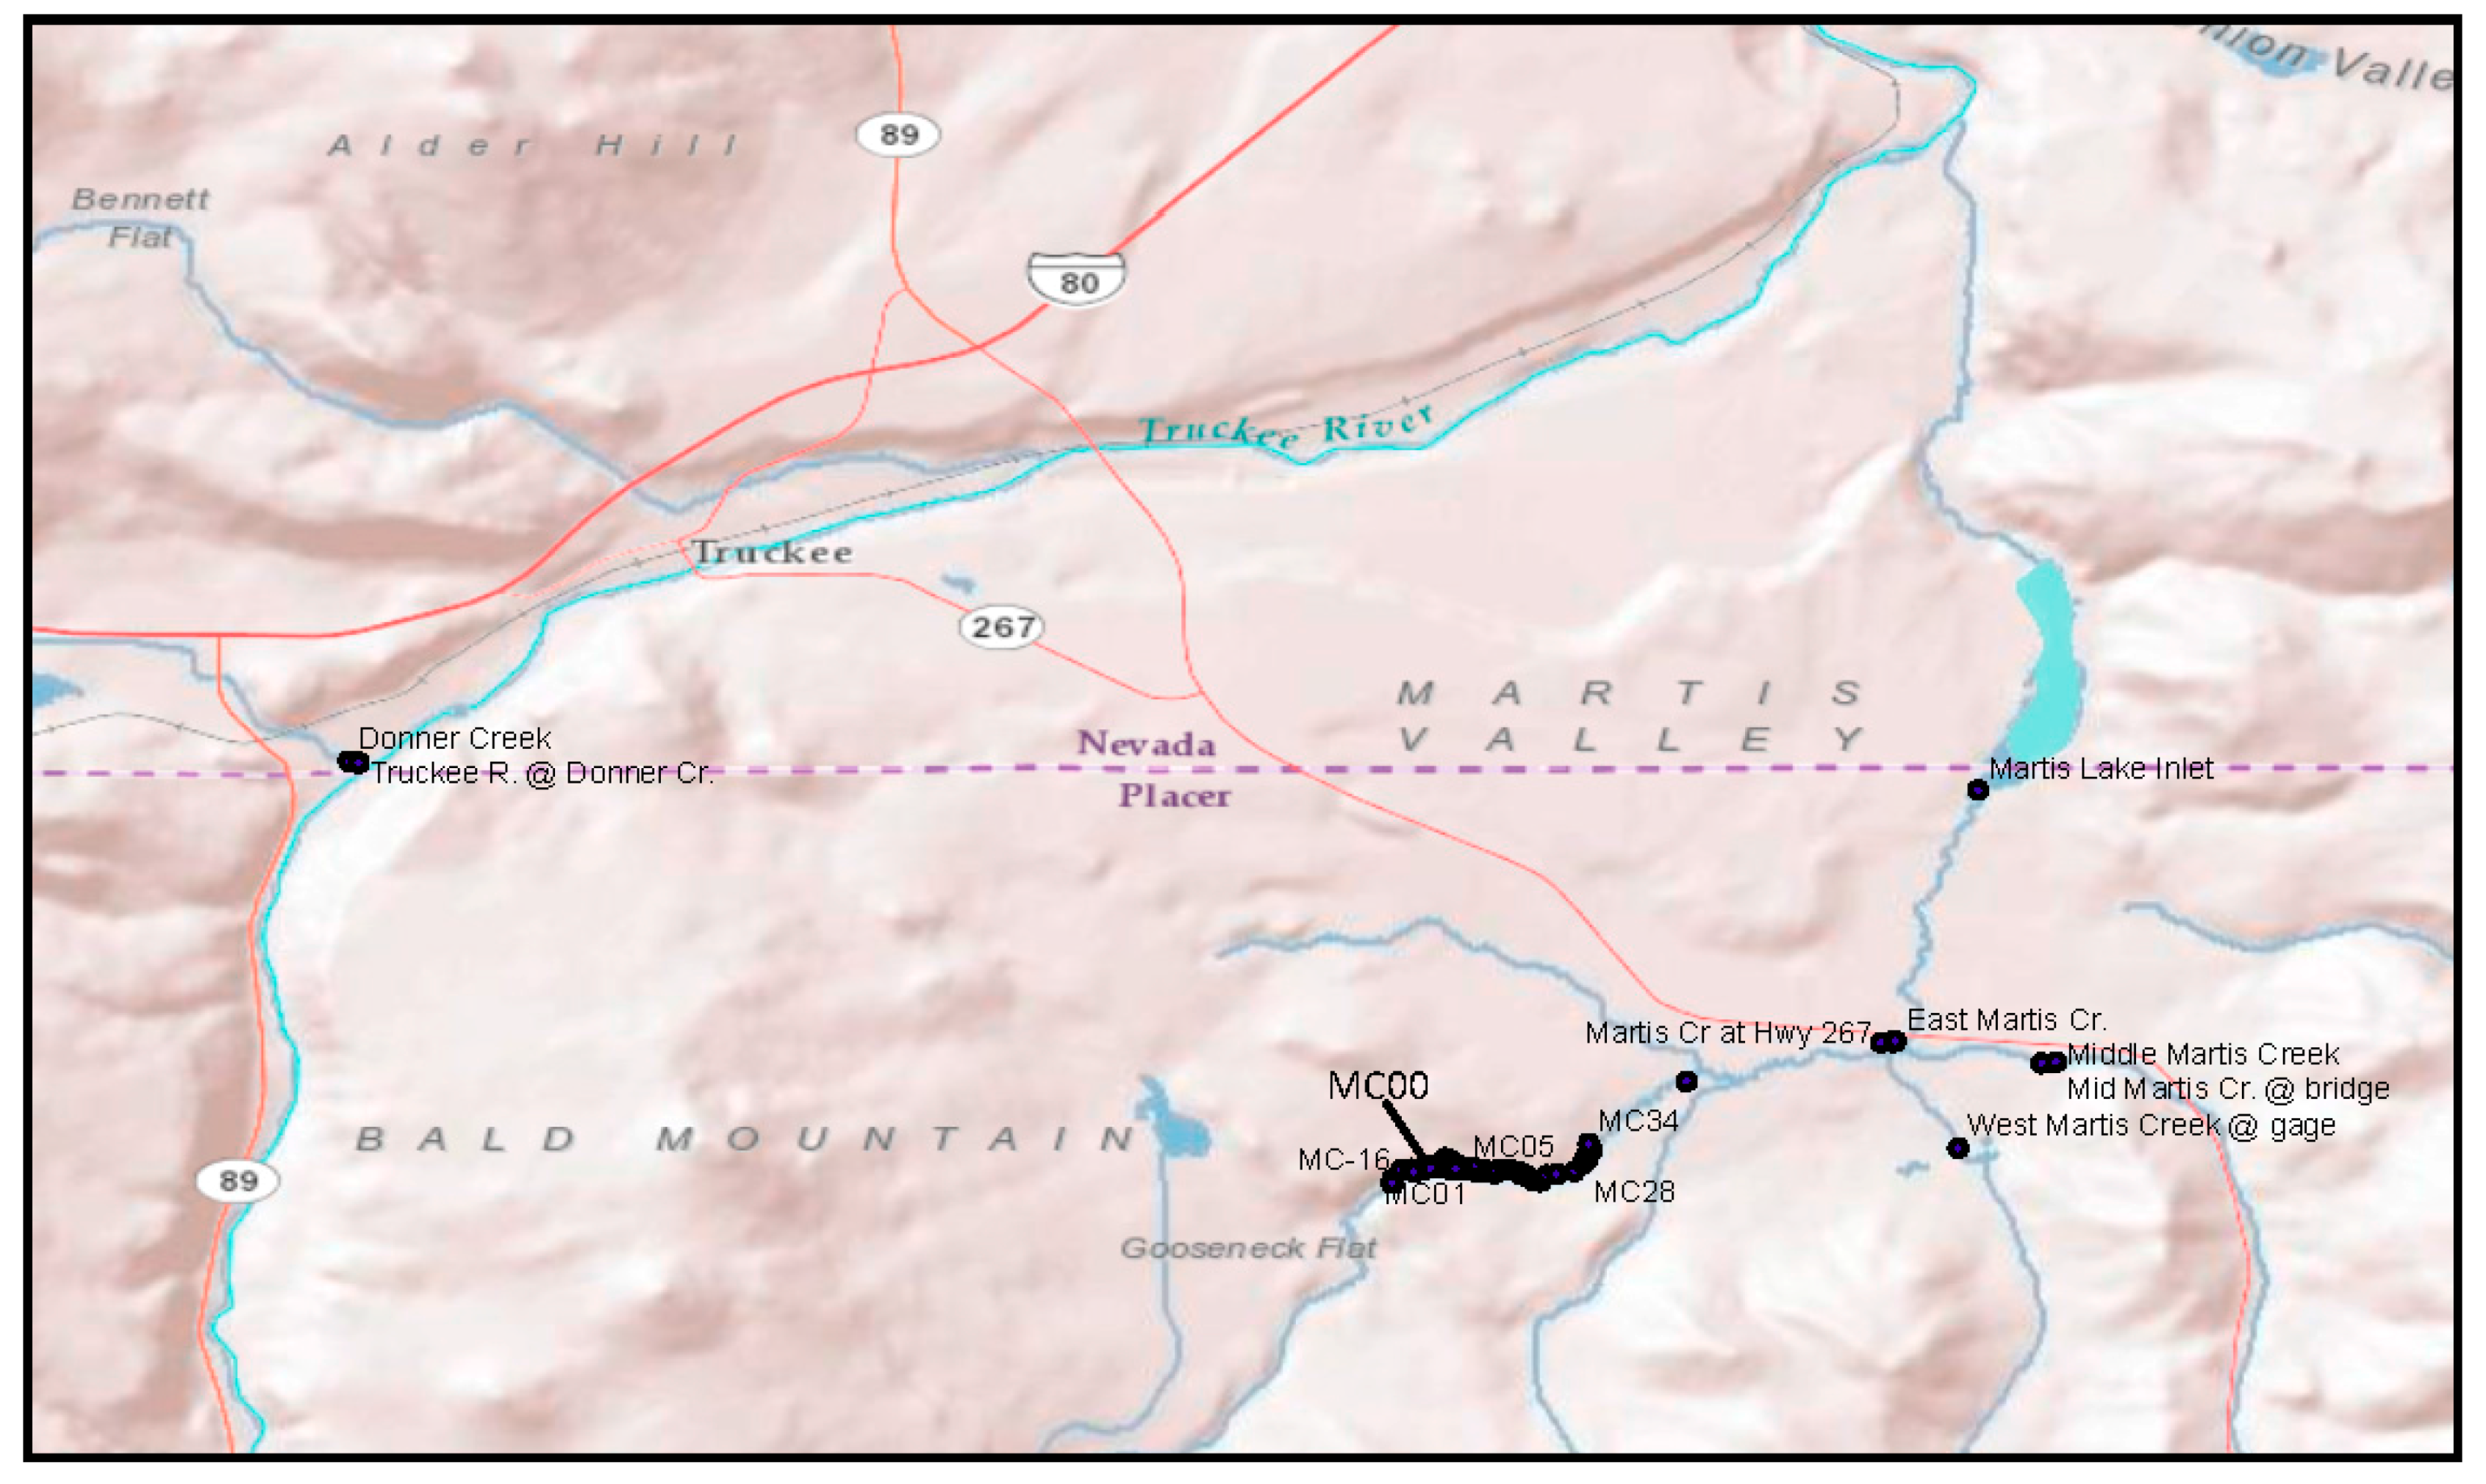
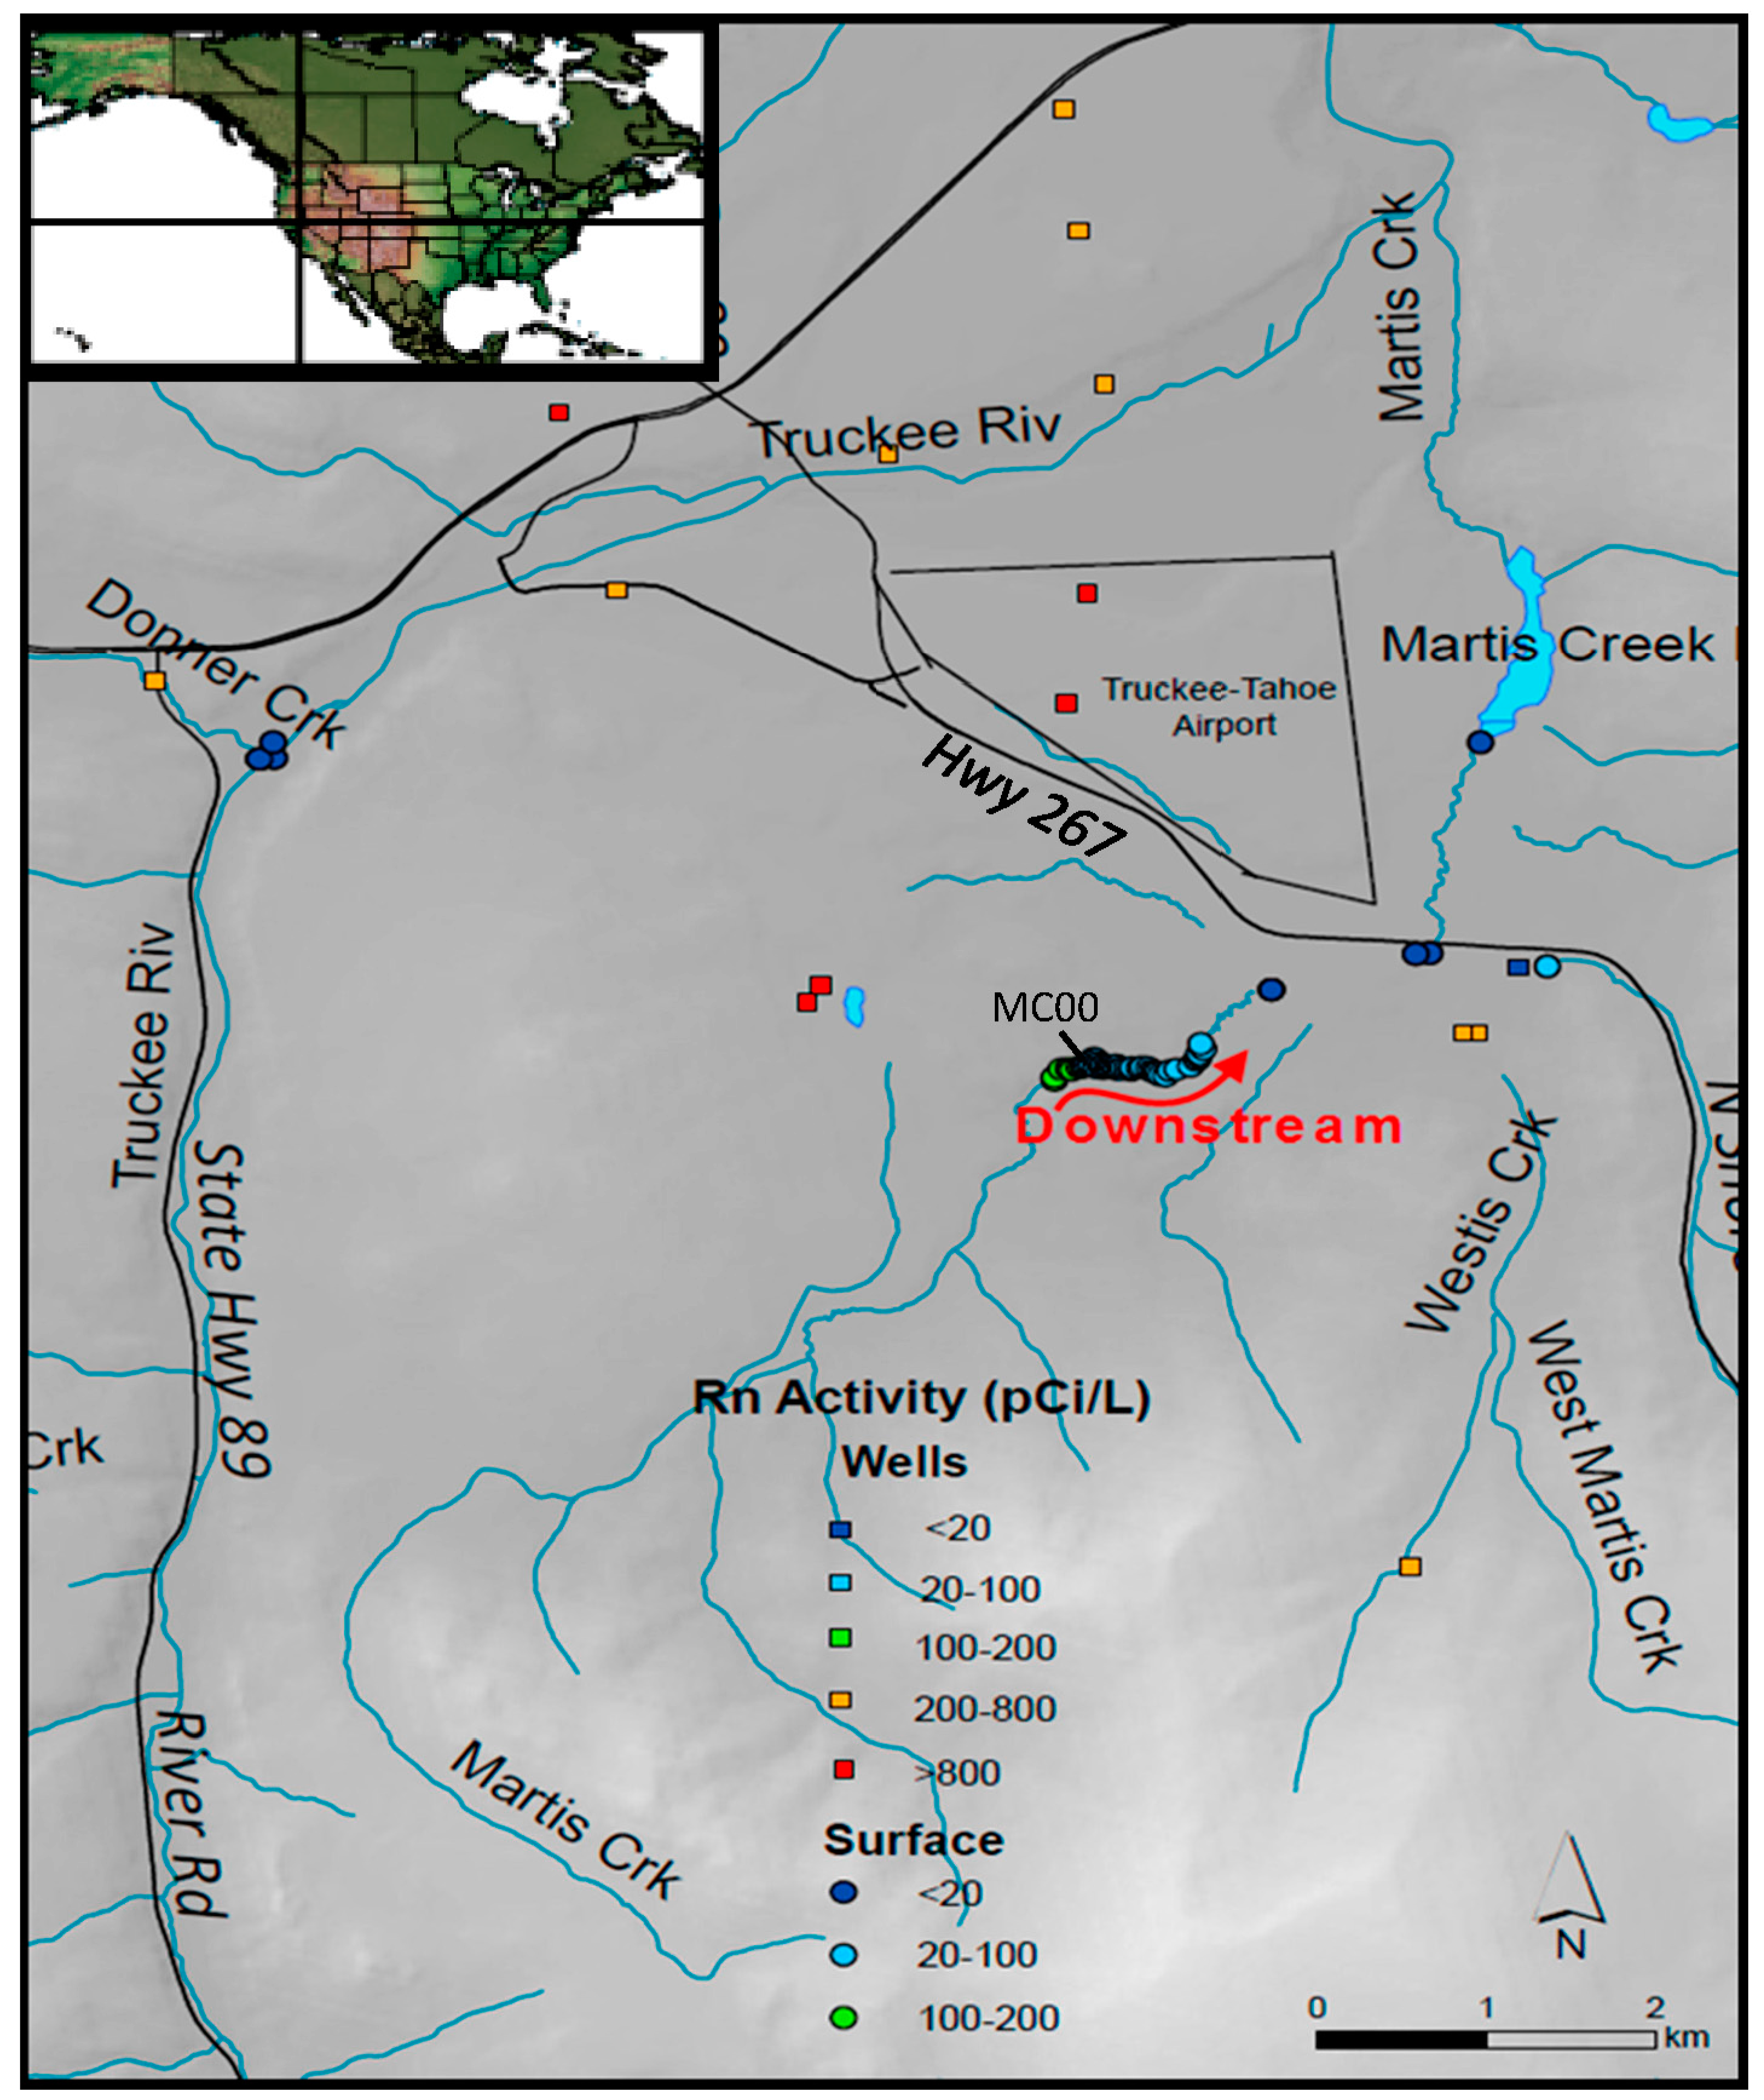
2.1. Study Area

Martis Valley is located in the Sierra Nevada, north of Lake Tahoe, California (Figure 1). The Martis Valley Basin covers 148 km2, and is at an elevation between 1737 and 1798 m above mean sea level [36]. In the lower elevations of the Martis Valley groundwater basin, the average annual precipitation is 58.4 cm/year, while in the headwaters (elevation 2227 m), it is 101.6 cm/year. Approximately 77% of annual precipitation in the study region occurs as snow. Streams that run through Martis Valley that are tributaries to the Truckee River include Donner Creek, Prosser Creek, and Martis Creek, and surface water is primarily stored in Donner Lake, Martis Creek Lake (downstream of the study area), and Prosser Creek Reservoir.
Average annual stream discharge in Martis Creek is approximately 0.76 m3/s, with the highest discharge occurring in the spring, and the lowest occurring in the late summer and fall. A water balance performed by Interflow Hydrology in 2003 [37] showed that streamflow losses in October 2002 across Martis Valley were approximately 0.018 m3/s, while losses at Martis Creek Lake were approximately 0.044 m3/s, which implies that streams are losing to the groundwater basin over much of the valley [1].
Martis Creek exhibits riffle and pool morphology, has meanders (sinusosity 1.1 to 1.4) and vegetation growing along its banks, and springs in the vicinity of the creek support an extensive wetland environment. There are also incisions and bank failures seen along reaches of the creek, often where meanders and semideep pools are located [38]. No visible tributaries are located over the study reach, so any increases in discharge can be attributed to groundwater influx.
The stream has been diverted and straightened, mainly downstream of the study reach, during construction of roads and other development, and because this is an area of former logging and cattle grazing. There were at least four diversions associated with cattle grazing in the early to mid-twentieth century found between the top of the study reach and Highway 267, and still-modified channels, such as a double box culvert under Highway 267 (Figure 1) [38].

2.2. Radon-222 in Groundwater

Water samples for 222Rn analysis were collected in the field with minimal exposure to the atmosphere. At groundwater wells, 250 mL glass bottles were filled with no headspace using tubing connected to a discharge port, and then stored at 4 °C. These samples were analyzed for dissolved 222Rn on a RAD7 Radon Detector (Durridge Company Inc., Billerica, MA, USA) equipped with a RAD H2O accessory (Durridge Company Inc.) within two days of being collected and were decay corrected to the collection date/time based on the half-life of 222Rn. To measure the 222Rn activity in the samples, each sample was aerated for five minutes with the RAD H2O accessory, which forms a closed loop with the RAD 7 Radon Detector. After aeration, there is a five minute period for the 218Po to equilibrate followed by four counting periods of five minutes each. The typical detection limit is 20 pCi/L and the typical standard deviation for four counting periods is 10%.

2.3. Radon-222 in Surface Water

For stream water samples, 20 mL glass vials were prefilled with 10 mL of scintillation cocktail (mineral oil). A hooked syringe was used to collect 10 mL of water from approximately 10 cm beneath the stream surface, and the stream water was injected beneath the cocktail so that the water did not contact the atmosphere during transfer from the syringe to the vial. Glass vials with Teflon-lined caps were used and samples were stored at 4 °C to minimize volatilization from the vial. Radon-222 is more soluble in organic solvents than in water, so it transfers from the water to the cocktail. This sampling procedure aides in the analysis of 222Rn because certain water-soluble radionuclides such as radium-226 (226Ra) interfere with 222Rn counting. Samples, standards, and blanks were all analyzed in the same geometry of 10 mL water underneath 10 mL mineral oil scintillator cocktail. The 10 mL collection technique allowed for the collection of a large number of samples in a short period of time, without the need for large containers or other equipment in the field.
After the samples were allowed to equilibrate for at least four hours, they were analyzed on a Quantulus liquid scintillation counter (LSC) for 60 to 90 min. Samples with low 222Rn activity were run twice to compare activity levels between the two runs.
To determine the background count rate for the method, blanks were prepared with deionized water. Background count rates were found to be approximately 0.1 counts per minute (CPM), and this background is subtracted from the CPM activity of each sample. Two laboratory control samples (0.5 mL of laboratory standard 226Ra liquid with 9.5 mL water and 10 mL of mineral oil) were analyzed during each run for instrument calibration. The raw data (in CPM) was then converted into 222Rn activities using the equation
Activity = ( CPM sample CPM background 2.22 × e × V )
where e is the Efficiency (CPM on an instrument divided by the known DPM (DPM being Decays Per Minute) of the standard being counted) and V is the volume of the sample. The factor 2.22 is a conversion factor from DPM to pCi. Samples were decay corrected to the collection date/time based on the half-life of 222Rn.

2.4. Radon-222 from Sediment Samples

To account for hyporheic zone contributions, sediment samples were collected at several locations by digging approximately 10 cm below the streambed with a trowel. The samples were dried for two days at 100 °C and then sieved into different sediment sizes: gravel (>2 mm), coarse–medium sand (2 mm–300 μm), fine–very fine sand (300–63 μm), and silt (<63 μm). Sediment in the size category >2 mm was not used.
Three grams of each grain size category for each sample were placed in a 20 mL glass vial, and the vial was filled to the 10 mL point with deionized water, followed by 10 mL of liquid scintillation cocktail. Laboratory control samples were made using a soil-based standard with a certified value of uranium and thorium content, deionized water filled to the 10 mL point, and 10 mL of mineral oil. Blanks were made using pure silica sand (considered to be uranium and thorium free), water filled to the 10 mL point, and 10 mL of mineral oil.
By approximating porosity and rock density, an emanation rate, E (Bq/kg), can be calculated from the equation
E = θ × C e q ( 1 θ ) ρ
where θ is porosity, ρ is density, and Ceq is an empirical estimate of the equilibrium concentration of 222Rn activity in groundwater [27,39].
The 222Rn emanation rate, E, is related to the 222Rn production rate, γ, in Bq/L day−1, by
γ = E ( 1 θ ) ρ λ θ
where ρ is the density of the solid, and λ is the decay constant [30].

2.5. Xenon Tracer

Xenon was used as a tracer to calculate 222Rn loss to the atmosphere in this stream survey, along with SF6. A comparison of results for these tracers is reported in Benson et al. [35]. Briefly, the Xe tracer was introduced continuously for three days through a one meter length of gas permeable tubing (weighed down by a chain). A regulator connected to a lecture bottle containing Xe gas allowed the slow release of Xe into the tubing (the efficiency of dissolution was nearly 100%). Three times a day (morning, afternoon, and evening) for three days, the survey team took samples from the left and right banks and the center of the stream at eight locations downstream and one upstream of the Xe introduction location. The samples were analyzed by noble gas membrane inlet mass spectrometry (NG-MIMS), which measures dissolved gasses by pumping the water from the sample through a semipermeable membrane and detecting Xe in the extracting gas using a residual gas analyzer [40].

2.6. Stream Flow

Stream discharge was measured at five locations along the study reach using a FP111 Global Water™ flow probe (Global Water Instrumentation, College Station, TX, USA). The probe calculates an average stream velocity over the depth of the water column, which was measured at 0.3 m intervals across the width of the stream. Stream discharge (Q) is calculated by multiplying the cross-sectional areas by the flow velocities and summing the resulting discharge for each section.

3. Results

Initial surveys of 222Rn in well samples and stream samples distributed around Martis Valley showed uniformly high 222Rn activities in wells and mostly very low activities in streams (Table A1 and Table A2). Radon-222 activities in well samples had a mean value of 804 pCi/L. Such high activities are typical for groundwater in basins with sediments derived from granitic and volcanic rocks [41,42].
Samples from the Truckee River, Donner Creek, tributaries to Martis Creek, and several locations along the main stem of Martis Creek were consistently close to, or below, the detection limit of about 20 pCi/L. These locations are therefore not in the vicinity of points of significant groundwater discharge to the streams. Two exceptions to the low activities in stream water were a persistent pool in Middle Martis Creek near Highway 267 (Figure 1), and a reach along Martis Creek near the border between the Army Corps of Engineers Martis Creek Wildlife area and the Lahontan Golf Club (Lahontan Dr; Figure 2). The upstream reach of Martis Creek was thus chosen for a more detailed survey and a tracer test.

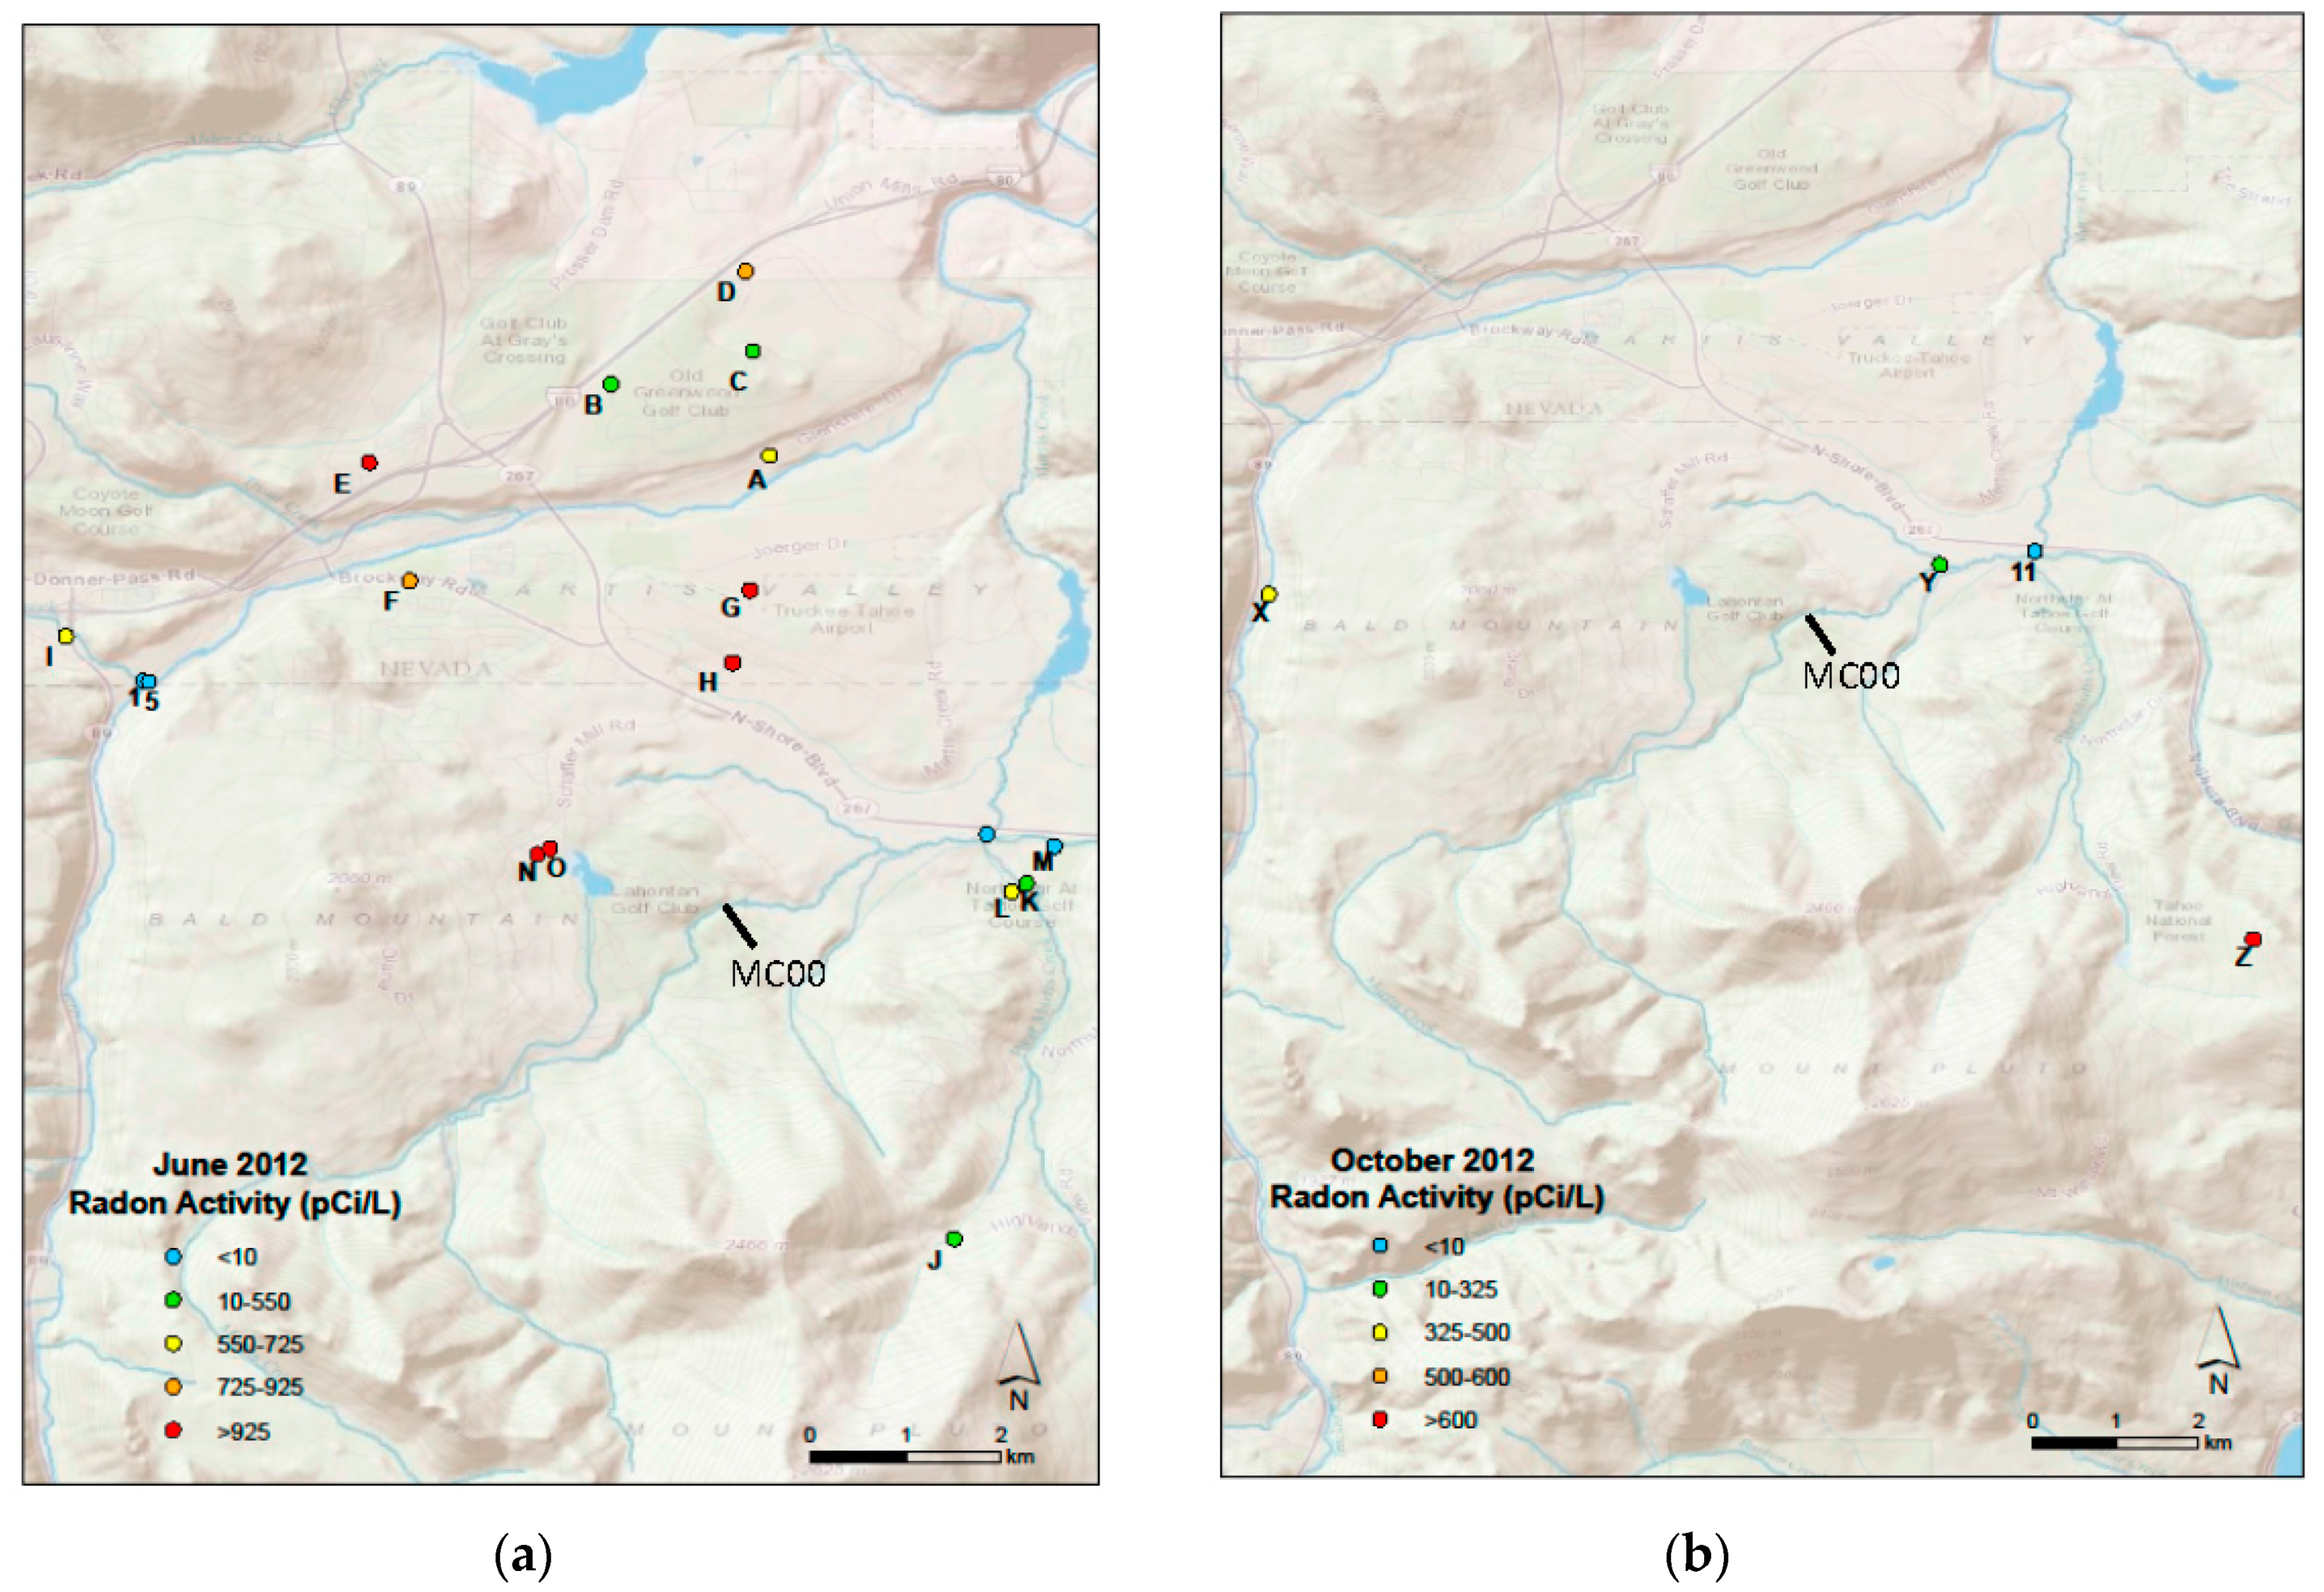
3.1. Radon-222 in Groundwater

Groundwater samples were analyzed from both monitoring and production well sources across Martis Valley in December 2011, June 2012, and October 2012. Results of 222Rn activities in wells and springs from Martis Valley are shown in Figure A1 (in Appendix A) and in Table A1. Wells available for sampling in this study are deep and long-screened. The wells nearest to Martis Creek (N and O, Figure A1a) had 222Rn activities >800 pCi/L in both June and December. Radon-222 activities measured in these wells likely represent activity in the deep portion of the aquifer system, while a significant component of the groundwater discharge to streams is likely to come from the shallow portion of the aquifer system, where well sampling points are not available. Spring samples have somewhat lower 222Rn activities and may be more representative of the shallower groundwater flow system. In particular, Spring X is located near the headwater area of Middle Martis Creek and had a mean activity of 528 pCi/L, while Spring Y, in the downstream portion of the study area, had an activity of 322 pCi/L (Figure A1b). A representative value of 400 pCi/L was used as an estimate of the 222Rn activity in groundwater that contributes to the stream (ci), based on spring results and the sediment incubation experiments.

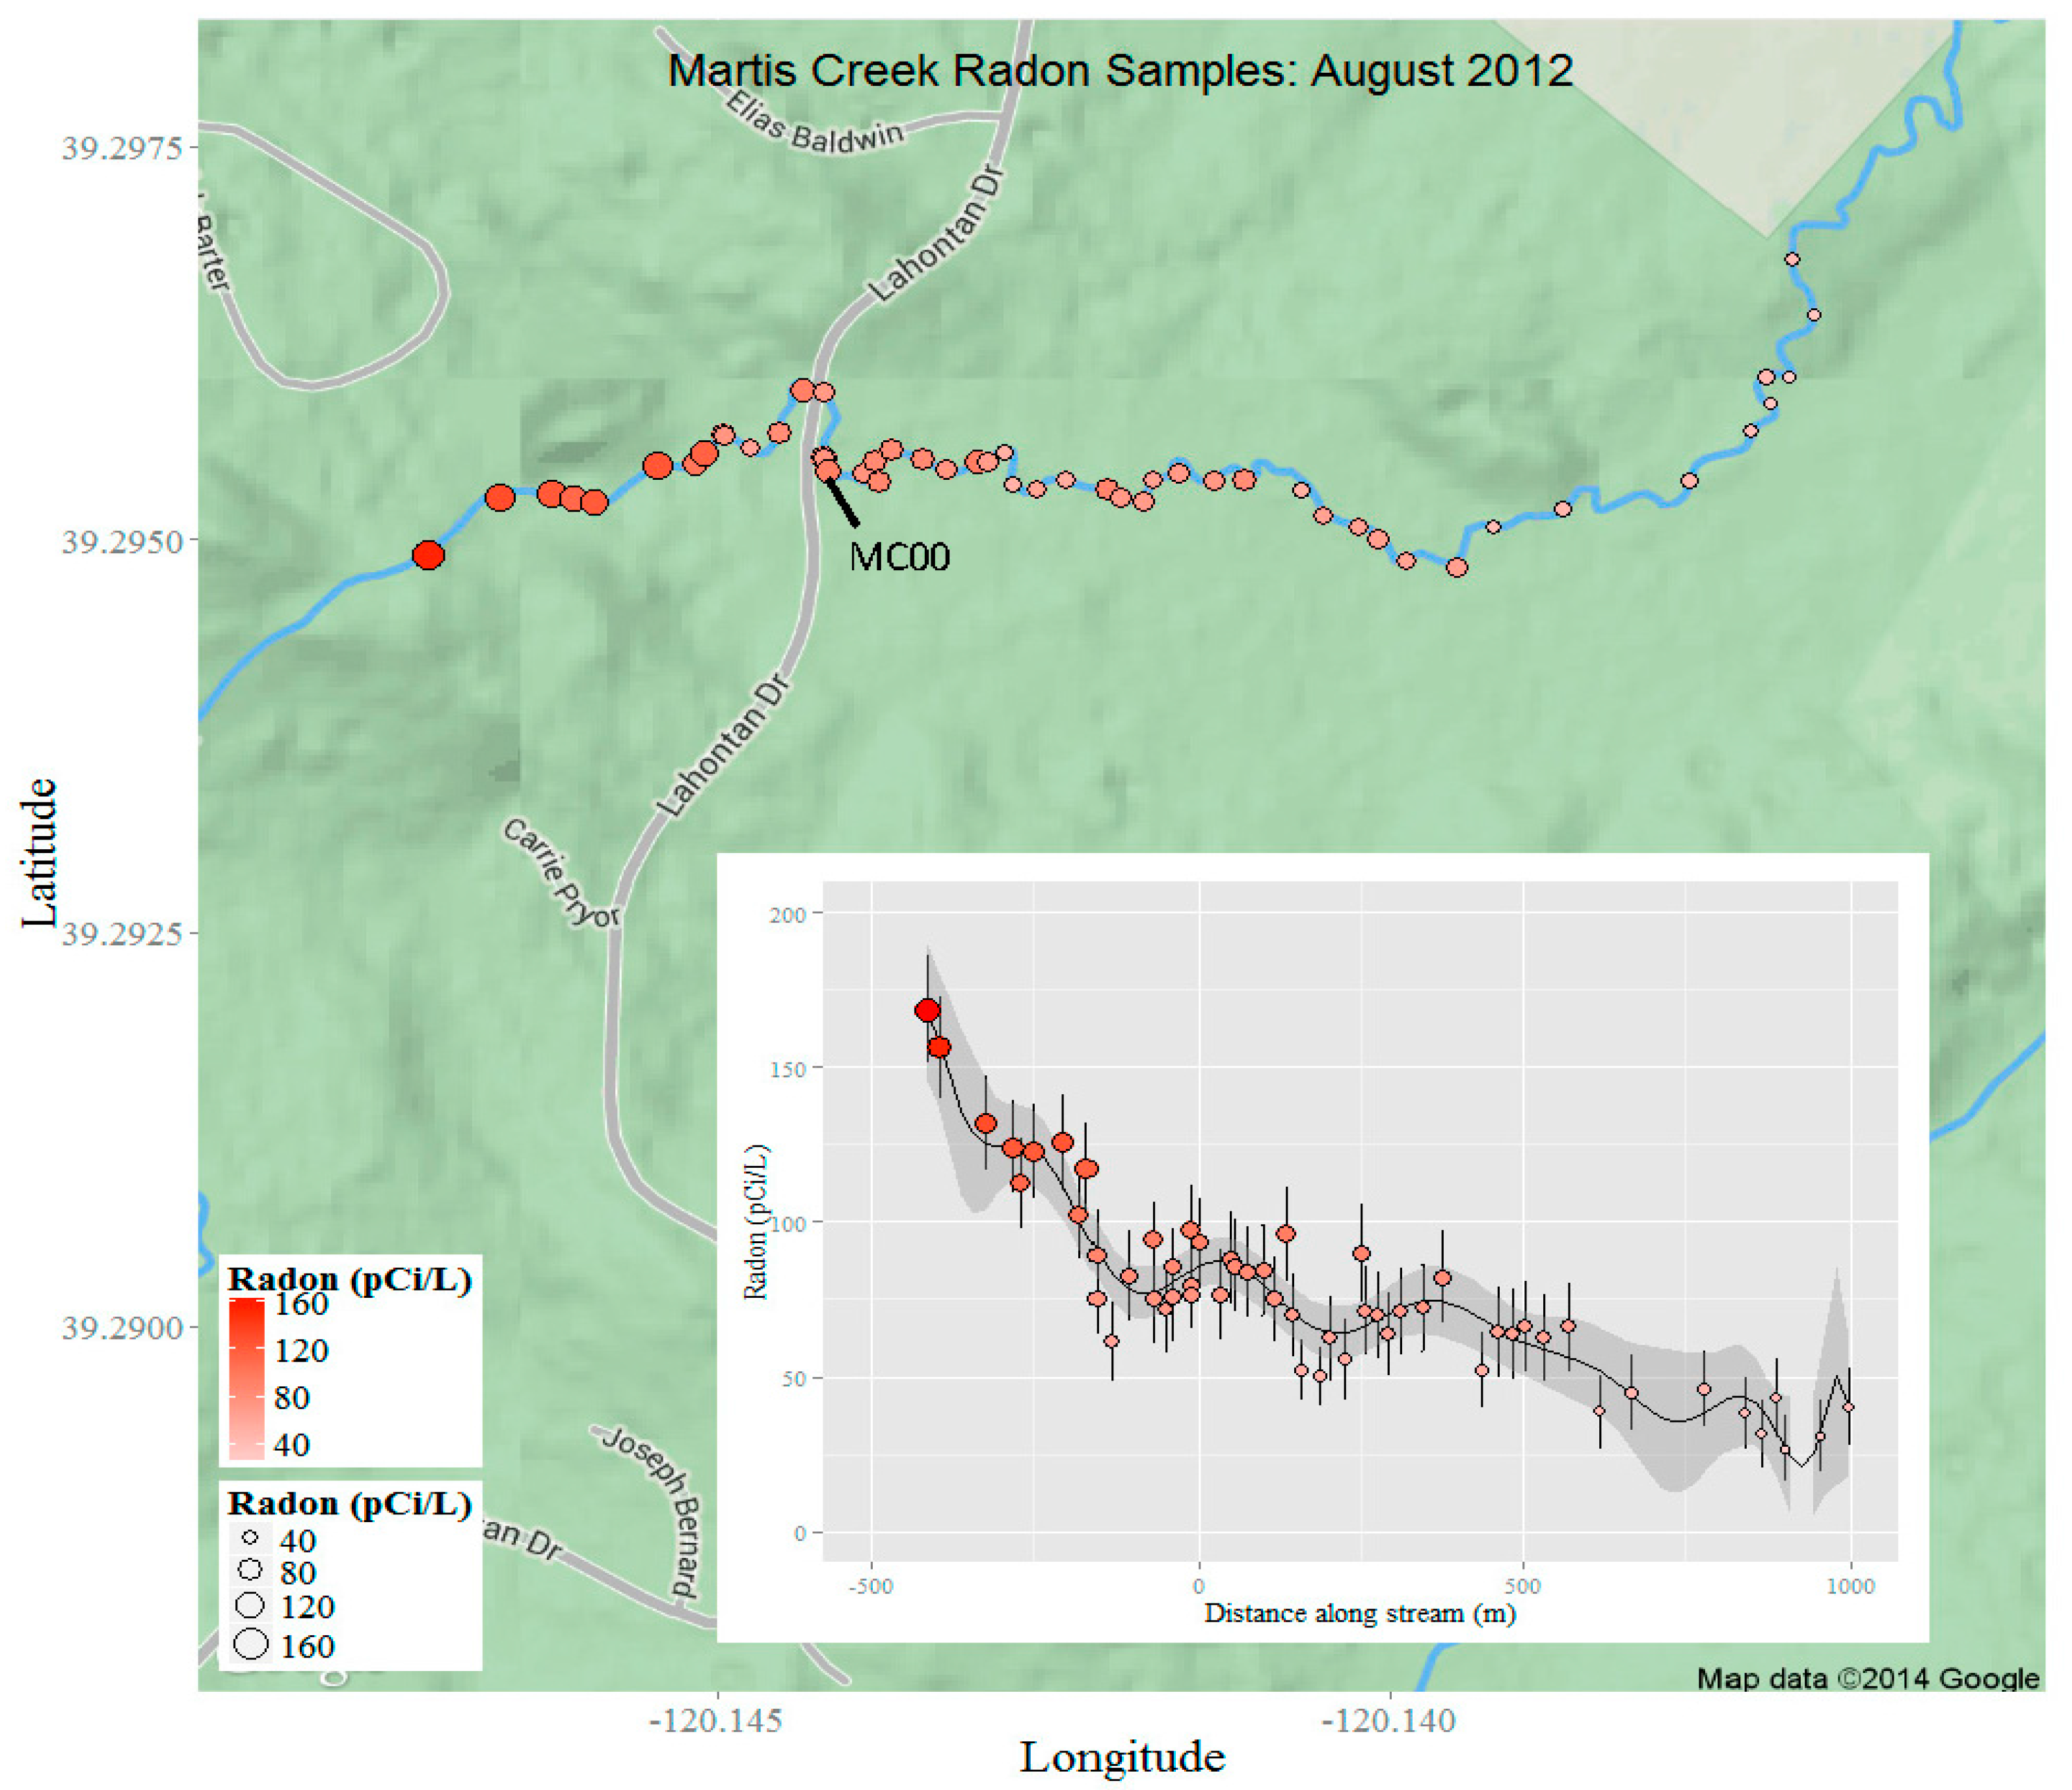
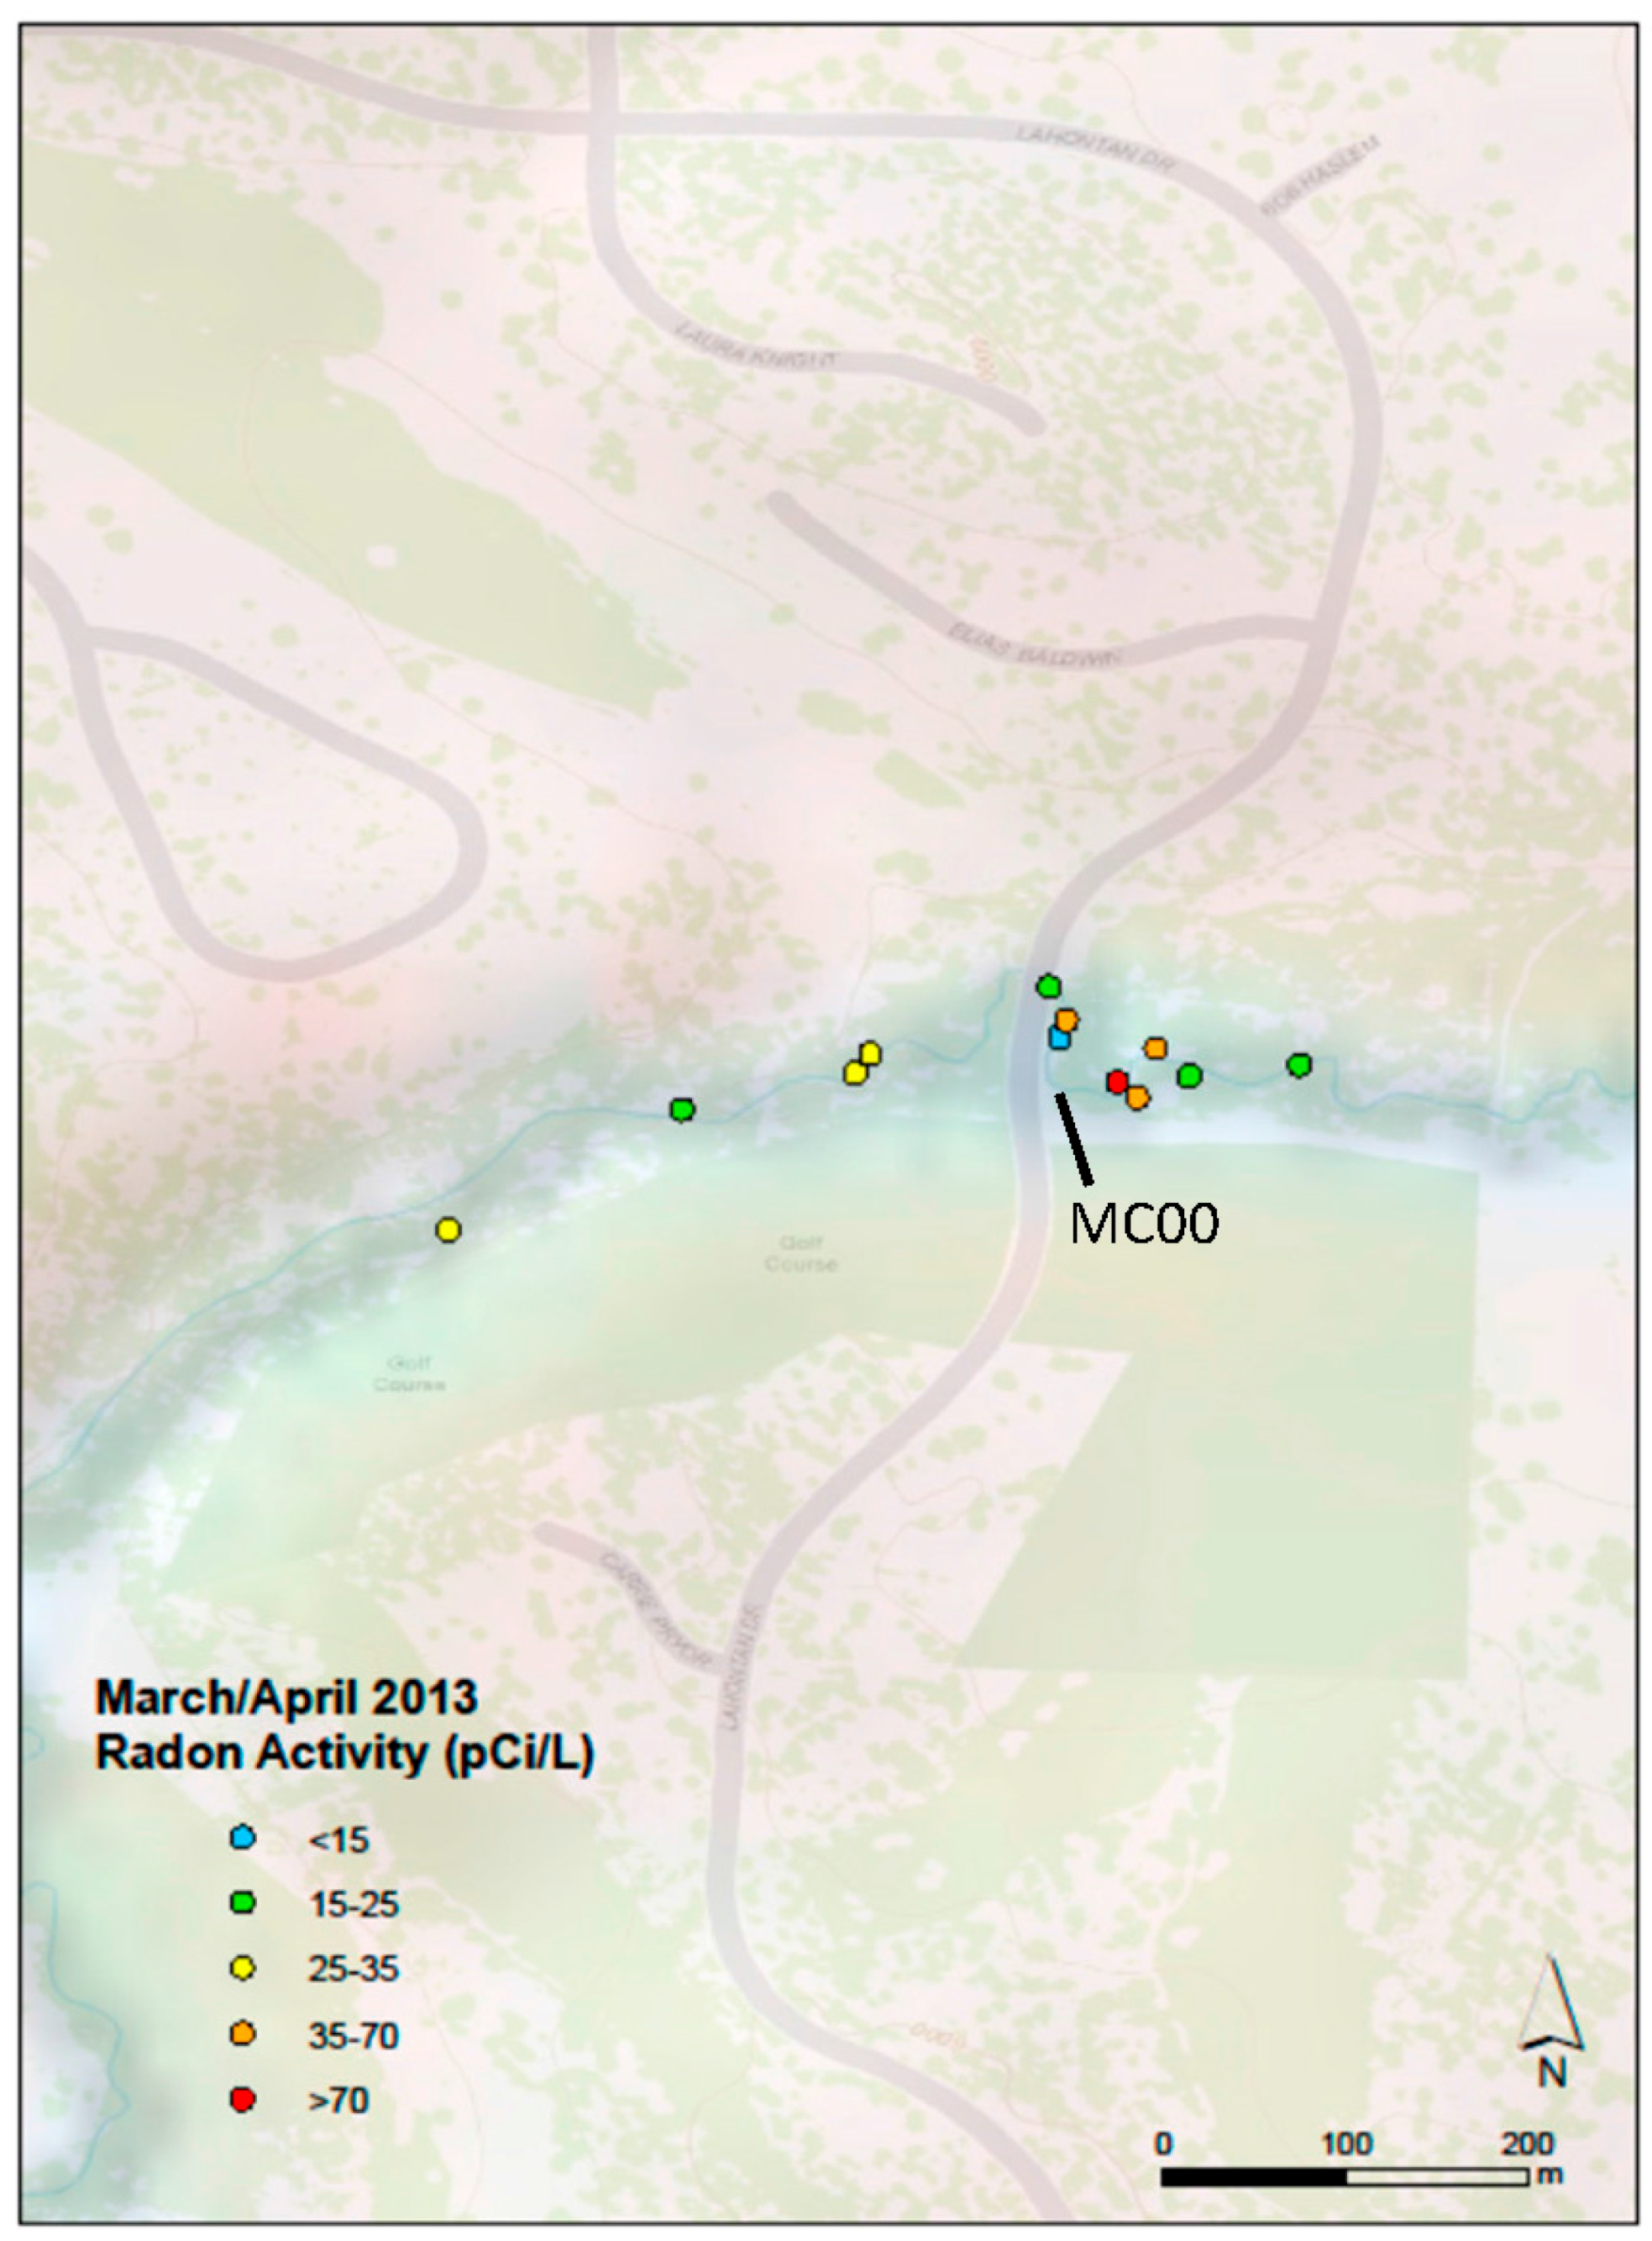
3.2. Radon-222 in Surface Water

Stream water samples were collected at key locations in December 2011, June 2012, and March and April 2013. In addition, two stream surveys with closely spaced sampling points were performed in July and August 2012 (Table 1 and Table A2, Figure 1, Figure 2 and Figure A2). As a general trend, 222Rn activities decreased with distance downstream (Figure 2 inset). The stream reach selected for intensive study (mid-August 2012), was chosen based on the results of the preliminary surveys. During the mid-August stream survey, many stream samples had activities greater than 60 pCi/L in the reaches of the stream on Lahontan Golf Club property (IDs MC-17 through MC14 Table 1), and samples above MC-09 had activities greater than 100 pCi/L, clearly indicating groundwater influx over these reaches.
A final stream survey was performed in March/April 2013 (Figure A3 and Table A2), upstream from the August 2012 survey. No precipitation occurred in the preceding few days before sampling. Because of higher discharge from snowpack runoff, which tends to peak in late March or early April [43,44], 222Rn activities in the stream were lower; however, relatively high activities were observed near the same locations during runoff and baseflow seasons.

3.3. Hyporheic Sediment Results
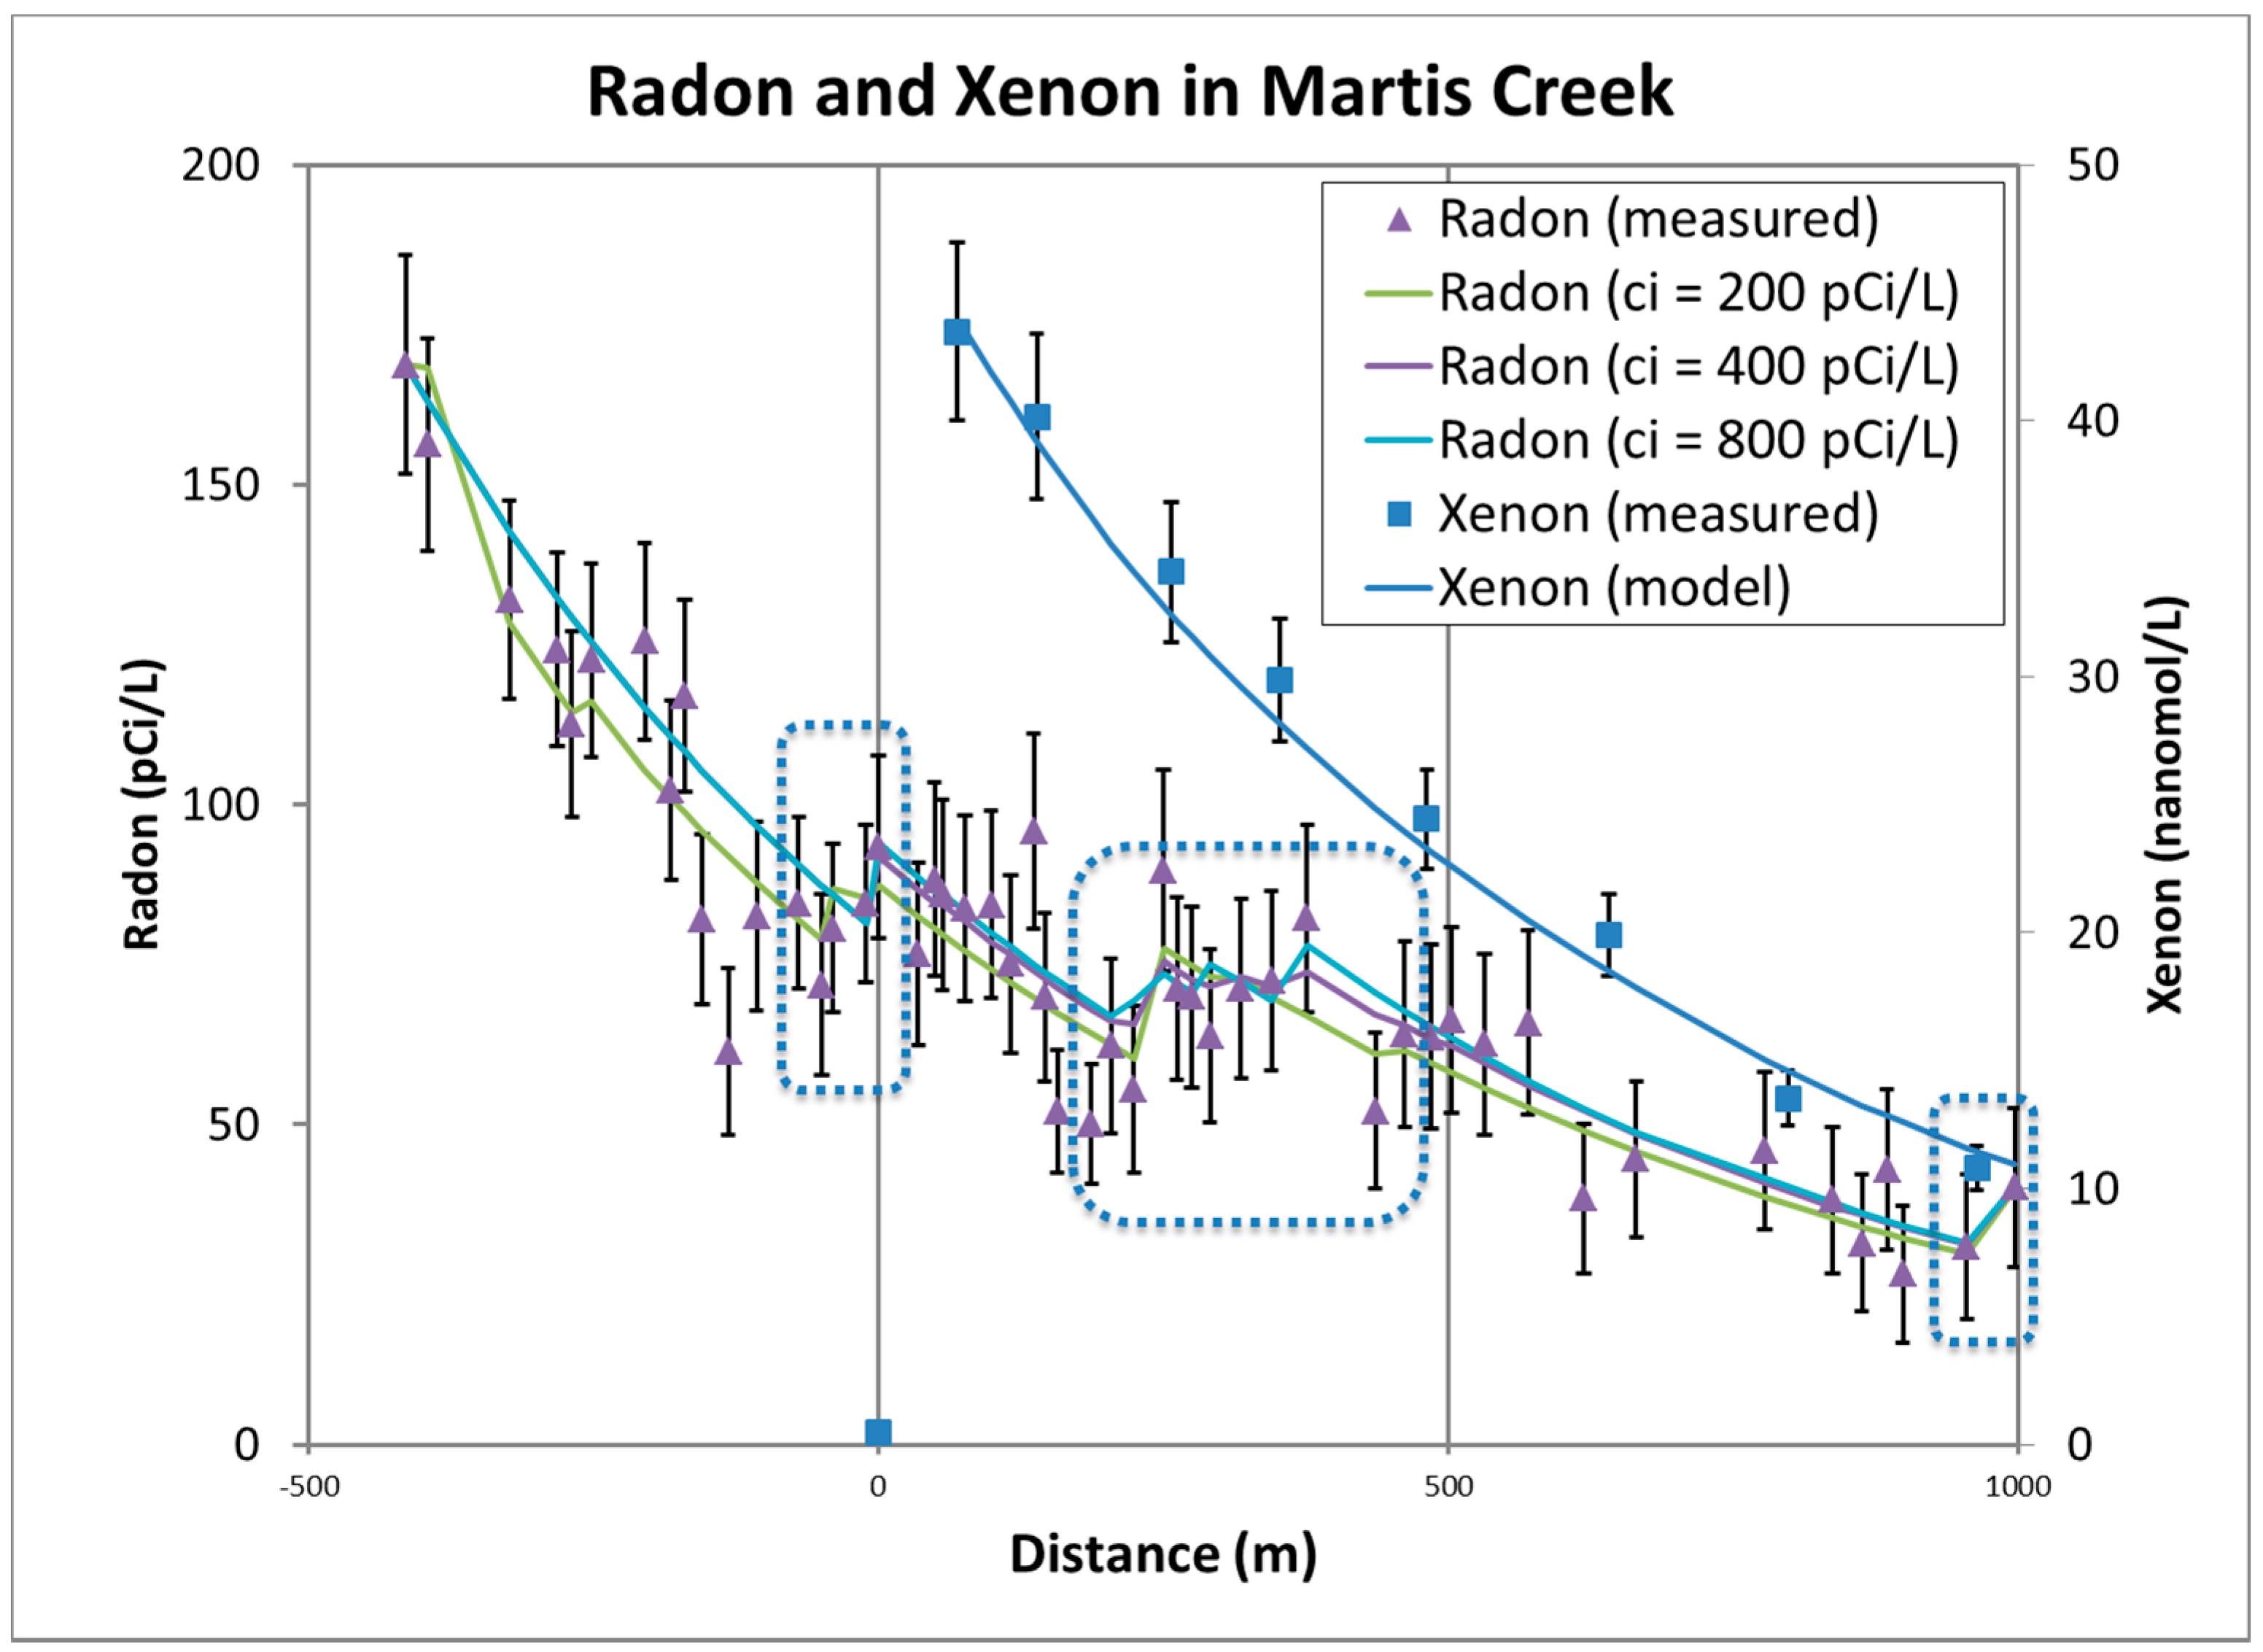
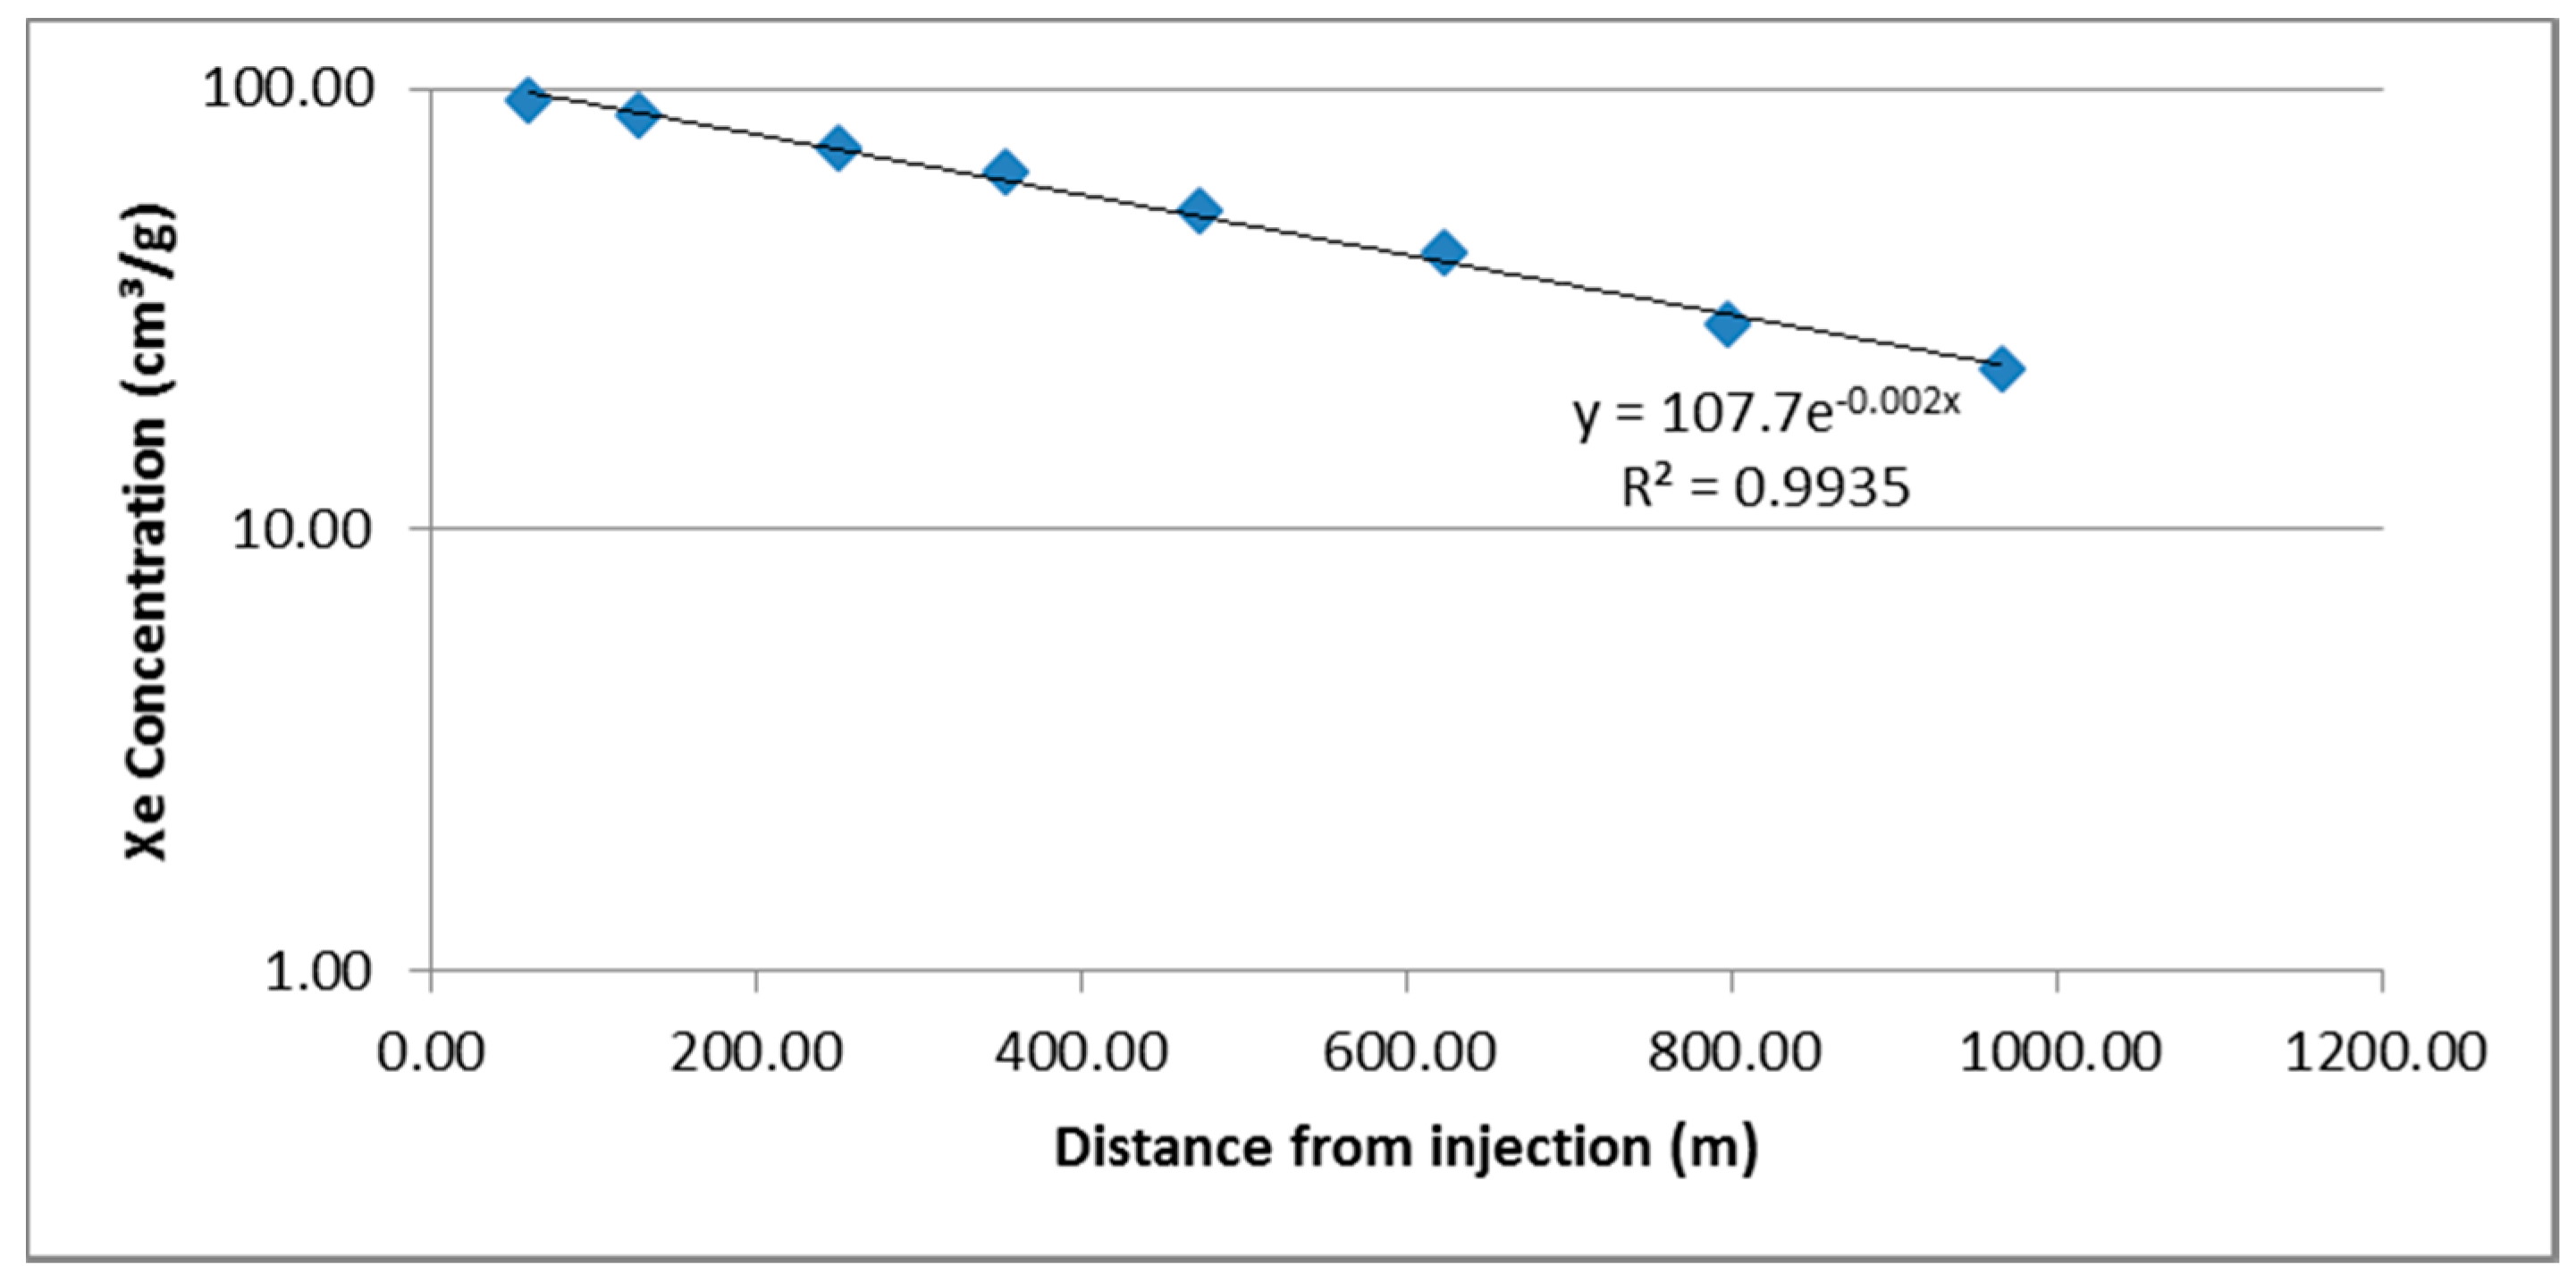
Sediment samples were collected from locations MC23 and MC34, where 222Rn activities in water samples were somewhat higher than expected, based on comparison of the Xe and 222Rn concentrations. For each of the samples, the sediment was divided into four particle size categories (coarse sediments >2 mm were not used). Each of these categories shows relatively little 222Rn contribution to the stream, with sediment from MC23 contributing 112 to 192 pCi/kg, and sediment from MC34 contributing 177 to 264 pCi/kg (Table 2). These contributions are consistent with those Cox et al. [39] found in sediments from nearby Squaw Creek, and those reported by Cook et al. [27] for sediments from the Cockburn River in Australia.
Based on the decay rate of 222Rn, these activities should be within 10% of steady-state values where 222Rn emanation is balanced by 222Rn decay. Assuming a porosity of 0.4 and a sediment density of 2.9 g/cm3, these emanation rates result in an equilibrium 222Rn concentration between 479 and 1147 pCi/L, following Equations (2) and (3). This is consistent with the observed 222Rn activities in the groundwater. Higher emanation rates and equilibrium concentrations are found from the silt fraction of these sediments, commonly associated with higher concentrations of uranium and thorium [45]. Variation in measured 222Rn activities and production rates may be related to sediment properties observed in the Martis Creek basin and varying U concentrations of fine- and coarse-grained sediments.
Hyporheic zone contribution to 222Rn activity in the stream cannot be quantified directly because the lateral extent and thickness of the hyporheic zone and the residence time of water in the hyporheic zone are not known. It is likely that the hyporheic zone is a source of 222Rn activity, however, so the groundwater influx reported in the results can be considered a maximum flux. The contribution of the hyporheic zone to the stream 222Rn budget is further evaluated in the discussion.

3.4. Xenon Tracer

Xe was introduced continuously at MC00 (at 39.2956° N, 120.1442° W), in a reach of Martis Creek where relatively high 222Rn activity had been observed. While the tracer was introduced, it mixed into the flowing water relatively quickly and thoroughly, showing little variation across the width of the stream. The Xe transect along the eight stations downstream showed a relatively smooth, exponential decrease in Xe concentration as Xe degassed from the stream (R2 = 0.994; Figure A4). Application of the one-dimensional (1D) advection–dispersion equation assuming first-order decay of a continuously released solute results in a value of the mean reaeration coefficient (K) of 40 day−1, as reported in Benson et al. [35]. The degassing constant (k) for Xe can be calculated by multiplying K (day−1) by stream depth, for which the range over the experimental reach was measured at 0.08 to 0.24 m with a mean of 0.16 m. The rates found vary between 1.9 and 9.0 m/day, with the variance due to stream depth and, to a lesser extent, to the nature of the creek—there are some deep pools, some riffles, some shallower areas, and some areas with dense riparian vegetation. (This approach to estimating the degassing constant does not take dilution by groundwater into account; another approach to estimating k is presented in the Discussion section, below.) For example, relatively more tracer degassing (per m) occurred between MC27 and MC29 than occurred elsewhere along the creek. Escape of Xe from the stream to the atmosphere is similar to that of 222Rn, due to comparable physical behavior and atomic weight. The degassing constant for 222Rn was calculated by multiplying the degassing constant for Xe by the ratio of the diffusion coefficients, resulting in kRn/kXe of 0.75.

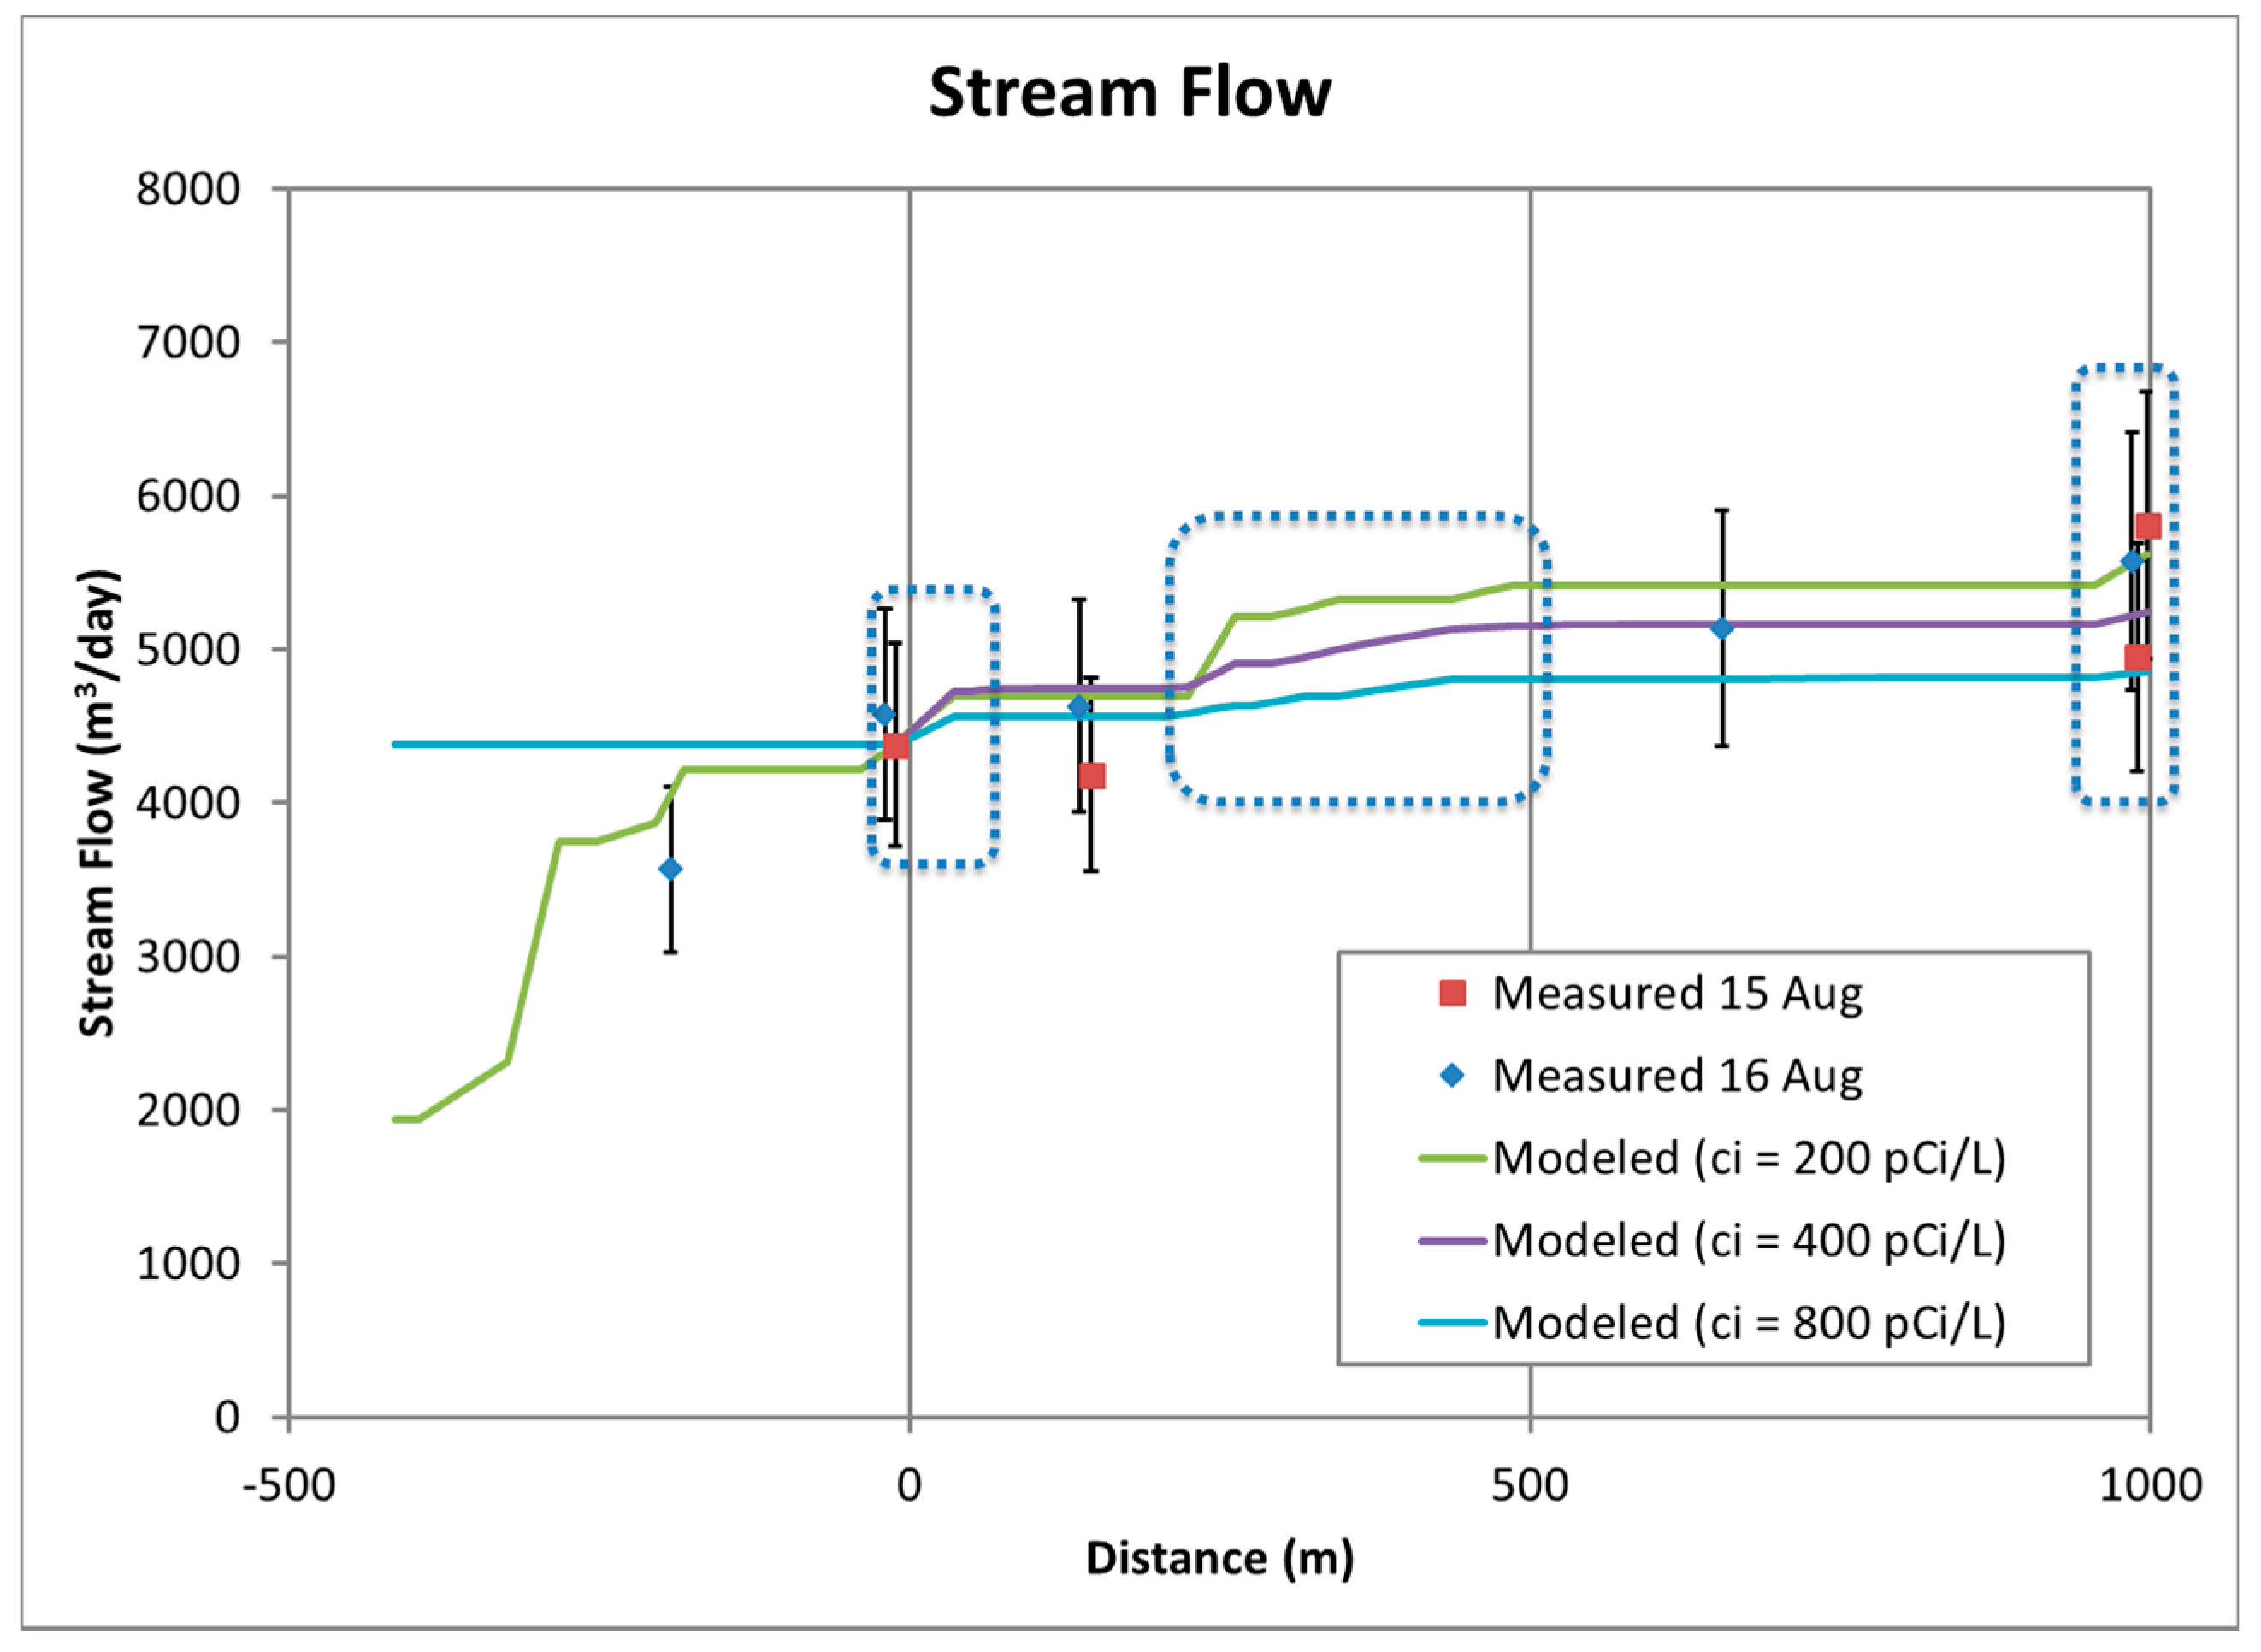
3.5. Stream Discharge
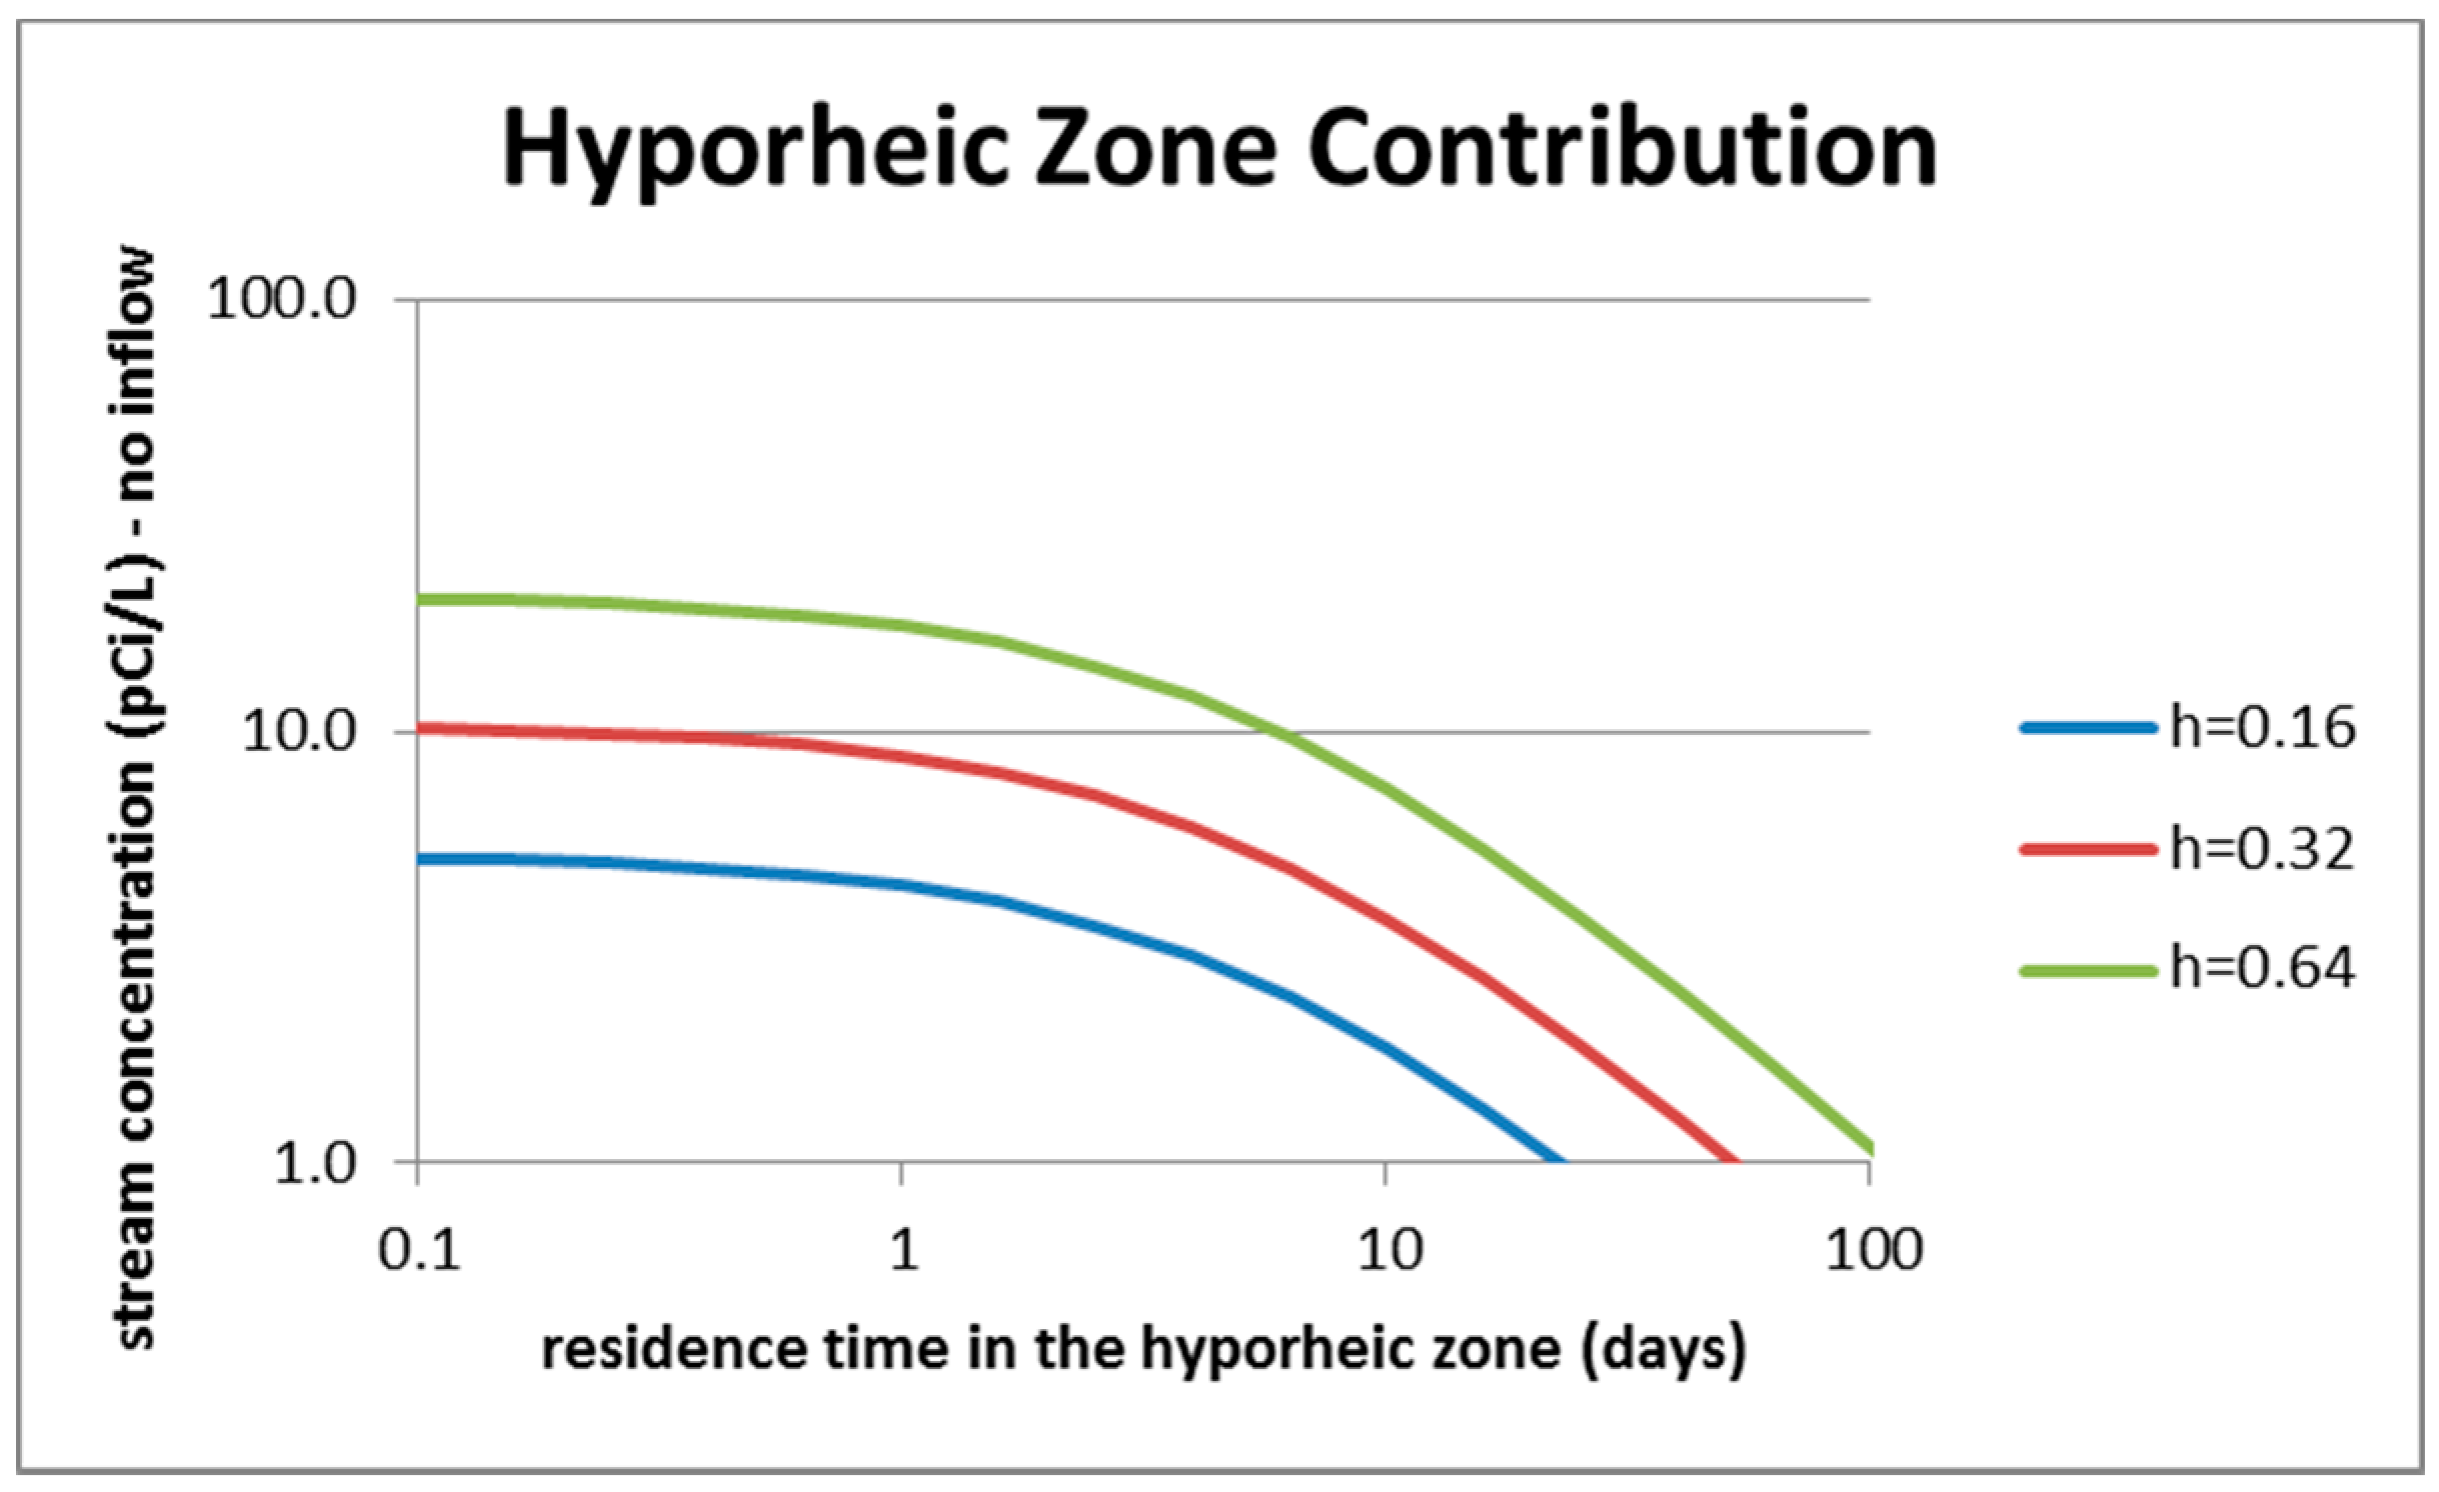
Measured discharge at five locations along the survey reach indicates that discharge increases from 3567 m3/day (0.04 m3/s) approximately 200 m upstream of the tracer introduction location (at MC-10) to 5444 m3/day (0.06 m3/s; average of three measurements) at MC34, approximately 1000 m downstream. Since no tributaries or other sources of inflow are present along the study reach, the observed increase in flow can be attributed to groundwater influx. A similar range in discharge and in discharge increase was measured in Martis Creek near the Lahontan development in 2002 (3278 m3/day to 4575 m3/day) [37]. However, groundwater discharge can vary daily due to evapotranspiration or on shorter time scales in response to precipitation or headwater melting events. There is considerable uncertainty in these low discharge measurements (estimated at 15% uncertainty based on repeat measurements) and the observed increases in discharge are therefore associated with relatively high uncertainty.

4. Discussion

The change in flux of a dissolved gas with distance downstream is a balance between the flux into the stream from groundwater and hyporheic zone sediments and the flux out of the stream due to evaporation losses, degassing (volatilization), decay, and losses to the hyporheic zone, as represented by the equation [27]
Q d c d x = I ( c i c ) + w E c k w c d w λ c + γ h w θ 1 + λ t h [ λ h w θ 1 + λ t h   ] c
where, at time t, Q is stream discharge (m3/day), I is influx (m3/day), ci is the initial 222Rn activity (pCi/L) of groundwater discharge to the stream, c is 222Rn activity (pCi/L) at location x, w is the mean stream width (m), E is the evaporation rate (m/day), k is the degassing constant (m/day), d is the mean stream depth (m), λ is the radioactive decay constant (day−1) for 222Rn, γ is the production rate for 222Rn (pCi/L/day) within the hyporheic zone, θ is the porosity of sediments in the hyporheic zone, h (m) is the thickness of the hyporheic zone, and th is the mean residence time of water (day) within the hyporheic zone [27].
Since the time the stream water takes to go from the tracer injection point to the end of the stream survey is negligible compared to the half-life of 222Rn, the term d w λ c can be eliminated. Additionally, if production in the hyporheic zone is effectively zero (as demonstrated later in this section), the concentration of 222Rn activity in the hyporheic zone porewater will be equal to that in the stream water, and the equation may be simplified by eliminating the last two terms γ h w θ 1 + λ t h [ λ h w θ 1 + λ t h   ] c [33]. The equation may be further simplified if evaporation is neglected, which, in the case of Martis Creek, is appropriate, since the creek experiences minimal evaporation over the short study reach. Stream width w varies from 117 to 658 cm, and the evaporation rate E for streams the size of Martis Creek is estimated to be between 10−3 and 10−2 m/day. Measured 222Rn activities c vary from 27 pCi/L to 169 pCi/L. In that case, the term w E c is negligibly small, which leaves
Q d c d x = I ( c i c ) k w c .
Rearranging terms to solve for I gives
I = ( Q d c d x + k w c ) [ 1 ( c i c )   ]
which is used to calculate the groundwater influx (I) to Martis Creek. Stream discharge (Q), gas transfer velocity (k), mean stream width (w), and stream 222Rn activity (c) were all measured, while groundwater 222Rn activity (ci) was estimated to be 400 pCi/L (Table 3). To evaluate the uncertainty on the estimated groundwater discharge patterns, additional analyses were performed with groundwater 222Rn activities of 200 pCi/L or 800 pCi/L.
Groundwater inflow for each of the 50 sections was estimated by minimizing the difference between the measured and modeled 222Rn concentrations. Simultaneously, the xenon concentration was modeled in the stream, decreasing due to gas exchange between the stream and the atmosphere and dilution by groundwater discharge. The xenon concentration at the first xenon survey location (MC04) was fixed at 44 nanomol/L. Stream discharge was fixed to the measured stream discharge (4380 m3/day) at MC-01, 11 m upstream of the xenon injection location. Stream flow upstream of MC-01 was calculated by subtracting the estimated groundwater inflow. This approach also allowed for the effective gas exchange coefficient (kw) to be optimized, considering xenon dilution by groundwater inflow. The objective O for the optimization was the sum of squared differences between the measured and modeled 222Rn and xenon concentrations, divided by the measurement uncertainty:
O = i = 2 51 ( R 222 n i , modeled R 222 n i , measured R 222 n i , uncertainty ) + j = 2 8 ( Xe j , modeled Xe j , measured Xe j , uncertainty ) .
Figure 3 shows the resulting modeled 222Rn and Xe concentrations in Martis creek, together with the measured concentrations. The Xe concentrations are mostly well captured by the model, and are within the measurement uncertainty (8%). Differences between modeled and measured concentrations indicate variation in stream morphology resulting in variable gas exchange velocities along the 1 km stretch under investigation.
Measured 222Rn concentrations are generally well captured by the forward model. Measured 222Rn concentrations show stronger decreases than the model in the first 500 m of the investigated stretch, upstream of the Xe introduction. These decreases could indicate that the gas exchange rate was higher in this section. Modeled 222Rn concentrations with either 400 pCi/L or 800 pCi/L as groundwater 222Rn concentration do not capture the increase between 250 and 200 m before the Xe injection location and predict no groundwater increase over the interval. If a groundwater 222Rn concentration of 200 pCi/L is assumed, groundwater contributions are predicted between −325 m and −250 m, as discussed further below. Also, downstream of the Xe injection location, there appear to be sections where 222Rn decreases more rapidly over short intervals than the smooth decrease of Xe over larger intervals. As a consequence, the estimated groundwater discharge could be too low. These nuances show the importance of an introduced tracer constraint on the gas exchange rate. The optimized gas transfer velocity k (2.16 m/day) is at the low end of the range previously estimated, considering a stream width w of 3.5 m.
Although Xe and 222Rn show roughly similar, exponentially decreasing patterns, the calculations indicate that some groundwater influx is required at locations throughout the study reach to maintain observed 222Rn levels. Groundwater influxes are estimated at the location of Xe injection (0–35 m, 15 m3/day/m), 250 m downstream (8 m3/day/m for 26 m), and more gradually between 320 and 500 m (0–3 m3/day/m). A small influx of 4 m3/day/m is captured at 955 m. These groundwater influx locations are identified as independent of the groundwater 222Rn concentration ci. The magnitude of groundwater inflow is inversely related to the assumed groundwater 222Rn concentration. The uncertainty of the stream flow measurements is such that neither the highest nor the lowest groundwater 222Rn concentration can be rejected as unlikely (Figure 4). If a groundwater 222Rn concentration of 200 pCi/L is assumed, the optimization procedure finds a solution with significant groundwater inflow between −400 and −180 m along this stretch of Martis Creek. Flow measurements are not available to confirm this result.
To evaluate the contribution of the hyporheic zone to the 222Rn budget of the stream, let us assume that the groundwater influx is negligible. In this special case, the 222Rn concentration is given by Equation (8) (Equation (10) in [27]):
c = γ h θ ( 1 + λ t h ) ( k + λ d ) + λ h θ   .
The 222Rn concentration in the stream then depends on the production rate for 222Rn within the hyporheic zone (γ), the thickness of the hyporheic zone (h), the porosity of sediments in the hyporheic zone ( θ = 0.4), the radioactive decay constant for 222Rn (λ = 0.18 day−1), the mean residence time of water within the hyporheic zone (th), the degassing constant (k = 2.16), and the mean stream depth (d = 0.16). The average of the measured hyporheic zone 222Rn production rates is 180 pCi/L/d. The thickness of the hyporheic zone (h) and the residence time of water in the hyporheic zone are unknown. Assuming a thickness equal to the stream depth (0.16 m) and an infinitely short residence time (which yields the highest hyporheic zone contribution) results in an equilibrium 222Rn concentration in the stream of 5 pCi/L. Assuming that the thickness of the hyporheic zone is four times larger results in a stream concentration of 20 pCi/L. The dependence of the hyporheic zone contribution to the stream water concentration is illustrated in Figure A5. We conclude that the hyporheic zone contribution is relatively minor compared with the measured 222Rn concentrations in the stream (27–169 pCi/L).
The groundwater influx “hot spots” would be difficult to identify using physical flow measurements, as it would not be practical to measure discharge over the spatial scale and with the accuracy necessary to ascertain the level of spatial detail afforded by the 222Rn results. While deployment of an extrinsic tracer may not be practical in many situations, measurement of 222Rn is relatively easy and inexpensive, and allows identification of reaches where groundwater influx is occurring on a scale pertinent for ecological considerations.
The modeled cumulative stream flow increases from 4380 m3/day at the injection location to 5175 m3/day at a distance 1 km downstream (Figure 4). The calculated influx of groundwater is equivalent to 18% of the initial stream flow if a groundwater 222Rn concentration of 400 pCi/L is assumed. Lower (200 pCi/L) or higher (800 pCi/L) groundwater 222Rn concentrations result in higher (28%) or lower (11%) influxes of groundwater, respectively. Although the calculated groundwater influx values in this reach (800 m3/day) are within the uncertainty ranges of the stream flow measurements made at various locations on August 15 and 16, the influx represents a critical portion of the annual discharge, as the importance of the persistence of the influx into the late summer and fall cannot be overstated. The presence of deep pools that act as refugia for fish and the moderating effect of groundwater discharge on temperature are recognized as controls on species distribution and total biomass [6,7,8,9,10].
These results indicate that influx of groundwater to the stream is heterogeneous and related to topographic or morphologic stream features. The study reach is within the transition of the stream from being well shaded, with a relatively steep gradient (2–3%), and little anthropogenic alteration to having no overstory, with a low gradient (<1%), and nearby features including a golf course and housing development. The meadow area within and downstream of the study reach has been altered by historical land use practices and, to a lesser extent, by current recreational activities.
Another significant transition is the degree of incision and preponderance of eroded banks within the study reach compared with within the upstream reach, where bank stability is bolstered by outcrops and boulders. Within the study reach, the pool and riffle morphology likely plays a role in streambed sediment distribution and re-aeration of 222Rn, but observations of individual pools and riffles during the experiment did not correlate with locations of groundwater input (e.g., between 200–350 m and at 950 m) in an obvious manner. However, stream incision can cause an increase in the hydraulic gradient and result in groundwater drainage from the riparian sediments [46], and this likely plays a role in the spatial variability in groundwater discharge along Martis Creek.

5. Conclusions

Tracers and bio-indicators are important tools for researching groundwater–surface water interaction and groundwater-dependent ecosystems [15,18,47]. 222Rn is a unique indicator of groundwater discharge [15,18,27,28]. In certain situations, both 222Rn and 4He [21] or 14C [48] can pinpoint groundwater discharge locations, while confirming longer groundwater flow paths. More elaborate modeling approaches constrain the uncertainty of estimated groundwater inflow estimates [16] which were significant in this study. The additional use of an introduced tracer like xenon or SF6 [27] is essential for quantitative estimates of groundwater influx. Absent an introduced tracer, 222Rn measurements are valuable for pinpointing groundwater influx on a small scale, as evidenced in this study, for regional assessments of groundwater–surface water interaction [17,22]. Radon-222 is also suitable for studying temporal variability of groundwater discharge [14] when repeated flux measurements are too time-consuming. Additional research incorporating detailed temperature measurements [49,50] can constrain the importance and residence times of hyporheic exchange.
Martis Valley is categorized as medium priority by the California Statewide Groundwater Elevation Monitoring Program. With 128% population growth in the 2000’s and 90% of water used supplied from groundwater [36], understanding groundwater–surface water interaction in this basin is critical. The water budget relies on accurate numbers and, by utilizing geochemical methods, we are able to produce a more nuanced estimate of groundwater influx than by relying on physical flow measurements. In addition, groundwater management under the California Sustainable Groundwater Management Act [11] shall not result in “depletions of interconnected surface water that has significant and unreasonable adverse impacts on beneficial uses of the surface water”. This requirement demands a detailed quantitative understanding of groundwater discharges to streams. Since a large proportion of Martis Creek’s flow is from groundwater influx, this accuracy is necessary to maintain a healthy baseflow in Martis Creek during the dry months of the water year.

Acknowledgments

This work was performed under the auspices of the U.S. Department of Energy by Lawrence Livermore National Laboratory under Contract DE-AC52-07NA27344. The study was funded by the California State Water Resources Control Board Groundwater Ambient Monitoring and Assessment Program. Special thanks to Stephanie Urióstegui, who helped carry out field and analytical work. The manuscript was improved based on revisions suggested by three anonymous reviewers.

Author Contributions

Elizabeth Avery, Ate Visser, Jean Moran and Bradley Esser conceived and designed the experiments; Elizabeth Avery, Ate Visser, Jean Moran and Bradley Esser carried out field work. Elizabeth Avery and Richard Bibby performed the sample analyses; Elizabeth Avery, Richard Bibby, Ate Visser and Jean Moran analyzed the data; Elizabeth Avery, Ate Visser and Jean Moran wrote the paper.

Conflicts of Interest

The authors declare no conflict of interest.

Appendix A

Table A1. Measured 222Rn activity levels for wells and springs in the Martis Valley region corresponding to locations on Figure A1 and Figure A2.
Map IDCollection DateAct (pCi/L)Error 95% CI
O12/19/11858102
K12/19/1141930.3
N12/19/1186838.2
E12/19/11127054.0
G12/19/1177265.3
D12/19/1164415.4
C12/19/1136222.7
H12/19/11118025.8
J12/20/1150053.9
L12/20/111010187
A06/19/1268727.6
B06/19/1249723.6
C06/19/1246322.9
D06/19/1276929.5
E06/19/12128037.9
F06/19/1278629.8
G06/19/1295232.9
H06/19/12130038.5
I06/20/1260624.9
J06/20/1244221.3
K06/20/1254323.6
L06/20/1272227.2
M06/20/129.194.23
N06/20/12113033.9
O06/20/12123035.6
Z10/29/1272027.5
Z10/29/1273927.9
Y10/29/1232218.7
X10/29/1256425.2
X10/29/1249123.6
Table A2. Measured 222Rn activity levels for surface water in the Martis Valley region.
Sample IDSurvey Distance 1,2 from Xe Injection Point (m)Collection DateAct (pCi/L)Error 95% CI
West Martis Creek @ gage--12/19/114.051.90
Truckee River @ Don. Cr--12/20/1112.612.3
Martis Creek @ #3 Bridge--12/20/1157.536.3
Martis Creek at Hwy 267--12/20/1111.53.81
Donner Creek (between Truckee R and West R Rd)--06/21/122.172.94
Truckee R (40 m dwnstrm of Donner Cr. confl.) --06/21/122.433.00
Martis Creek (upstream wooden bridge @267)--06/21/122.202.98
N Fork American R. @ Iowa Hill--06/21/121.232.82
Mid Martis Cr. @ bridge--07/09/1291.98.62
Martis Cr. Dwnstrm survey--07/09/128.923.41
Martis Cr. Dwnstrm survey--07/09/126.353.13
Martis Cr. Dwnstrm survey--07/09/128.493.41
Martis Cr. Dwnstrm survey--07/09/124.622.97
Martis Cr. Dwnstrm survey--07/09/1212.93.94
Martis Cr. Dwnstrm survey--07/09/1211.43.81
Martis Cr. Dwnstrm survey--07/09/129.113.60
Martis Cr. Dwnstrm survey--07/09/1211.23.86
Martis Cr. Dwnstrm survey--07/09/1213.34.11
Martis Cr. Dwnstrm survey--07/09/126.963.44
Martis Cr. Dwnstrm survey--07/09/129.533.77
Martis Cr. Dwnstrm survey--07/09/128.733.71
Martis Cr. Dwnstrm survey--07/09/124.203.17
Martis Cr. Dwnstrm survey--07/09/127.533.63
Martis Cr. Dwnstrm survey--07/09/127.853.69
Martis Cr. Upstream survey--07/09/1214.94.50
Martis Cr. Dwnstrm survey--07/09/129.954.00
Martis Creek at Hwy 267--07/09/127.333.71
M. Martis Cr. Near Confl.--07/09/123.723.26
Martis Cr. Upstrm confluence --07/09/123.503.98
Martis Lk In dwnstrm surv,--07/09/124.794.19
Martis Lk In dwnstrm surv.--07/09/126.444.46
Martis Lk In dwnstrm surv.--07/09/124.254.19
Martis Lake Inlet --07/09/128.224.78
Martis Lake Inlet upstrm --07/09/121.703.89
Donner Creek--07/09/124.364.30
Truckee R. @ Donner Cr.--07/09/122.734.09
Truckee R. @ Donner Cr.--07/09/122.084.03
Jake’s Bridge--08/02/120.6042.10
Upstream survey 1--08/02/120.8142.16
Pappe’s Bridge--08/02/1234.45.53
Upstream survey 2--08/02/1241.46.04
Upstream survey 3--08/02/1247.16.43
Upstream survey 4--08/02/1254.86.93
Upstream survey 5--08/02/1246.06.44
Upstream survey 6--08/02/1270.57.87
Upstream survey 7--08/02/1265.27.63
Upstream survey 8--08/02/1274.88.18
Upstream survey 9--08/02/1275.48.26
Upstream survey 10--08/02/1280.38.56
Upstream survey 11--08/02/1289.29.04
MC059908/02/1224.75.15
Martis Deep Pool--08/02/1210.93.86
Martis Surv. Dwnstrm--08/02/127.293.44
Martis Cr at Hwy 267--08/02/126.583.35
Martis Cr at Hwy 267--08/02/126.183.32
Martis Cr at Hwy 267--08/02/125.763.29
Middle Martis Creek--08/02/1266.28.13
East Martis Cr.--10/29/126.793.75
MC-02--3/29/1311.58.75
MC-04−503/29/1319.09.87
MC-09−1703/29/1331.111.5
MC-10−1823/29/1329.811.4
MC-13−2693/29/1324.010.7
MC-17−4153/29/1330.311.6
MC01354/29/1349.69.74
Surv. 1 (upstrm of MC34)--4/29/134.484.67
MC02494/29/1360.710.7
Surv. 2 (upstrm of MC34)--4/29/132.384.35
Surv. 3 (upstrm of MC34)--4/29/139.835.61
MC349654/29/1385.712.5
MC-04−504/29/1365.311.2
Golf Pass Br. upstrm of August survey--4/29/132.464.50
Large Golf Br. upstrm of August survey--4/29/132.484.54
MC081284/29/1317.46.77
MC05994/29/1319.37.03
MC03 564/29/1379.512.5
Notes: 1 Negative distances are upstream and positive distances are downstream from the Xe introduction point (MC00). 2 Two dashes (--) denote no distance recorded.
Figure A1. (a) Well locations noted in Table A1; (b) Spring locations noted in Table A1.
Water 10 00100 g0a1
Figure A2. Surface water locations noted in Table A2.
Water 10 00100 g0a2
Figure A3. Results of March/April 2013 Radon survey, also shown in Table A2.
Water 10 00100 g0a3
Figure A4. Exponential decrease in the tracer concentrations shown on a plot of log Xe concentration vs distance from Xe tracer injection location.
Water 10 00100 g0a4
Table A3. Measured 222Rn activity levels for surface water samples in the Martis Valley region (other than those shown in Table 1) corresponding to locations on Figure 1 and Figure A2.
Sample IDCollection Date Act (pCi/L)Error 95% CI
West Martis Creek @ USGS gage12/19/114.051.90
Truckee River @ Donner Creek12/20/1112.612.3
Martis Creek @ #3 Bridge12/20/1157.536.3
Martis Creek at Hwy 26712/20/1111.53.81
Donner Creek (between Truckee River and West River Rd)06/21/122.172.94
Truckee River (40 m downstream of Donner Cr. confl.) 06/21/122.433.00
Mid Martis Cr. @ bridge07/09/1291.98.62
Martis Cr. Dwnstrm survey07/09/128.923.41
Martis Cr. Upstream survey07/09/1214.94.50
Martis Creek at Hwy 26707/09/127.333.71
Martis Cr. Upstrm confluence 07/09/123.503.98
Martis Lake Inlet 07/09/128.224.78
Donner Creek07/09/124.364.30
Truckee R. @ Donner Cr.07/09/122.734.09
Truckee R. @ Donner Cr.07/09/122.084.03
Martis Creek at Hwy 26708/02/126.583.35
Martis Creek at Hwy 26708/02/126.183.32
Martis Creek at Hwy 26708/02/125.763.29
Middle Martis Creek08/02/1266.28.13
East Martis Creek10/29/126.793.75
Figure A5. Contribution of hyporheic zone exchange to the stream water 222Rn concentration, depending on residence time in the hyporheic zone, for different values of hyporheic zone thickness h.
Water 10 00100 g0a5

References

  1. Brown and Caldwell. Martis Valley Groundwater Management Plan. Available online: http://www.northstarcsd.com/docs/Water/MartisValleyGMPFinal4-18-13.pdf (accessed on 25 October 2017).
  2. Meixner, T.; Manning, A.H.; Stonestrom, D.A.; Allen, D.M.; Ajami, H.; Blasch, K.W.; Brookfield, A.E.; Castro, C.L.; Clark, J.F.; Gochis, D.J.; et al. Implications of projected climate change for groundwater recharge in the western United States. J. Hydrol. 2016, 534, 124–138. [Google Scholar] [CrossRef]
  3. Dettinger, M.D.; Cayan, D.R. Large-scale atmospheric forcing of recent trends toward early snowmelt runoff in California. J. Clim. 1995, 8, 606–623. [Google Scholar] [CrossRef]
  4. Dettinger, M.D.; Cayan, D.R.; Meyer, M.K.; Jeton, A.E. Simulated hydrologic responses to climate variations and change in the Merced, Carson, and American River Basins, Sierra Nevada, California, 1900–2099. Clim. Chang. 2004, 62, 283–317. [Google Scholar] [CrossRef]
  5. Huntington, J.L.; Niswonger, R.G. Role of surface-water and groundwater interactions on projected summertime streamflow in snow dominated regions: An integrated modeling approach. Water Resour. Res. 2012, 48, W11524. [Google Scholar] [CrossRef]
  6. Roy, J.W.; Zaitlin, B.; Hayashi, M.; Watson, S.B. Influence of groundwater spring discharge on small-scale spatial variation of an alpine stream ecosystem. Ecohydrology 2011, 4, 661–670. [Google Scholar] [CrossRef]
  7. Hunt, R.J.; Strand, M.; Walker, J.F. Measuring groundwater-surface water interaction and its effect on wetland stream benthic productivity, Trout Lake watershed, northern Wisconsin, USA. J. Hydrol. 2006, 320, 370–384. [Google Scholar] [CrossRef]
  8. Gorelick, S.M.; Zheng, C. Global change and the groundwater management challenge. Water Resour. Res. 2015, 51, 3031–3051. [Google Scholar] [CrossRef]
  9. Barlow, P.M.; Leake, S.A. Streamflow Depletion by Wells—Understanding and Managing the Effects of Groundwater Pumping on Streamflow. USGS Circular 1376. 2012. Available online: https://pubs.usgs.gov/circ/1376/pdf/circ1376_barlow_report_508.pdf (accessed on 25 October 2017).
  10. Essaid, H.I.; Caldwell, R.R. Evaluating the impact of irrigation on surface water—Groundwater interaction and stream temperature in an agricultural watershed. Sci. Total Environ. 2017, 599–600, 581–596. [Google Scholar] [CrossRef] [PubMed]
  11. State of California, Sustainable Groundwater Management Act. 2014. Available online: http://opr.ca.gov/docs/2014_Sustainable_Groundwater_Management_Legislation_092914.pdf (accessed on 11 October 2017).
  12. Mullinger, N.J.; Binley, A.M.; Pates, J.M.; Crook, N.P. Radon in Chalk streams: Spatial and temporal variation of groundwater sources in the Pang and Lambourn catchments, UK. J. Hydrol. 2007, 339, 172–182. [Google Scholar] [CrossRef]
  13. Burnett, W.C.; Peterson, R.N.; Santos, I.R.; Hicks, R.W. Use of automated radon measurements for rapid assessment of groundwater flow into Florida streams. J. Hydrol. 2010, 380, 298–304. [Google Scholar] [CrossRef]
  14. Unland, N.P.; Cartwright, I.; Andersen, M.S.; Rau, G.C.; Reed, J.; Gilfedder, B.S.; Atkinson, A.P.; Hofmann, H. Investigating the spatio-temporal variability in groundwater and surface water interactions: A multi-technique approach. Hydrol. Earth Syst. Sci. 2013, 17, 3437–3453. [Google Scholar] [CrossRef]
  15. Kalbus, E.; Reinstorf, F.; Schirmer, M. Measuring methods for groundwater—Surface water interactions: A review. Hydrol. Earth Syst. Sci. 2006, 10, 873–887. [Google Scholar] [CrossRef]
  16. McCallum, J.L.; Cook, P.G.; Berhane, D.; Rumpf, C.; McMahon, G. Quantifying groundwater flows to streams using differential flow gaugings and water chemistry. J. Hydrol. 2012, 416 (Suppl. C), 118–132. [Google Scholar] [CrossRef]
  17. Xie, Y.; Cook, P.G.; Shanafield, M.; Simmons, C.T.; Zheng, C. Uncertainty of natural tracer methods for quantifying river–aquifer interaction in a large river. J. Hydrol. 2016, 535 (Suppl. C), 135–147. [Google Scholar] [CrossRef]
  18. Bertrand, G.; Siergieiev, D.; Ala-Aho, P.; Pekka, R. Environmental tracers and indicators bringing together groundwater, surface water and groundwater-dependent ecosystems: Importance of scale in choosing relevant tools. Environ. Earth Sci. 2014, 72, 813–827. [Google Scholar] [CrossRef]
  19. Gilfedder, B.S.; Frei, S.; Hofmann, H.; Cartwright, I. Groundwater discharge to wetlands driven by storm and flood events: Quantification using continuous Radon-222 and electrical conductivity measurements and dynamic mass-balance modelling. Geochim. Cosmochim. Acta 2015, 165, 161–177. [Google Scholar] [CrossRef]
  20. Harrington, G.A.; Gardner, W.P.; Munday, T.J. Tracking groundwater discharge to a large river using tracers and geophysics. Groundwater 2014, 52, 837–852. [Google Scholar] [CrossRef] [PubMed]
  21. Gardner, W.P.; Harrington, G.A.; Solomon, D.K.; Cook, P.G. Using terrigenic 4He to identify and quantify regional groundwater discharge to streams. Water Resour. Res. 2011, 47, W06523. [Google Scholar] [CrossRef]
  22. Banks, E.W.; Simmons, C.T.; Love, A.J.; Shand, P. Assessing spatial and temporal connectivity between surface water and groundwater in a regional catchment: Implications for regional scale water quantity and quality. J. Hydrol. 2011, 404, 30–49. [Google Scholar] [CrossRef]
  23. Martinez, J.L.; Raiber, M.; Cox, M.E. Assessment of groundwater–surface water interaction using long-term hydrochemical data and isotope hydrology: Headwaters of the Condamine River, Southeast Queensland, Australia. Sci. Total Environ. 2015, 536, 499–516. [Google Scholar] [CrossRef] [PubMed]
  24. Yu, M.C.L.; Cartwright, I.; Braden, J.L.; de Bree, S.T. Examining the spatial and temporal variation of groundwater inflows to a valley-to-floodplain river using 222Rn, geochemistry and river discharge: The Ovens River, southeast Australia. Hydrol. Earth Syst. Sci. 2013, 17, 4907–4924. [Google Scholar] [CrossRef]
  25. Chanyotha, S.; Kranrod, C.; Burnett, W.C.; Lane-Smith, D.; Simko, J. Prospecting for groundwater discharge in the canals of Bangkok via natural radon and thoron. J. Hydrol. 2014, 519, 1485–1492. [Google Scholar] [CrossRef]
  26. Genereux, D.P.; Hemond, H.F. Naturally occurring radon 222 as a tracer for streamflow generation: Steady State methodology and field example. Water Resour. Res. 1990, 26, 3065–3075. [Google Scholar]
  27. Cook, P.G.; Lamontagne, S.; Berhane, D.; Clark, J.F. Quantifying groundwater discharge to Cockburn River, southeastern Australia, using dissolved gas tracers 222Rn and SF6. Water Resour. Res. 2006, 42, W10411. [Google Scholar] [CrossRef]
  28. Cook, P.G. Estimating groundwater discharge to rivers from river chemistry surveys. Hydrol. Proc. 2013, 27, 3694–3707. [Google Scholar] [CrossRef]
  29. Cook, P.G.; Love, A.J.; Dighton, J.C. Inferring ground water flow in fractured rock from dissolved radon. Ground Water 1999, 37, 606–610. [Google Scholar] [CrossRef]
  30. Lamontagne, S.; Cook, P.G. Estimation of Hyporheic Exchange in a Subtropical Stream Using Bromide and SF6 Injection and 222Rn Disequilibrium: CSIRO Land and Water Science Report 48/06. 2006. Available online: http://www.clw.csiro.au/publications/science/2006/sr48-06.pdf (accessed on 25 October 2017).
  31. Lamontagne, S.; Cook, P.G. Estimation of hyporheic water residence time in situ using 222Rn disequilibrium. Limnol. Oceanogr. Methods 2007, 5, 407–416. [Google Scholar] [CrossRef]
  32. Zane, M. Reaeration of Sagehen Creek Near Truckee, CA. Bachelor’s Thesis, University of California, Santa Barbara, CA, USA, 11 June 2010. [Google Scholar]
  33. Cox, C.; Esser, B. Estimating groundwater inflow to Squaw Creek using radon. LLNL Nuclear Science Intern Program. 2009; Unpublished manuscript. [Google Scholar]
  34. Clark, J.F.; Wanninkhof, R.; Schlosser, P.; Simpson, H.J. Gas exchange rates in the tidal Hudson River using a dual tracer technique. Tellus 1994, 46B, 274–285. [Google Scholar] [CrossRef]
  35. Benson, A.; Zane, M.; Becker, T.E.; Visser, A.; Urióstegui, S.H.; DeRubeis, E.; Moran, J.E.; Esser, B.K.; Clark, J.F. Quantifying reaeration rates in alpine streams using deliberate gas tracer experiments. Water 2014, 6, 1013–1027. [Google Scholar] [CrossRef]
  36. California’s Groundwater Bulletin 118: North Lahontan Hydrologic Region, Martis Valley Groundwater Basin. Available online: www.water.ca.gov/groundwater/bulletin118/basindescriptions/6-67.pdf (accessed on 5 January 2013).
  37. Interflow Hydrology, Inc.; Cordilleran Hydrology, Inc. Measurement of Ground Water Discharge to Streams Tributary to the Truckee River in Martis Valley, Placer and Nevada Counties, California; IFH Report 2003-02; Interflow Hydrology, Inc.: Truckee, CA, USA; Cordilleran Hydrology, Inc.: Reno, NV, USA, 11 April 2003. [Google Scholar]
  38. Shaw, D.; Hastings, B.; Drake, K.; Hogan, M.; Lindstrom, S. Martis Watershed Assesment. 2012. Available online: www.truckeeriverwc.org/images/documents/Martis_Watershed_Assessment_Final_041012_compressed.pdf (accessed on 25 October 2017).
  39. Cox, C.; Bibby, R.; Esser, B. Radon emanation experiments with Squaw Creek sediments. LLNL Nuclear Science Intern Program. 2009; Unpublished manuscript. [Google Scholar]
  40. Visser, A.; Singleton, M.J.; Hillegonds, D.J.; Velsko, C.A.; Moran, J.E.; Esser, B.K. A membrane inlet mass spectrometry system for noble gases at natural abundances in gas and water samples. Rapid Commun. Mass Spectrom. 2013, 27, 2472–2482. [Google Scholar] [CrossRef] [PubMed]
  41. Shelton, J.L.; Fram, M.S.; Munday, C.M.; Belitz, K. Groundwater-Quality Data for the Sierra Nevada Study Unit, 2008: Results from the California GAMA Program. 2010. Available online: https://www.waterboards.ca.gov/gama/docs/dsr_sierra_regional.pdf (accessed on 25 October 2017).
  42. Appleton, J.D. Radon: Sources, health risks, and hazard mapping. Ambio 2007, 36, 85–89. [Google Scholar] [CrossRef]
  43. Williams, M.R.; Leydecker, A.; Brown, A.D.; Melack, J.M. Processes regulating the solute concentrations of snowmelt runoff in two subalpine catchments of the Sierra Nevada, California. Water Resour. Res. 2001, 37, 1993–2008. [Google Scholar] [CrossRef]
  44. Williams, M.W.; Melack, J.M. Solute chemistry of snowmelt and runoff in an Alpine Basin, Sierra Nevada. Water Resour. Res. 1991, 27, 1575–1588. [Google Scholar] [CrossRef]
  45. Baeza, A.; del Rio, M.; Jimenez, A.; Miro, C.; Paniagua, J. Influence of geology and soil particle size on the surface area/volume activity ratio for natural radionuclides. J. Radioanal. Nucl. Chem. 1995, 189, 289–299. [Google Scholar] [CrossRef]
  46. Schilling, K.E.; Zhang, Y.K.; Drobney, P. Water table fluctuations near an incised stream, Walnut Creek, Iowa. J. Hydrol. 2004, 286, 236–248. [Google Scholar] [CrossRef]
  47. Sappa, G.; Ferranti, F.; De Filippi, F.M.; Cardillo, G. Mg2+ based method for Pertuso Spring discharge evaluation. Water 2017, 9, 67. [Google Scholar] [CrossRef]
  48. Bourke, S.A.; Harrington, G.; Cook, P.; Post, V.; Dogramaci, S. Carbon-14 in streams as a tracer of discharging groundwater. J. Hydrol. 2014, 519, 117–130. [Google Scholar] [CrossRef]
  49. Kim, H.; Lee, K.-K.; Lee, J.-Y. Numerical verification of hyporheic zone depth estimation using streambed temperature. J. Hydrol. 2014, 511 (Suppl. C), 861–869. [Google Scholar] [CrossRef]
  50. Cranswick, R.H.; Cook, P.G.; Lamontagne, S. Hyporheic zone exchange fluxes and residence times inferred from riverbed temperature and radon data. J. Hydrol. 2014, 519, 1870–1881. [Google Scholar] [CrossRef]
Figure 1. Location map showing results of a distributed survey of 222Rn in wells and streams. The closely spaced samples are the focus of the tracer experiment, where tracer was introduced at location MC00 and where groundwater influx to Martis Creek is quantified.
Water 10 00100 g001
Figure 2. 222Rn activity levels for the mid-August 2012 stream survey. Inset: 222Rn as a function of distance downstream; the shaded interval is a local polynomial regression (LOESS) fit. Distance 0 is the location MC00 (Table 1).
Water 10 00100 g002
Figure 3. Measured 222Rn activities (purple triangles) and Xe concentrations (blue squares) in the study reach are shown along with the predicted model values for 222Rn for different values of the groundwater 222Rn concentration ci (purple, green, and blue lines) and Xe (blue line). Dashed rectangles highlight stretches of Martis Creek where groundwater inflow is detected. Distance 0 shows the tracer introduction location (MC00 in Table 1), distance 500 m is the approximate location of MC23 and distance 1000 m is the approximate location of MC34 (Table 1).
Water 10 00100 g003
Figure 4. Stream discharge along Martis Creek study area measured with a FP111 flow probe (red squares and blue diamonds). Distance 0 shows the tracer introduction location (MC00, Table 1). Vertical error bars are ±15%, based on the typical reproducibility of low flow measurements. Modeled groundwater influx over the study reach is also shown for different values of the groundwater 222Rn concentration ci (green, purple, and blue lines). Dashed rectangles highlight stretches of Martis Creek where groundwater inflow is detected.
Water 10 00100 g004
Table 1. Downstream survey of measured 222Rn activity levels in Martis Creek.
Sample IDSurvey Distance 1,2 from Xe Injection Point (m)Collection DateAct (pCi/L)Error 95% CI
MC-17−41508/15/12168.717.14
MC-16−39608/15/12156.316.61
MC-15−32408/15/12132.015.43
MC-14−28208/15/12124.215.07
MC-13−26908/15/12112.614.48
MC-12−25208/15/12122.615.12
MC-11−20508/15/12125.515.35
MC-10−18208/15/12102.214.06
MC-09−17008/15/12117.015.01
MC-08−15508/14/1289.015.13
MC-08−15508/16/1275.111.33
MC-07−13208/14/1261.313.03
MC-06−10708/14/1282.514.79
MC-05−7008/14/1275.114.30
MC-05−7008/16/1294.112.49
MC-04−5008/14/1271.814.11
MC-03−4008/14/1275.614.49
MC-03−4008/16/1285.811.92
MC-01−1108/15/1297.314.60
MC-01−1108/16/1279.711.50
MC-01−1108/16/1276.410.77
MC00008/15/1293.414.27
MC013508/15/1276.614.29
MC024908/15/1288.315.09
MC035608/15/1285.914.83
MC047608/15/1283.814.61
MC059908/15/1284.414.58
MC0611608/15/1275.113.81
MC0713608/15/1295.815.25
MC0814608/15/1269.913.27
MC0915708/15/1252.19.67
MC1018708/15/1250.19.46
MC1120408/15/1262.313.71
MC1222408/15/1255.513.03
MC1325008/15/1289.815.76
MC1426208/15/1271.214.24
MC1527508/15/1269.914.07
MC1629108/15/1263.913.50
MC17--08/15/1271.214.03
MC1834508/15/1272.414.06
MC1937608/15/1282.214.75
MC2043608/15/1252.112.20
MC2146208/15/1264.214.50
MC2248508/15/1263.714.38
MC2350308/15/1266.314.53
MC2453208/15/1262.614.14
MC2557008/15/1265.914.36
MC2661908/15/1238.511.68
MC2766508/15/1244.612.23
MC2877808/15/1246.012.30
MC2983708/15/1238.211.44
MC3086308/15/1231.510.66
MC3188508/15/1243.012.48
MC3289908/15/1226.710.73
MC3395508/15/1231.011.29
MC3499708/15/1240.212.37
Notes: 1 Negative distances are upstream and positive distances are downstream from the Xe introduction point (MC00). 2 Two dashes (--) denote no distance recorded.
Table 2. Measured 222Rn activity levels for sediment samples in the Martis Valley study area, where CI is confidence interval and Ceq is equilibrium concentration.
Sample ID222Rn pCi/kg95% CI222Rn Production Rate, γ pCi/L/d95% CICeq 222Rn pCi/L95% CI
MC23 (2 mm–300 μm) 111.614.1788.63.348618
MC23 (300–63 μm)110.114.1687.43.347918
MC23 (<63 μm)191.694.75152.13.883421
MC34 (2 mm–300 μm)176.684.65140.23.776920
MC34 (300–63 μm)215.224.90170.83.993621
MC34 (<63 μm)263.765.21209.34.1114723
Table 3. Parameters used to model groundwater influx.
VariableRangeDescription
c27–169Measured 222Rn activity (pCi/L)
Qo0.05Initial Stream Discharge (m3/s)
dx7–113Step Size (m)
w1.6–3.6Stream Width (m)
k2.16Gas Transfer Velocity (m/day)
w × k7.6Optimized Effective Gas Exchange Coefficient (m2/day)
Ci400Groundwater 222Rn activity (pCi/L)
v0.16–0.65Stream velocity (for K; m/s)

