A Serious Game Designed to Explore and Understand the Complexities of Flood Mitigation Options in Urban–Rural Catchments

 ,
,  ,
,  and
and
Abstract
1. Introduction
2. Materials and Methods
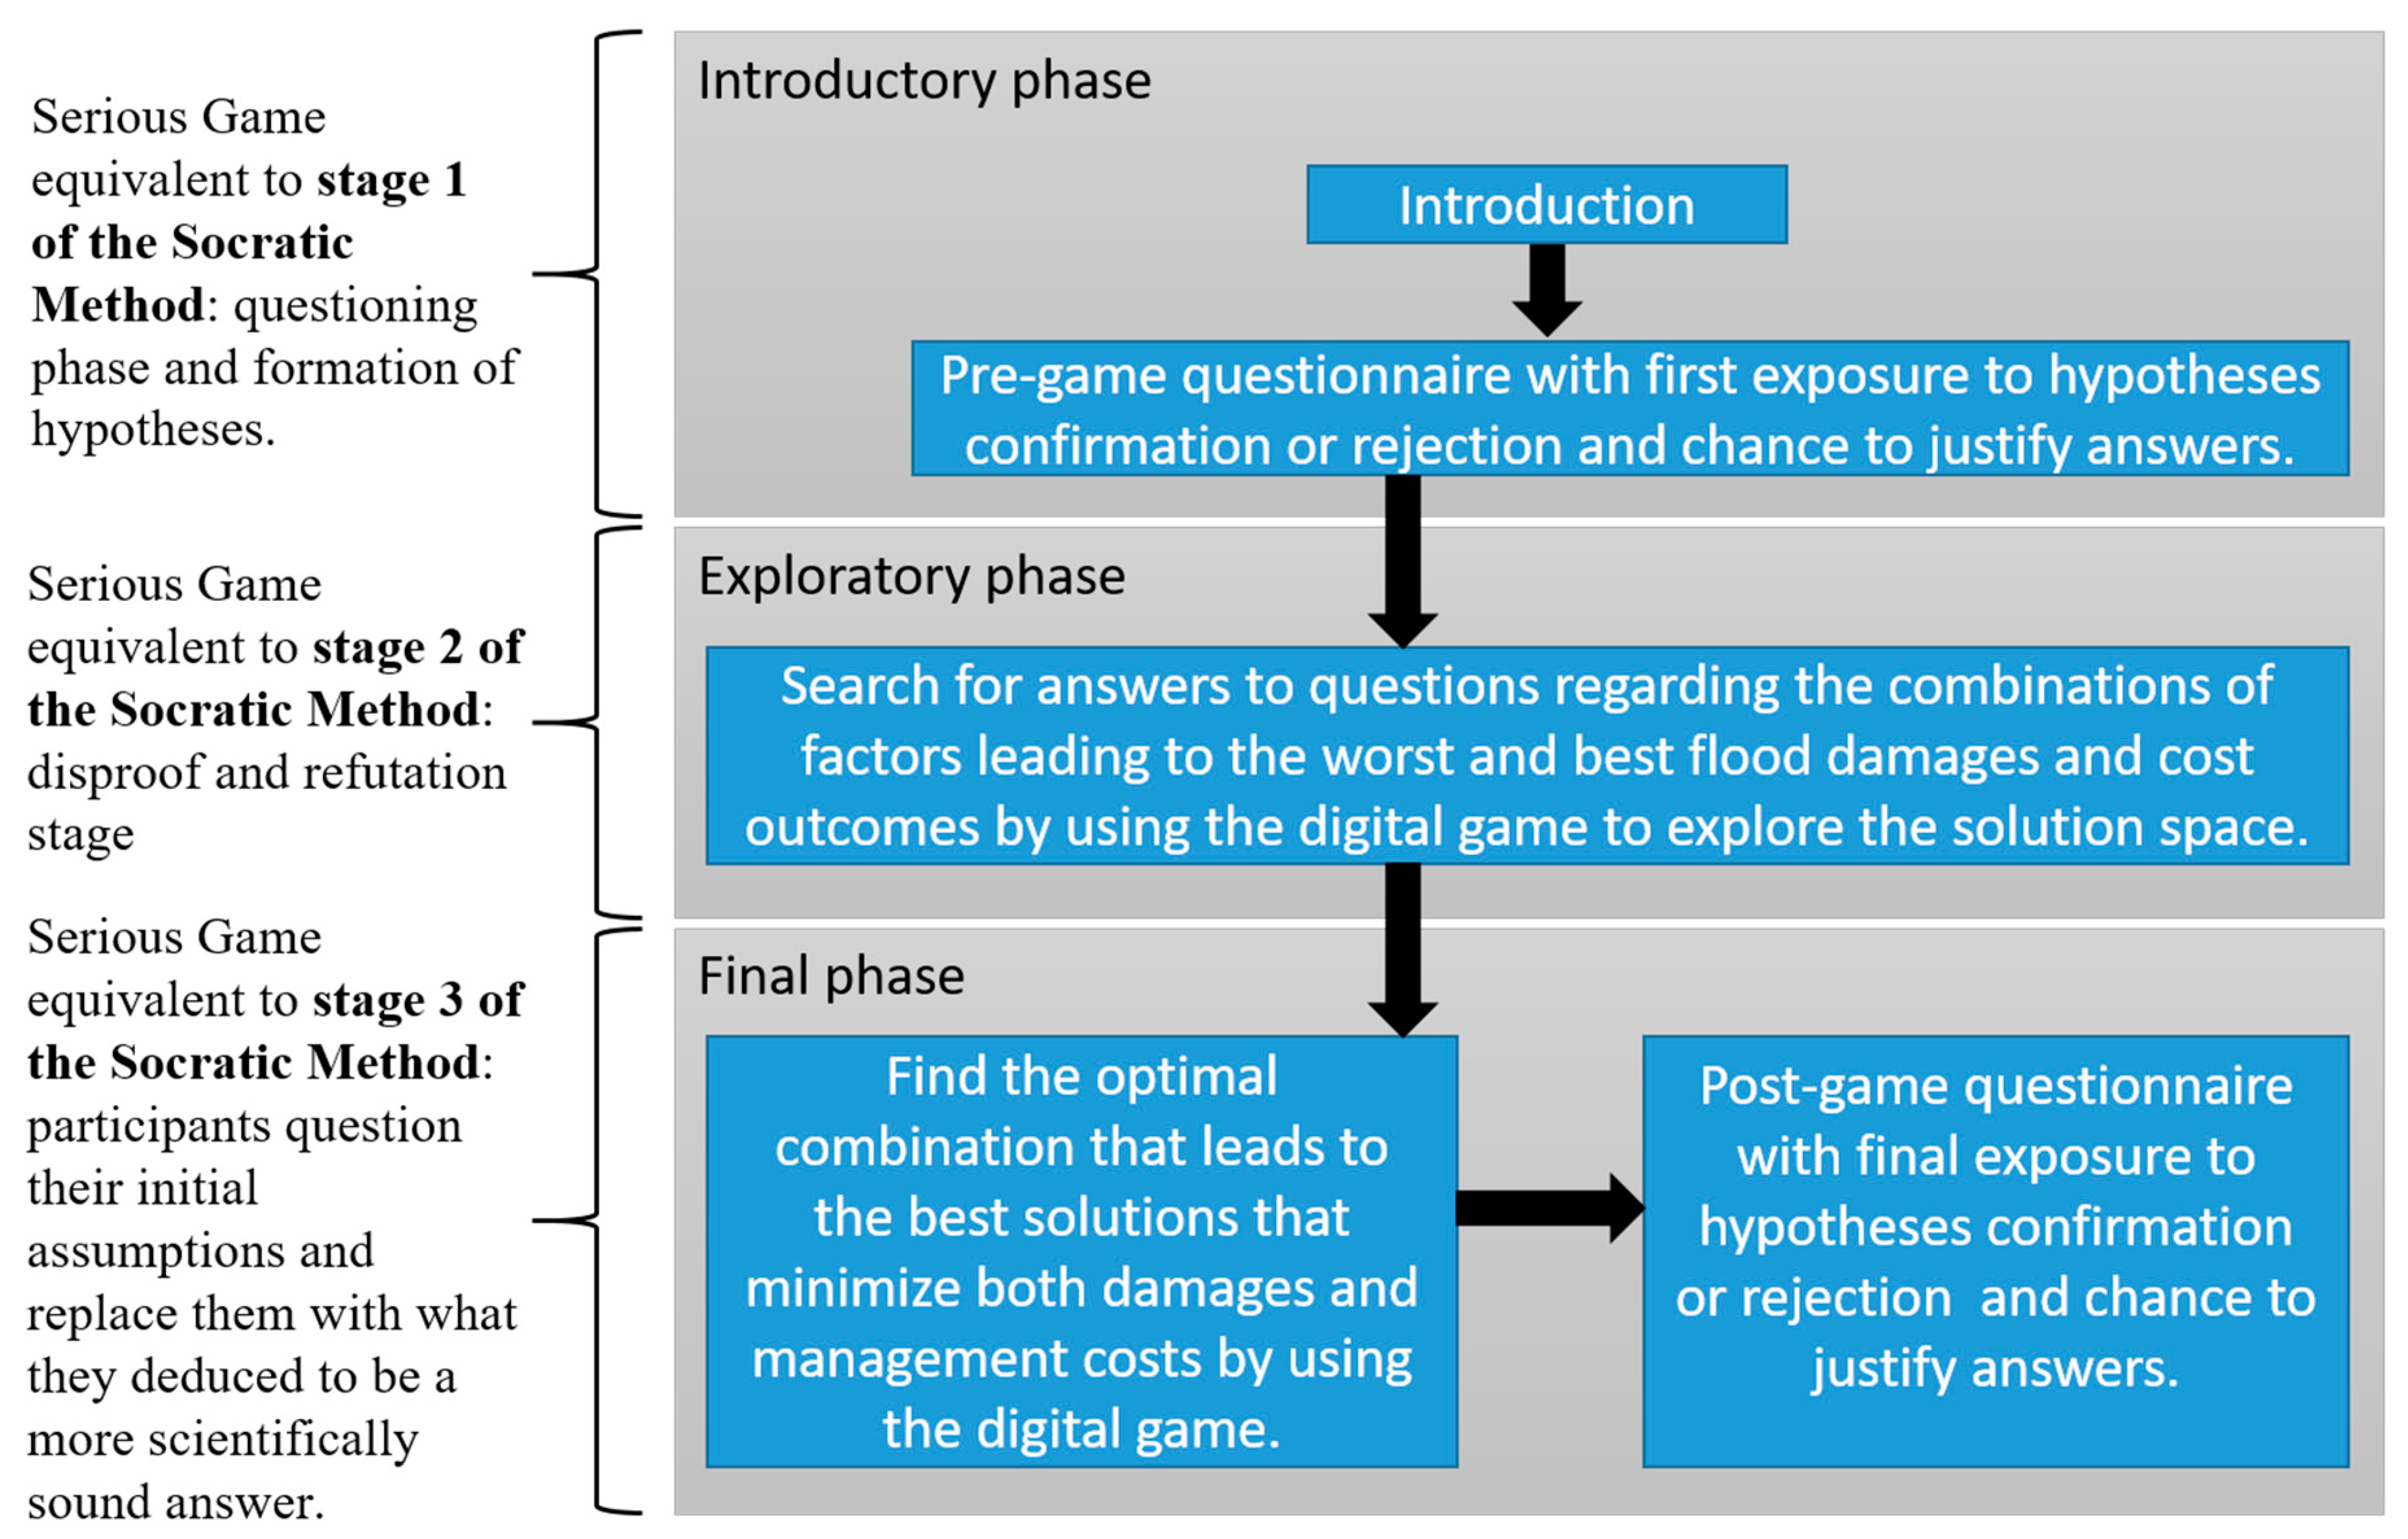
2.1. The Overall Design of the Intervention
2.1.1. The Introductory Phase
- The evaluation of any eventual cognitive change brought about by the Serious Game. This allows us to understand the pre-game state of the initial participants’ views on the Millbrook flood problem. This includes possible pre-formed opinions (perception of the truth) on what would be the best possible decisions to achieve the balance between flood prevention and cost.
- It alerts participants to the crucial questions that they need to keep in mind while they improve their understanding of the problem, and therefore helps them to consolidate memories on technical issues, and to validate or reject hypotheses at the end of their investigative work.
- It creates a Serious Game equivalent of the questioning phase of the Socratic Method. The only difference is that instead of it emerging naturally through dialogue, the hypotheses are artificially created by the mix of introductory materials and the pre-game questionnaire.
2.1.2. The Exploratory Phase
- It reduces an overwhelmingly large combination of solutions into a manageable list of five tasks that are essentially guiding participants’ explorations of the different solution scenarios.
- It forces participants to answer questions where the solutions shown by the game might contradict what they initially thought were the best decisions, hence targeting preconceptions. For example, the exploration of answers to question 2: “What is the combination of measures that leads to the best flood outcome?” leads to the discovery that changing the farming systems around the village has a much greater impact than changing the level of investment in the drainage infrastructure. This corresponds to the Serious Game equivalent of the disproof and refutation stage of the Socratic method.
2.1.3. The Final Phase
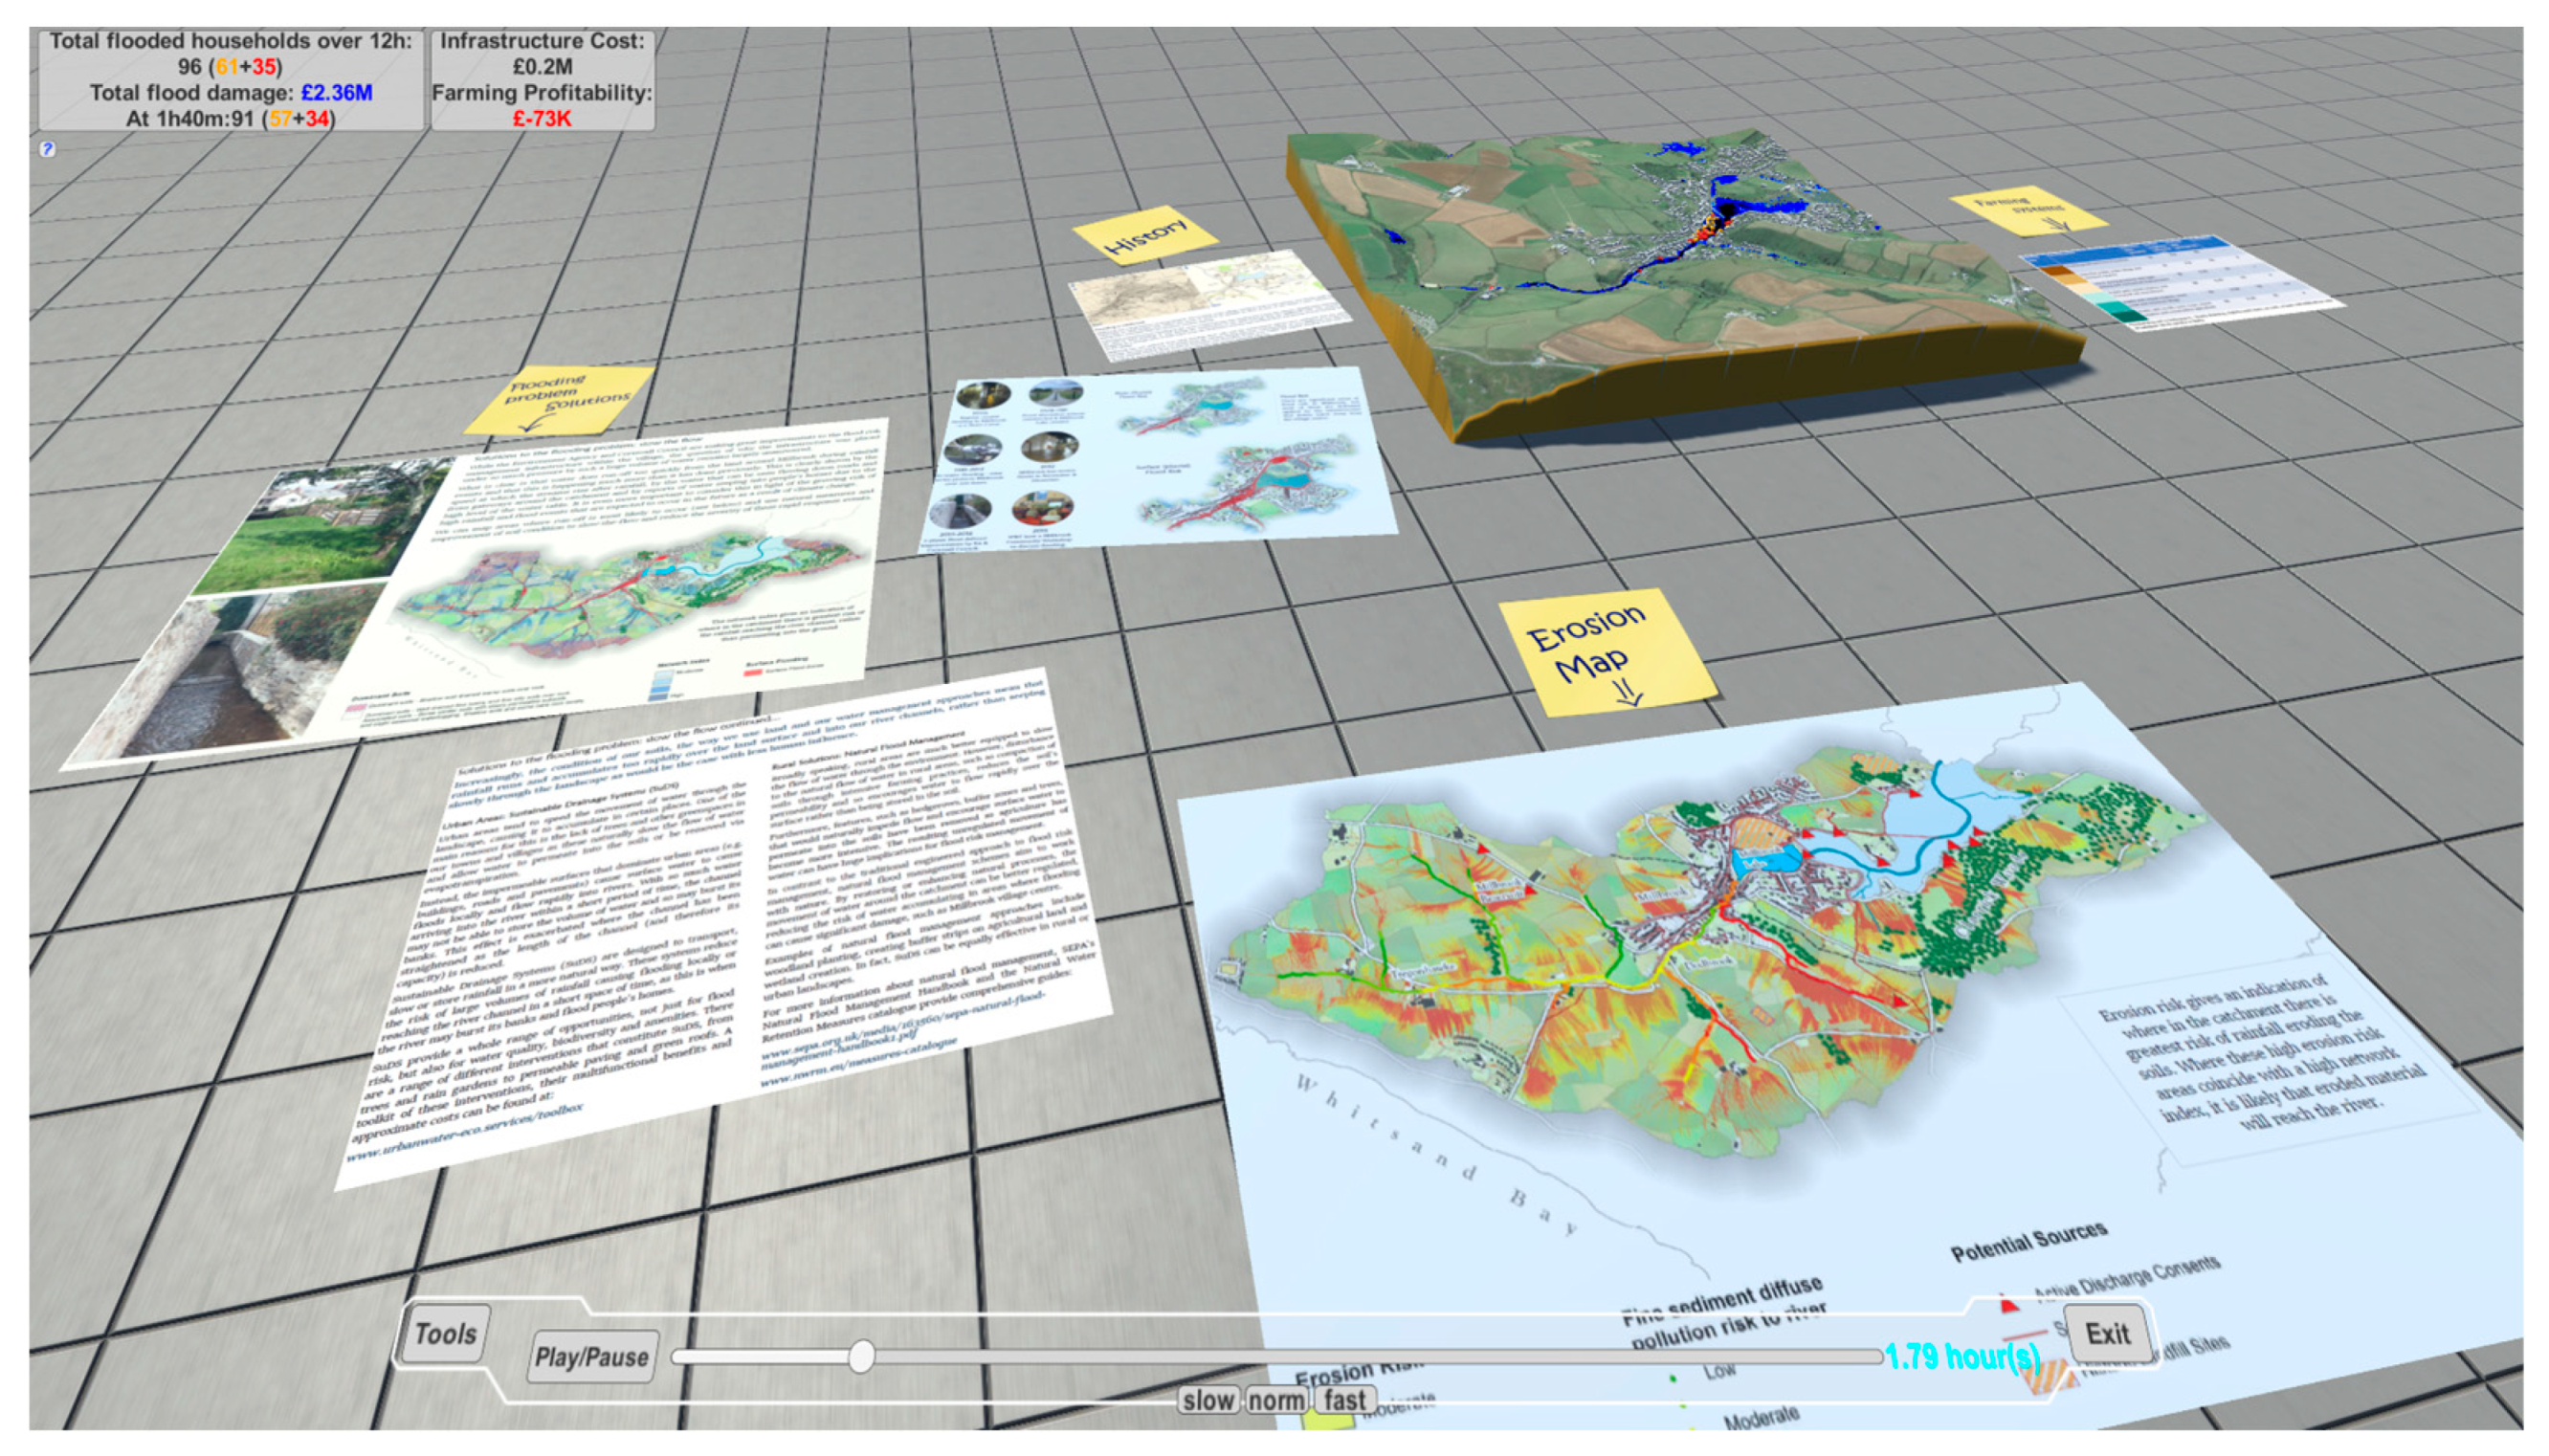
2.2. Game Development Choices
- It can structure this information visually so that the user can see how components are related to each other in the case study, and allows the user to move, rotate, and zoom around components, and finally potentially display geographically distant elements as interconnected infrastructure nodes. For example, a distant power plant that influences the electricity supply of a village can be represented near the village on the virtual plan due to the cause–effect relationship between the two.
- Furthermore, this setting is easily translatable as a Virtual Reality headset-based Serious Game without major code modification.
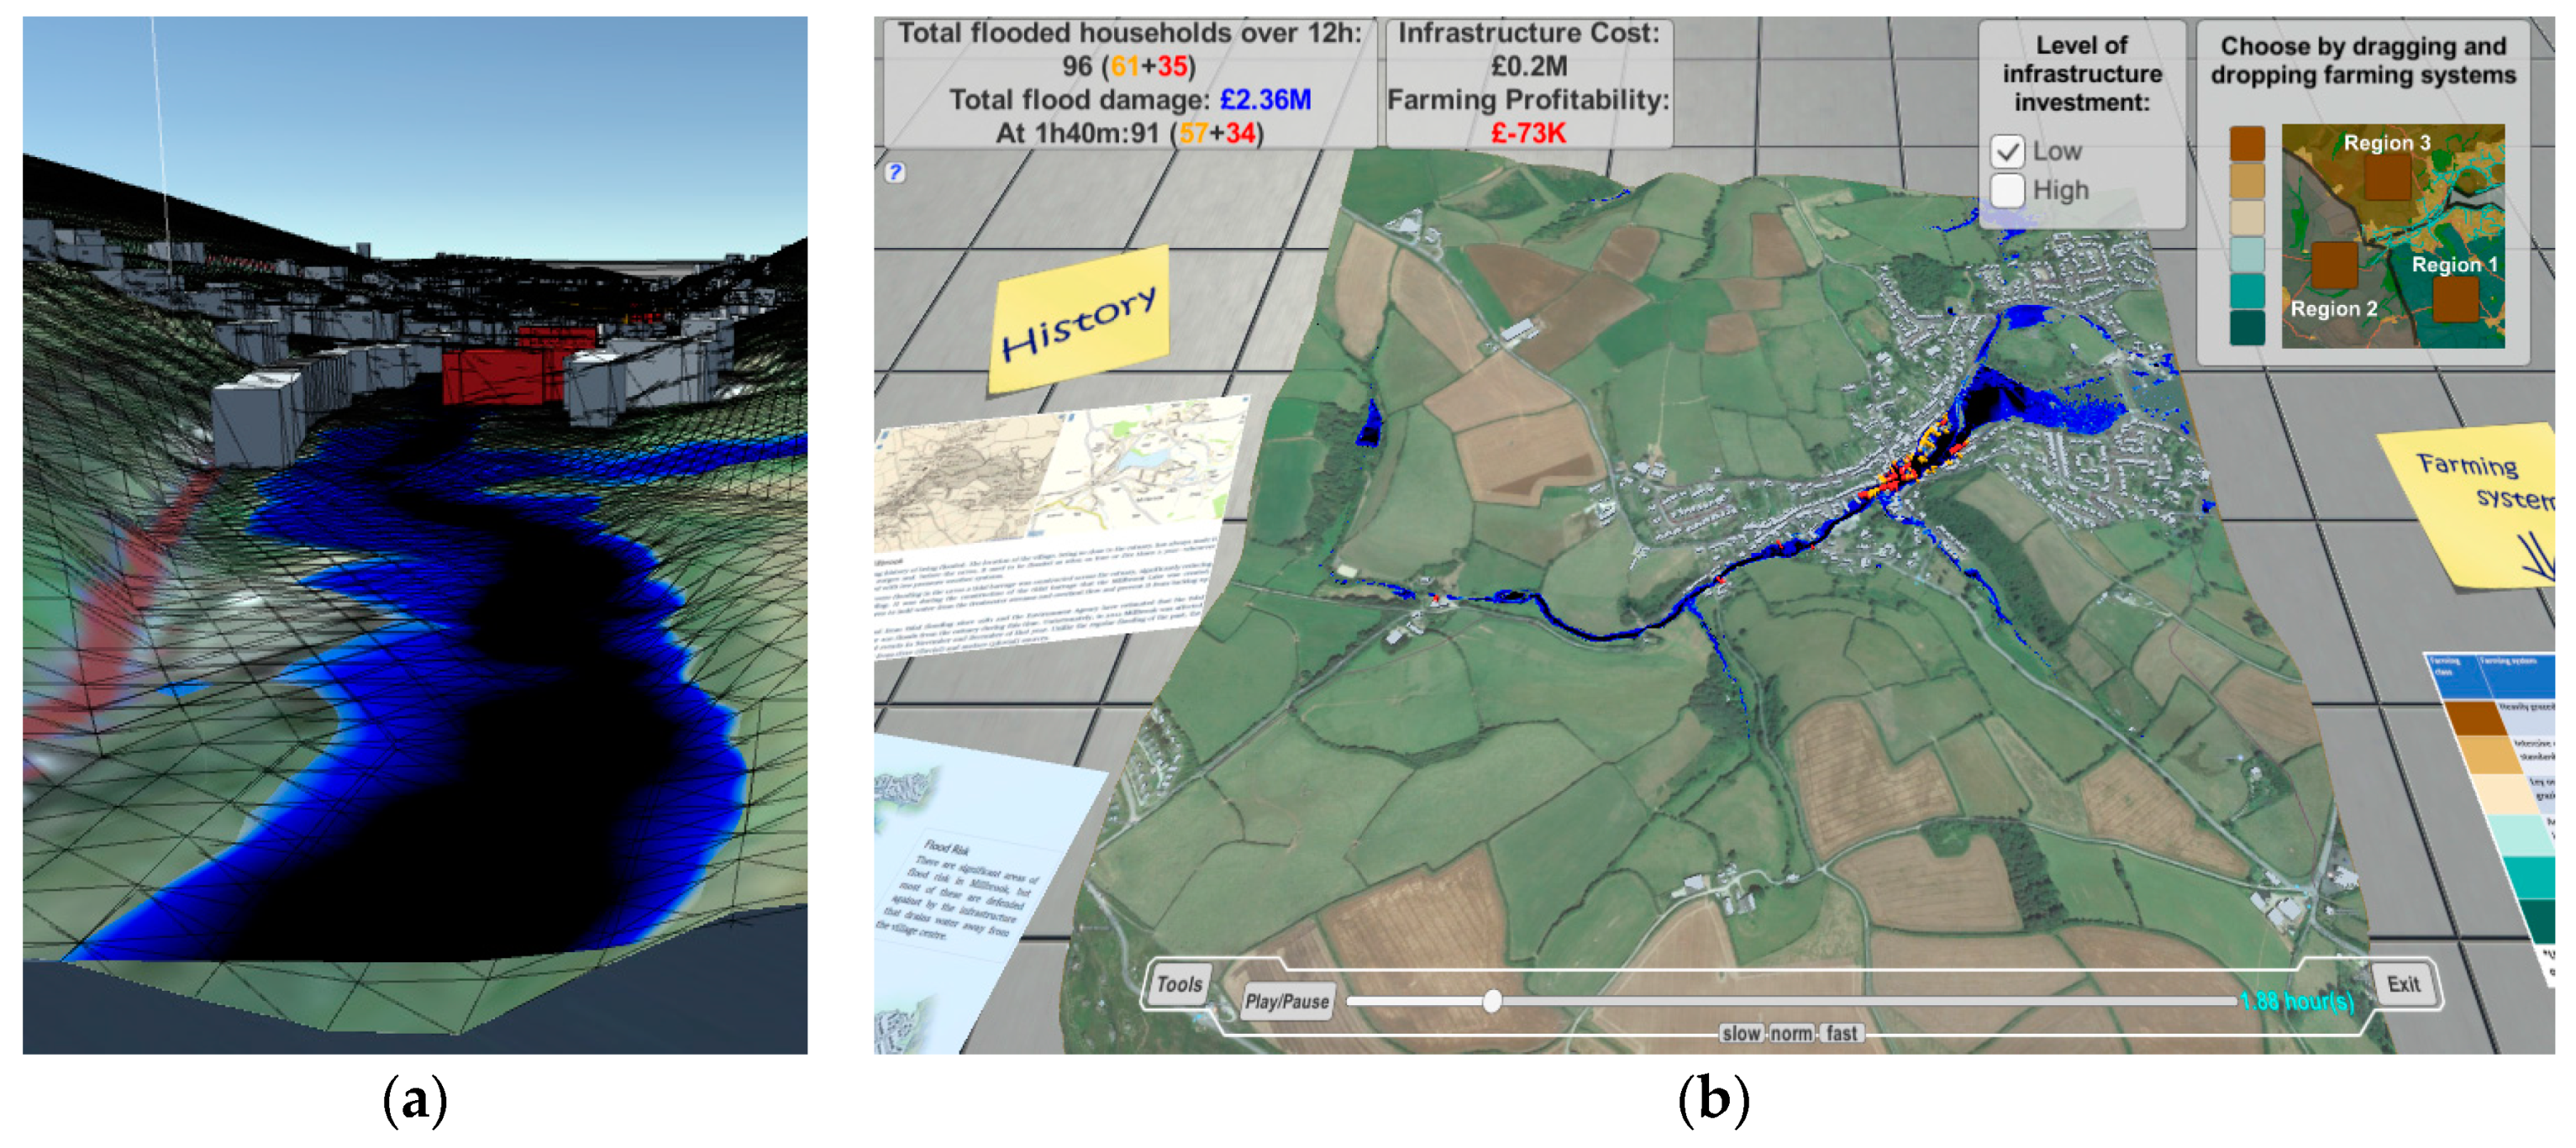
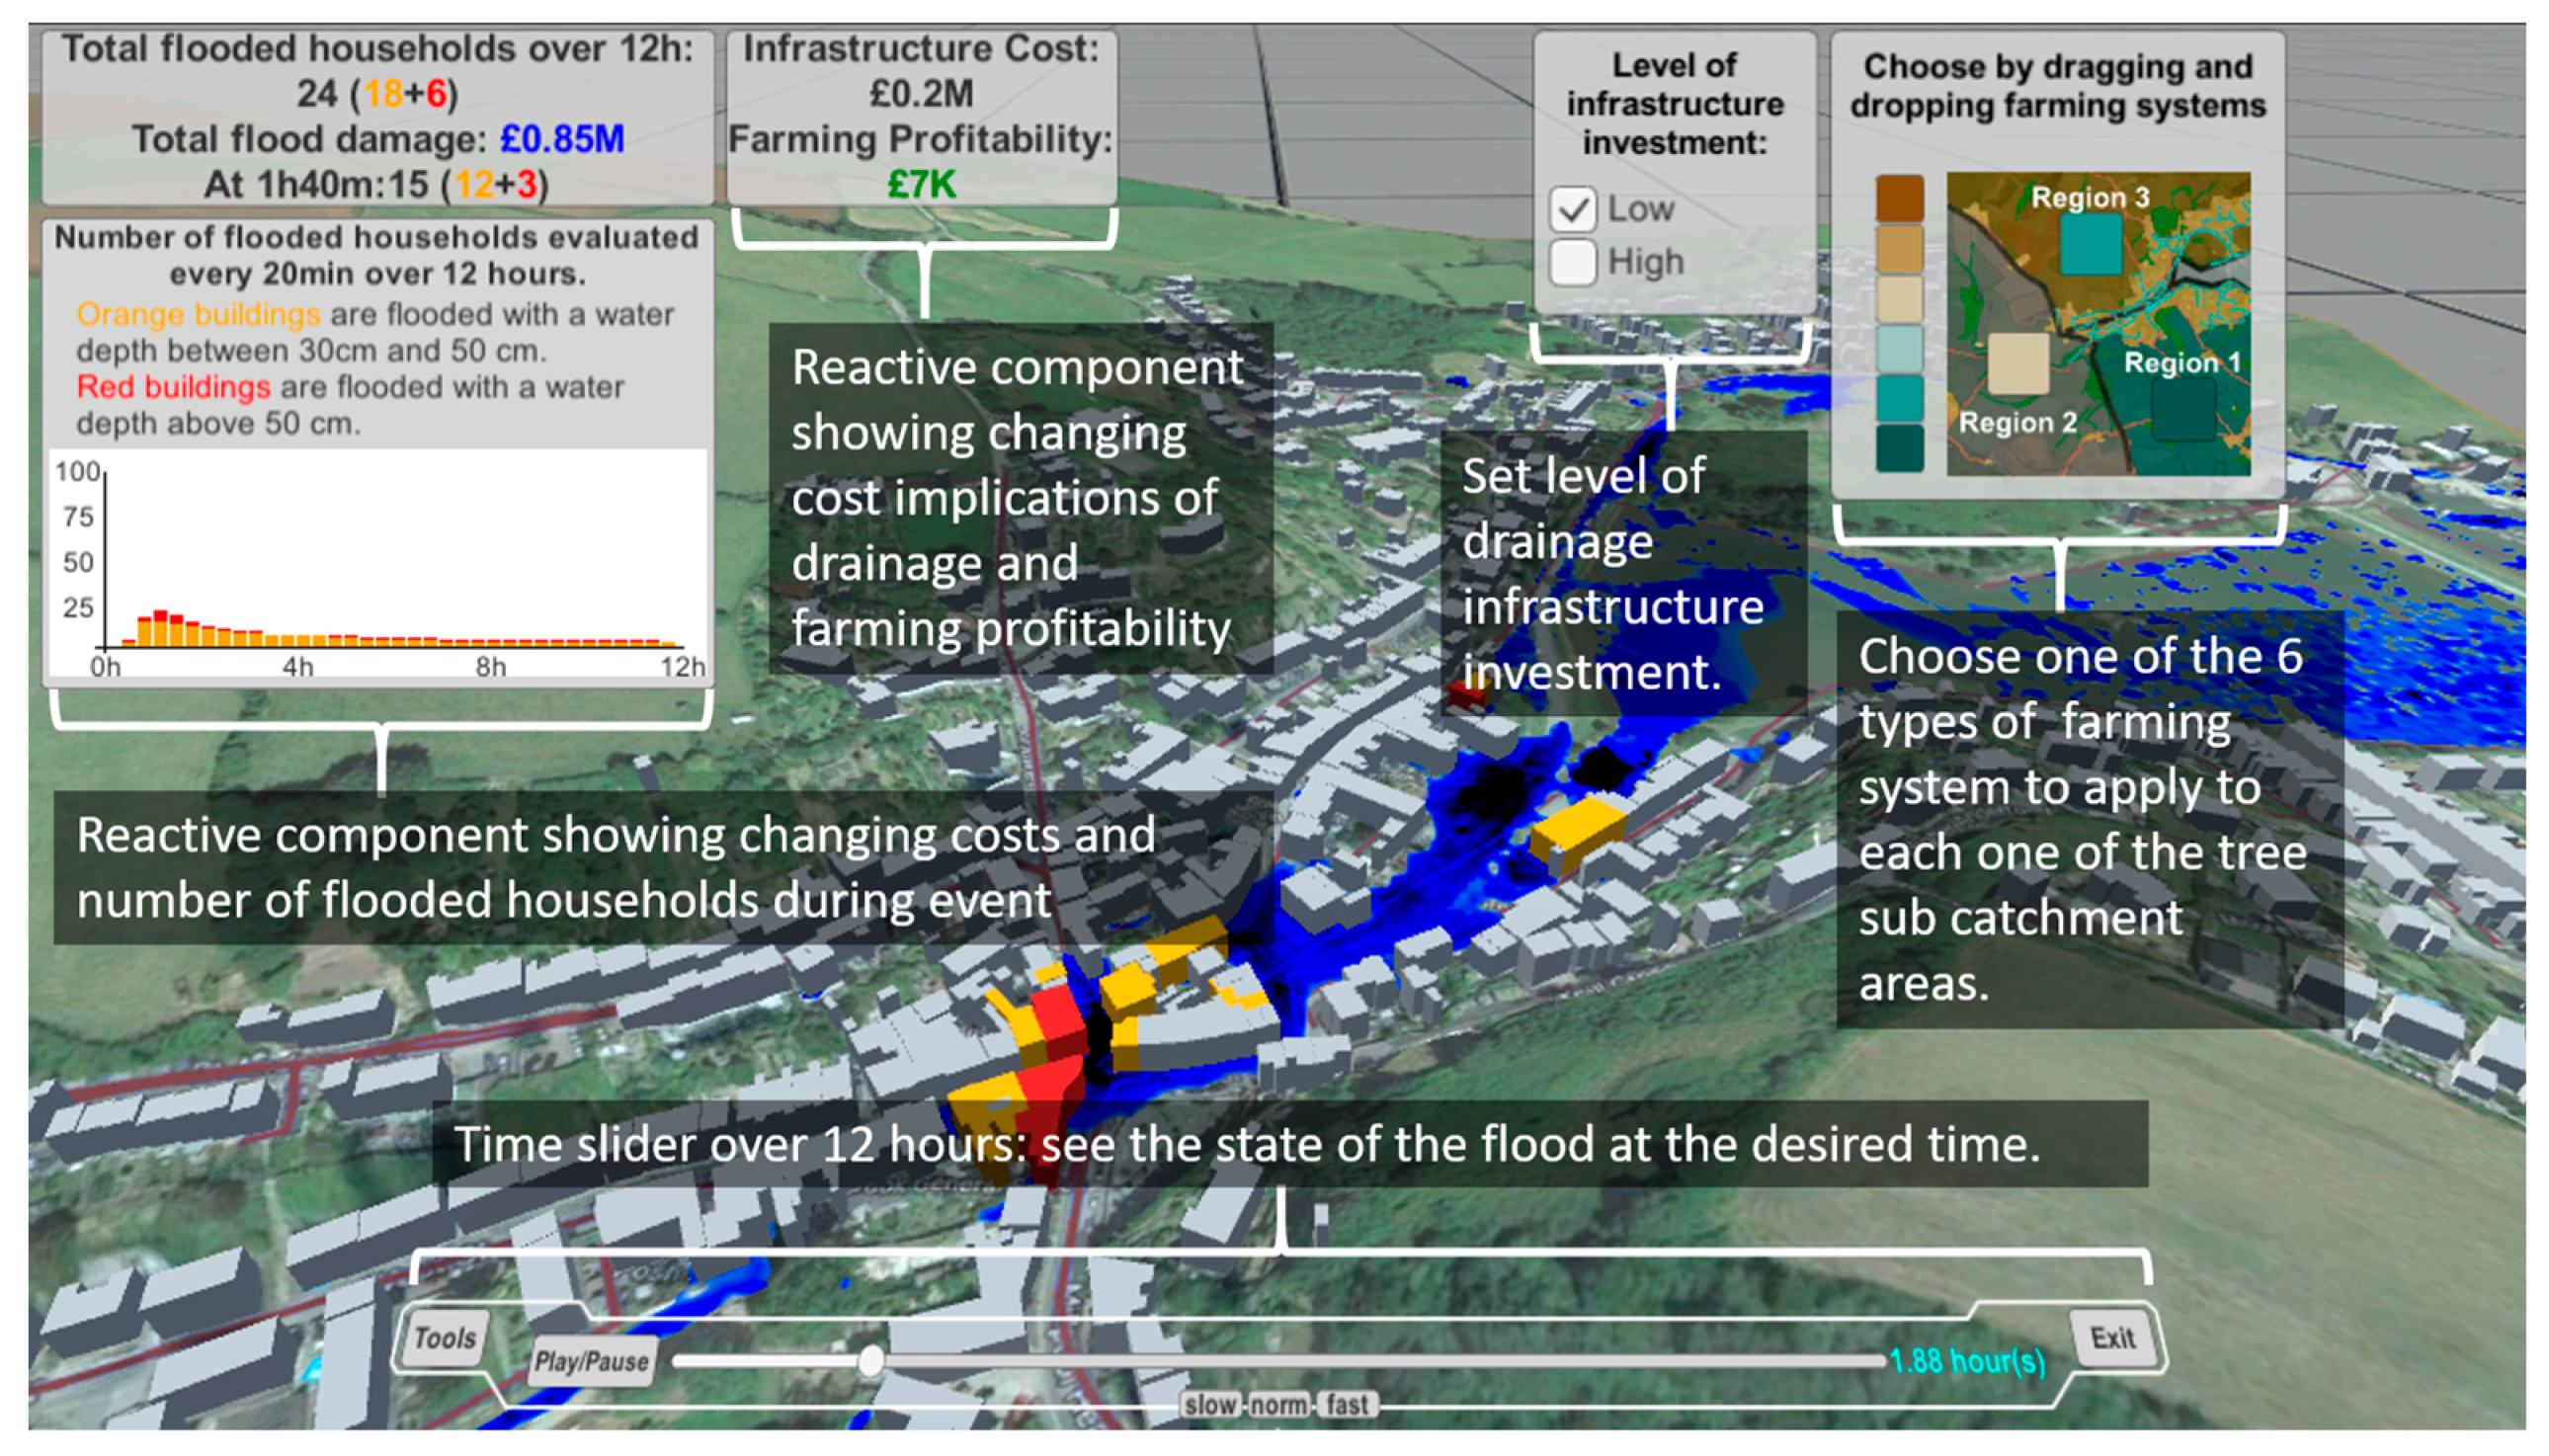
- A temporal slider at the bottom allows a user to change the timing during a selected event to see the progression of the flood. Note that the overall speed of the animation can also be paused, slowed, or accelerated.
- A reactive flood damage information window in the top left corner shows the total number of households flooded, split by the severity of flood inundation, and tracks the costs associated with this. A further indicator shows the number of households flooded at a given point in time. When the mouse hovers on the window, a graph pops up showing the distribution of the number of flooded buildings over time to highlight the peak of the flood event as well as compare the number of occurrences of major versus minor flooding of houses.
- A window at the top center-left of the screen shows the total cost of the selected drainage infrastructure management policy, as well as the total farming profitability of all three cultivated areas around the village.
- A high-maintenance (high cost, well maintained) drainage infrastructure that can cope with surface runoff up to 26 mm/h/m2 in urbanized areas. At the high level of investment scenario, the yearly management cost of the urban drainage infrastructure is evaluated at 406k GBP and includes cleaning 10% of the length of all drainage pipes per year, repairing 3% of total length of pipes, and replacing 1%.
- A low-maintenance (low cost, not well maintained) drainage infrastructure that can discharge surface runoff up to 13 mm/h/m2 in urbanized areas. At this low level of investment scenario, the yearly management cost of the urban drainage infrastructure is evaluated at 203k GBP and includes cleaning 5% of the length of all drainage pipes per year, repairing 1.5% of total length of pipes, and replacing 0.5%.
2.3. The Experimental Design Used to Assess the Intervention
3. Results
3.1. Transformative Nature of the Millbrook Serious Game
- The capacity of the ground to absorb water
- The amount of washed sediments that can block drainage pipes in the village downstream
- The roughness of the terrain that slows the travelling speed of the water
3.2. Informative Nature of the Millbrook Serious Game
3.2.1. The Accuracy and Increasing Use of Numerical Values in Participants’ Answers
3.2.2. The Acquisition of a Domain Specific Vocabulary and the Increased Utilization of Technically Accurate Words.
3.2.3. The Growth in Confidence and Answer Accountability Induced by the Game.
- It is a good informative tool that allows the user to view and understand the effects of decisions for many different scenarios.
- It encourages thought and discussion.
- It is good at changing attitude and promoting positive changes.
4. Discussion and Conclusions
4.1. Cognitive Impact of the Serious Game
4.2. Impacts of the Serious Game on the Millbrook Community
4.3. Limitations and Future Work
Supplementary Materials
Author Contributions
Funding
Acknowledgments
Conflicts of Interest
Appendix A
| Millbrook Serious Game Questionnaire 1 |
| University of Exeter—Westcountry Rivers Trust |
| 1. | A one in-a-hundred years rainfall event of 45 mm of water in one hour could cause serious flood problems in Millbrook. Strongly Disagree Disagree Neutral Agree Strongly Agree How many residences could potentially be flooded? Any worst-case cost approximation? |
| 2. | Improving the village sewer infrastructure that directly drains excess water could result in neutralising up to 90% of the flood resulting from such an event. Strongly Disagree Disagree Neutral Agree Strongly Agree Can you justify your answer? |
| 3. | Improving farming practices that change the ground cover of the cultivated areas around the village could result in neutralising up to 90% of the flood resulting from such an event. Strongly Disagree Disagree Neutral Agree Strongly Agree Can you justify your answer? |
| 4. | Investing money in the sewer infrastructure gives a better result for your money when fighting against flood than trying to support different farming practice. Strongly Disagree Disagree Neutral Agree Strongly Agree Can you justify your answer? |
| 5. | What are the two most important factors in this list of three that influence flooding when looking at the ground cover of cultivated areas?
|
| 6. | Heavily grazed permanent pasture increases greatly the capacity of the soil to absorb water. Strongly Disagree Disagree Neutral Agree Strongly Agree Can you justify your answer? |
| 7. | Growing crops while minimising tillage increases greatly the capacity of the soil to absorb water. Strongly Disagree Disagree Neutral Agree Strongly Agree Can you justify your answer? |
| 8. | Intensive farming that compacts the ground and lowers the capacity of the soil to absorb water, remains the most profiTable way to exploit a cultivated area. Strongly Disagree Disagree Neutral Agree Strongly Agree Can you justify your answer? |
Appendix B
| Questions |
|
|
|
|
|
Appendix C
| Millbrook Serious Game Questionnaire 2 |
| University of Exeter—Westcountry Rivers Trust |
| 1. | A one in-a-hundred years rainfall event of 45 mm of water in one hour could cause serious flood problems in Millbrook. Strongly Disagree Disagree Neutral Agree Strongly Agree How many residences could potentially be flooded? Any worst-case cost approximation? |
| 2. | Improving the village sewer infrastructure that directly drains excess water could result in neutralising up to 90% of the flood resulting from such an event. Strongly Disagree Disagree Neutral Agree Strongly Agree Can you justify your answer? |
| 3. | Improving farming practices that change the ground cover of the cultivated areas around the village could result in neutralising up to 90% of the flood resulting from such an event. Strongly Disagree Disagree Neutral Agree Strongly Agree Can you justify your answer? |
| 4. | Investing money in the sewer infrastructure gives a better result for your money when fighting against flood than trying to support different farming practice. Strongly Disagree Disagree Neutral Agree Strongly Agree Can you justify your answer? |
| 5. | What are the two most important factors in this list of three that influence flooding when looking at the ground cover of cultivated areas?
|
| 6. | Heavily grazed permanent pasture increases greatly the capacity of the soil to absorb water. Strongly Disagree Disagree Neutral Agree Strongly Agree Can you justify your answer? |
| 7. | Growing crops while minimising tillage increases greatly the capacity of the soil to absorb water. Strongly Disagree Disagree Neutral Agree Strongly Agree Can you justify your answer? |
| 8. | Intensive farming that compacts the ground and lowers the capacity of the soil to absorb water, remains the most profiTable way to exploit a cultivated area. Strongly Disagree Disagree Neutral Agree Strongly Agree Can you justify your answer? |
| 9. | Did you learn anything new today? Strongly Disagree Disagree Neutral Agree Strongly Agree If so, what was news to you? |
| 10. | Has this Serious Game changed any previous view you had on the Millbrook problem? Strongly Disagree Disagree Neutral Agree Strongly Agree If so, what was the view that was changed? |
| 11. | Would you recommend this type of Serious Game for other people involved in Millbrook flood problem? Strongly Disagree Disagree Neutral Agree Strongly Agree If so, why? |
Appendix D. Soil Science Review behind Chosen Farming Systems Values and Parameters in the Game

| Profitability Class | Region 1 (75 Hectares) | Region 2 (123 Hectares) | Region 3 (101 Hectares) |
|---|---|---|---|
| high profit (++) | 40,502 | 65,961 | 54,476 |
| average profit (+) | 18,289 | 29,785 | 24,599 |
| null | 0 | 0 | 0 |
| average loss (−) | −18,289 | −29,785 | −24,599 |
| high loss (−−) | −40,502 | −65,961 | −54,476 |
Appendix E. The Level of Investment in the Drainage Infrastructure
| Pipe diameter (mm) | 100 | 125 | 150 | 225 | 300 | 350 | 380 | 400 | 450 | 600 | unknown |
| Total Length (m) | 312 | 817 | 4548 | 3224 | 2427 | 150 | 54 | 571 | 822 | 138 | 3328 |
| Category | <225 mm | 225–450 mm | ≥450 mm | ||||||||
| Total Length (m) | 5677 | 6426 | 960 | 3328 | |||||||
Appendix F. Computational Complexity of the Hydraulic Model and Compromises Made
| Surface Type | Forest | Cultivated Area | Urban | Urban Drainage | Road |
|---|---|---|---|---|---|
| Infiltration rate (mm/h) | 120 mm/h | From 10 to 90 mm/h—see farming systems Table 2 | 20.25 mm/h | See Equations (1) and (2) in Section 2.1.1 | 4.5 mm/h |
| Roughness (Manning coef) | 0.75 | From 0.3 to 0.5 Manning coef—See farming systems Table 2 | 0.25 | 0.25 | 0.05 |
Appendix G. Detail of Wilcoxon Signed-Ranks One-Tailed Test computations
- For Question 1, the W-value is 29. The critical value of W for N = 15 at p ≤ 0.05 is 30. Therefore, the result is significant at p ≤ 0.05.
- For Question 2, the W-value is 16. The critical value of W for N = 18 at p ≤ 0.01 is 32. Therefore, the result is significant at p ≤ 0.01.
- For Question 3, the W-value is 31. The critical value of W for N = 18 at p ≤ 0.01 is 32. Therefore, the result is significant at p ≤ 0.01.
- For Question 4, the W-value is 6.5. The critical value of W for N = 17 at p ≤ 0.01 is 27. Therefore, the result is significant at p ≤ 0.01.
- For Question 6, the W-value is 16.5. The critical value of W for N = 19 at p ≤ 0.01 is 37. Therefore, the result is significant at p ≤ 0.01.
- For Question 7, the W-value is 0. The critical value of W for N = 11 at p ≤ 0.01 is 7. Therefore, the result is significant at p ≤ 0.01.
- For Question 8, the W-value is 12.5. The critical value of W for N = 13 at p ≤ 0.05 is 21. Therefore, the result is significant at p ≤ 0.05.
References
- Alfieri, L.; Dottori, F.; Betts, R.; Salamon, P.; Feyen, L. Multi-Model Projections of River Flood Risk in Europe under Global Warming. Climate 2018, 6, 6. [Google Scholar] [CrossRef]
- Kerbs, J.; Hall, J.; Johnson, A. UK Climate Change Risk Assessment 2017-Synthesis Report: Priorities for the next Five Years; UK Committee on Climate Change: London, UK, 2016. [Google Scholar]
- UK Environment Agency. Flood and Coastal Erosion Risk Management Long-term Investment Scenarios (LTIS) 2014; UK Environment Agency: Bristol, UK, 2014.
- Palmer, R.N.; Cardwell, H.E.; Lorie, M.A.; Werick, W. Disciplined planning, structured participation, and collaborative modeling—Applying shared vision planning to water resources. J. Am. Water Resour. Assoc. 2013, 49, 614–628. [Google Scholar] [CrossRef]
- Savic, D.A.; Morley, M.S.; Khoury, M. Serious Gaming for water system planning and management. Water 2016, 8, 456. [Google Scholar] [CrossRef]
- Aubert, A.H.; Bauer, R.; Lienert, J. A review of water-related serious games to specify use in environmental Multi-Criteria Decision Analysis. Environ. Modell. Softw. 2018, 105, 64–78. [Google Scholar] [CrossRef]
- Rebolledo-Mendez, G.; Avramides, K.; De Freitas, S.; Memarzia, K. Societal impact of a serious game on raising public awareness: The case of FloodSim. In Proceedings of the 2009 ACM SIGGRAPH Symposium on Video Games, New Orleans, LA, USA, 4–6 August 2009; pp. 15–22. [Google Scholar]
- Aqua Republica. Available online: http://aquarepublica.com/ (accessed on 10 October 2016).
- Meera, P.; McLain, M.L.; Bijlani, K.; Jayakrishnan, R.; Rao, B.R. Serious game on flood risk management. In Emerging Research in Computing, Information, Communication and Applications; Springer: New York, NY, USA, 2016; pp. 197–206. [Google Scholar]
- Douven, W.; Mul, M.L.; Son, L.; Bakker, N.; Radosevich, G.; Hendriks, A. Games to create awareness and design policies for transboundary cooperation in river basins: Lessons from the shariva game of the Mekong river commission. Water Resour. Manag. 2014, 28, 1431–1447. [Google Scholar] [CrossRef]
- Valkering, P.; van der Brugge, R.; Offermans, A.; Haasnoot, M.; Vreugdenhil, H. A perspective-based simulation game to explore future pathways of a water-society system under climate change. Simul. Gaming 2013, 44, 366–390. [Google Scholar] [CrossRef]
- Van der Wal, M.M.; de Kraker, J.; Kroeze, C.; Kirschner, P.A.; Valkering, P. Can computer models be used for social learning? A Serious Game in water management. Environ. Model. Softw. 2016, 75, 119–132. [Google Scholar] [CrossRef]
- Haasnoot, M.; Middelkoop, H.; van Beek, E.; van Deursen, W.P.A. A method to develop sustainable water management strategies for an uncertain future. Sustain. Dev. 2011, 19, 369–381. [Google Scholar] [CrossRef]
- Stefanska, J.; Magnuszewski, P.; Sendzimir, J.; Romaniuk, P.; Taillieu, T.; Dubel, A.; Flachner, Z.; Balogh, P. A gaming exercise to explore problem-solving versus relational activities for river floodplain management. Environ. Policy Gov. 2011, 21, 454–471. [Google Scholar] [CrossRef]
- Seibert, J.; Vis, M.J.P. Irrigania—A web-based game about sharing water resources. Hydrol. Earth Syst. Sci. 2012, 16, 2523–2530. [Google Scholar] [CrossRef]
- Bassi, A.M.; de Rego, F.; Harrisson, J.; Lombardi, N. WATERSTORY ILE: A systemic approach to solve a long-lasting and far-reaching problem. Simul. Gaming 2015, 46, 404–429. [Google Scholar] [CrossRef]
- De Kleermaeker, S.; Zijderveld, A.; Thonus, B. Training for crisis response with serious games based on early warning systems. In Proceedings of the 8th International ISCRAM Conference, Lisbon, Portugal, 8–11 May 2011. [Google Scholar]
- De Kleermaeker, S.; Arentz, L. Serious gaming in training for crisis response. In Proceedings of the 9th International ISCRAM Conference, Vancouver, BC, Canada, 22–25 April 2012. [Google Scholar]
- Leskens, J.; Kehl, C.; Tutenel, T.; Kol, T.; Haan, G.; Stelling, G.; Eisemann, E. An interactive simulation and visualization tool for flood analysis usable for practitioners. Mitig. Adapt. Strateg. Glob. Chang. 2015, 22, 307–324. [Google Scholar] [CrossRef] [PubMed]
- Kemec, S.; Zlatanova, S.; Duzgun, H. A Framework for Defining a 3D Model in Support of Risk Management. Geogr. Inf. Cartogr. Risk Cris. Manag. 2010, 69–82. [Google Scholar] [CrossRef]
- Mioc, D.; Anton, F.; Nickerson, B.; Santos, M.; Adda, P.; Tienaah, T.; Ahmad, A.; Mezouagh, M.; MacGillivray, M. Flood progression modelling and impact analysis. 2011. Available online: http://orbit.dtu.dk/files/51177341/InTech1.pdf (accessed on 13 June 2018).
- Swiss Federal Geoportal. Available online: https://map.geo.admin.ch (accessed on 14 June 2018).
- Hunnicutt, B.K. Leisure and play in Plato’s teaching and philosophy of learning. Leisure Sci. 1990, 12, 211–227. [Google Scholar] [CrossRef]
- “Unity®” (or Unity3d) Software. Available online: https://unity3d.com (accessed on 11 March 2018).
- Qureshi, A.; Rizvi, F.; Syed, A.; Shahid, A.; Manzoor, H. The method of loci as a mnemonic device to facilitate learning in endocrinology leads to improvement in student performance as measured by assessments. Adv. Physiol. Educ. 2014, 38, 140–144. [Google Scholar] [CrossRef] [PubMed]
- Khoury, M.; Chen, A.; Gibson, M.; Vamvakeridou-Lyroudia, L.; Stewart, D.; Wood, M.; Savic, D.; Djordjevic, S. A Serious Game to explore different flooding scenarios and their respective effects on infrastructures. In Proceedings of the 13th International Conference on Hydroinformatics, Palermo, Italy, 1–6 July 2018. [Google Scholar]
- Lammers, K. Unity Shaders and Effects Cookbook; Packt Publishing: Birmingham, UK, 2013. [Google Scholar]
- Guidolin, M.; Chen, A.S.; Ghimire, B.; Keedwell, E.C.; Djordjević, S.; Savić, D.A. A weighted cellular automata 2D inundation model for rapid flood analysis. Environ. Modell. Softw. 2016, 84, 378–394. [Google Scholar] [CrossRef]
- CADDIES Framework University of Exete. 2016. Available online: emps.exeter.ac.uk/engineering/research/cws/resources/caddies-framework/ (accessed on 25 August 2018).
- Gibson, M.; Savic, D.; Djordjevic, S.; Chen, A.; Fraser, S.; Watson, T. Accuracy and computational efficiency of 2D urban surface flood modelling based on cellular automata. Procedia Eng. 2016, 154, 801–810. [Google Scholar] [CrossRef]
- Online Calculator Used for the Wilcoxon Signed-Ranks One-Tailed Test: “Social Science Statistics”. Available online: https://www.socscistatistics.com/tests/signedranks/Default2.aspx (accessed on 25 August 2018).
- Lankford, B.; Watson, D. Metaphor in natural resource gaming: Insights from the river basin game. Simul. Gaming 2007, 38, 421–442. [Google Scholar] [CrossRef]
- Van Huijstee, M.; Francken, M.; Leroy, P. Partnerships for sustainable development: A review of current literature. Environ. Sci. 2007, 4, 75–89. [Google Scholar] [CrossRef]
- Harteveld, C. Triadic Game Design: Balancing Reality, Meaning and Play; Springer: London, UK, 2011. [Google Scholar]
- Sušnik, J.; Chew, C.; Domingo, X.; Mereu, S.; Trabucco, A.; Evans, B.; Vamvakeridou-Lyroudia, L.; Savić, D.A.; Laspidou, C.; Brouwer, F. Multi-Stakeholder Development of a Serious Game to Explore the Water-Energy-Food-Land-Climate Nexus: The SIM4NEXUS Approach. Water 2018, 10, 139. [Google Scholar] [CrossRef]
- Foth, H.D. Fundamentals of Soil Science, 8th ed.; Wiley: New York, NY, USA, 1991; ISBN 978-0-471-52279-9. [Google Scholar]
- Richards, L.A. Capillary conduction of liquids through porous mediums. Physics 1931, 1, 318–333. [Google Scholar] [CrossRef]
- Green, W.H.; Ampt, G. Studies of soil physics. J. Agric. Sci. 1911, 4, 1–24. [Google Scholar] [CrossRef]
- Soilscape Soils Types Map. Available online: http://www.landis.org.uk/soilscapes/index.cfm (accessed on 8 September 2018).
- Kooistra, M.J.; Bouma, J.; Boersma, O.H.; Jager, A. Physical and morphological characterization of undisturbed and disturbed ploughpans in a sandy loam soil. Soil Tillage Res. 1984, 4, 405–417. [Google Scholar] [CrossRef]
- Meek, B.D.; Rechel, E.R.; Carter, L.M.; DeTar, W.R.; Urie, A.L. Infiltration rate of a sandy loam soil: Effects of traffic, tillage, and plant roots. Soil Sci. Soc. Am. J. 1992, 56, 908–913. [Google Scholar] [CrossRef]
- Stobart, R.M.; Morris, N.L. The impact of cover crops on yield and soils in the New Farming Systems programme. Asp. Appl. Biol. 2014, 127, 223–232. [Google Scholar]
- Chyba, J.; Kroulik, M.; Kristof, K.; Misiewicz, P.A. The influence of agricultural traffic on soil infiltration rates. Agron. Res. 2017, 15, 664–673. [Google Scholar]
- Fullen, M.A. Compaction, hydrological processes and soil erosion on loamy sands in east Shropshire, England. Soil Tillage Res. 1985, 6, 17–29. [Google Scholar] [CrossRef]
- Hathaway-Jenkins, L.J.; Sakrabani, R.; Pearce, B.; Whitmore, A.P.; Godwin, R.J. A comparison of soil and water properties in organic and conventional farming systems in England. Soil Use Manag. 2011, 27, 133–142. [Google Scholar] [CrossRef]
- Slaymaker, O.; Spencer, T.; Embleton-Hamann, C. Geomorphology and Global Environmental Change; Cambridge University Press: New York, NY, USA, 2009. [Google Scholar]
- Wang, X.; Gao, H.; Tullberg, J.N.; Li, H.; Kuhn, N.; McHugh, A.D.; Li, Y. Traffic and tillage effects on runoff and soil loss on the Loess Plateau of northern China. Soil Res. 2008, 46, 667–675. [Google Scholar] [CrossRef]
- Evans, R.; Collins, A.L.; Foster, I.D.; Rickson, R.J.; Anthony, S.G.; Brewer, T.; Deeks, L.; Newell-Price, J.P.; Truckell, I.G.; Zhang, Y. Extent, frequency and rate of water erosion of arable land in Britain–benefits and challenges for modelling. Soil Use Manag. 2016, 32, 149–161. [Google Scholar] [CrossRef]
- Rohde, K.; Yule, D. Soil compaction and controlled traffic farming research in Central Queensland. ISTRO 2003, 16, 1020–1027. [Google Scholar]
- Online Farming Profitability Indicators: “Farm Business Survey”. Available online: http://www.farmbusinesssurvey.co.uk/benchmarking/Default.aspx?Module=ProfitResults_ (accessed on 25 August 2017).
- Penning-Rowsell, E.; Priest, S.; Parker, D.; Morris, J.; Tunstall, S.; Viavattene, C.; Chatterton, J.; Owen, D. Flood and Coastal Erosion Risk Management: A Manual for Economic Appraisal; Routledge: London, UK, 2013; ISBN 9780415815154. [Google Scholar]
- Multi-Colored_Manual Online, Middlesex University. May 2018. Available online: https://www.mcm-online.co.uk/ (accessed on 20 August 2018).


| Type | Infiltration Rate (mm/h) * | Surface Roughness (Manning Coefficient) | Drainage Pipe Blockage (%) | Profitability (−−, −, 0, +, ++) |
|---|---|---|---|---|
| Heavily grazed permanent pasture | 10 | 0.3 | 40 | − |
| Intensive arable under tillage and standard rotation | 15 | 0.4 | 90 | 0 |
| Young grassland with moderate grazing and mechanical improvement | 30 | 0.35 | 10 | −− |
| Arable with mixed rotation and increased soil amendment | 38 | 0.45 | 70 | + |
| Arable with mixed rotation, cover crops and minimum tillage | 70 | 0.50 | 50 | ++ |
| Arable with no-till, cover crops, mixed rotation and conservation agriculture | 90 | 0.50 | 20 | + |
| Hypothesis | Correct Answer | Directional Change 1 | Level of Significance 2 of Directional Change | |
|---|---|---|---|---|
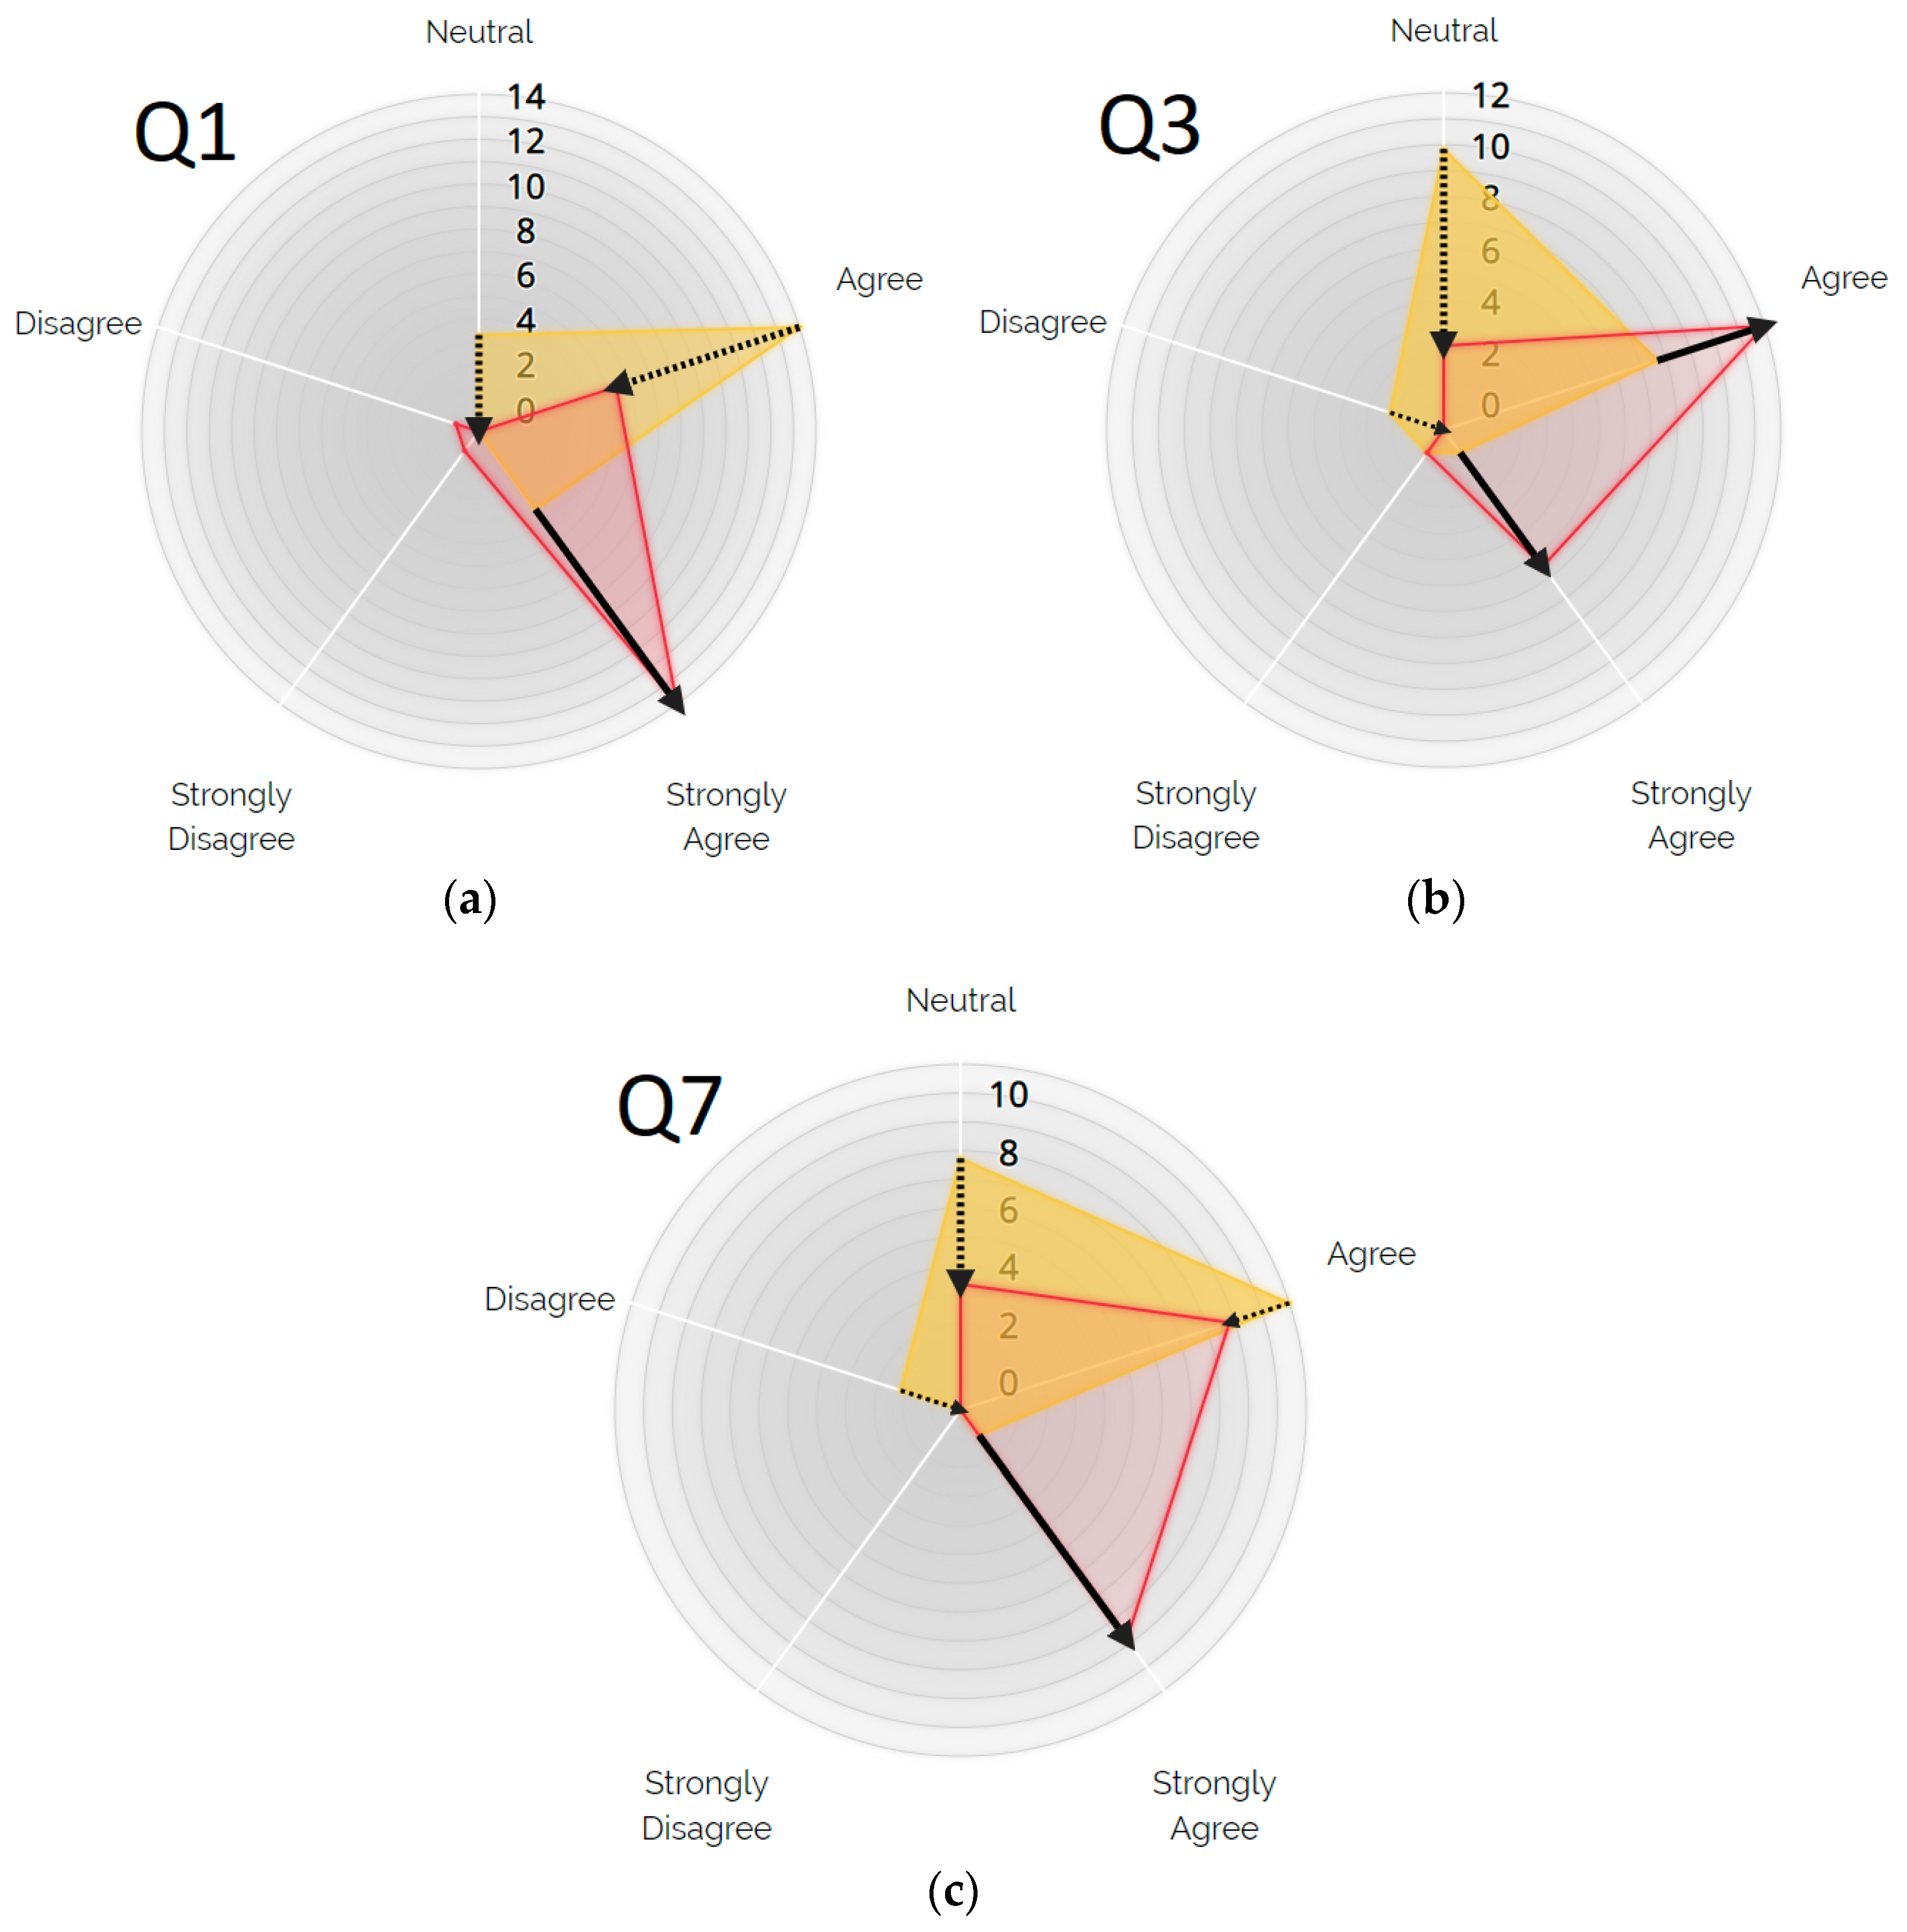
| Q1—A one in-a-hundred years rainfall event of 45 mm of water in one hour could cause serious flood problems in Millbrook (valid answer: true) | True | Increased Agreement |  | + (p = 0.05) |
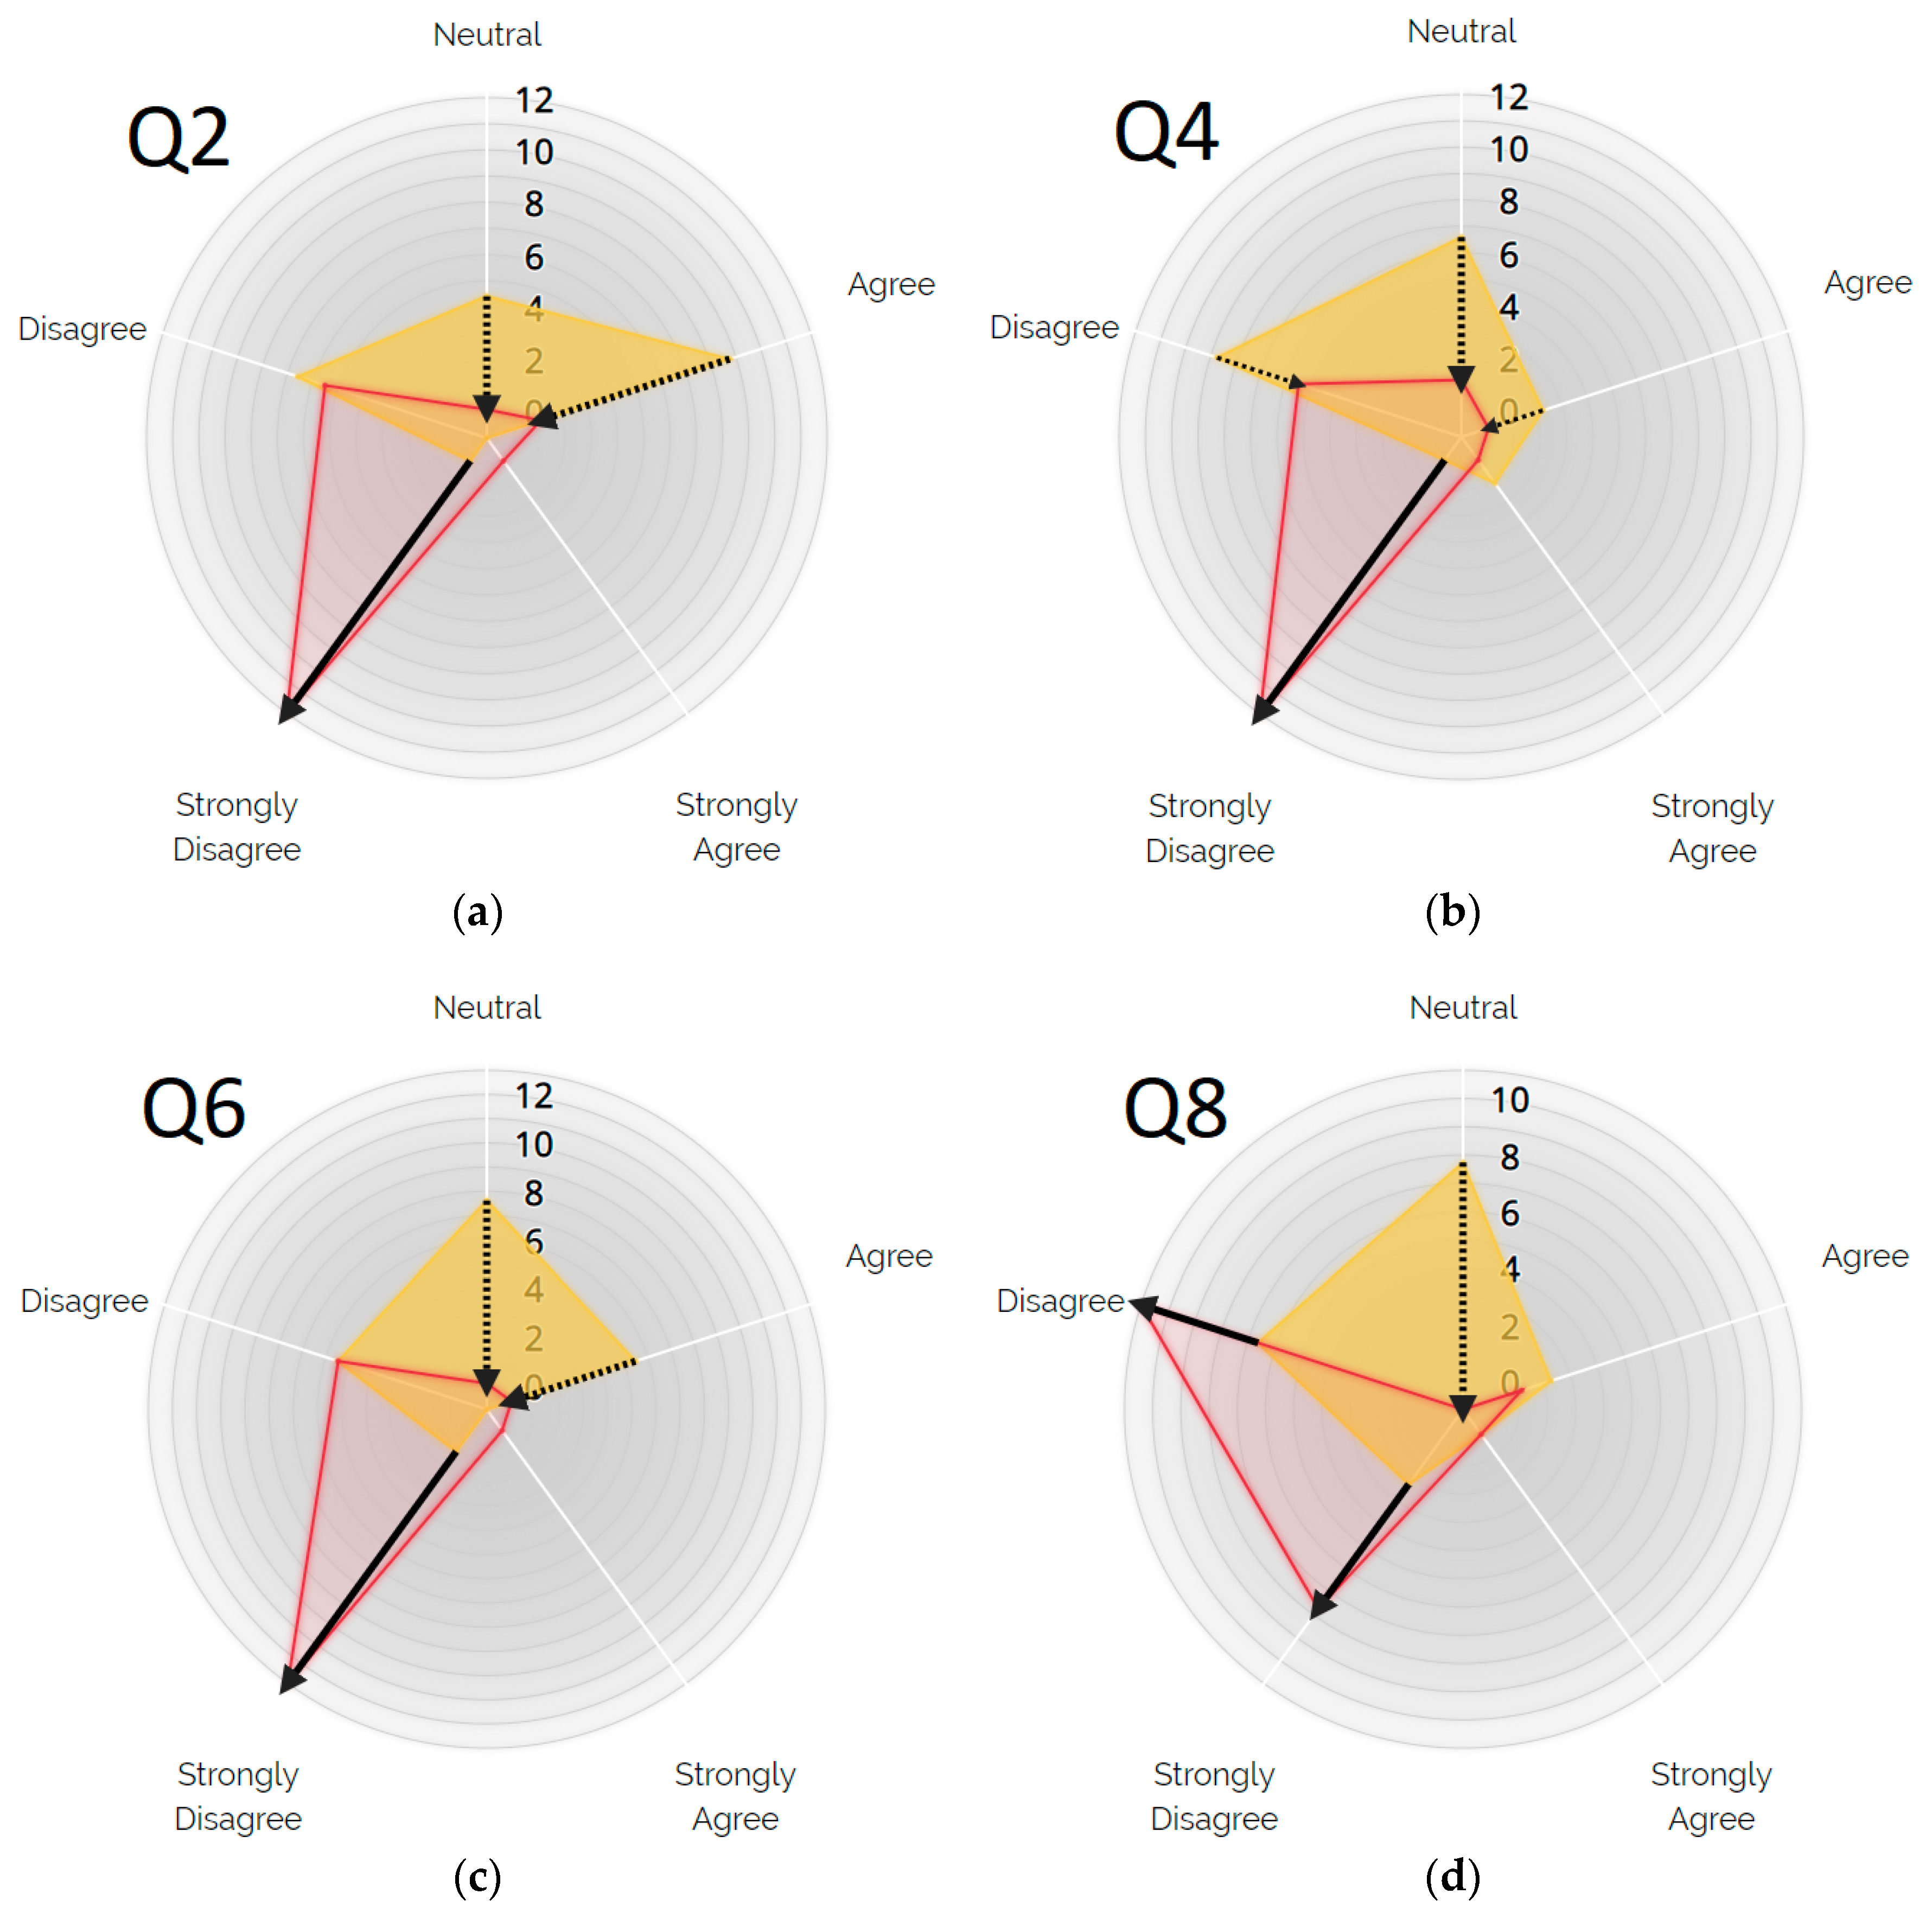
| Q2—Improving the village sewer infrastructure that directly drains excess water could result in neutralizing up to 90% of the flood resulting from such an event | False | Increased Disagreement |  | ++ (p = 0.01) |
| Q3—Improving farming practices that change the ground cover of the cultivated areas around the village could result in neutralizing up to 90% of the flood resulting from such an event | True | Increased Agreement | | ++ (p = 0.01) |
| Q4—Investing money in the sewer infrastructure gives a better result for your money when fighting against flood than trying to support different farming practice | False | Increased Disagreement | | ++ (p = 0.01) |
| Q6—Heavily grazed permanent pasture increases greatly the capacity of the soil to absorb water | False | Increased Disagreement | | ++ (p = 0.01) |
| Q7—Growing crops while minimizing tillage increases greatly the capacity of the soil to absorb water | True | Increased Agreement | | ++ (p = 0.01) |
| Q8—Intensive farming that compacts the ground and lowers the capacity of the soil to absorb water, remains the most profitable way to exploit a cultivated area | False | Increased Disagreement | | + (p = 0.05) |
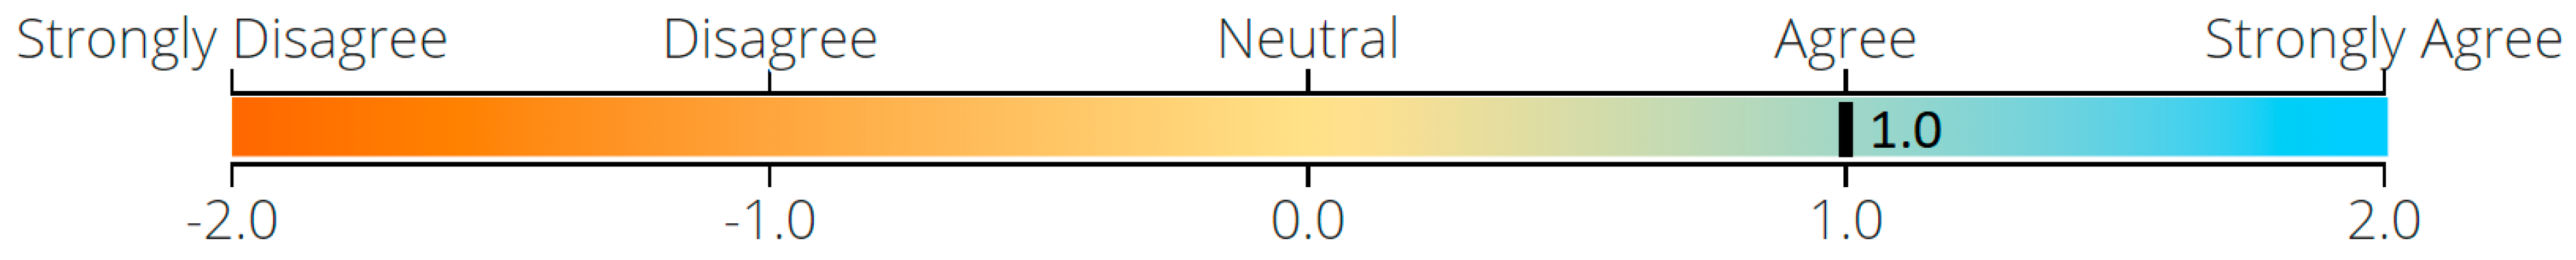
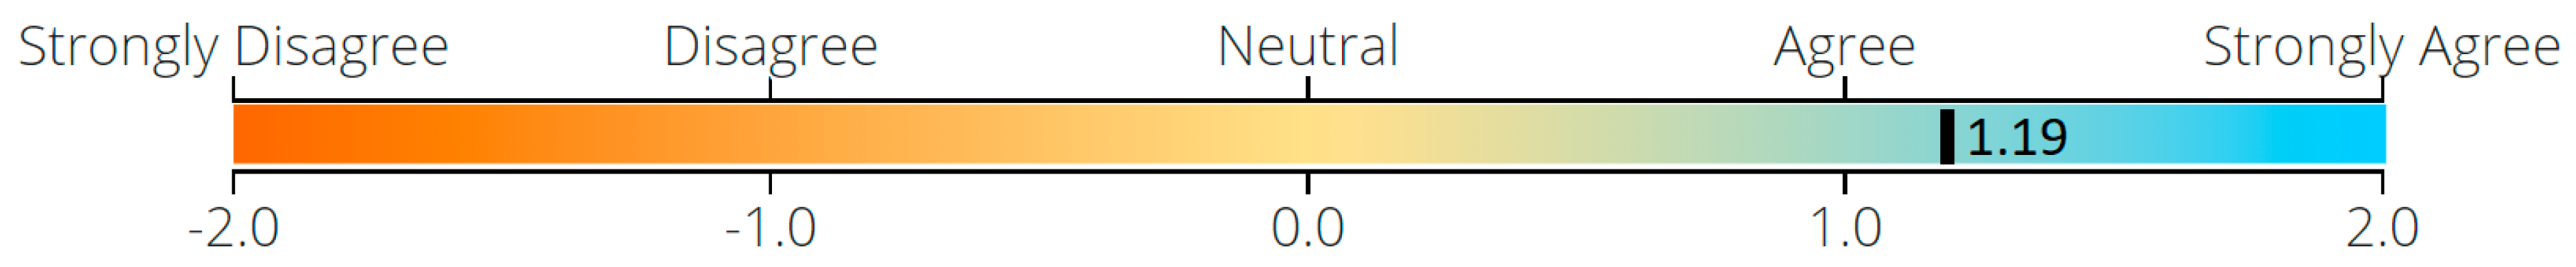
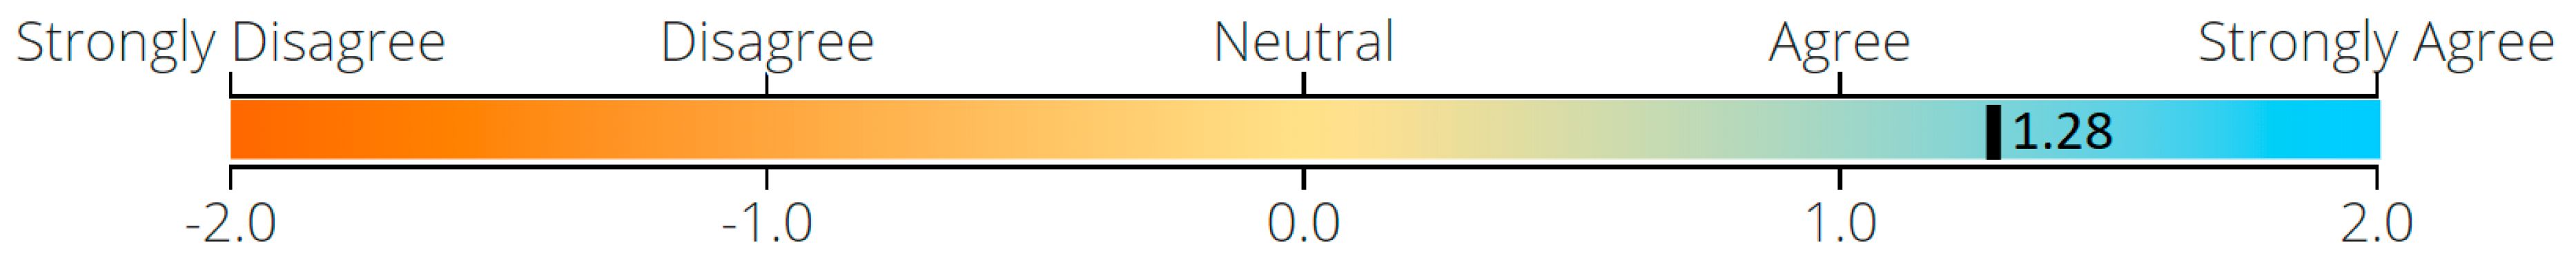
| Question | Shifting of Average Scores from Non-specialist to Domain Expert |
|---|---|
| Q1 |  |
| Q2 |  |
| Q3 |  |
| Q4 |  |
| Q6 |  |
| Q7 |  |
| Q8 |  |
© 2018 by the authors. Licensee MDPI, Basel, Switzerland. This article is an open access article distributed under the terms and conditions of the Creative Commons Attribution (CC BY) license (http://creativecommons.org/licenses/by/4.0/).
Share and Cite
Khoury, M.; Gibson, M.J.; Savic, D.; Chen, A.S.; Vamvakeridou-Lyroudia, L.; Langford, H.; Wigley, S. A Serious Game Designed to Explore and Understand the Complexities of Flood Mitigation Options in Urban–Rural Catchments. Water 2018, 10, 1885. https://doi.org/10.3390/w10121885
Khoury M, Gibson MJ, Savic D, Chen AS, Vamvakeridou-Lyroudia L, Langford H, Wigley S. A Serious Game Designed to Explore and Understand the Complexities of Flood Mitigation Options in Urban–Rural Catchments. Water. 2018; 10(12):1885. https://doi.org/10.3390/w10121885
Chicago/Turabian StyleKhoury, Mehdi, Michael J. Gibson, Dragan Savic, Albert S. Chen, Lydia Vamvakeridou-Lyroudia, Harry Langford, and Sarah Wigley. 2018. "A Serious Game Designed to Explore and Understand the Complexities of Flood Mitigation Options in Urban–Rural Catchments" Water 10, no. 12: 1885. https://doi.org/10.3390/w10121885
APA StyleKhoury, M., Gibson, M. J., Savic, D., Chen, A. S., Vamvakeridou-Lyroudia, L., Langford, H., & Wigley, S. (2018). A Serious Game Designed to Explore and Understand the Complexities of Flood Mitigation Options in Urban–Rural Catchments. Water, 10(12), 1885. https://doi.org/10.3390/w10121885