Article

Identification of Human and Animal Fecal Contamination in Drinking Water Sources in the Kathmandu Valley, Nepal, Using Host-Associated Bacteroidales Quantitative PCR Assays

1
Department of Natural, Biotic and Social Environment Engineering, University of Yamanashi, 4-3-11 Takeda, Kofu, Yamanashi 400-8511, Japan
2
Institute of Medicine, Tribhuvan University, Maharajgunj, Kathmandu P.O. Box 1524, Nepal
3
Division of Sustainable Energy and Environmental Engineering, Osaka University, 2-1 Yamadaoka, Suita, Osaka 565-0871, Japan
4
Department of Health Science, Kitasato University, 1-15-1 Kitasato, Minami-ku, Sagamihara, Kanagawa 252-0373, Japan
5
Department of Environmental Sciences, University of Yamanashi, 4-4-37 Takeda, Kofu, Yamanashi 400-8510, Japan
6
Interdisciplinary Center for River Basin Environment, University of Yamanashi, 4-3-11 Takeda, Kofu, Yamanashi 400-8511, Japan
*
Author to whom correspondence should be addressed.
Water 2018, 10(12), 1796; https://doi.org/10.3390/w10121796
Submission received: 28 September 2018 / Revised: 10 November 2018 / Accepted: 4 December 2018 / Published: 7 December 2018
(This article belongs to the Section Water Quality and Contamination)

Abstract

:
This study identified the sources of fecal contamination in the groundwater of different land covers. A total of 300 groundwater samples were collected in the Kathmandu Valley, Nepal, in the dry (n = 152) and wet (n = 148) seasons of 2016. Fecal indicator bacteria were initially enumerated, and then fecal contamination sources were identified using human (BacHum), ruminant (BacR), and pig-associated (Pig2Bac) Bacteroidales quantitative polymerase chain reaction assays. Sixty-six percent (197/300) of the tested groundwater samples had Escherichia coli concentrations higher than the World Health Organization threshold for drinking (<1 most probable number/100 mL). The fecal contamination of the groundwater was of human (22%, 55/250), ruminant (11%, 28/250), and pig (3%, 8/250) origin. Deep tube wells were less likely to be positive for E. coli and fecal markers compared to shallow dug wells. The human fecal marker was more likely to be detected in sources from built-up as compared to agricultural areas (Adjusted odds ratio (AOR) = 3.60, p = 0.002). Likewise, the ruminant fecal marker was more likely to be detected in sources from agricultural as compared to built-up areas (AOR = 2.90, p = 0.018). These findings suggest the preparation of mitigation strategies for controlling fecal pollution based on land cover and well types.

1. Introduction

Fecal pollution in water sources is a major concern for public health. Drinking water sources with fecal contamination may cause outbreaks of illness and economic degradation [1]. Groundwater is a major source for domestic water use, and fecal contamination has been widely reported in many developing countries [2,3,4,5,6], and appears to be a persistent problem [7]. High risks of diarrhea result from drinking enteropathogen-contaminated groundwater [8] and from consuming vegetables washed in contaminated groundwater [9]. Therefore, there is a need for better understanding of fecal contamination sources to prepare mitigation strategies for controlling fecal pollution.
Land use practices, particularly urbanization, likely elevate the fecal contamination of shallow well water, increasing the risk of diarrheal diseases [10]. Urbanization and agriculture can also substantially degrade water quality, causing eutrophication and fecal contamination [11,12]. The primary source of the fecal pollution of water sources may be the improper management of human waste, which is often coupled with leakage in sewer pipes, the improper construction of septic tanks, and the use of pit latrines, all of which dispose of human waste in the subsurface [13]. In some agricultural areas in Cambodia, animals have been found to be primary sources of the fecal pollution of water sources [3] and significant association of livestock ownership with drinking water contamination in Ghana and Bangladesh has been reported [14].
In developing countries, animal farming is less intensive compared to that in developed countries; waste management is mostly unpracticed, and non-point sources of fecal pollution appear to be predominant [3]. In addition, the use of raw animal waste as fertilizer on agricultural farms is a common practice [15]. Fecal contamination from animals was found to be more prevalent than human contamination in the domestic environment, including source and stored drinking water and soil in rural India and Bangladesh [16,17,18].
Fecal indicator bacteria (FIB), such as Escherichia coli and total coliforms, have been used as indicators for fecal contamination [19]. However, FIB do not provide information on the fecal pollution sources, such as human, ruminant, or pig feces [20]. The application of a microbial source tracking (MST) technique using host-associated Bacteroidales genetic markers can resolve this limitation by identifying and quantifying the sources of fecal pollution in environmental water samples [21,22,23,24,25]. The correct identification of the origin of fecal contamination is useful when preparing efficient management strategies for controlling fecal pollution, particularly in low-income countries where resources are limited.
Potential fecal sources in the Kathmandu Valley include the human and animal densities, farm animal waste, manure application and livestock grazing, and the poor management of wastewater treatment plants. However, information regarding the identification of sources and the distribution of human and animal fecal contamination for different land covers in the Kathmandu Valley is lacking. The land cover factor can be used as proxy for determining which fecal sources should constitute the focus on remediation, and it could be helpful for policy makers to formulate strategies for land cover management in order to improve the microbial quality of the groundwater sources.
In this study, we applied host-associated Bacteroidales quantitative polymerase chain reaction (qPCR) assays recently validated in Nepal [26] to assess human-, ruminant-, and pig-associated fecal contamination in drinking water sources. The validation of such assays is essential prior to their application because some assays are found to cross-react with the feces of non-target hosts, resulting in variations in the sensitivity and specificity of these assays in different geographical locations [27]. BacHum (human-associated) [28], BacR (ruminant-associated) [29], and Pig2Bac (pig-associated) [30] assays were validated as the best assays to track fecal sources in each host category, human, ruminant, and pig, respectively, in the valley [26]. However, in the Malla et al. (2018) study [26], a limited number of groundwater samples (n = 74) were tested to identify the fecal-source contamination, which did not allow a clear picture to emerge of the distributions of human and animal fecal contamination based on different land cover types.
The aims of this study are: (i) to determine the distributions and concentrations of FIB in drinking water sources; (ii) to identify and quantify host-associated fecal markers using the validated Bacteroidales qPCR assays; and (iii) to determine the potential distribution of fecal contamination in different groundwater sources and for different land covers in the valley. These results could help policy makers improve the microbial quality of the groundwater sources by implementing proper land cover management strategies. This study adds value to the limited use of MST in less developed countries by highlighting different dominant fecal contamination sources depending on land cover.

2. Materials and Methods

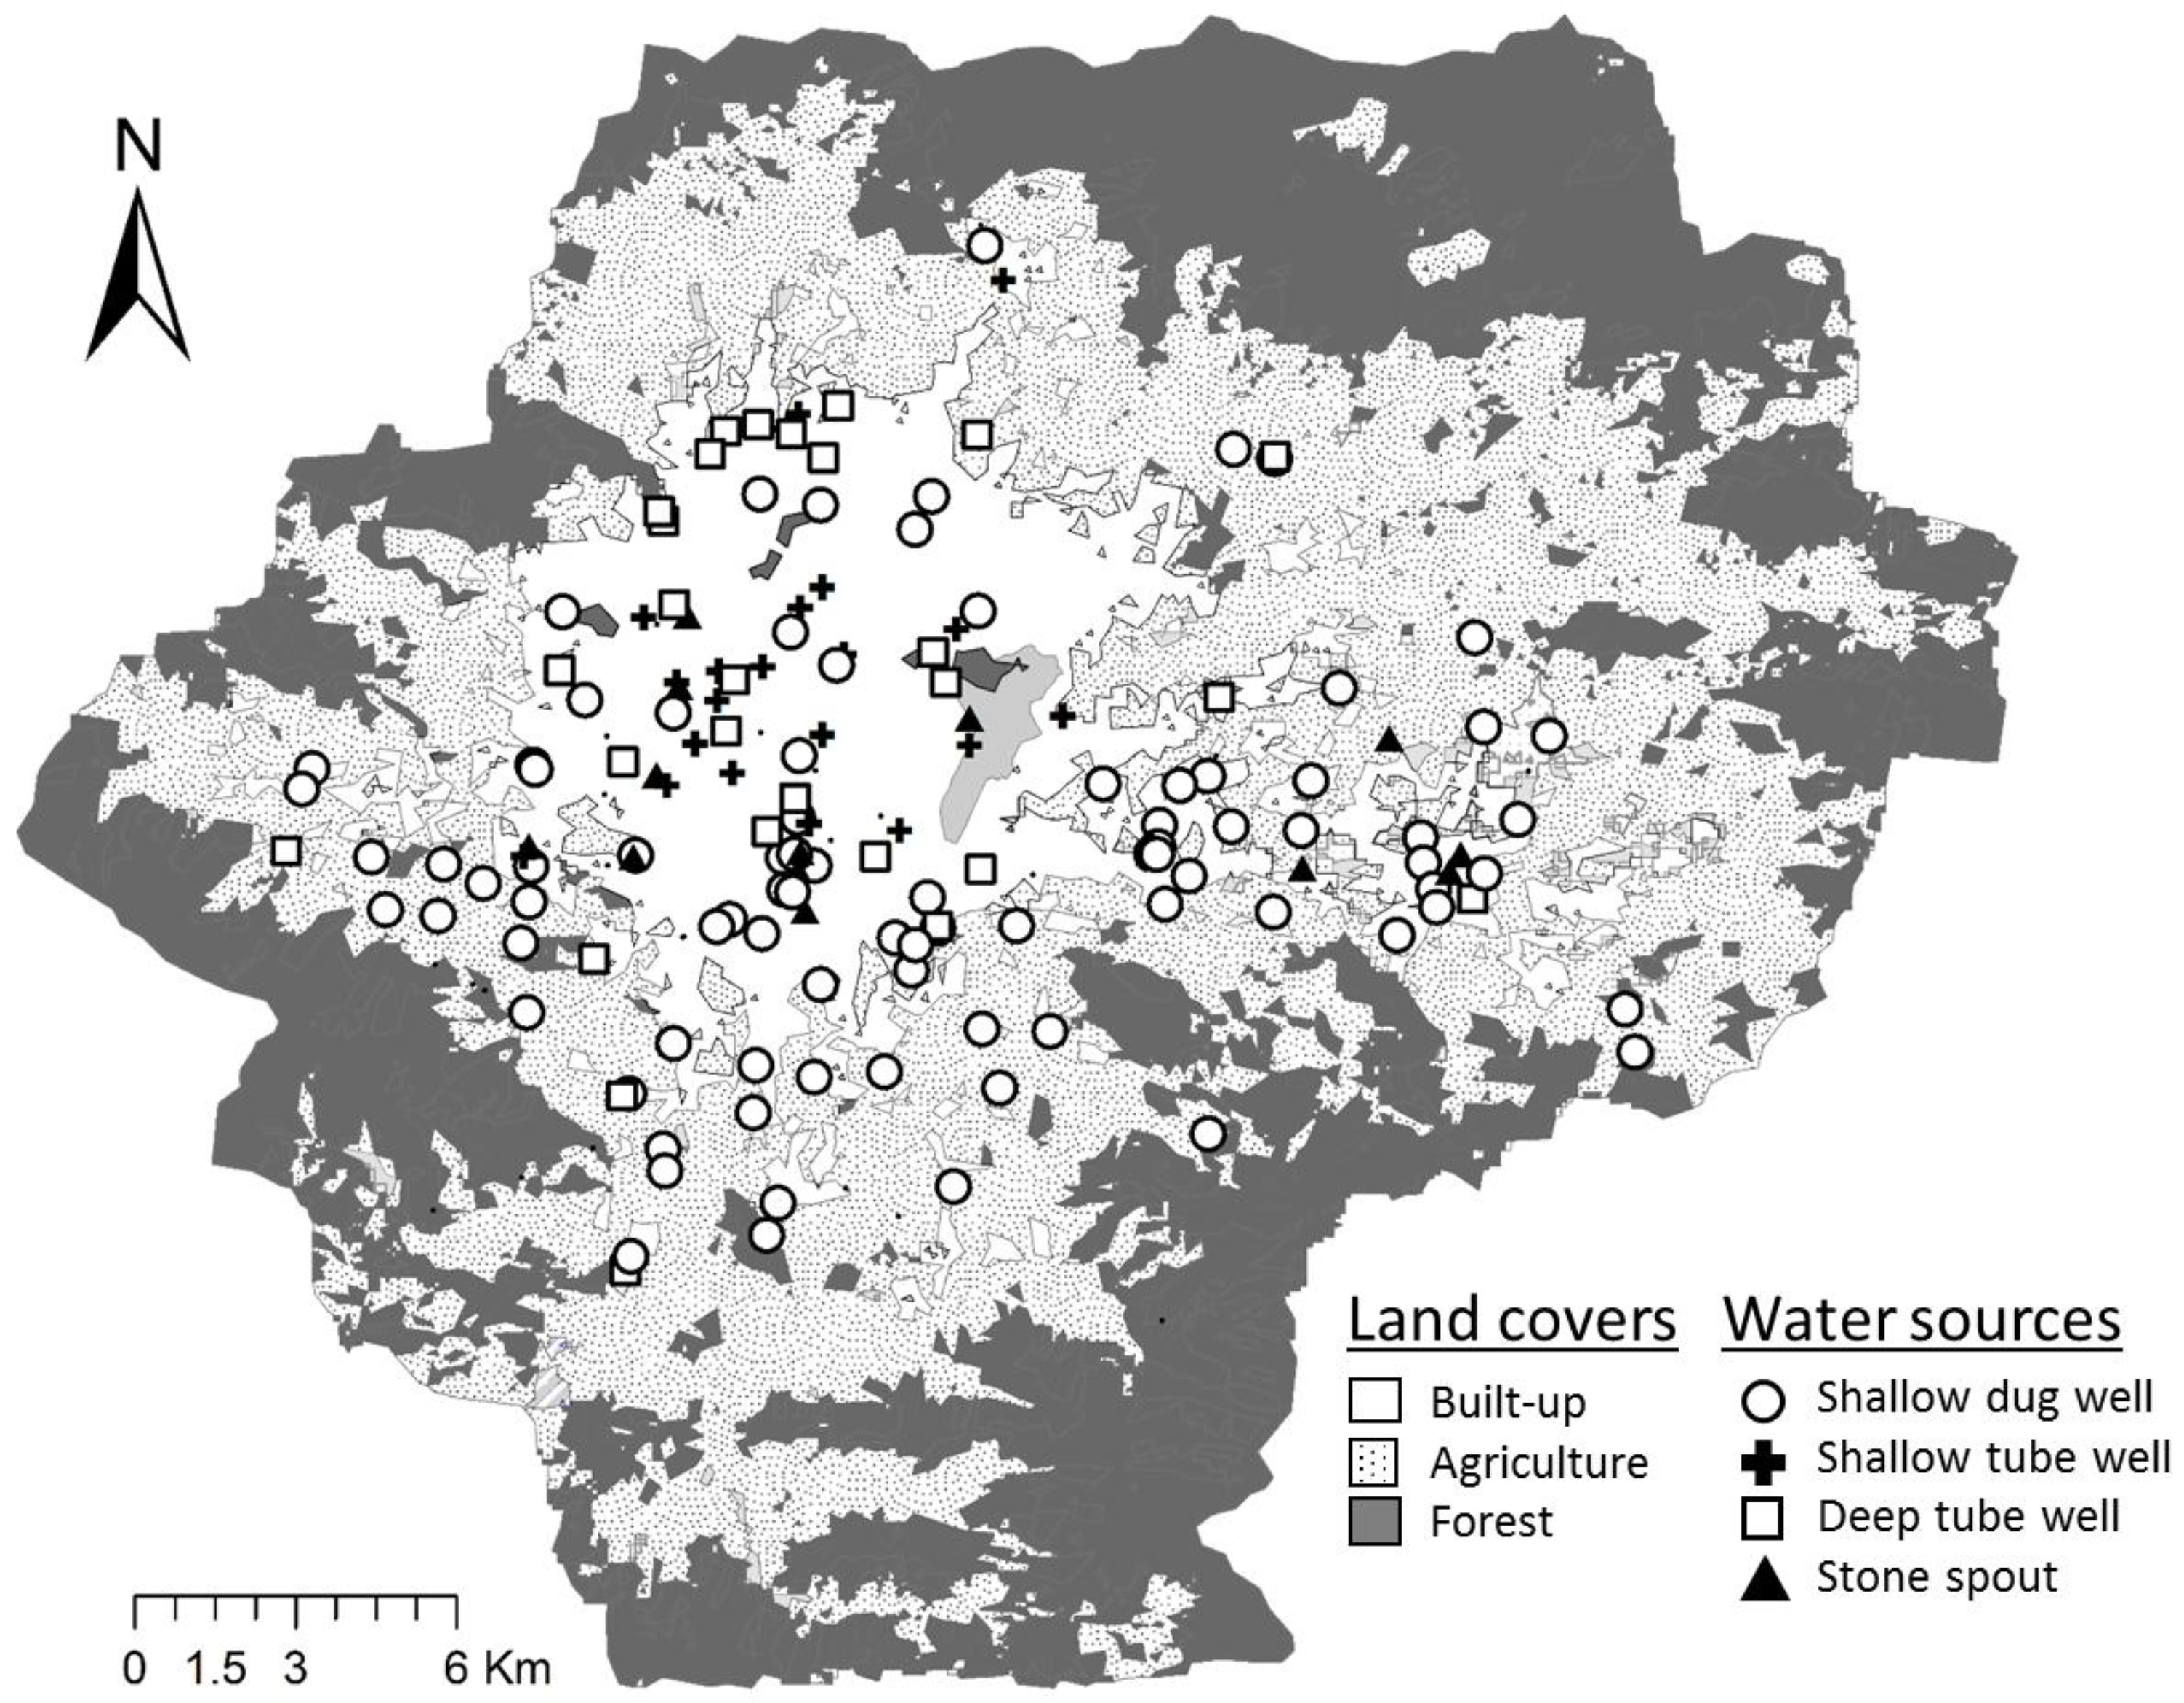
2.1. Study Site Description

The Kathmandu Valley, with an area of 664 km2 and a population of 2.51 million [31], primarily consists of three major land covers: built-up (116 km2), agriculture/open space (265 km2), and forest/shrub (215 km2) [32,33]. The land cover used in this study has been adapted from Uddin et al. (2015) [32]. The broad leaved open and closed forest, needle leaved open and closed forest, and shrub land are considered as forest; grassland and agriculture as agricultural areas; and built-up as built-up areas. A “built-up area” in this study is defined as area comprising densely populated city, whereas an “agricultural area” is defined as area comprising land with crop and vegetable farming activities [34]. Kathmandu Upatyaka Khanepani Limited is the only organization that supplies piped water in the valley, tapping water from the surface and groundwater [35]. However, there is a high supply deficit, with a current average supply of 107 million liters per day (MLD) serving a demand of 415 MLD [35]. Because of this, for drinking and domestic purposes, 52% of households depend on groundwater sources [36] in which the contamination of pathogens has been reported [5,8,37,38]. In the valley, the populations of animals such as cattle (ruminant) and pigs are 157,900 and 21,000, respectively [39]. The sanitation coverage in urban Nepal was 91% in 2011 and the percentage of households with toilets was 98% in 2012 in the valley [40].

2.2. Collection of Water Samples

In this study, four different groundwater source types were accessed for random sampling to distribute the sampling sites uniformly in the Kathmandu Valley (Figure 1). In the dry season (February and March 2016), a total of 152 groundwater sources were collected: shallow dug wells (n = 94), shallow tube wells (n = 23), deep tube wells (n = 25), and stone spouts (n = 10). Out of 152 groundwater sources collected in dry season, 127 could be accessed in wet season (August, 2016), and 21 new groundwater sources were accessed additionally: shallow dug wells (n = 87), shallow tube wells (n = 22), deep tube wells (n = 25), and stone spouts (n = 14). The water sources mostly used by the community people were selected to cover a large number of population using them. The depth of shallow wells was below 50 m, and those of deep wells was above 50 m from the ground surface. Altogether, 300 groundwater samples (200 mL each) were collected in this study. According to land cover, 207 samples (ndry season = 106; nwet season = 101) fell in built-up and 93 (ndry season = 46; nwet season = 47) in agricultural areas. The water samples were collected in two autoclaved 100-mL plastic bottles, which had been thoroughly washed and rinsed with ultrapure water prior to autoclaving, stored in an icebox, and transported to the laboratory as soon as possible. Before collecting the sample, the bottles were rinsed several times with water from the source. The tube wells were flushed by pumping five times before collecting the water samples.

2.3. Detection of E. coli and Total Coliforms

The concentrations of E. coli and total coliforms in the water samples were quantified using the Colilert method (IDEXX Laboratories, Westbrook, ME, USA) following the manufacturer’s protocol, as described previously [37].

2.4. Bacterial DNA Extraction

A disposable filter unit preset with a nitrocellulose membrane (diameter, 47 mm; pore size, 0.22 µm; Nalgene, Tokyo, Japan) was used to filter 100 mL of each water sample. A solution-based extraction using a CicaGeneus DNA Extraction Reagent (Kanto Chemical, Tokyo, Japan) was used to extract bacterial DNA from the water sample, as described previously [37], with a slight modification. The membrane filter was transferred into a 50-mL tube, and 5 mL of Tris-EDTA buffer (pH 7.4) was added, followed by shaking and vortex mixing steps at 50 °C with a speed of 300 rpm to resuspend the sample. In this study, 160 µL of the resuspended sample, 20 µL of Buffer A, and 200 µL of Buffer B were used to obtain a final volume of extracted DNA of 300 μL.

2.5. Application of the Selected Assays to the Fecal-Source Identification

The BacHum, BacR, and Pig2Bac assays were used as human-, ruminant-, and pig-associated fecal markers to identify the sources of fecal contamination in the water samples (n = 250). The applicability of these assays to the Kathmandu Valley was validated in our previous study using target and non-target fecal-source samples [26]. All three assays had a sensitivity of 100%, while specificities were 77%, 88%, and 75% for BacHum, BacR, and Pig2Bac assays, respectively. For the purpose of identification of possible fecal contamination sources in water samples, 250 water samples were selected out of 300 samples based on the E. coli concentration, location, season, and source type. When two water samples of the same source type in the same season and similar location had comparable E. coli concentrations, only one sample was selected. For qPCR, the primer and probe concentrations and temperature protocol were changed from the original publications [28,29,30]. A qPCR mixture and the thermal condition were similar to those of a previous validation study [26]. A final qPCR mixture of 25 µL was prepared by mixing 12.5 µL of the Probe qPCR Mix (Takara Bio, Kusatsu, Japan), 10.0 pmol each of the forward and reverse primers, 5.0 pmol of the TaqMan (MGB) probe, 7.0 µL of PCR-grade water, and 2.5 µL of the template DNA. Marker amplifications were performed using a Thermal Cycler Dice Real Time System TP800 (Takara Bio) with thermal cycle conditions as follows: 95 °C for 30 s, followed by 45 cycles at 95 °C for 5 s, and 60 °C for 30 s. Six 10-fold serial dilutions of artificially-synthesized plasmid DNA were used as standard samples. A negative control was included to check if any contamination occurred during each run. All qPCR runs were performed in duplicate. The lowest concentration of the standard plasmid DNA that was amplified was considered as an assay’s limit of quantification (LOQ). A cycle threshold (Ct) value of 40 was set as a cutoff point, and the sample with a Ct value of <40 was judged positive. The sample between the LOQ and a Ct value of 40 was considered as detected but not quantifiable (DNQ). The average efficiencies of standard curves of BacHum, Pig2Bac, and BacR assays were 98 ± 15%, 105 ± 8%, and 106 ± 7%, respectively. The LOQ values of BacHum, Pig2Bac, and BacR assays were 5.01, 4.28, and 3.82 log copies/100 mL of water sample, respectively.

2.6. Statistical Analysis

For comparison of the concentrations of E. coli between water source types, a one-way analysis of variance (ANOVA) was used for the statistical analysis. The samples below the detection limit were imputed with a one-tenth value of limit of detection (1 most probable number (MPN) per 100 mL for E. coli), as mentioned previously [41,42]. The associations of the water source types and land cover with the E. coli concentrations were examined by the multiple linear regression model Equation (1). Similarly, the multiple logistic regression models Equation (2) were used to examine the associations of the water source types and land cover with the detection of fecal markers, separately. The detection ratios of pig fecal markers between two land covers were compared using Fisher exact test due to limited number of samples. In order to identify association of the water source types and land cover with the E. coli concentrations and the detection of the fecal markers, generalized estimation equation (GEE) models were used which will control the dependency of observation for samples that were repeatedly collected in dry and wet seasons. Since shallow dug wells were the prevalent source, the associations of land cover with the E. coli concentrations and with the detection of the fecal markers were examined using multiple linear and logistic regression models, respectively. p < 0.05 was considered significant in all analyses. SPSS version 23 (IBM Corporation, Armonk, USA) was used for the statistical analyses.
Y* = b0 + b1X1 + b2X2 + ……+ bpXp
where, Y* is the predicted value of the dependent variable, X1 through Xp are p distinct independent or predictor variables, b0 through bp are the estimated regression coefficients.
p^ = exp (b0 + b1X1 + b2X2 + ……+ bpXp)/1 + exp (b0 + b1X1 + b2X2 + ……+ bpXp)
where, p^ is the expected probability that the outcome is present, X1 through Xp are p distinct independent variables, b0 through bp are the regression coefficients.

3. Results

3.1. Detection of FIB and Host-Associated Bacteroidales Genetic Markers

The results of the detection of E. coli and total coliforms in the groundwater samples are shown in Table 1. E. coli and total coliforms were detected in 66% (197/300) and 94% (282/300) of the groundwater samples, respectively. The concentrations of E. coli and total coliforms had value ranges of <0.00–5.38 log MPN/100 mL and <0.00–7.08 log MPN/100 mL, respectively.
Table 2 shows the results of the detection of fecal markers in the groundwater samples. At least one of the three Bacteroidales genetic markers tested was detected in every source type (shallow dug and tube wells, deep tube well, and stone spout): the detection ratios of human, ruminant, and pig fecal markers were 22% (55/250), 11% (28/250), and 3% (8/250), respectively. Of the 250 water samples tested, total coliforms, E. coli, and at least one of the three fecal markers were detected in 96%, 78%, and 33% of the samples, respectively. Human and ruminant mixed fecal markers were detected in four, human and pig mixed fecal markers in two, and ruminant and pig mixed fecal markers in two water samples. The concentrations of ruminant-, human-, and pig-associated fecal markers were in the ranges of 4.25–7.81, 5.01–7.17, and 4.39–5.77 log copies/100 mL, respectively.
Water samples from 127 sampling sites were collected consecutively in both seasons for the analysis of FIB. Microbial source tracking using host-associated fecal markers was performed in 86 sites of the total 127 repeated sampling sites. Of these samples, 114 (90%), 66 (52%), and 18 (21%) sites were contaminated by total coliforms, E. coli, and at least one fecal marker in both seasons, respectively, indicating consistent fecal contamination. A total of 12% (8/68) of the shallow dug well sites were contaminated consistently by human fecal markers, and 6% (4/68) were consistently contaminated by ruminant fecal markers. None of the groundwater samples were contaminated with all three of the fecal markers.

3.2. Comparison of FIB and Fecal Markers between Water Source Types

E. coli was detected in every water source type (shallow dug well, shallow tube well, deep tube well, and stone spout) tested in this study, with the detection ratios of 82% (149/181), 75% (18/24), 34% (17/50), and 29% (13/45) in shallow dug wells, stone spouts, deep tube wells, and shallow tube wells, respectively (Table 1).
Table 2 shows the detection ratio of human, ruminant, and pig fecal markers in different source types. All three fecal markers were detected in each source type, except for stone spouts, in which only human and ruminant fecal markers were detected. Human fecal markers were detected in 33% (7/21) of stone spouts, 24% (40/166) of shallow dug wells, 18% (6/33) of shallow tube wells, and 7% (2/30) of deep tube wells (Table 2). Likewise, 14% (3/21) of stone spouts, 13% (21/166) of shallow dug wells, 10% (3/30) of deep tube wells, and 3% (1/33) of shallow tube wells were contaminated with ruminant fecal markers. Pig fecal markers were detected in 6% (2/33) of shallow tube wells, 3% (5/166) of shallow dug wells, and 3% (1/30) of deep tube wells but not in stone spouts. The detection ratios of at least one fecal marker were 48% (10/21), 36% (59/166), 24% (8/33), and 17% (5/30) in stone spouts, shallow dug wells, shallow tube wells, and deep tube wells, respectively (Table 2).
In order to compare the level of contamination among the different source types, ANOVA was carried out to compare the mean concentration of E. coli. Shallow dug wells (1.61 ± 1.59 log MPN/100 mL) had significantly higher concentration compared to that in shallow tube wells (−0.22 ± 1.40 log MPN/100 mL) (ANOVA, p < 0.001) and deep tube wells (−0.17 ± 1.35 log MPN/100 mL) (ANOVA, p < 0.001). Likewise, stone spouts (1.34 ± 1.80 log MPN/100 mL) had significantly higher concentration than that in shallow tube wells (ANOVA, p < 0.001) and deep tube wells (ANOVA, p = 0.001). On the other hand, there was no significant difference in the concentrations between shallow dug wells and stone spouts (ANOVA, p = 0.855) and between shallow tube wells and deep tube wells (ANOVA, p = 0.999) (Table 1). These results suggest lower contamination in both types of tube wells compared to shallow dug wells and stone spouts.
For further analysis, a multiple linear regression analysis was used to examine the association between source types and E. coli concentration and three separate multiple logistic regression models were used to examine the association between source types and human, ruminant, and at least one fecal marker while controlling for land cover and season (Table 3). Considering shallow dug wells as prevalent and highly polluted among different sources, they have been kept as a reference source in multiple logistic regression analysis. Shallow tube wells (unstandardized beta coefficient (β) = −1.44, 95% confidence interval (CI) = −2.16 – (−0.73), p < 0.001) and deep tube wells (β = −1.43, 95% CI = −2.13 – (−0.73), p = 0.001) were negatively associated with E. coli concentration, but not shallow dug wells. Both shallow tube wells and stone spouts did not show significant difference from shallow dug wells in terms of detection of markers. When analyzing repeated samples using GEE, shallow tube wells (β = −1.81, 95% CI = −2.74 – 0.89, p < 0.001) and deep tube wells (β = −1.64, 95% CI = −2.58 – (−0.71), p = 0.001) were negatively associated with E. coli concentration but not shallow dug wells. Similar to the previous results of multiple logistic regression analysis, deep tube wells were significantly less likely to be E. coli, human fecal marker, and at least one fecal marker positive compared to shallow dug wells (Table 3). These results from several analyses suggest that the tube wells could be a safer source type compared to shallow dug wells and stone spouts.

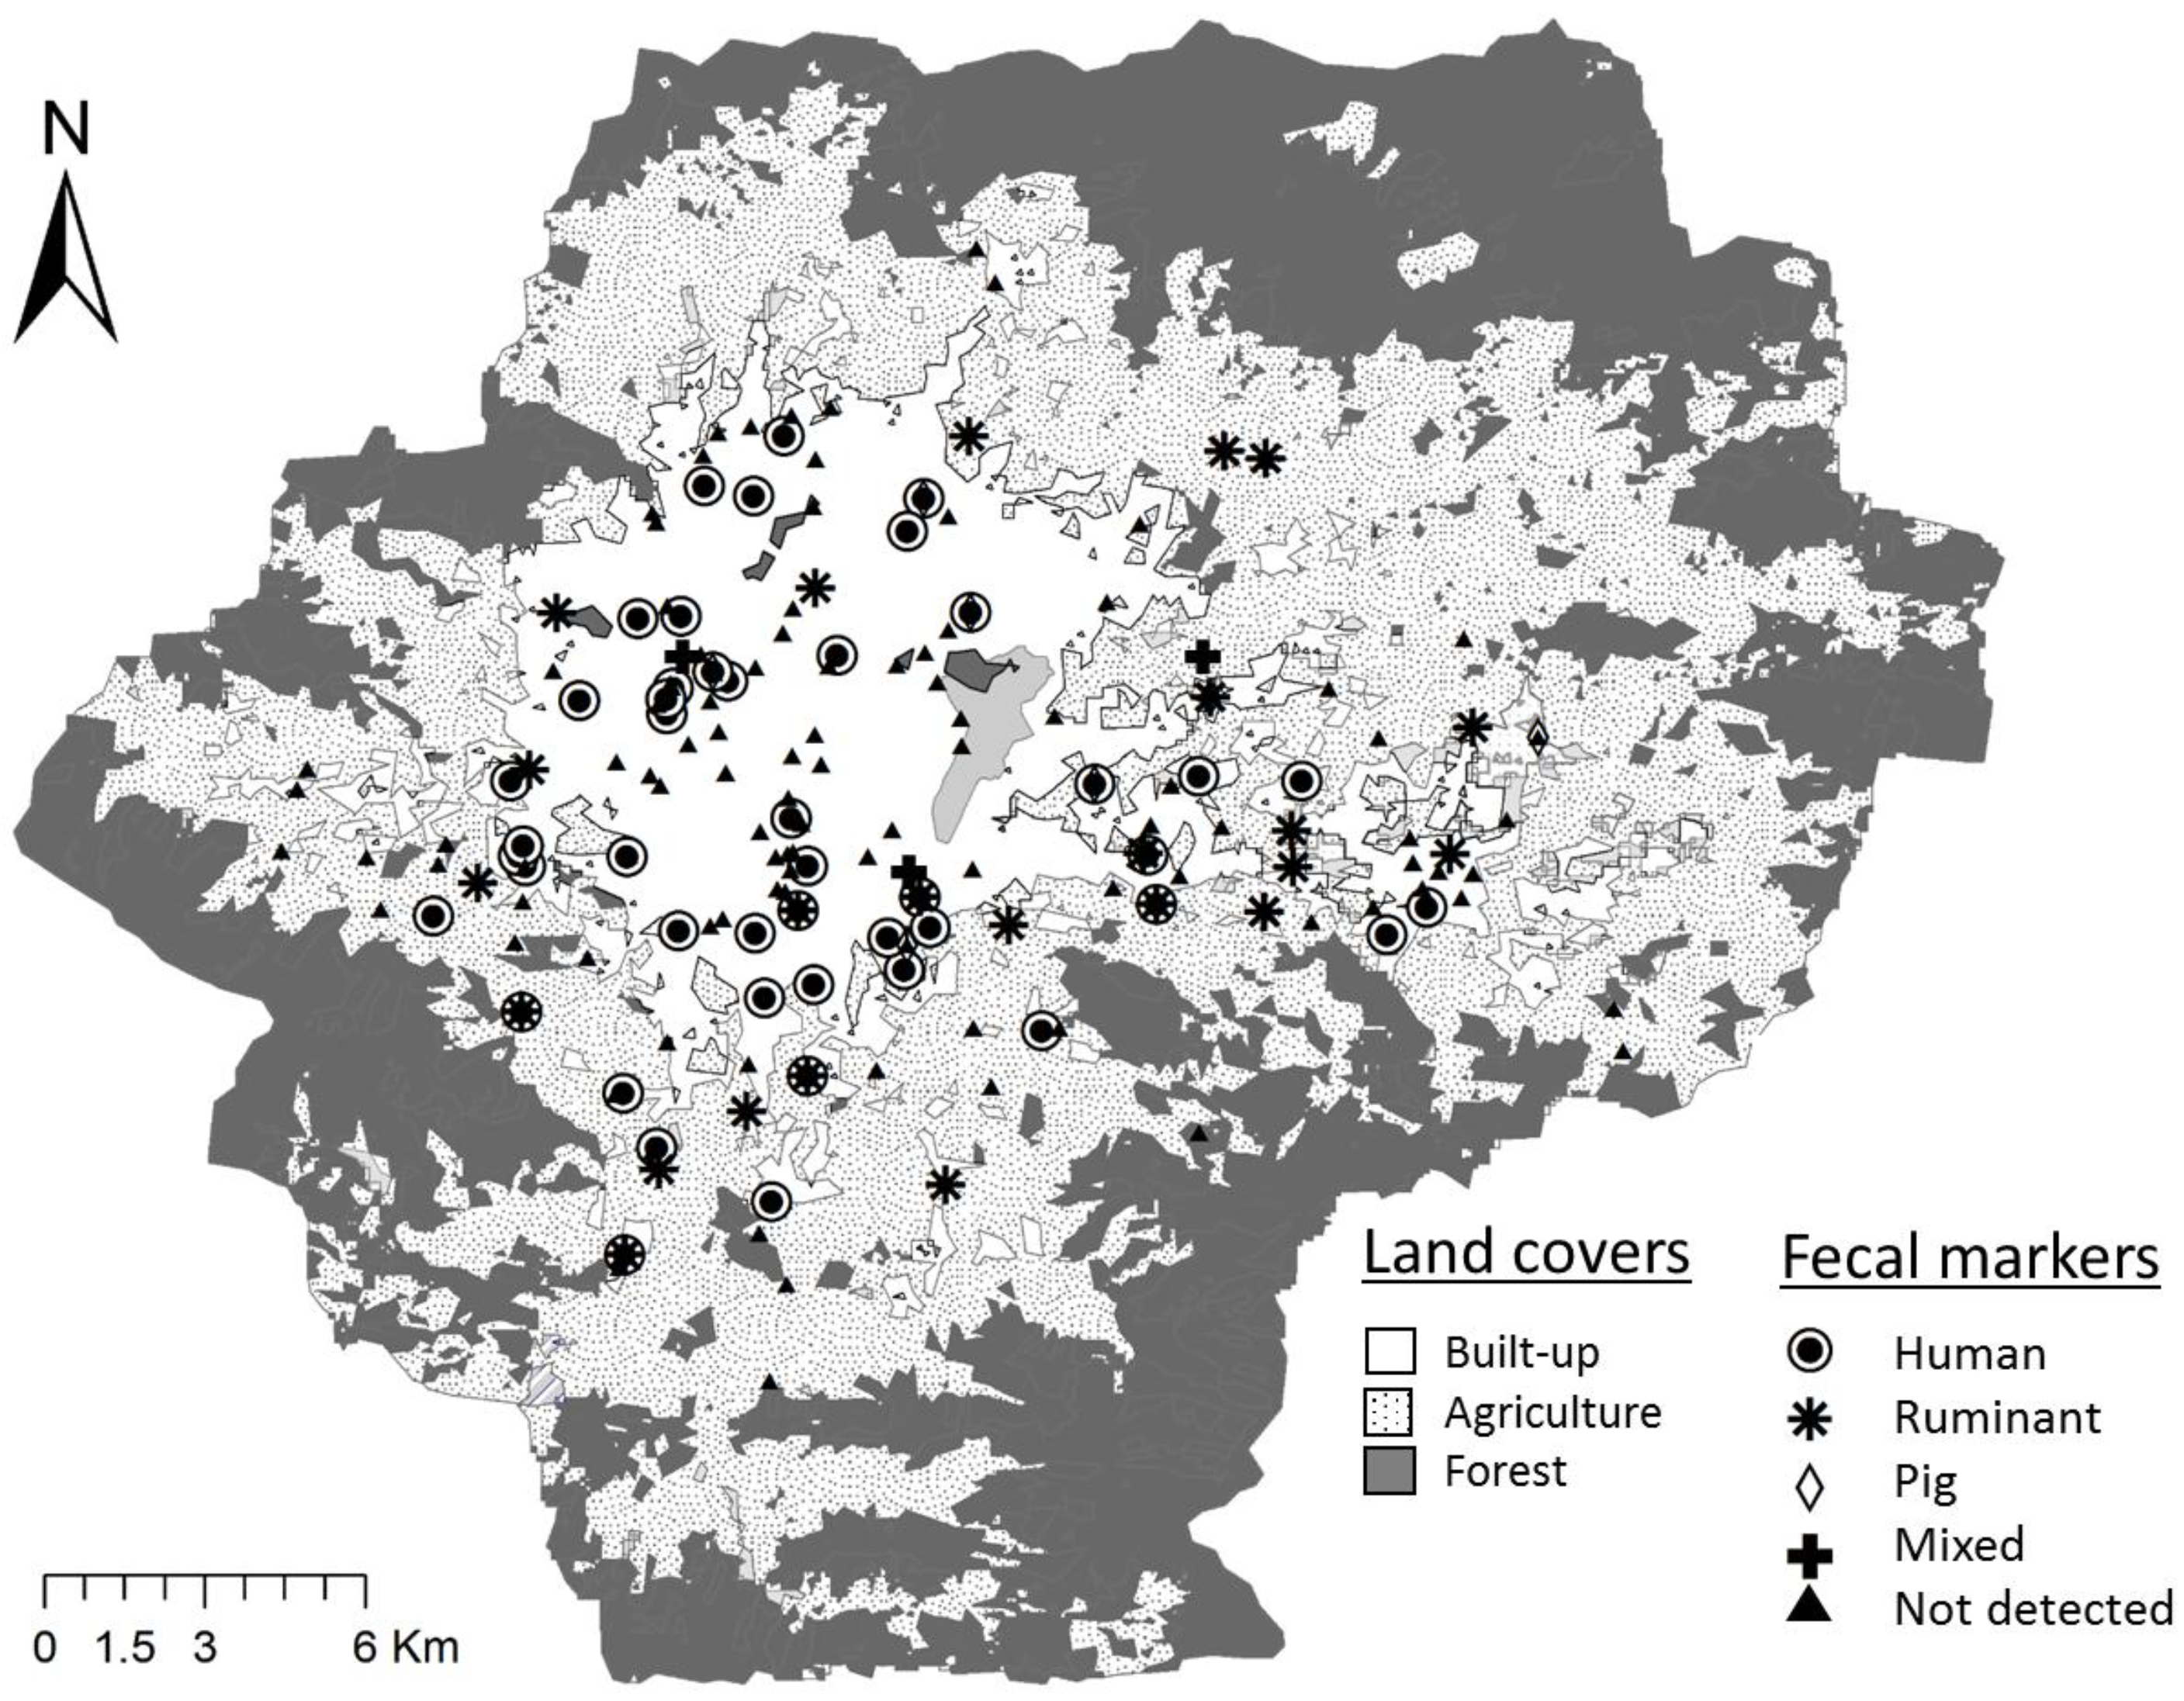
3.3. Comparison of FIB and Fecal Markers between Land Covers

Built-up and agricultural areas were the two land cover types considered in this study based on the dominance of either human or agricultural activities. The detection ratios of E. coli in agricultural and built-up areas were 82% (76/93) and 58% (121/207), with mean concentrations of 1.57 ± 1.60 log MPN/100 mL and 0.77 ± 1.77 log MPN/100 mL, respectively. The distribution of fecal markers in different land covers is shown in Figure 2. At least one fecal marker was detected in 35% (57/165) and 29% (25/85) of samples in built-up and agricultural areas, respectively.
The results of four separate multiple regression models, as mentioned in earlier section, were further used for explaining the association between land cover and detection of E. coli, human, ruminant, and at least one fecal marker while controlling for source types and season (Table 3). Human fecal marker detection was significantly higher in built-up (27%, 45/165) compared to agricultural areas (12%, 10/85) (AOR = 3.60, 95% CI = 1.63–7.92, p = 0.002), whereas ruminant fecal marker detection was significantly higher in agricultural areas (19%, 16/85) compared to that in built-up areas (7%, 12/165) (AOR = 2.90, 95% CI = 1.20–7.02, p = 0.018). However, the detection ratio of pig fecal markers in built-up areas (4%, 45/165) was not significantly different from that in agricultural areas (2%, 2/85) (Fisher exact test, p = 0.720). While performing four separate GEE models on repeated samples, agricultural areas were significantly less likely to be positive for the human fecal marker compared to built-up areas (AOR = 0.32, 95% CI = 0.12–0.83, p = 0.019).
Shallow dug wells being the predominant source type in both land covers, multiple linear and logistic regression models were used to analyze the association between land cover and concentration of E. coli and the detection of fecal markers, respectively, while controlling for season. Land cover was not significantly associated with E coli concentration (β = −0.20, 95% CI = −0.60 – 0.21, p = 0.340); however, built-up areas were significantly more likely to be human marker positive (AOR = 3.63, 95% CI = 1.51–7.50, p = 0.003), whereas agricultural areas were significantly more likely to be ruminant marker positive (AOR = 2.70, 95% CI = 1.02–7.14, p = 0.045).

3.4. Relationship between E. coli and Fecal Markers

Percentile values (0.25, 0.50, and 0.75) were used to identify three cut points in the E. coli concentration to divide the entire dataset equally into four categories to observe the general trend between E. coli concentration and the detection ratios of fecal markers (Table 4). The result showed that the detection ratios of human and ruminant fecal markers seemed to be increased as the concentration of E. coli increased. In the category with the highest E. coli concentration (>2.7 log MPN/100 mL), 61% (38/62) of the samples tested positive for at least one type of fecal marker. However, fecal markers were detected even in E. coli-negative samples (23%, 13/56).

4. Discussion

Protecting groundwater sources from fecal contamination is essential, because they are important sources of water for households for drinking and domestic purposes [36,43]. However, it is very challenging to identify the exact source and primary mechanism that introduced the human and animal fecal contamination into the water sources when there are multiple sources, which makes it difficult to predict the health risk to humans and to control or improve the water quality. In this study, we examined the abundance and distribution of FIB and host-associated Bacteroidales genetic markers to evaluate the distribution of human and animal fecal contamination in groundwater sources of different land covers in the Kathmandu Valley.
The E. coli levels exceeded the World Health Organization guideline value for drinking (<1 MPN/100 mL) in 66% of the tested groundwater samples, which indicates the unsuitability of the groundwater for drinking purposes [44]. However, FIB do not provide information on the contamination sources. In this study, we used human-, ruminant-, and pig-associated Bacteroidales genetic markers to identify the fecal pollution sources. The detection ratio of human fecal markers was the highest of the host-associated markers tested in spite of high sanitation coverage (91%) and high percentage of households with toilets (98%) in the valley [40]. However, water sources contaminated with animal feces also pose health risk because animal feces carry microorganisms infectious to human, such as pathogenic E. coli, Campylobacter, and Salmonella [45]. In a developing country such as Nepal, mixed crop-livestock farming is practiced [14] and the use of animal feces, primarily ruminant and chicken, as fertilizer is common, which may explain the detection of ruminant fecal markers in the groundwater sources in this study. A study done in Bangladesh [46] has reported an association of animal and animal feces with domestic fecal contamination. Pig farms were mainly spotted near the banks of the rivers at the time of fecal sample collection for the validation study [26], and the practice of using pig feces as fertilizer is not very common in the valley. In addition to this, the population of pigs is 7.5 times less than that of cattle [39]. This could explain the relatively low prevalence of pig fecal markers in the tested groundwater sources. Haramoto (2018) [24] has also reported the detection of human, ruminant, and pig fecal markers in the shallow groundwater sources in the valley. Detections of animal fecal markers in the water sources indicate high risks of exposure to animal feces and zoonotic pathogens, which can be detrimental to human health [47]. Diarrhea has been reported to be associated with human and animal fecal markers in the domestic environment in rural India [18]. In the current study, the concentrations of human-associated fecal marker (BacHum) in the groundwater samples ranged from 5.01 to 7.17 log copies/100 mL, which exceeded the human marker concentration thresholds for gastrointestinal illness established by Boehm et al. (2015) (3.45 log copies/100 mL for HumM2 and 3.62 log copies/100 mL for HF183) [48] and Ahmed et al. (2018) (3.51 log copies/100 mL for HF183) [49]. This indicated the possibility of higher human health risk when using the groundwater sources in the study area. The detections of at least one fecal marker in 21% of the sampling sites and of the human fecal marker in 12% of the sampling sites in both seasons indicate consistent contamination, which could be minimized if a detailed investigation is conducted.
Comparing the water source types, the probabilities of the detection of E. coli and fecal markers were found to be significantly higher in shallow dug wells and stone spouts compared to tube wells. These findings indicated that tube well sources are safer than shallow dug wells and stone spouts. An Indian study has also reported less frequent detections of the same human fecal marker in deep tube wells [16]. Their construction and well depths might make shallow dug wells and stone spouts more vulnerable to contamination compared to both types of tube wells. Deep tube wells are expensive to construct; therefore, inexpensive shallow wells are widely used, which results in large populations being vulnerable to potential hazards [13].
In this study, the dominance of host-associated Bacteroidales genetic markers revealed a pattern which was in accordance with the land cover type. While applying several statistical approaches in this study, human fecal markers were significantly more likely to be detected in built-up areas compared to agricultural areas. This could be due to relatively higher population density in built-up areas than in agricultural areas. The population densities in areas within built-up land cover varied from 6000–118,000 persons/km2, while in areas of agriculture land cover, they varied from 2000–5000 persons/km2 in the study area [31]. High population density coupled with poor sanitation infrastructures such as improperly designed septic tanks [50], leaky sewerage systems [51], partially functional or completely non-functional wastewater treatment plants [52] could have resulted in the dominance of human fecal markers in built-up areas. Improper solid waste management in the built-up area in the valley [53] could be another possible attribute, because when solid waste is disposed of openly into the environment, which may include child feces and other sources of fecal waste [54], it may contaminate groundwater sources [55]. Although not as a dominant fecal marker in agricultural areas, the human fecal marker was detected in a similar ratio to the ruminant fecal marker in this study. This might be due in part to the limited connection of households to the sewerage system [56], poorly constructed septic tanks, temporary pit latrines used by farm workers, and even open defecation [57] in the agricultural areas in Nepal. Use of sewage and river water for irrigation of agricultural lands is also a common practice in the Kathmandu Valley [58]. In this study, ruminant fecal markers were significantly more likely to be detected in agricultural areas compared to built-up areas, while using different statistical analytical approaches. The application of raw livestock manure as a fertilizer is a common agricultural practice in Nepal [15], and the applied manure can contaminate groundwater with pathogenic microorganisms [59]. In addition, livestock farming is less intensive in developing countries, and thus, animals defecate in pasture lands while grazing, and animal waste is usually improperly managed within farms as well. These features of livestock farming in developing countries are the potential causes of non-point sources of fecal contamination in the environment [60]. A previous study has suggested that livestock ownership is a significant risk factor for the contamination of drinking water sources [14]. Surprisingly, in this study, animal fecal markers were also detected in densely populated built-up areas. This result was in alignment with the result of a study in Dhaka, Bangladesh, which found ruminant fecal contamination of water in densely populated urban areas [17].
In this study, in spite of assays’ sensitivity of 100% each, and relatively high target gene concentrations of BacHum (2.3), BacR (4.7), and Pig2Bac (3.5 log copies per MPN E. coli) in the fecal source samples [26], none of the tested source-associated fecal markers were detected in 125 E. coli-positive samples. This might be due to the fecal contamination of these samples by other animals, such as dogs or chickens, whose markers were not tested, the high limit of detections of tested assays, low concentration of target genes in the tested water samples, and/or the difference in methods of measurement of fecal concentration [61]. This could be explained by the use of a large water sample volume (100 mL) for a culture method, while only 2.5 µL of the extracted DNA, which was equivalent to 0.02 mL of the original water sample, was used for qPCR. Higher detection ratios of the human and animal fecal marker might have been obtained if a larger volume of water had been filtered. More importantly, at least one fecal marker was detected in 23% (13/56) of the culture-based E. coli-negative samples. One of the reasons could be because culture method detects live cells only, whereas the qPCR method detects DNA from both live and dead cells. However, a previous study [17] also reported the detection of source-associated fecal markers in E. coli-negative samples in other study areas and other sample types. This finding may indicate that E. coli is not suitable to confirm the absence of fecal markers in the groundwater samples tested in this study. E. coli has also been found to not be suitable to confirm the absence of waterborne pathogens in groundwater samples in the Kathmandu Valley [24].
Our results showed a seasonal trend in E. coli concentration, as the concentration increased in wet season compared to dry season (Table 3). However, as water samples were collected only once in each season (the dry and wet seasons), long-term monitoring of the water quality using host-associated markers is recommended to identify the seasonal patterns of fecal contamination sources in a complex watershed [62]. Further work could include studies using greater volumes of groundwater, thereby enhancing the detection of markers. The validation of host-associated bacterial markers targeting possible fecal sources such as chickens [63] and dogs [64], which were not tested in this study, and their application in the MST of water sources, would be an important next step to obtain a clear picture of the fecal contamination scenarios for different land covers in the valley.

5. Conclusions

This study provided insights into the distribution and abundance of FIB in the groundwater sources throughout the entire Kathmandu Valley, and their detection in groundwater indicated unsuitability for drinking purposes. The shallow aquifer sources, mainly shallow dug wells and stone spouts, pose a potentially higher risk to humans compared to tube wells due to the potential presence of pathogens in fecal sources, as indicated by the high prevalence of FIB and fecal markers in these sources. This study also highlighted the use of host-associated Bacteroidales genetic markers, which can be useful in environmental water monitoring to identify fecal pollution sources in the groundwater of different land covers. Human and ruminant fecal contaminations were found to be predominant in built-up and agricultural areas, which indicates that both human and ruminant feces management strategies need to be implemented in both land cover areas to control fecal pollution. The findings also highlight the risk of fecal contamination from both human and animal origins, suggesting that prioritizing only human fecal pollution control without considering animal fecal contamination will not be sufficient to prevent groundwater contamination. Further studies should focus more on the distribution and genetic analyses of zoonotic pathogens to assess the risk of passing infections from animals to humans.

Author Contributions

B.M. and E.H. conceived the research theme; B.M., R.G.S., S.T., and D.B. processed the samples; B.M. analyzed the results and prepared the manuscript; R.G.S., S.T., D.B., D.I., K.S., Y.T., and J.B.S. corrected the draft of the manuscript. E.H. checked the analyzed results and corrected the draft of the manuscript.

Funding

This research was funded by the Science and Technology Research Partnership for Sustainable Development (SATREPS) program of Japan International Cooperation Agency and Japan Science and Technology Agency, entitled ‘Hydro-microbiological Approach for Water Security in Kathmandu Valley, Nepal.’

Acknowledgments

The authors acknowledge Suresh Das Shrestha (Tribhuvan University, Nepal) Kei Nishida, Takashi Nakamura, Bijay Man Shakya, Ocean Thakali, Tomoki Iwashita, Ryota Sugaya, Hitoha Moriyama, and Rui Osada (University of Yamanashi, Japan) for their support in water sampling and Sadhana Shrestha (University of Yamanashi, Japan) for her support in the statistical analysis.

Conflicts of Interest

The authors declare no conflict of interest.

References

  1. Beaudeau, P.; De Valk, H.; Vaillant, V.; Mannschott, C.; Tillier, C.; Mouly, D.; Ledrans, M. Lessons learned from ten investigations of waterborne gastroenteritis outbreaks, France, 1998–2006. J. Water Health 2008, 6, 491–503. [Google Scholar] [CrossRef] [PubMed] [Green Version]
  2. Morris, B.L.; Lawrence, A.R.L.; Chilton, P.J.C.; Adams, B.; Calow, R.C.; Klinck, B.A. Groundwater and Its Susceptibility to Degradation: A Global Assessment of the Problem and Options for Management; Early warning and assessment report series, 03-3; United Nations Environment Programme: Nairobi, Kenya, 2003. [Google Scholar]
  3. Uy, D.; Haka, S.; Huya, C.; Srey, M.; Chunhieng, T.; Phoeurng, S.; Nasir, H.M.; Fredricks, D. Comparison of Tube-Well and Dug-Well Groundwater in the Arsenic Polluted Areas in Cambodia; Fukusi, K., Kurisu, F., Oguma, K., Furumai, H., Fontanos, P., Eds.; Southeast Asian Water Environment 4; International Water Association Publishing: London, UK, 2010. [Google Scholar]
  4. Ferguson, A.S.; Mailloux, B.J.; Ahmed, K.M.; Van Geen, A.; McKay, L.D.; Culligan, P.J. Hand-pumps as reservoirs for microbial contamination of well water. J. Water Health 2011, 9, 708–717. [Google Scholar] [CrossRef] [PubMed] [Green Version]
  5. Haramoto, E.; Yamada, K.; Nishida, K. Prevalence of protozoa, viruses, coliphages and indicator bacteria in groundwater and river water in the Kathmandu Valley, Nepal. Trans. R. Soc. Trop. Med. Hyg. 2011, 105, 711–716. [Google Scholar] [CrossRef] [PubMed]
  6. Barthiban, S.; Lloyd, B.J.; Maier, M. Applicability of a surveillance methodology for the microbiological safety of well water supplies, in a highly vulnerable hydrogeological setting—A case study based findings from the west coastal area of Sri Lanka. J. Water Resource Prot. 2012, 4, 899–912. [Google Scholar] [CrossRef]
  7. Shrestha, S.; Nakamura, T.; Malla, R.; Nishida, K. Seasonal variation in the microbial quality of shallow groundwater in the Kathmandu Valley, Nepal. Water Sci. Tech. Water Supply 2014, 14, 390–397. [Google Scholar] [CrossRef]
  8. Shrestha, S.; Haramoto, E.; Malla, R.; Nishida, K. Risk of diarrhoea from shallow groundwater contaminated with enteropathogens in the Kathmandu Valley, Nepal. J. Water Health 2015, 13, 259–269. [Google Scholar] [CrossRef]
  9. Shrestha, S.; Haramoto, E.; Shindo, J. Assessing the infection risk of enteropathogens from consumption of raw vegetables washed with contaminated water in Kathmandu Valley, Nepal. J. Appl. Microbiol. 2017, 123, 1321–1334. [Google Scholar] [CrossRef]
  10. Wu, J.; Yunus, M.; Islam, M.S.; Emch, M. Influence of climate extremes and land use on fecal contamination of shallow tubewells in Bangladesh. Environ. Sci. Technol. 2016, 50, 2669–2676. [Google Scholar] [CrossRef]
  11. Vernberg, W.; Scott, G.; Strozier, S.; Bemiss, J.; Daugomah, J. The Effects of Urbanization on Human and Ecosystem Health; Vernberg, F., Vernberg, W., Siewicki, T., Eds.; Sustainable Development in the Southeastern Coastal Zone; The University of South Carolina Press: Columbia, SC, USA, 1996; pp. 221–239. [Google Scholar]
  12. Paule, M.C.A.; Ventura, J.R.S.; Memon, S.; Lee, B.Y.; Jahng, D.; Kang, M.J.; Lee, C.H. Fecal contamination in Yongin watershed: Association to land use and land cover and stormwater quality. Desalin. Water Treat. 2015, 53, 3026–3038. [Google Scholar] [CrossRef]
  13. Okotto-Okotto, J.; Okotto, L.; Price, H.; Pedley, S.; Wright, J. A longitudinal study of long-term change in contamination hazards and shallow well quality in two neighbourhoods of Kisumu, Kenya. Int. J. Environ. Res. Public Health 2015, 12, 4275–4291. [Google Scholar] [CrossRef] [Green Version]
  14. Wardrop, N.A.; Hill, A.G.; Dzodzomenyo, M.; Aryeetey, G.; Wright, J.A. Livestock ownership and microbial contamination of drinking-water: Evidence from nationally representative household surveys in Ghana, Nepal and Bangladesh. Int. J. Hyg. Environ. Health 2018, 221, 33–40. [Google Scholar] [CrossRef] [PubMed]
  15. Pilbeam, C.J.; Tripathi, B.P.; Sherchan, D.P.; Gregory, P.J.; Gaunt, J. Nitrogen balances for households in the mid-hills of Nepal. Agric. Ecosyst. Environ. 2000, 79, 61–72. [Google Scholar] [CrossRef]
  16. Schriewer, A.; Odagiri, M.; Wuertz, S.; Misra, P.R.; Panigrahi, P.; Clasen, T.; Jenkins, M.W. Human and animal fecal contamination of community water sources, stored drinking water and hands in rural India measured with validated microbial source tracking assays. Am. J. Trop. Med. Hyg. 2015, 93, 509–516. [Google Scholar] [CrossRef] [PubMed]
  17. Harris, A.R.; Pickering, A.J.; Harris, M.; Doza, S.; Islam, M.S.; Unicomb, L.; Luby, S.; Davis, J.; Boehm, A.B. Ruminants contribute fecal contamination to the urban household environment in Dhaka, Bangladesh. Environ. Sci. Technol. 2016, 50, 4642–4649. [Google Scholar] [CrossRef]
  18. Odagiri, M.; Schriewer, A.; Daniels, M.E.; Wuertz, S.; Smith, W.A.; Clasen, T.; Schmidt, W.; Jin, Y.; Torondel, B.; Misra, P.R.; et al. Human fecal and pathogen exposure pathways in rural Indian villages and the effect of increased latrine coverage. Water Res. 2016, 100, 232–244. [Google Scholar] [CrossRef] [Green Version]
  19. US Environmental Protection Agency. Water Quality Standards for Coastal and Great Lakes Recreation Waters: Final Rule; Federal Register; US Environmental Protection Agency: Washington, DC, USA, 2004; Volume 69, pp. 67218–67243.
  20. US Environmental Protection Agency. Microbial Source Tracking Guide Document; EPA/600-R-05-064; US Environmental Protection Agency: Cincinnati, OH, USA, 2005.
  21. Bernhard, A.E.; Field, K.G. A PCR assay to discriminate human and ruminant feces on the basis of host differences in Bacteroides-Prevotella genes encoding 16S rRNA. Appl. Environ. Microbiol. 2000, 66, 4571–4574. [Google Scholar] [CrossRef]
  22. Bernhard, A.E.; Field, K.G. Identification of nonpoint sources of fecal pollution in coastal waters by using host-specific 16S ribosomal DNA genetic markers from fecal anaerobes. Appl. Environ. Microbiol. 2000, 66, 1587–1594. [Google Scholar] [CrossRef]
  23. Layton, A.; McKay, L.; Williams, D.; Garrett, V.; Gentry, R.; Sayler, G. Development of Bacteroides 16S rRNA gene taqman-based real-time PCR assays for estimation of total, human, and bovine fecal pollution in water. Appl. Environ. Microbiol. 2006, 72, 4214–4224. [Google Scholar] [CrossRef] [PubMed]
  24. Haramoto, E. Detection of Waterborne Protozoa, Viruses, and Bacteria in Groundwater and Other Water Samples in the Kathmandu Valley, Nepal. IOP Conference Series: Earth and Environmental Science. 120 012004. 2018. Available online: https://doi.org/10.1088/1755-1315/120/1/012004 (accessed on 15 July 2018).
  25. Haramoto, E.; Osada, R. Assessment and application of host-specific Bacteroidales genetic markers for microbial source tracking of river water in Japan. PLoS ONE 2018, 13, e0207727. [Google Scholar] [CrossRef]
  26. Malla, B.; Ghaju Shrestha, R.; Tandukar, S.; Bhandari, D.; Inoue, D.; Sei, K.; Tanaka, Y.; Sherchand, J.B.; Haramoto, E. Validation of host-specific Bacteroidales quantitative PCR assays and their application to microbial source tracking of drinking water sources in the Kathmandu Valley, Nepal. J. Appl. Microbiol. 2018, 125, 609–619. [Google Scholar] [CrossRef]
  27. Wuertz, S.; Wang, D.; Reischer, G.; Farnleitner, A. Microbial Source Tracking: Methods, Applications, and Case Studies; Hagedorn, C., Blanch, A.R., Harwood, V.J., Eds.; Springer: New York, NY, USA, 2011; Chapter 4; pp. 90–91. [Google Scholar]
  28. Kildare, B.J.; Leutenegger, C.M.; McSwain, B.S.; Bambic, D.G.; Rajal, V.B.; Wuertz, S. 16S rRNA-based assays for quantitative detection of universal, human-, cow-, and dog-specific fecal Bacteroidales: A Bayesian approach. Water Res. 2007, 41, 3701–3715. [Google Scholar] [CrossRef] [PubMed]
  29. Reischer, G.H.; Kasper, D.C.; Steinborn, R.; Mach, R.L.; Farnleitner, A.H. Quantitative PCR method for sensitive detection of ruminant fecal pollution in freshwater and evaluation of this method in alpine karstic regions. Appl. Environ. Microbiol. 2006, 72, 5610–5614. [Google Scholar] [CrossRef] [PubMed]
  30. Mieszkin, S.; Furet, J.P.; Corthier, G.; Gourmelon, M. Estimation of pig fecal contamination in a river catchment by real-time PCR using two Pig-Specific Bacteroidales 16S rRNA genetic markers. Appl. Environ. Microbiol. 2009, 75, 3045–3054. [Google Scholar] [CrossRef] [PubMed]
  31. Central Bureau of Statistics. National Population and Housing Census 2011 (Village Development Committee/Municipality); Central Bureau of Statistics, Government of Nepal: Kathmandu, Nepal, 2012.
  32. Uddin, K.; Shrestha, H.L.; Murthy, M.S.R.; Bajracharya, B.; Shrestha, B.; Gilani, H.; Pradhan, S.; Dangol, B. Development of 2010 national land cover database for the Nepal. J. Environ. Manag. 2015, 148, 82–90. [Google Scholar] [CrossRef] [PubMed]
  33. Regmi, R.K.; Mishra, B.K.; Masago, Y.; Luo, P.; Toyozumi-Kojima, A.; Jalilov, S.M. Applying a water quality index model to assess the water quality of the major rivers in the Kathmandu Valley, Nepal. Environ. Monit. Assess. 2017, 189–382. [Google Scholar] [CrossRef] [PubMed]
  34. Bhatta, G.D.; Doppler, W. Farming differentiation in the rural-urban interface of the middle mountains, Nepal: Application of analytic hierarchy process (AHP) modeling. J. Agric. Sci. 2010, 2, 37–51. [Google Scholar] [CrossRef]
  35. Kathmandu Upatyaka Khanepani Limited. KUKL 10th Annual Report; Kathmandu Upatyaka Khanepani Limited: Kathmandu, Nepal, 2018. [Google Scholar]
  36. Shrestha, S.; Aihara, Y.; Bhattarai, A.P.; Bista, N.; Rajbhandari, S.; Kondo, N.; Kazama, F.; Nishida, K.; Shindo, J. Dynamics of domestic water consumption in the urban area of the Kathmandu Valley: Situation analysis pre and post 2015 Gorkha Earthquake. Water 2017, 9, 222. [Google Scholar] [CrossRef]
  37. Ghaju Shrestha, R.; Tanaka, Y.; Malla, B.; Bhandari, D.; Tandukar, S.; Inoue, D.; Sei, K.; Sherchand, J.B.; Haramoto, E. Next-generation sequencing identification of pathogenic bacterial genes and their relationship with fecal indicator bacteria in different water sources in the Kathmandu Valley, Nepal. Sci. Total Environ. 2017, 601–602, 278–284. [Google Scholar] [CrossRef]
  38. Haramoto, E.; Kitajima, M. Quantification and genotyping of Aichi Virus 1 in water samples in the Kathmandu Valley, Nepal. Food Environ. Virol. 2017, 9, 350–353. [Google Scholar] [CrossRef]
  39. Ministry of Agricultural Development. Statistical Information on Nepalese Agriculture. Nepal; Government of Nepal: Kathmandu, Nepal, 2012.
  40. NPC & UN. Nepal MDG Acceleration Framework: Improving Access to Sanitation; National Planning Commission, Government of Nepal and United Nations in Nepal: Kathmandu, Nepal, 2013. Available online: http://www.undp.org/content/dam/undp/library/MDG/MDG%20Acceleration%20Framework/MAF%20Reports/RBAP/Nepal%20-%20WEB.pdf (accessed on 15 July 2018).
  41. Kishida, N.; Morita, H.; Haramoto, E.; Asami, M.; Akiba, M. One-year weekly survey of noroviruses and enteric adenoviruses in the Tone River water in Tokyo metropolitan area, Japan. Water Res. 2012, 46, 2905–2910. [Google Scholar] [CrossRef]
  42. Khush, R.S.; Arnold, B.F.; Srikanth, P.; Sudharsanam, S.; Ramaswamy, P.; Durairaj, N.; London, A.G.; Ramaprabha, P.; Rajkumar, P.; Balakrishnan, K.; et al. H2S as an indicator of water supply vulnerability and health risk in low-resource settings: A prospective cohort study. Am. J. Trop. Med. Hyg. 2013, 89, 251–259. [Google Scholar] [CrossRef]
  43. Pant, B.R. Groundwater quality in the Kathmandu valley of Nepal. Environ. Monit. Assess. 2011, 178, 477–485. [Google Scholar] [CrossRef] [PubMed]
  44. World Health Organization (WHO). Guidelines for Drinking-Water Quality, 4th ed.; WHO: Geneva, Switzerland, 2011. [Google Scholar]
  45. Sobsey, M.D.; Khatib, L.A.; Hill, V.R.; Alocilja, E.; Pillai, S. Pathogens in Animal Wastes and the Impacts of Waste Management Practices on Their Survival, Transport and Fate; White papers on animal agriculture and the environment. MidWest Plan Service (MWPS); Iowa State University: Ames, IA, USA, 2001. [Google Scholar]
  46. Ercumen, A.; Pickering, A.J.; Kwong, L.H.; Arnold, B.F.; Parvez, S.M.; Alam, M.; Sen, D.; Islam, S.; Kullmann, C.; Chase, C.; et al. Animal feces contribute to domestic fecal contamination: evidence from E. coli measured in water, hands, food, flies, and soil in Bangladesh. Environ. Sci. Technol. 2017, 51, 8725–8734. [Google Scholar] [CrossRef] [PubMed]
  47. Dufour, A.; Bartram, J.; Bos, R.; Gannon, V.P.J. Animal Waste, Water Quality and Human Health, Emerging Issues in Water and Infectious Disease Series; International Water Association Publishing: London, UK, 2012. [Google Scholar]
  48. Boehm, A.B.; Soller, J.A.; Shanks, O.C. Human-associated fecal quantitative polymerase chain reaction measurements and simulated risk of gastrointestinal illness in recreational waters contaminated with raw sewage. Environ. Sci. Technol. Lett. 2015, 2, 270–275. [Google Scholar] [CrossRef]
  49. Ahmed, W.; Hamilton, K.A.; Lobos, A.; Hughes, B.; Staley, C.; Sadowsky, M.J.; Harwood, V.J. Quantitative microbial risk assessment of microbial source tracking markers in recreational water contaminated with fresh untreated and secondary treated sewage. Environ. Int. 2018, 117, 243–249. [Google Scholar] [CrossRef] [PubMed]
  50. Shrestha, R.R. Status and Strategy for Faecal Sludge Management in the Kathmandu Valley; HPCIDBC & UNHABITAT: Kathmandu, Nepal, 2011.
  51. Nyachhon, B.L. Economic Policy Network Policy Paper23–Service Enhancement and Development of Sanitary System in Urban and Semi-Urban Setting in Nepal; Ministry of Finance, Government of Nepal: Kathmandu, Nepal, 2006; 12p. [Google Scholar]
  52. Shukla, A. Wastewater Production, Treatment and Use in Nepal. 2012. Available online: https://www.ais.unwater.org/ais/pluginfile.php/232/mod_page/content/134/Nepal_CountryPaper.pdf (accessed on 15 July 2018).
  53. Pradhan, B.B.; Shrestha, B.R.; Punjali, K.R.; Lama, C.N. Kathmandu Valley Environmental Outlook; International Center for Integrated Mountain Development: Kathmandu, Nepal, 2007. [Google Scholar]
  54. Majorin, F.; Freeman, M.C.; Barnard, S.; Routray, P.; Boisson, S.; Clasen, T. Child feces disposal practices in rural Orissa: A cross sectional study. PLoS ONE 2014, 9, 1–7. [Google Scholar] [CrossRef] [PubMed]
  55. Howard, G.; Pedley, S.; Barrett, M.; Nalubega, M.; Johal, K. Risk factors contributing to microbiological contamination of shallow groundwater in Kampala, Uganda. Water Res. 2003, 37, 3421–3429. [Google Scholar] [CrossRef]
  56. Karn, S.K.; Harada, H. Surface water pollution in three urban territories of Nepal, India, and Bangladesh. Environ. Manag. 2001, 28, 483–496. [Google Scholar] [CrossRef]
  57. Devleesschauwer, B.; Aryal, A.; Joshi, D.D.; Rijal, S.; Sherchand, J.B.; Praet, N.; Speybroeck, N.; Duchateau, L.; Vercruysse, J.; Dorny, P. Epidemiology of Taenia solium in Nepal: Is it influenced by the social characteristics of the population and the presence of Taenia asiatica? Trop. Med. Int. Health 2012, 17, 1019–1022. [Google Scholar] [CrossRef]
  58. Shrestha, S.; Haramoto, E.; Sherchand, J.B.; Shindo, J. Detection of coliform bacteria in irrigation water and on vegetable surfaces in the Kathmandu valley of Nepal. JIOM 2016, 38, 43–47. [Google Scholar]
  59. Oun, A.; Kumar, A.; Harrigan, T.; Angelakis, A.; Xagoraraki, I. Effects of Biosolids and manure application on microbial water quality in rural areas in the US. Water 2014, 6, 3701–3723. [Google Scholar] [CrossRef]
  60. Jenkins, M.W.; Tiwari, S.; Lorente, M.; Gichaba, C.M.; Wuertz, S. Identifying human and livestock sources of fecal contamination in Kenya with host-specific Bacteroidales assays. Water Res. 2009, 43, 4956–4966. [Google Scholar] [CrossRef] [PubMed]
  61. Ervin, J.S.; Russell, T.L.; Layton, B.A.; Yamahara, K.M.; Wang, D.; Sassoubre, L.M.; Cao, Y.; Kelty, C.A.; Sivaganesan, M.; Boehm, A.B.; et al. Characterization of fecal concentrations in human and other animal sources by physical, culture-based, and quantitative real-time PCR Methods. Water Res. 2013, 47, 6873–6882. [Google Scholar] [CrossRef] [PubMed]
  62. Riedel, T.E.; Thulsiraj, V.; Zimmer-Faust, A.G.; Dagit, R.; Krug, J.; Hanley, K.T.; Adamek, K.; Ebentier, D.L.; Torres, R.; Cobian, U.; et al. Long-term monitoring of molecular markers can distinguish different seasonal patterns of fecal indicating bacteria sources. Water Res. 2015, 71, 227–243. [Google Scholar] [CrossRef] [PubMed]
  63. Kobayashi, A.; Sano, D.; Hatori, J.; Ishii, S.; Okabe, S. Chicken- and duck-associated Bacteroides-Prevotella genetic markers for detecting fecal contamination in environmental water. Appl. Microbiol. Biotechnol. 2013, 97, 7427–7437. [Google Scholar] [CrossRef] [PubMed]
  64. Sinigalliano, C.D.; Fleisher, J.M.; Gidley, M.L.; Solo-Gabriele, H.M.; Shibata, T.; Plano, L.R.; Elmir, S.M.; Wanless, D.; Bartkowiak, J.; Boiteau, R.; et al. Traditional and molecular analyses for fecal indicator bacteria in non-point source subtropical recreational marine waters. Water Res. 2010, 44, 3763–3772. [Google Scholar] [CrossRef] [PubMed] [Green Version]
Figure 1. Map showing the locations of the sampling sites.
Water 10 01796 g001
Figure 2. Spatial distribution of the fecal markers.
Water 10 01796 g002
Table 1. Detection of E. coli and total coliforms in water samples.
Water SampleNo. of Tested SamplesE. coliTotal Coliforms
No. of Positive Samples (% Positive)Concentration (log MPN/100 mL)No. of Positive Samples (% Positive)Concentration (log MPN/100 mL)
Mean ± SD aMaxMean ± SD aMax
Shallow dug well181149 (82)1.61 ± 1.595.38178 (98)3.60 ± 1.277.08
Shallow tube well4513 (29)−0.22 ± 1.404.4636 (80)1.64 ± 1.775.38
Deep tube well5017 (34)−0.17 ± 1.354.4644 (88)1.79 ± 1.514.74
Stone spout2418 (75)1.34 ± 1.804.5124 (100)2.69 ± 1.254.74
Total300197 (66) 282 (94)
a SD, standard deviation.
Table 2. Detection of host-associated Bacteroidales genetic markers in water samples.
SourceNo. of Tested SamplesBacHum (Human)BacR (Ruminant)Pig2Bac (Pig)No. of Samples Positive for at Least One Fecal Marker (% Positive)
No. of Positive Samples (% Positive)Conc. a (log Copies/100 mL)No. of Positive Samples (% Positive)Conc. a (log Copies/100 mL)No. of Positive Samples (% Positive)Conc. a (log Copies/100 mL)
Shallow dug well16640 (24)5.04–7.1721 (13)4.25–7.815 (3)4.39–4.6859 (36)
Shallow tube well336 (18)5.01–6.911 (3)4.472 (6)5.778 (24)
Deep tube well302 (7)DNQ b3 (10)4.52–5.181 (3)DNQ b5 (17)
Stone spout217 (33)5.50–6.883 (14)4.67–5.570 (0)ND c10 (48)
Total25055 (22) 28 (11) 8 (3) 82 (33)
a Range of concentrations of samples detected with concentrations higher than LOQ values; b DNQ, detected but not quantifiable; c ND, not detected.
Table 3. Association of land cover and source types with FIB and fecal markers detection.
FactorsE. coli ConcentrationBacHum DetectionBacR DetectionAt Least One Marker Detection
β a95% CI bpAOR c95% CI bpAORc95% CI bpAORc95% CI bp
LowerUpperLowerUpperLowerUpperLowerUpper
Multiple Linear RegressionMultiple Logistic Regression
Land cover
Built-up−0.18−0.570.200.3453.601.637.920.002Ref.1.480.792.750.219
Agricultural area Ref.2.901.207.020.018Ref.
Source types
Shallow dug well0.32−0.310.950.315Ref.Ref.Ref.
Shallow tube well−1.44−2.16−0.73<0.0010.410.151.100.0760.340.042.810.3170.440.181.090.076
Deep tube well−1.43−2.13−0.73<0.0010.140.030.630.0100.860.233.270.8280.260.090.750.012
Stone spoutNA 0.940.342.610.9111.790.447.390.4181.290.493.370.602
Season
Dry Ref.Ref.Ref.
Wet1.180.851.51<0.0011.880.973.660.0611.690.714.010.2362.101.183.740.012
Generalized Estimation Equation in Repeated Samples
Land cover
Built up−0.02−0.430.390.914Ref.Ref.Ref.
Agricultural area 0.320.120.830.0192.010.814.970.1300.660.321.340.251
Source types
Shallow dug well0.16−0.701.020.715Ref. Ref. Ref.
Shallow tube well−1.81−2.740.89<0.0010.370.131.080.0680.390.062.730.3420.440.171.130.088
Deep tube well−1.64−2.58−0.710.0010.180.040.850.0300.420.053.530.4240.200.050.740.016
Stone spoutNA 0.710.182.890.6342.030.537.800.3041.110.333.740.860
Season
Dry Ref.Ref.Ref.
Wet1.180.831.53<0.0012.171.154.100.0161.280.592.750.5322.231.313.790.003
a Unstandardized beta coefficient; b CI, confidence interval; c AOR, adjusted odds ratio; p: p-value; Ref.: Reference group; NA: not applicable.
Table 4. Detection of the fecal markers at different concentration ranges of E. coli.
Concentration of E. coli (log MPN/100 mL)No. of SamplesNo. of Positive Samples (% positive)
HumanRuminantAt Least One Fecal Marker
<0.005610 (18)2 (4)13 (23)
0.00–1.50645 (8)5 (8)10 (16)
1.51–2.706812 (18)9 (13)21 (31)
>2.706228 (45)12 (19)38 (61)

