Article

Analyzing the Impacts of Climate Variability and Land Surface Changes on the Annual Water–Energy Balance in the Weihe River Basin of China

1
State Key Laboratory of Soil Erosion and Dryland Farming on the Loess Plateau, Institute of Soil and Water Conservation, Chinese Academy of Sciences and Ministry of Water Resources, Yangling, Xianyang 712100, China
2
University of Chinese Academy of Sciences, Beijing 100049, China
3
Shaanxi Key Laboratory of Earth Surface System and Environmental Carrying Capacity, College of Urban and Environmental Sciences, Northwest University, Xi’an 710127, China
4
Jiangxi Key Laboratory of Hydrology-Water Resources and Water Environment, Nanchang Institute of Technology, Nanchang 330099, China
5
School of Urban and Environmental, Liaoning University, Dalian 116029, China
*
Author to whom correspondence should be addressed.
Water 2018, 10(12), 1792; https://doi.org/10.3390/w10121792
Submission received: 27 October 2018 / Revised: 1 December 2018 / Accepted: 3 December 2018 / Published: 6 December 2018

Abstract

:
The serious soil erosion problems and decreased runoff of the Loess Plateau may aggravate the shortage of its local water resources. Understanding the spatiotemporal influences on runoff changes is important for water resource management. Here, we study this in the largest tributary of the Yellow River, the Weihe River Basin. Data from four hydrological stations (Lin Jia Cun (LJC), Xian Yang (XY), Lin Tong (LT), and Hua Xian (HX)) and 10 meteorological stations from 1961–2014 were used to analyze changes in annual runoff. The Mann–Kendall test and Pettitt abrupt change point test diagnosed variations in runoff in the Weihe River basin; the time periods before and after abrupt change points are the base period (period I) and change period (period II), respectively. Within the Budyko framework, the catchment properties (ω in Fu’s equation) represent land surface changes; climate variability comprises precipitation (P) and potential evapotranspiration (ET0). All the stations showed a reduction in annual runoff during the recording period, of which 22.66% to 50.42% was accounted for by land surface change and 1.97% to 53.32% by climate variability. In the Weihe River basin, land surface changes drive runoff variation in LT and climate variability drives it in LJC, XY, and HX. The contribution of land surface changes to runoff reduction in period I was less than that in period II, indicating that changes in human activity further decreased runoff. Therefore, this study offers a scientific basis for understanding runoff trends and driving forces, providing an important reference for social development, ecological construction, and water resource management.

1. Introduction

In a long-term hydrological system, changes in runoff can be influenced by many factors, such as climate change (including natural and anthropogenic climate change) and land surface changes (including changes in vegetation and agricultural irrigation and changes in water quantity and quality caused by various types of water use), which has triggered a series of questions about the water cycle [1,2]. In recent years, many river runoff values have shown decreasing trends, but it remains unclear whether these changes were caused by climate warming or human activities, and their relative contributions are also poorly understood. In response to this problem, domestic and foreign researchers have begun to attempt to quantitatively distinguish the impacts of human activities and climate change on hydrological processes. Due to the enormous influence of changes in rivers, ecological systems, social development, global climate, and recreation, many people are interested in understanding the trends of river changes and their driving forces. The response of runoff to land surface change in the Loess Plateau of China accounted for more than 50% of the decrease in mean annual runoff [3]. The impacts of climate variability and land surface changes on runoff in the upper reaches of the Yellow River Basin in China indicate that land use changes were responsible for more than 70% of the decrease in runoff in the 1990s [4]. Climate change has also led to changes in global precipitation patterns [5], and human activities have changed the spatial and temporal distribution of water resources [6]. The extent of the total change in runoff in the Loess Plateau and the degrees of influence of various factors on this change are variable. The integrated consequences of climatic variability and human activities are the main drivers impacting runoff change [7]. Climate variability is of vital importance if water resource management systems are to be sustainable [8]. Land use and water resources are closely linked in comprehensive management, in which land use is a key factor in the allocation of water resources in watersheds [9]. A considerable global variability of catchment hydrological processes has been observed in most basins throughout the world, and quantifying the effects of climate variability and human activities is crucial for the management and sustainable development of water resources [10].
Quantitative attribution methods have been developed to isolate the hydrological effects of climate variability and land surface changes [11], including the following: (i) statistical methods [12], (ii) the Budyko-based elasticity coefficient method [13], and (iii) hydrological modelling [14].
It is difficult to explain the physical mechanisms between runoff and climatic factors using statistical methods, thus long-term historical hydrological and meteorological data are usually required [4,15]. Regression relationship analyses [16], time-trend analyses [17,18], and change abrupt point analyses are the main statistical methods used in these studies. Vogel et al. [19] adopted the regional multivariate regression model and suggested that a 1% increase in precipitation would result in a 1.9% increase in annual runoff in the upper reaches of the Colorado River. Xu [12] showed that climate change can explain the observed reductions in natural runoff (72.9%) and annual observed runoff (78.6%) by using linear regression to assess the impact of climate change and human activities on the annual changes in runoff. Zhao et al. [20] used linear regression to analyze sediment load and runoff in the Yangtze River from 1953 to 2010 and showed that 72% of runoff and 14% of sediment load decreased due to the effects of climate change.
Schaake [21] originally proposed utilizing the elasticity coefficient to evaluate the effects of precipitation and potential evapotranspiration on changes in runoff. The most widely utilized methods based on the elasticity coefficient method include the nonparametric method and an analytical method based on the Budyko framework [22,23]. The Budyko hypothesis is a coupled water–energy balance equation developed by Budyko himself when conducting global water and energy balance analysis. The Budyko hypothesis indicates that actual evapotranspiration is controlled by the availability of water and energy by annual precipitation and potential evapotranspiration, respectively, on an annual scale. This approach is based on the principle of water–energy balance in terms of the long-term variability of hydrometeorological variables; it is a simple and practical approach used to study the hydrological response of the basin to environmental changes. The Budyko hypothesis is a useful way to investigate the relationship between hydrological processes, climate change, and land change characteristics [24,25]. The improved Budyko-based elasticity coefficient method [13] was proposed to assess the impact of climate change and human activities on runoff reduction; it was found that human activities accounted for 71–78% and climate change accounted for 22–29% of the changes in runoff reduction. The hydrological response to climate change and human activities in the Jingjiang River Basin from 1961 to 2009 was determined using the Budyko hypothesis; the results showed that climate change accounted for >63% of the decrease in runoff [26].
The hydrological model was first used to predict changes in runoff caused by changes in land surface [27], which has recently become a major method by which to distinguish the hydrological response between climate variability and land surface change. In hydrological models, which include sound physical mechanisms, time-series continuity, and large amounts of observation data in their model structures and parameters, variations in the uncertainty associated with the model calibration will yield different results; for example, in the SWAT (Soil and Water Assessment Tool), TETIS, and Xinanjiang models, the parameters are often controversial due to the calibration and uncertainty of each model [28,29,30]. In recent years, a simple water balance model called the Budyko curve has been widely utilized to distinguish the effects of climate variability and land surface changes on runoff response [24,31].
The objectives of this study are as follows: (i) to statistically determine the trend and abrupt change points in the runoff data for the period 1961–2014; (ii) to differentiate between the effects of climate variability and land surface changes in time and space based on the elasticity coefficient; and (iii) to discuss the associations between different factors and their corresponding quantitative attributions. These findings will deepen our understanding of the runoff response to climate variability and land surface changes in the Weihe River Basin, which is essential for improving soil conservation measures and the sustainable development of water resource management.

2. Materials and Methods
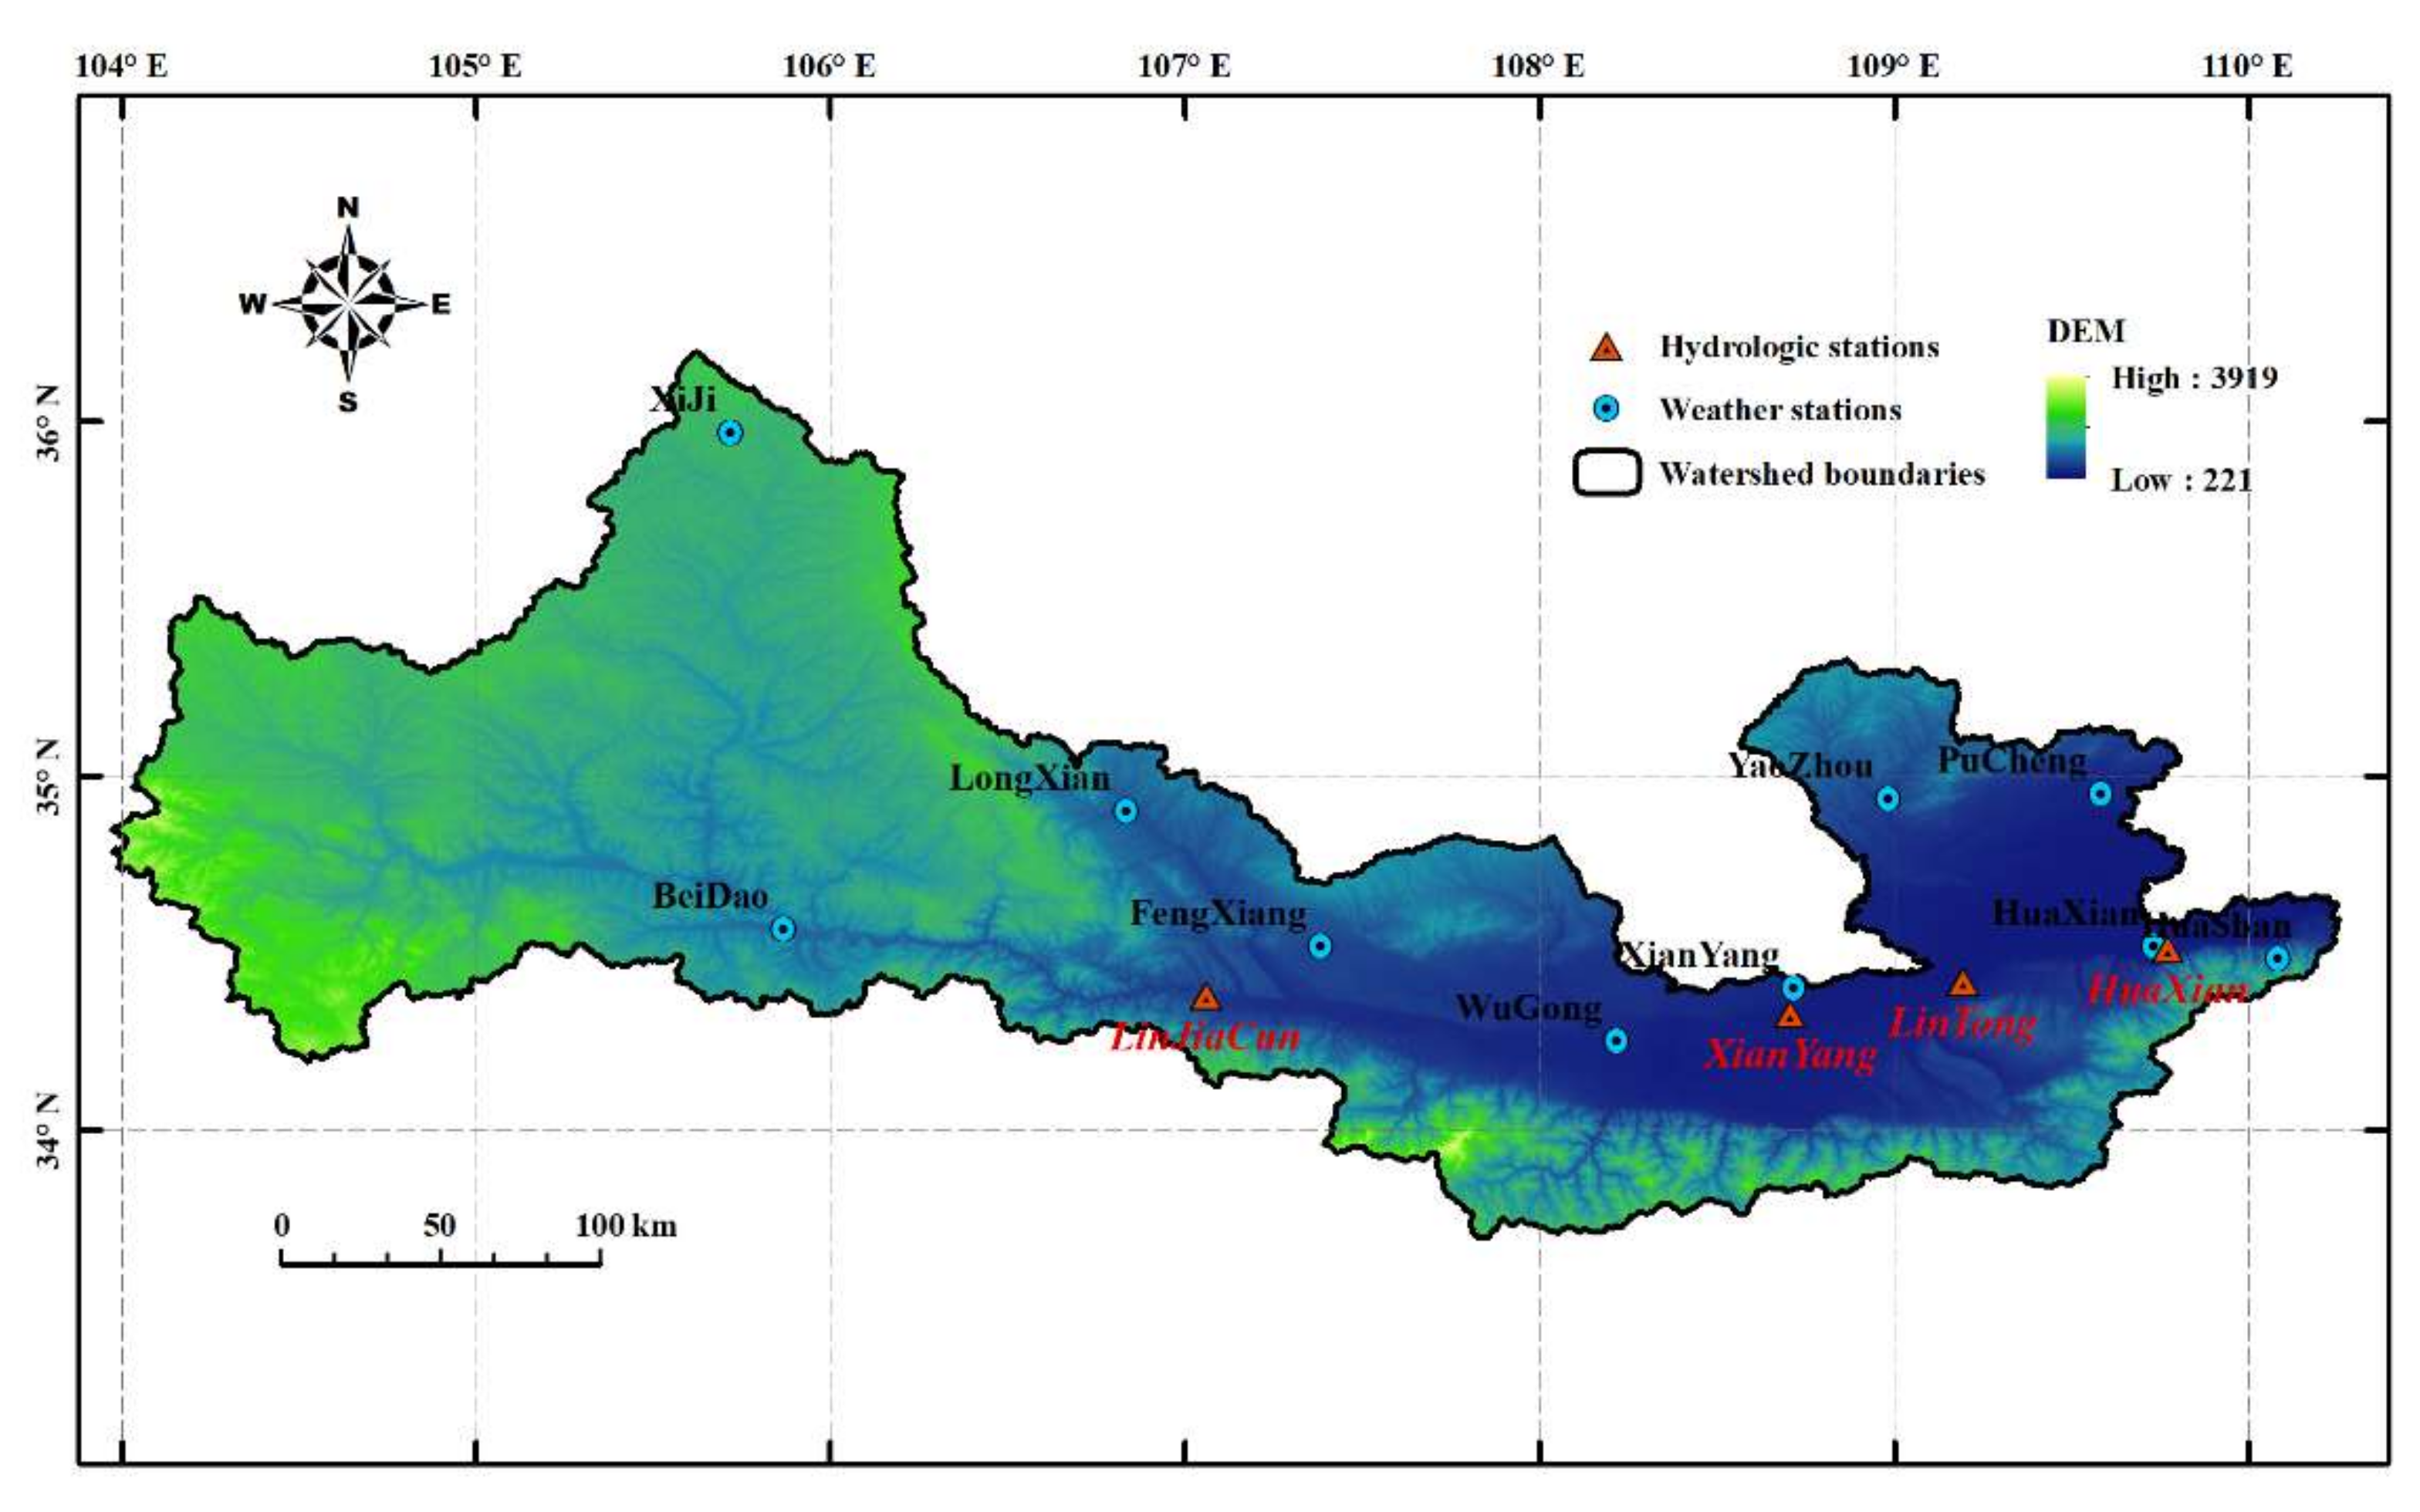
2.1. Study Area

The Loess Plateau (35–41° N, 102–114° E) covers a total area of 624,000 km2; it is located in the middle and upper reaches of the Yellow River, and it comprises an ancient loess deposit. The Wei River Basin (WRB; latitude 33.5° N–37.5° N; longitude 103.5° E–110.5° E), which is the largest tributary of the Yellow River (China), originates north of the Niaoshu Mountains at an altitude of 3485 m in Gansu Province; it then flows for 818 km, with a drainage area of 13.5 × 10⁴ km2, which accounts for 17.9% of the total area of the Yellow River Basin (Figure 1). The WRB runs from east to west through Gansu, Ningxia, and Shaanxi Provinces, and it plays an important role in the social, ecological, and economic development of these regions [32]. The watershed length of Shaanxi Province is approximately 502.4 km, with a basin area of approximately 6.67 × 10⁴ km2; this region is where the well-known Guanzhong Plain in northwest China is located. The WRB is characterized by a warm, semihumid continental monsoon climate with high precipitation and temperatures in summer and low precipitation and temperatures in winter [33,34]. The annual mean temperature in the WRB varies from 7.8 °C to 13.5 °C. The precipitation throughout the entire basin ranges from 558–750 mm, with over 60% of the annual precipitation falling in the summer monsoon period between June and September [35].

2.2. Data Collection

The monthly runoff data obtained from the 4 hydrological stations at Lin Jia Cun (LJC), Xian Yang (XY), Lin Tong (LT), and Huan Xian (HX), which were available for the period 1961–2014, were used in this study (WRB) and were collected from the Yellow River Conservancy Commission. LJC is located in the upper reaches of the WRB, XY is located in the middle stream, and LT and HX are located downstream. The control areas of the LJC, XY, LT, and HX stations are 30.661 km2, 46.827 km2, 97.299 km2, and 106.498 km2, respectively and they account for 22.7%, 34.7%, 72.2%, and 79% of the catchment, respectively. Daily metrological data (1961–2014) were collected from 10 stations in the WRB from the National Meteorological Data Sharing Service Platform (http://data.cma.cn), including daily precipitation and mean, maximum, and minimum temperature data at a height of 2 m; mean relative humidity and wind speed data at a height of 10 m; and daily sunshine duration data. The potential evapotranspiration data were calculated using the Penman–Monteith equation outlined in FAO-56 [36].

2.3. Methodology

2.3.1. Trend Analysis and Breakpoint Test

The nonparametric Mann–Kendall test method [37,38] is an effective tool for identifying trends. In this paper, the Mann–Kendall test method was used to examine the trend of hydrological data variables with the runoff series of the watershed, with a significance level of 0.05, and the magnitude and direction of the trend were also calculated. A positive trend indicates that the sequence has an increasing trend; a negative trend indicates that it has a decreasing trend. The Pettitt abrupt change point test [39] is a nonparametric method that can be used to detect abrupt changes in various variables. A given continuous time series (n1, n2, …, nT) is divided into a base period (period I; n1, n2, …, nT) and a change period (period II; nt + 1, nt + 2, …, nT), which is calculated based on the characteristic hydroclimatic values of the 2 subperiod series, then the degree of hydrologic climate change between the 2 subperiods is estimated.

2.3.2. Budyko Framework

The water–energy balance based on the Budyko hypothesis describes the relationship between precipitation (P), potential evotranspiration (ET0), and runoff. In this study, the water balance in a given watershed is calculated using the following equation:
Q = P ET Δ S
where Q is the runoff, P is the precipitation (mm), ET is the actual evapotranspiration, and Δ S is the change in water storage in the basin. The Budyko hypothesis assumes that under stable water balance conditions, the water storage capacity of the watershed can be neglected on a large time scale. According to Budyko [20], ET is a function of P, ET0, and the controlling parameter ω (which represents land surface conditions). For simplicity, Fu’s equation is expressed in the following form [40]:
ET P = 1 + ET 0 P [ 1 + ( ET 0 P ) ω ] 1 / ω
or
E ET 0 = 1 + P ET 0 [ 1 + ( P ET 0 ) ω ] 1 / ω
where ω is a model parameter that is based on land cover, vegetation, soil infiltration, topography, and hydraulic properties. The water–energy coupled balance equation can be expressed in the following form:
Q = P × [ 1 + ( ET 0 P ) ω ] 1 ω ET 0
or
Q = ET 0 × [ 1 + ( P ET 0 ) ω ] 1 ω ET 0
Thus, the parameter ω in Fu’s equation can be calculated based on ET0, Q , and P, according to Equations (4) and (5).

2.3.3. Sensitivity Analysis

Based on Equations (4) and (5), the following differential forms can be used to assess the change in runoff:
dQ = Q p dp + Q E 0 dET 0 + Q ω d ω
Schaake [19] first proposed a method using climate elasticity to predict the impact of climate change on runoff and expressed the p , ET 0 , and land surface change elasticity coefficients of runoff as ε P = dQ / Q dP / P , ε ET 0 = dQ / Q dET 0 / ET 0 , and ε ω = dQ / Q d ω / ω , respectively.
In this method, = ET 0 P , ε P , ε ET 0 , and ε ω can be obtained as follows:
ε P = ( 1 + ω ) 1 / ω + 1 ω + 1 ( 1 + ω ) [ ( 1 + ω ) 1 / ω ]
ε ET O = 1 ( 1 + ω ) [ 1 ( 1 + ω ) 1 / ω ]
ε ω = ln ( 1 + ω   ) + ω ln ( 1 + ω ) ω ( 1 + ω ) [ 1 ( 1 + ω ) 1 / ω
According to Equations (7)–(9), the ε P , ε ET 0 , and ε ω elasticity coefficients of annual runoff can be deduced based on P, ET0, and land surface data, which reflect the average hydrological climate and underlying surface characteristics of the basin over many years.

2.3.4. Contribution Analysis

To differentiate between the effects of climate variability and human activities on runoff, the study period was divided into 2 subperiods: the base period (period I) and the change period (period II). According to Equation (6), the changes in mean annual runoff are caused by changes in climate and human activities, and total changes can be expressed as:
Q   ( all ) = Con ( P ) + Con ( ET 0 ) + Con ( ω )
where Q   ( all ) is the total change in annual mean runoff due to climate variability and human activities and Con ( P ) , Con ( ET 0 ) , and Con ( ω ) are the contributions of changes in P , ET 0 , and land surface, respectively, to changes in Q . The contribution of each variable to the change in runoff can be expressed as follows:
E _ Con ( P ) =   Con ( P ) Q   ( all )   ×   100 %
E _ Con ( ET 0 ) =   Con ( ET 0 ) Q   ( all )   ×   100
E _ Con ( ω ) =   Con ( ω ) Q   ( all )   ×   100 %
where E _ Con ( P ) , E _ Con ( ET 0 ) , and E _ Con ( ω ) are the percentages representing the contribution of each variable to the total decrease in runoff. These contributions can be explored and used to provide information for water resource management.

3. Results

3.1. Changes in Long-Term Hydrometeorological Variables

The Mann–Kendall trend was applied to detect the trend and significance of variables during the period 1961–2014. As indicated in Table 1, at all four hydrological stations in the WRB, the annual runoff showed a significant downward trend (at confidence levels of 0.05 (*) and 0.01 (**)). The annual runoff at LJC, XY, LT, and HX decreased by 0.45, 0.71, 0.75, and 0.83 mm yr−1, respectively, representing 2.4%, 1.9%, 1.2%, and 3.0%, respectively, of the corresponding annual runoff. In addition, the four stations showed minor downward trends in P, which decreased in LJC, XY, LT, and HX by 0.66, 0.77, 0.50, and 1.08 mm yr−1, respectively. ET0 showed an insignificant upward trend in LJC and significant decreases in XY and HX. To summarize, runoff and precipitation exhibit the same downward trend, thus indicating that climate variability may have an important impact on the reduction of runoff.
The Pettitt abrupt change point test was applied to detect the change points in the annual runoff series during the period 1961–2014 at these four hydrological stations. The results show that the abrupt changes in annual runoff at LJC, XY, and HX occurred in 1993 and at LT in 1990. These four abrupt change points are thus basically consistent, as they all occurred in the early 1990s. The entire research period was then divided into two subperiods to quantify the effects of changes in climate variability and human activities on runoff. The runoff data at the four hydrological stations before the abrupt change points exhibited a downward trend, with LJC and XY exhibiting a significant downward trend. After the abrupt change points, the runoff data exhibited an upward trend, with significant increases at XY and HX.
At all four hydrological stations, P (except at LJC) and ET0 showed a downward trend in period I, and ET0 showed a significant downward trend; in period II, P and ET0 both exhibited an increasing trend at all stations except for HX.

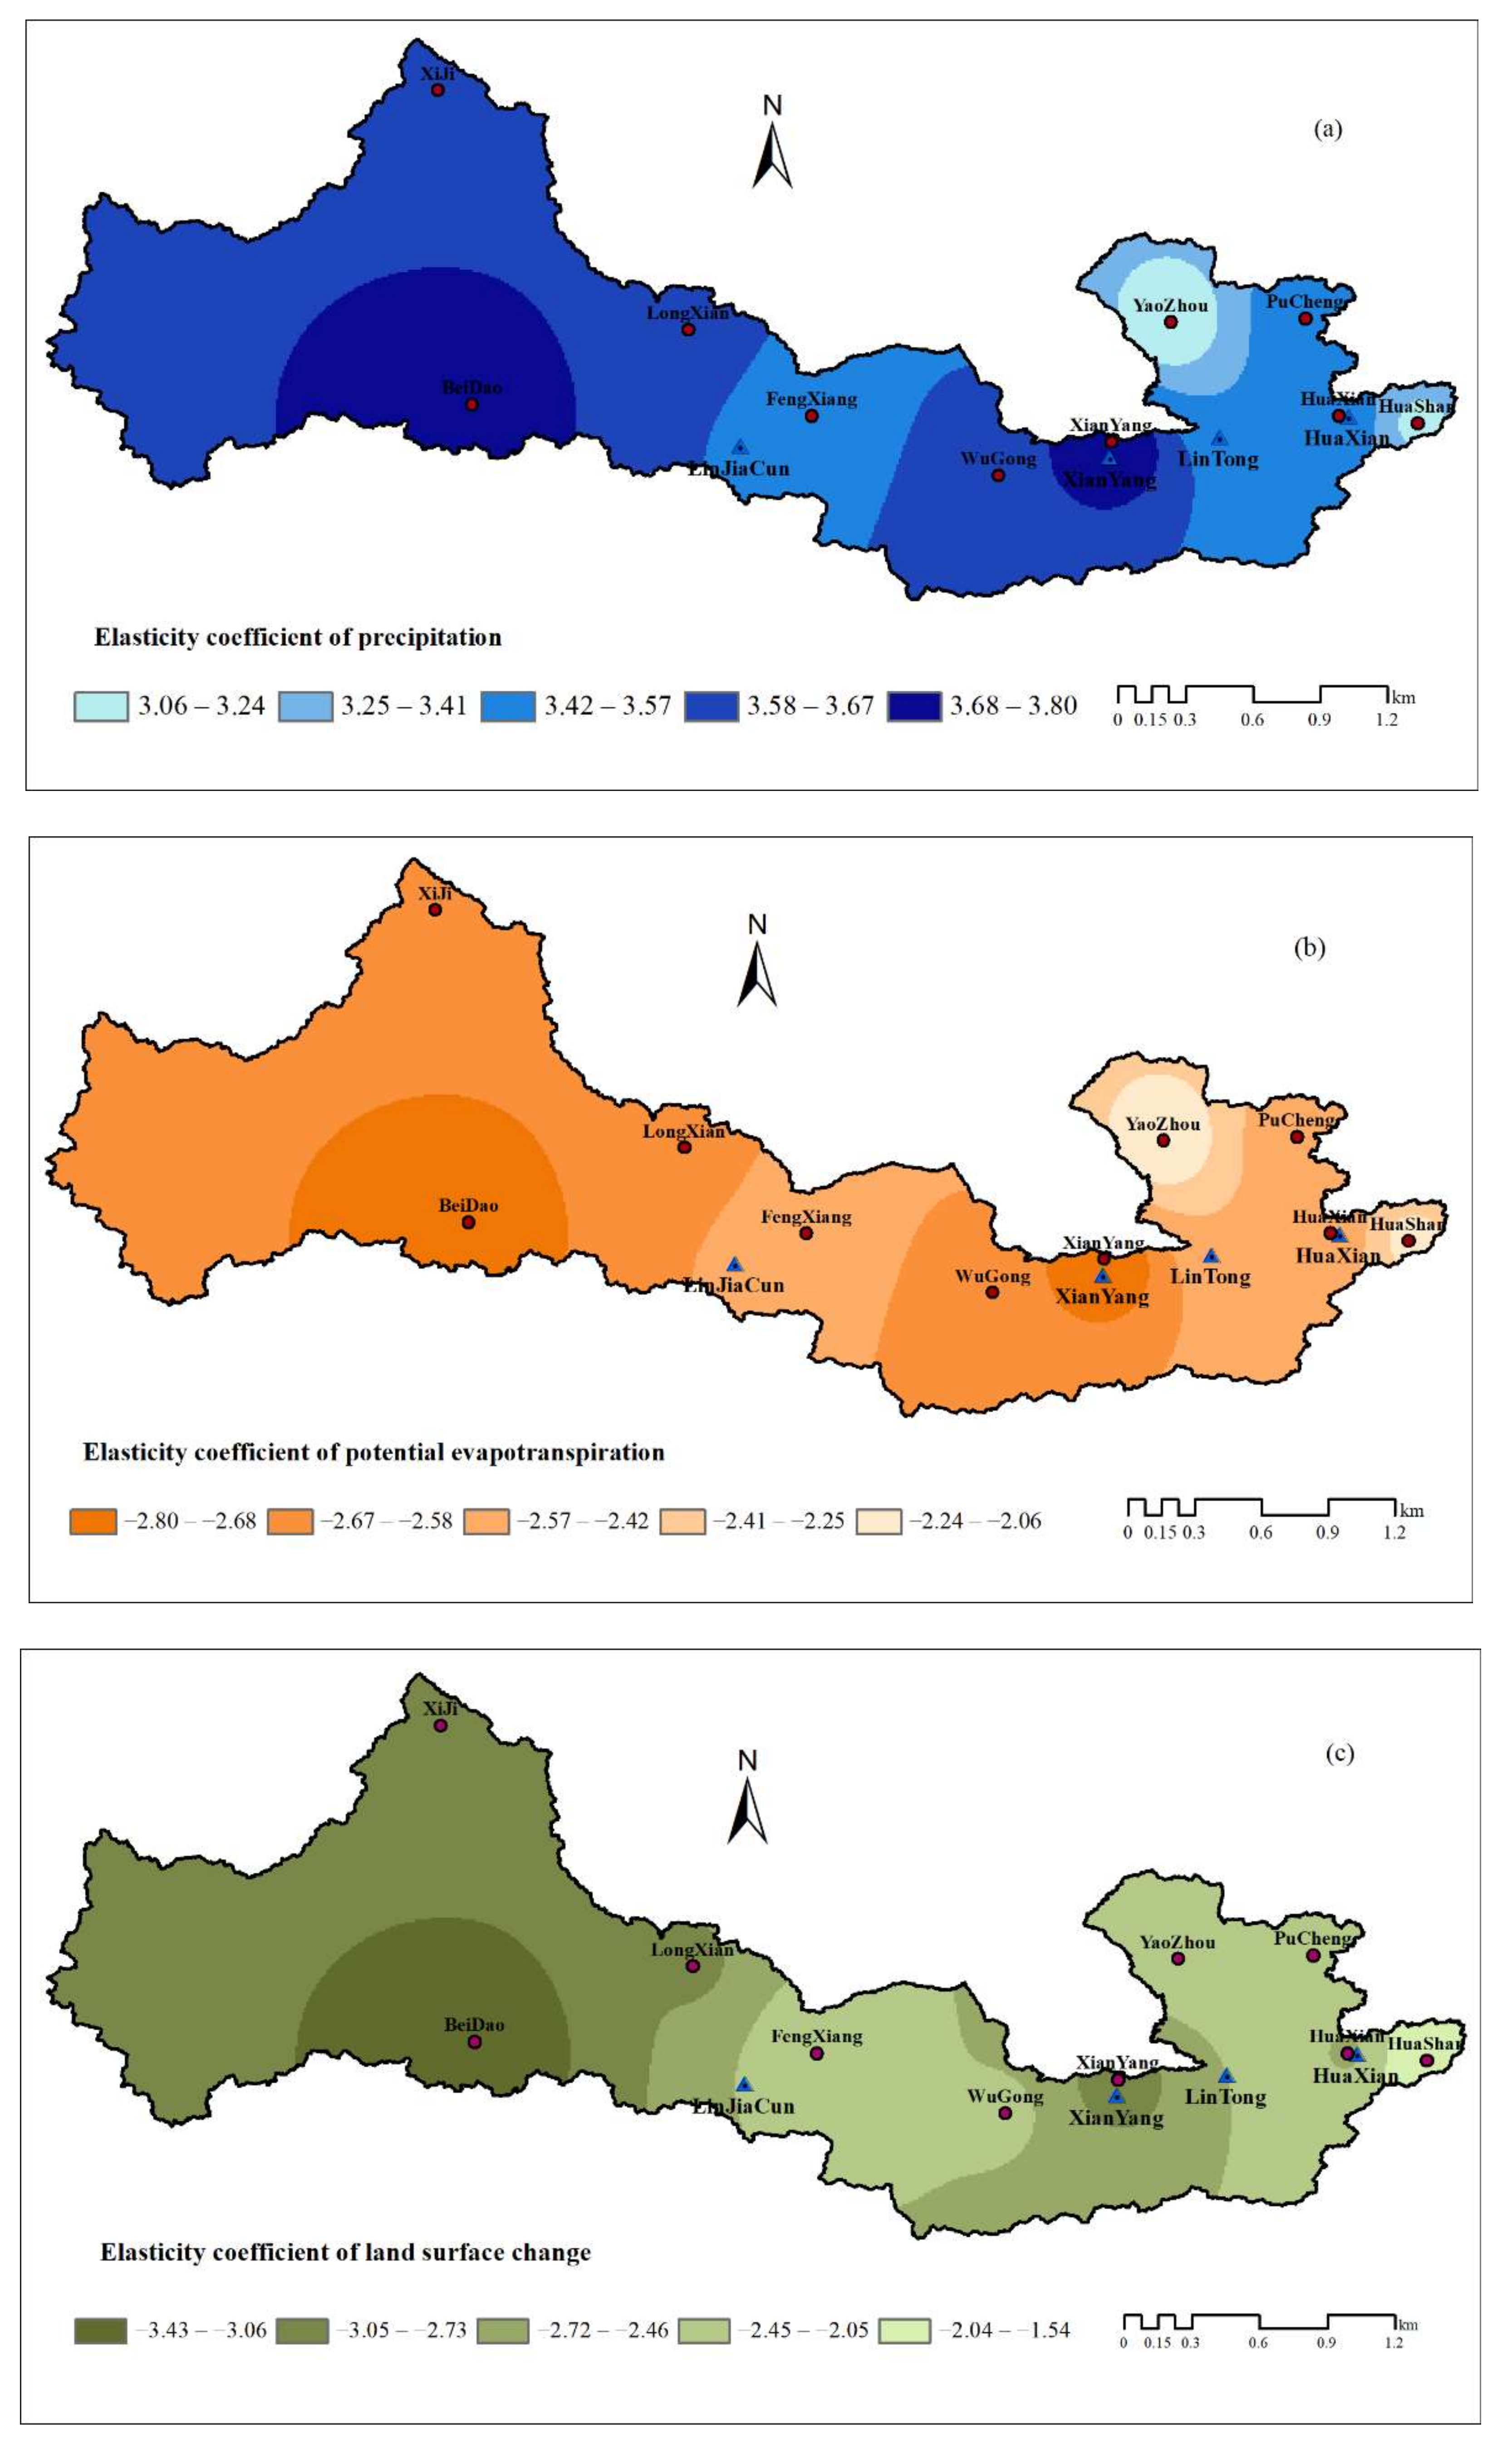
3.2. Elasticity Coefficients on Runoff

The catchment property ( ω ) characterizes the water balance parameters based on the long-term mean annual values of ET0, runoff depth, P, and the actual evapotranspiration data (E = P − Q) covering the entire period of the study (1961–2014). In Fu’s equation, the optimization problem of parameter ω is solved by using the programming solution tool in Excel to more accurately express the elasticity coefficient. As shown in Table 2, the optimal values of ω for LJC, XY, LT, and HX are 2.94, 3.10, 2.47, and 2.92, respectively.
Table 2 shows that runoff is positively correlated with P and negatively correlated with ET0 and ω ; these trends are exactly the same in each sub-basin and subperiod. The ranges of the elasticity coefficients of ET0, P, and ω are −2.08 to −2.78, 3.08 to 3.78, and −2.16 to −2.77, respectively. From these results, we can conclude that when P, ET0, and ω all decrease by 1%, the annual runoff of each typical watershed will decrease by 3.08–3.78, increase by 2.08–2.74, and increase by 2.16–2.77, respectively. The changes in the elasticity coefficient due to climate change decreased from big to small, followed by XY, LJC, HX, and LT; in contrast, the changes in the elasticity coefficient due to human activities decreased from LJC to XY, HX, and LT. The elasticity coefficients of the four hydrological stations, ET0, P, and ω were greater after than before the abrupt change. It can be seen from Figure 2 that the elasticity coefficients (P, ET0, and ω) are higher in the upstream region of ZJS and the vicinity of the XY hydrological station than in the XY and HX stations, which is consistent with the data shown in Table 2.
Figure 2 shows the annual elasticity coefficients of the four hydrological stations from 1961 to 2014; this not only shows the annual changes in the elasticity coefficients due to climate variability and land surface changes, but also reflects the spatial variability of the sensitivity of the WRB to these variables. In terms of the absolute values of the elasticity coefficients, those of climate change (ET0 and P) and land surface change (ω) in LJC, XY, and HX are higher than those in LT. The absolute value observed at the LT hydrological station is smaller than those observed at the other three stations, which may indicate that the effects of human activities at the LT station are relatively small.

3.3. Attribution Analysis of Runoff Reduction

Changes in either of these factors, i.e., climate change (P and ET0) or land surface change (ω), may lead to changes in runoff. The influence of changes in all variables on runoff was estimated using hydrological sensitivity analysis and Equations (11)–(13). Table 3 shows that from 1961 to 2014 in the WRB, the decrease in P had a positive effect on runoff, with an average contribution rate of 47.6%; ET0 and ω mainly had negative effects on runoff, with average contribution rates of 14.8% and 37.6%, respectively. Table 3 also shows that at the LJC, XY, and HX hydrological stations, the average proportions of P, ET0, and ω decreased in the order p > ω > ET0, in which the proportion of P at LJC and HX always exceeded 50%. It can be seen that in terms of the three indicators (P, ET0, ω), the change in P has the greatest effect on the change in runoff, the change in ω has an intermediate effect, and the change in ET0 has the smallest effect.
The main factors affecting the changes in runoff during periods I and II at different hydrological stations are different. At all stations except LJC, the proportions of P and ω in period II increased relative to those in period I; however, the proportions of ET0 in period I were significantly lower than those in period II. The decrease in runoff at LJC and LT for period II (the change period, i.e., 1993–2014 for LJC and 1990–2014 for LT) was controlled by changes in P (which contributed 50.51% and 52.31%, respectively). However, land surface change was the main controlling factor at XY and HX for period II (the change period, i.e., 1993–2014 for XY and HX). Based on these results, we conclude that precipitation and land surface changes were the main driving forces of the changes in runoff observed at these hydrological stations.

4. Discussion

Assessing the continuity and integrity of data is becoming a fundamental problem that cannot be ignored in data-based research. During the preparation, analysis, and presentation of data, confirming its continuity and integrity guarantees the completeness, validity, and accuracy of the results. Data from four hydrological stations and 10 meteorological stations were used in the study area; however, these data may not be sufficient to cover the Weihe River Basin, which has a drainage area of 13.5 × 10⁴ km2. This may thus limit the calculation of the PET data and the accuracy of the estimated runoff. The quantitative estimation was based on the assumption that climate variability and land surface changes are independent. However, land surfaces interact with climate systems, especially at the catchment scale [4]. The data used in the hydrological sensitivity analysis method were derived from periodic runoff data, which are not affected by long-term human activities and are thus used for calibration of the model. In the Weihe River Basin during the runoff observation period, disturbances were caused by human activities, such as the building of reservoirs and dams [41,42], which may restrict the accuracy of the observation data and model parameters. The expansion of the Taylor series based on the Budyko equation may be another cause of data uncertainty. The first-order Taylor expansion has been widely studied and used in many studies; however, with the decrease in P and increases in ET0 and ω , uncertainty in the data will increase. Therefore, eliminating this uncertainty to improve the accuracy of prediction is a key issue that needs to be resolved in future research.
Based on the Budyko equation of Fu and taking P, ET0, and Q as variables, the parameter ω was determined using the programming solution function in Excel. The precision of the hydrological model parameters can be improved by using the ω value determined by the programming solution function to better explain the accuracy of runoff reduction in the WRB. The catchment characteristic parameter ω in the Budyko equation is related to topography [43], soil [44], vegetation [45,46], and climate seasonality [47]. The land surface changes in the WRB were mainly due to the implementation of water and soil conservation and ecological restoration activities. In the short term, the soil properties and topographic changes remain unchanged, while changes in the vegetation cover and climate are considered to influence the characteristic parameter ω. The normalized difference vegetation index (NDVI) is the most widely used index to characterize vegetation coverage (V) status and can adequately reflect vegetation cover, growth vitality, and biomass. All other conditions being similar, the parameter ω of a drainage basin with a larger vegetation cover is generally larger than that of a drainage basin with smaller vegetation coverage. Generally, the average NDVI has fluctuated upward in recent decades in the WRB. The relationship between V and ω showed a similar interannual change from 1961 to 2014, which indicated that the change in vegetation had a positive effect on ω .
In addition to changes in vegetation, changes in soil and water conservation measures have significantly altered the surface, including biological measures (e.g., afforestation and pasture improvement) and engineering measures (e.g., dams, terraces, and reservoirs). For example, by the end of 2000, more than 3150 reservoirs had been built in the Yellow River Basin, including 171 large- and medium-sized reservoirs with a total capacity of 22.6 km3. A study conducted by Liang et al. [48] indicated that key dams (e.g., the LJC dam) have altered land surface changes and resulted in noticeable changes in the hydrological regime [49], which could intercept stormwater runoff for a short period during flood seasons and allow more time for infiltration [50]. Land surface changes caused by the impact of soil and water conservation measures, such as the construction of reservoirs and dams, could significantly change the availability of natural water resources in the region. Moreover, many studies have shown that climate change cannot be regarded as a unilateral phenomenon, which means that the climate drive and feedback of local infrastructure such as dams cannot be ignored. Soil and water conservation, especially the implementation of the “returning farmland to forests and grassland” policy in 1999, has thus affected the hydrological processes in this area. From 1959 to 2006, the terraced field area increased from 5.30 to 285.40 104 km2, and the growth rate has only increased since then. Zhang et al. [51] previously showed that the conversion of sloping farmland to terraces can result in a significant decrease in runoff. It can be seen that the implementation of soil and water conservation measures has achieved significant ecological benefits and has had temporal and spatial effects on hydrological processes in recent years; however, these measures are also one of the most important reasons for the decrease in runoff.
Due to the high-scale dependence of runoff on rainfall, the impact of land surface change has been limited; however, climate change has been the main driving force of large-scale changes [12]. Table 3 shows that the relationship between runoff, average annual precipitation, and ω was relatively close and that this change has exhibited good consistency in the WRB. The runoff values of almost all hydrological stations in the WRB obviously decreased in the 1990s; in terms of climate change, runoff was more sensitive to changes in precipitation than it was to changes in potential evapotranspiration. Zuo et al. [52] concluded that the impacts of climate variability and land surface changes on runoff were 31%–51% and 33%–65%, respectively, which is consistent with the results obtained in this study. The WRB contains rainfall-recharge rivers, thus changes in its precipitation-runoff have continually been a focus of scholars. However, as can be seen in Table 3, whether in the total period or in the subperiod, the proportion of ω is always relatively small (i.e., below 50%). There is no significant relationship between ω and V. At the four hydrological stations, the proportion of ω was greater than that before the abrupt change (i.e., the abrupt change for LJC, XY, and HX occurred in 1993 and at LT occurred in 1990). Previous studies have proposed that the best vegetation in the WRB occurred in 1990, indicating that the ecological environment there generally improved from the 1980s to the 1990s. In 2000, V (vegetation coverage) was significantly worse than it was in other years, but it improved from 2000 to 2005; nevertheless, there was a small decline in 2007. Generally speaking, the average V value has fluctuated upward in recent decades in the WRB.
When comparing period I and period II (in Table 3), P and ω increased almost at all stations in period II, which may be due to the fact that the ω part represents the V value, and with the increase of V, the precipitation significantly increased. Wang et al. [11] concluded that the contribution of climate variability and land surface change to runoff evolution temporally varies, which is in line with the results of periods I and II. This has considerable significance for water resources utilization management. The traditional water management strategies do not adequately take into account hydrological regime changes over time, especially changes in climatic conditions. Climate variability also greatly impacts stakeholders, e.g., farming households and government decision makers. Stakeholders, in return, deal with climate variability in a host of ways, e.g., with water use rights and regulations. Incorporating climate variability puts forward new thinking on the development of water resources [9,53]. Changes in climate conditions alter the processes of the hydrological cycle and affect the structure of the water resources system, bringing new challenges to the development and utilization of water resources worldwide. Consequently, we recommend that adaptive management of water resources should be implemented to match environmental changes. Adaptive management enables regional river and reservoir systems to sustain and even strengthen the interests of all stakeholders in the context of climate change [54]. Finally, through the implementation of a strict water resources management system, adaptive countermeasures including extensive development of water resources could be achieved.

5. Conclusions

The annual changes in climate variability and land surfaces in the WRB are based on data collected from meteorological and hydrologic stations from 1961 to 2014, and quantitative analysis of the contributions of runoff change can be an effective part of the water management of the Loess Plateau. Taking stations LJC, XY, LT, and HX as examples, the runoff data were analyzed by trend analysis and the mutation point test, and the entire period was divided into two subperiods (base period and change period). The elasticity coefficient method, which is based on the Budyko framework, was used in this study. The runoff data of all hydrological stations showed a significant downward trend. The abrupt change points of the four stations were basically consistent and occurred in the early 1990s. Runoff was positively correlated with precipitation and negatively correlated with potential evapotranspiration and ω , which were exactly the same in each sub-basin and subperiod. Three indicators (P, ET0, ω) contribute the most to changes in runoff; the change in P has the largest contribution, the change in ω has an intermediate contribution, and the change in ET0 has the smallest contribution. The proportion of land surface change is relatively small, owing partly to the construction of soil and water conservation facilities, such as check dams and terraces, and partly to the measures of returning farmland to forests and grassland.
Two avenues should be explored in future research. For one thing, the empirical formula of parameter ω should be calculated through a stepwise regression analysis, and subsequently, mean annual and interannual changes should be predicted. Such measures would ultimately propose a universal equation of to apply to different watersheds, providing a powerful tool for assessing water–energy balance using the Budyko hypothesis. For another, during the snowy season, a warming climate may lead to less precipitation in the form of snow, which not only alters the temporal distribution of annual runoff, but also leads to a reduction in the total annual runoff. Therefore, the effect of snow on runoff as well as its related process on the catchment scale will be discussed. How snow couples with the Budyko hypothesis needs to be answered in future research.

Author Contributions

J.S. contributed to conceiving and designing the research; W.D. and M.Y. analyzed the data; H.B. and H.W. contributed analysis tools; Y.H. and D.C. provided some guiding suggestions; W.D. wrote the paper.

Funding

This study was jointly supported by the National Natural Science Foundation of China (Grant Nos. 51679200 and 51379175), the Hundred Talents Project of the Chinese Academy of Sciences (Grant No. A315021406), the National Key R&D Program on Monitoring, Early Warning, and Prevention of Major Natural Disasters (Grant No. 2017YFC1502506), and the Program for Key Science and Technology Innovation Team in Shaanxi Province (Grant No. 2014KCT-27). Part of the data were provided by the Science Data Centre of Loess Plateau from the National Data Sharing Infrastructure of Earth System Science.

Acknowledgments

We are grateful to the editor and anonymous reviewers who provided numerous comments and suggestions, resulting in an improved manuscript.

Conflicts of Interest

The authors declare no conflict of interest.

References

  1. Hao, X.; Chen, Y.; Xu, C.; Li, W. Impacts of climate change and human activities on the surface runoff in the Tarim River Basin over the last fifty years. Water Resour. Manag. 2007, 22, 1159–1171. [Google Scholar] [CrossRef]
  2. Murray, S.J.; Foster, P.N.; Prentice, I.C. Evaluation of global continental hydrology as simulated by the land-surface processes and exchanges Dynamic Global Vegetation Model. Hydrol. Earth Syst. Sci. 2011, 15, 91–105. [Google Scholar] [CrossRef]
  3. Zhang, X.; Zhang, L.; Zhao, J.; Rustomji, P.; Hairsine, P. Responses of streamflow to changes in climate and land use/cover in the Loess Plateau, China. Water Resour. Res. 2008, 44. [Google Scholar] [CrossRef] [Green Version]
  4. Zheng, H.; Zhang, L.; Zhu, R.; Liu, C.; Sato, Y.; Fukushima, Y. Responses of streamflow to climate and land surface change in the headwaters of the Yellow River Basin. Water Resour. Res. 2009, 45. [Google Scholar] [CrossRef] [Green Version]
  5. Dore, M.H. Climate change and changes in global precipitation patterns: What do we know? Environ. Int. 2005, 31, 1167–1181. [Google Scholar] [CrossRef] [PubMed]
  6. Yang, D.; Sun, F.; Liu, Z.; Cong, Z.; Ni, G.; Lei, Z. Analyzing spatial and temporal variability of annual water-energy balance in nonhumid regions of China using the Budyko hypothesis. Water Resour. Res. 2007, 43, 436–451. [Google Scholar] [CrossRef]
  7. Li, L.; Zhang, L.; Wang, H.; Wang, J.; Yang, J.; Jiang, D.; Li, J.; Qin, D. Assessing the impact of climate variability and human activities on streamflow from the Wuding River Basin in China. Hydrol. Process. 2007, 21, 3485–3491. [Google Scholar] [CrossRef]
  8. Zhao, G.; Tian, P.; Mu, X.; Jiao, J.; Wang, F.; Gao, P. Quantifying the impact of climate variability and human activities on streamflow in the middle reaches of the Yellow River basin, China. J. Hydrol. 2014, 519, 387–398. [Google Scholar] [CrossRef]
  9. Akiyama, T.; Kharrazi, A.; Li, J.; Avtar, R. Agricultural water policy reforms in China: A representative look at Zhangye City, Gansu Province, China. Environ Monit Assess. 2018, 190, 9. [Google Scholar] [CrossRef] [PubMed]
  10. Zhang, L.; Podlasly, C.; Ren, Y.; Feger, K.; Wang, Y.; Schwӓrzel, K. Separating the effects of changes in land management and climatic conditions on long-term streamflow trends analyzed for a small catchment in the Loess Plateau region, NW China. Hydrol. Process. 2014, 28, 1284–1293. [Google Scholar] [CrossRef]
  11. Wang, S.; Zhang, Z.; McVicar, T.R.; Guo, J.; Tang, Y.; Yao, A. Isolating the impacts of climate change and land use change on decadal streamflow variation: Assessing three complementary approaches. J. Hydrol. 2013, 507, 63–74. [Google Scholar] [CrossRef]
  12. Xu, J. Variation in annual runoff of the Wudinghe River as influenced by climate change and human activity. Q. Int. 2011, 244, 230–237. [Google Scholar] [CrossRef]
  13. Zhan, C.; Jiang, S.; Sun, F.; Jia, Y.; Niu, C.; Yue, W. Quantitative contribution of climate change and human activities to runoff changes in the Wei River basin, China. Hydrol. Earth Syst. Sci. 2014, 18, 3069–3077. [Google Scholar] [CrossRef] [Green Version]
  14. Bronstert, A.; Niehoff, D.; Bürger, G. Effects of climate and land-use change on storm runoff generation: Present knowledge and modelling capabilities. Hydrol. Process. 2002, 16, 509–529. [Google Scholar] [CrossRef]
  15. Sankarasubramanian, A.; Vogel, R.M.; Limbrunner, J.F. Climate elasticity of streamflow in the United States. Water Resour. Res. 2001, 37, 1771–1781. [Google Scholar] [CrossRef] [Green Version]
  16. Ma, Z.; Kang, S.; Zhang, L.; Tong, L.; Su, X. Analysis of impacts of climate variability and human activity on streamflow for a river basin in arid region of northwest China. J. Hydrol. 2008, 352, 239–249. [Google Scholar] [CrossRef]
  17. Zhang, L.; Zhao, F.; Chen, Y.; Dixon, R.N.M. Estimating effects of plantation expansion and climate variability on streamflow for catchment in Australia. Water Resour. Res. 2011, 47. [Google Scholar] [CrossRef]
  18. Zhang, Y.; Guan, D.; Jin, C.; Wang, A.; Wu, J.; Yuan, F. Analysis of impacts of climate variability and human activity on streamflow for a river basin in northeast China. J. Hydrol. 2011, 410, 239–247. [Google Scholar] [CrossRef]
  19. Vogel, R.M.; Wilson, I.; Daly, C. Regional regression models of annual streamflow for the United States. J. Irrig. Drain Eng. 1999, 125, 148–157. [Google Scholar] [CrossRef]
  20. Zhao, Y.; Zou, X.; Gao, J.; Xu, X.; Wang, C.; Tang, D.; Wang, T.; Wu, X. Quantifying the anthropogenic and climate contributions to changes in water discharge and sediment load into the sea: A case study of the Yangtze River, China. Sci. Total Environ. 2015, 536, 803–812. [Google Scholar] [CrossRef]
  21. Schaake, J.C. From climate to flow. In Climate Change and U.S. Water Resources; Waggoner, P.E., Ed.; John Wiley: New York, NY, USA, 1990; pp. 177–206. [Google Scholar]
  22. Budyko, M.I. Climate and Life; Academic Press: New York, NY, USA, 1974. [Google Scholar]
  23. Dooge, J.C. Sensitivity of runoff to climate change: A Hortonian approach. Bull. Am. Meteorol. Soc. 1992, 73, 2013–2024. [Google Scholar] [CrossRef]
  24. Milly, P.C.D.; Dunne, K.A. Macroscale water fluxes 2. Water and energy supply control of their interannual variability. Water Resour. Res. 2002, 38, 1287–1295. [Google Scholar] [CrossRef]
  25. Yokoo, Y.; Sivapalan, M.; Oki, T. Investigating the roles of climate seasonality and landscape characteristics on mean annual and monthly water balances. J. Hydrol. 2008, 357, 255–269. [Google Scholar] [CrossRef]
  26. Gao, G.; Fu, B.; Wang, S.; Liang, W.; Jiang, X. Determing the hydrological responses to climate variability and land use/cover change in the Loess Plateau with the Budyko framework. Sci. Total Environ. 2016, 557–558, 331–342. [Google Scholar] [CrossRef] [PubMed]
  27. Onstad, C.A.; Jamieson, D.G. Modeling the effect of land use modifications on runoff. Water Resour. Res. 1970, 6, 1287–1295. [Google Scholar] [CrossRef]
  28. Serpa, D.; Nunes, J.P.; Santos, J.; Sampaio, E.; Jacinto, R.; Veiga, S.; Lima, J.C.; Mpreira, M.; Corte-Real, J.; Keizer, J.J.; et al. Impacts of climate and land use changes on the hydrological and erosion processes of two contrasting Mediterranean catchments. Sci. Total Environ. 2015, 538, 64–77. [Google Scholar] [CrossRef] [PubMed] [Green Version]
  29. Buendia, C.; Bussi, G.; Tuset, J.; Vericat, D.; Sabater, S.; Palau, A.; Batalla, R.J. Effects of afforestation on runoff and sediment load in an upland Mediterranean catchment. Sci. Total Environ. 2015, 540, 144–157. [Google Scholar] [CrossRef]
  30. Lü, H.; Hou, T.; Horton, R.; Zhu, Y.; Chen, X.; Jia, Y.; Wang, W.; Fu, X. The streamflow estimation using the Xinan jiang rainfall runoff model and dual state-parameter estimation method. J. Hydrol. 2013, 480, 102–114. [Google Scholar] [CrossRef]
  31. Wang, W.; Shao, Q.; Yang, T.; Peng, S.; Xing, W.; Sun, F.; Luo, Y. Quantitative assessment of the impact of climate variability and human activities on runoff changes: A case study in four catchments of the Haihe River Basin, China. Hydrol. Process. 2013, 27, 1158–1174. [Google Scholar] [CrossRef]
  32. Song, J.; Xu, Z.; Hui, Y.; Li, H.; Li, Q. Instream flow requirements for sediment transport in the lower Weihe River. Hydrol. Process. 2010, 24, 3547–3557. [Google Scholar] [CrossRef]
  33. Huang, S.; Hou, B.; Chang, J.; Huang, Q.; Chen, Y. Spatial-temporal change in precipitation patterns based on the cloud model across the Wei river basin, China. Theor. Appl. Climatol. 2014, 120, 391–401. [Google Scholar] [CrossRef]
  34. Zhu, Y.; Huang, S.; Chang, J.; Leng, G. Spatial–temporal changes in potential evaporation patterns based on the Cloud model and their possible causes. Stoch. Environ. Res. Risk Assess 2017, 31, 2147–2158. [Google Scholar] [CrossRef]
  35. Liu, S.; Huang, S.; Huang, Q.; Xie, Y.; Leng, G.; Luan, J.; Song, X.; Wei, X.; Li, X. Identification of the non-stationarity of extreme precipitation events and correlations with large-scale ocean-atmospheric circulation patterns: A case study in the Wei River Basin, China. J. Hydrol. 2017, 548, 184–195. [Google Scholar] [CrossRef]
  36. Allen, R.G.; Pereira, L.S.; Raes, D.; Smith, M. Crop Evapotranspiration: Guidelines for Computing Crop Water Requirements; Food and Agriculture Organization: Rome, Italy, 1998. [Google Scholar]
  37. Mann, H.B. Non-parametric test against trend. Econometrica 1945, 13, 245–259. [Google Scholar] [CrossRef]
  38. Kendall, M.G. Rank Correlation Measures; Charles Griffin: London, UK, 1975. [Google Scholar]
  39. Pettitt, A. A nonparametric approach to the change-point problem. Appl. Stat. 1979, 28, 126–135. [Google Scholar] [CrossRef]
  40. Fu, B.P. The calculation of the evaporation from land surface. Sci. Atmos. Sin. 1981, 5, 23–31. [Google Scholar]
  41. Chen, J.; Wang, F.; Meybeck, M.; He, D.; Xia, X.; Zhang, L. Spatial and temporal analysis of water chemistry records (1958–2000) in the Huanghe (Yellow River) basin. Glob. Biogeochem. Cycles 2005, 19. [Google Scholar] [CrossRef]
  42. Wang, H.; Yang, S.; Saito, Y.; Liu, P.; Sun, X. Interannual and seasonal variation of the Huanghe (Yellow River) water discharge over the past 50 years: Connections to impacts from ENSO events and dams. Glob. Planet. Chang. 2006, 50, 212–225. [Google Scholar] [CrossRef]
  43. Yang, H.; Qi, J.; Xu, X.; Yang, D.; Lv, H. The regional variation in climate elasticity and climate contribution to runoff across China. J. Hydrol. 2014, 517, 607–616. [Google Scholar] [CrossRef]
  44. Price, K. Effects of watershed topography, soils, land use and climate on baseflow in humid regions: A review. Prog. Phys. Geogr. 2011, 35, 465–492. [Google Scholar] [CrossRef]
  45. Donohue, R.J.; Roderick, M.L.; McVicar, T.R. On the importance of including vegetation dynamics in Budyko’s hydrological model. Hydrol. Earth Syst. Sci. Discuss. 2006, 3, 1517–1551. [Google Scholar] [CrossRef]
  46. Li, D.; Pan, M.; Cong, Z.; Zhang, L.; Wood, E. Vegetation control on water and energy balance within the Budyko framework. Water Resour. Res. 2013, 49, 969–976. [Google Scholar] [CrossRef] [Green Version]
  47. Ning, T.; Li, Z.; Liu, W. Vegetation dynamics and climate seasonality jointly control the interannual catchment water balance in the Loess plateau under the Budyko framework. Hydrol. Earth Syst. Sci. 2017, 21, 1515–1526. [Google Scholar] [CrossRef]
  48. Liang, W.; Bai, D.; Wang, F.; Fu, B.; Yan, J.; Wang, S.; Yang, Y.; Long, D.; Feng, M. Quantifying the impacts of climate change and ecological restoration on streamflow changes based on a Budyko hydrological model in China’s Loess Plateau. Water Resour. Res. 2015, 51, 6500–6519. [Google Scholar] [CrossRef]
  49. Mu, X.; Zhang, L.; McVicar, T.; Chille, B.; Gau, P. Analysis of the impact of conservation measures on stream flow regime in catchments of the Loess Plateau, China. Hydrol. Process. 2007, 21, 2124–2134. [Google Scholar] [CrossRef]
  50. Polyakov, V.; Nichols, M.; McClaran, M.; Nearing, M. Effect of check dams on runoff, sediment yield, and retention on small semiarid watersheds. J. Soil Water Conserv. 2014, 69, 414–421. [Google Scholar] [CrossRef]
  51. Zhang, L.; Podlasly, C.; Feger, K.; Wang, Y.; Schwaerzel, K. Different land management measures and climate change impacts on the runoff—A simple empirical method derived in a mesoscale catchment on the Loess Plateau. J. Arid Environ. 2015, 120, 42–50. [Google Scholar] [CrossRef]
  52. Zuo, D.; Xu, Z.; Wu, W.; Zhao, J.; Zhao, F. Identification of streamflow response to climate change and human activities in the Wei river basin, China. Water Resour. Manag. 2014, 28, 833–851. [Google Scholar] [CrossRef]
  53. Urcola, H.; Elverdin, J.; Mosciaro, M.; Albaladejo, C.; Manchado, J.; Giussepucci, J. Climate change impacts on rural societies: Stakeholders perceptions and adaptation strategies in Buenos Aires, Argentina. In Innovation & Sustainable Development in Agriculture & Food; FRA: Montpellier, France, 2010; pp. 489–492. [Google Scholar]
  54. Georgakakos, K.; Graham, N.; Cheng, F.; Spencer, C.; Shamir, E.; Georgakakos, A.; Yao, H.; Kistenmacher, M. Value of adaptive water resources management in northern California under climatic variability and change: Dynamic hydroclimatology. J. Hydrol. 2012, 412–413, 47–65. [Google Scholar] [CrossRef]
Figure 1. Geographic location of Weihe River basin and its hydrological and meteorological stations.
Water 10 01792 g001
Figure 2. Spatial variation characteristics of the elasticity coefficient of runoff in the Weihe River Basin: elasticity coefficient of (a) precipitation; (b) potential evapotranspiration; (c) land surface change.
Water 10 01792 g002
Table 1. Averages and slope of runoff (R), precipitation (P), and potential evotranspiration (ET0) in the Weihe River basin during 1961–2014. LJC, Lin Jia Cun; XY, Xian Yang; LT, Lin Tong; HX, Hua Xian.
LJCXYLTHX
Period I 1961–1992Period II 1993–2014WholePeriod I 1961–1992Period II 1993–2014WholePeriod I 1961–1989Period II 1990–2014WholePeriod I 1961–1992Period II 1993–2014Whole
R (mm yr−1)Average25.212810.461419.20347.411923.609837.714777.51149.647664.611377.552845.929564.6693
Slope−0.40782 *0.14971−0.45334 **−0.85665 *0.94667 **−0.708 **−0.999520.68827−0.75 **−0.964861.3153 *−0.83407 **
P (mm yr−1)Average543.6715508.4231529.311576.6696531.1751558.1348574.4519535.9655556.6342606.7371551.992584.4335
Slope0.264934.375−0.66121−0.232576.8705 *−0.76634−0.307653.8812−0.49851−0.532986.001 *−1.0773
ET0 (mm yr−1)Average952.904976.4785962.5085976.0936968.8985973.1623988.01995.2711991.37161020.12511013.6781017.4987
Slope−2.6822 *1.20680.23939−4.4722 **−0.40235−1.2491 *−3.2497 *1.9376−0.054167−4.3096 **−1.6731−1.175 *
* p < 0.05; ** p < 0.01.
Table 2. Elasticity coefficients of runoff to climate variability and land surface change; the best calibration value of ω.
StationωPeriodεET0εPεω
LJC2.94Whole−2.623.62−2.60
1961–1992−2.583.58−2.49
1993–2014−2.663.66−2.77
XY3.10Whole−2.743.74−2.59
1961–1992−2.713.71−2.49
1993–2014−2.783.78−2.74
LT2.47Whole−2.113.11−2.25
1961–1989−2.083.08−2.16
1990–2014−2.143.14−2.35
HX2.92Whole−2.563.56−2.47
1961–1992−2.533.53−2.36
1993–2014−2.613.61−2.64
Table 3. Contributions of P, ET0, and ω to changes in runoff.
StationPeriodRC_(P) (%)RC_(ET0) (%)RC_(ω) (%)
LJCPeriod I1961–19929.3839.0551.58
Period II1993–201450.515.2744.22
Whole1961–201451.767.4640.78
XYPeriod I1961–19925.646.4647.94
Period II1993–201447.721.1351.15
Whole1961–201437.5825.7436.68
LTPeriod I1961–198912.0750.0737.87
Period II1990–201452.319.5938.1
Whole1961–201447.611.9750.42
HXPeriod I1961–198914.2249.0236.76
Period II1993–201443.514.7751.71
Whole1961–201453.3224.0222.66

