Quantifying the Impact of Climate Change and Human Activities on Streamflow in a Semi-Arid Watershed with the Budyko Equation Incorporating Dynamic Vegetation Information


Abstract
1. Introduction
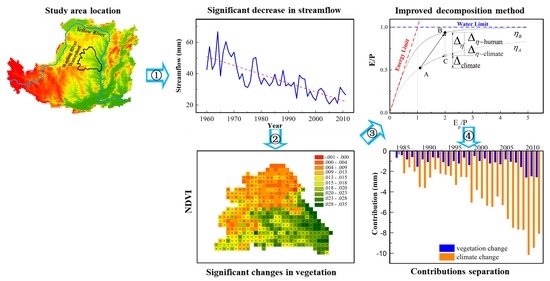
2. Methods
2.1. Budyko Parameter Estimation
2.2. Quantifying the Contributions of Different Factors to Streamflow Changes
2.3. Calculation of Vegetation Fraction and Relative Infiltration Capacity
3. Study Area and Data Sources
3.1. Study Area
3.2. Data Sources
3.2.1. Hydrometeorological Data
3.2.2. Digital Elevation Model (DEM) and Soil Data
3.2.3. Satellite Remote Sensing Data
4. Results
4.1. Hydrometeorological Trends Analysis
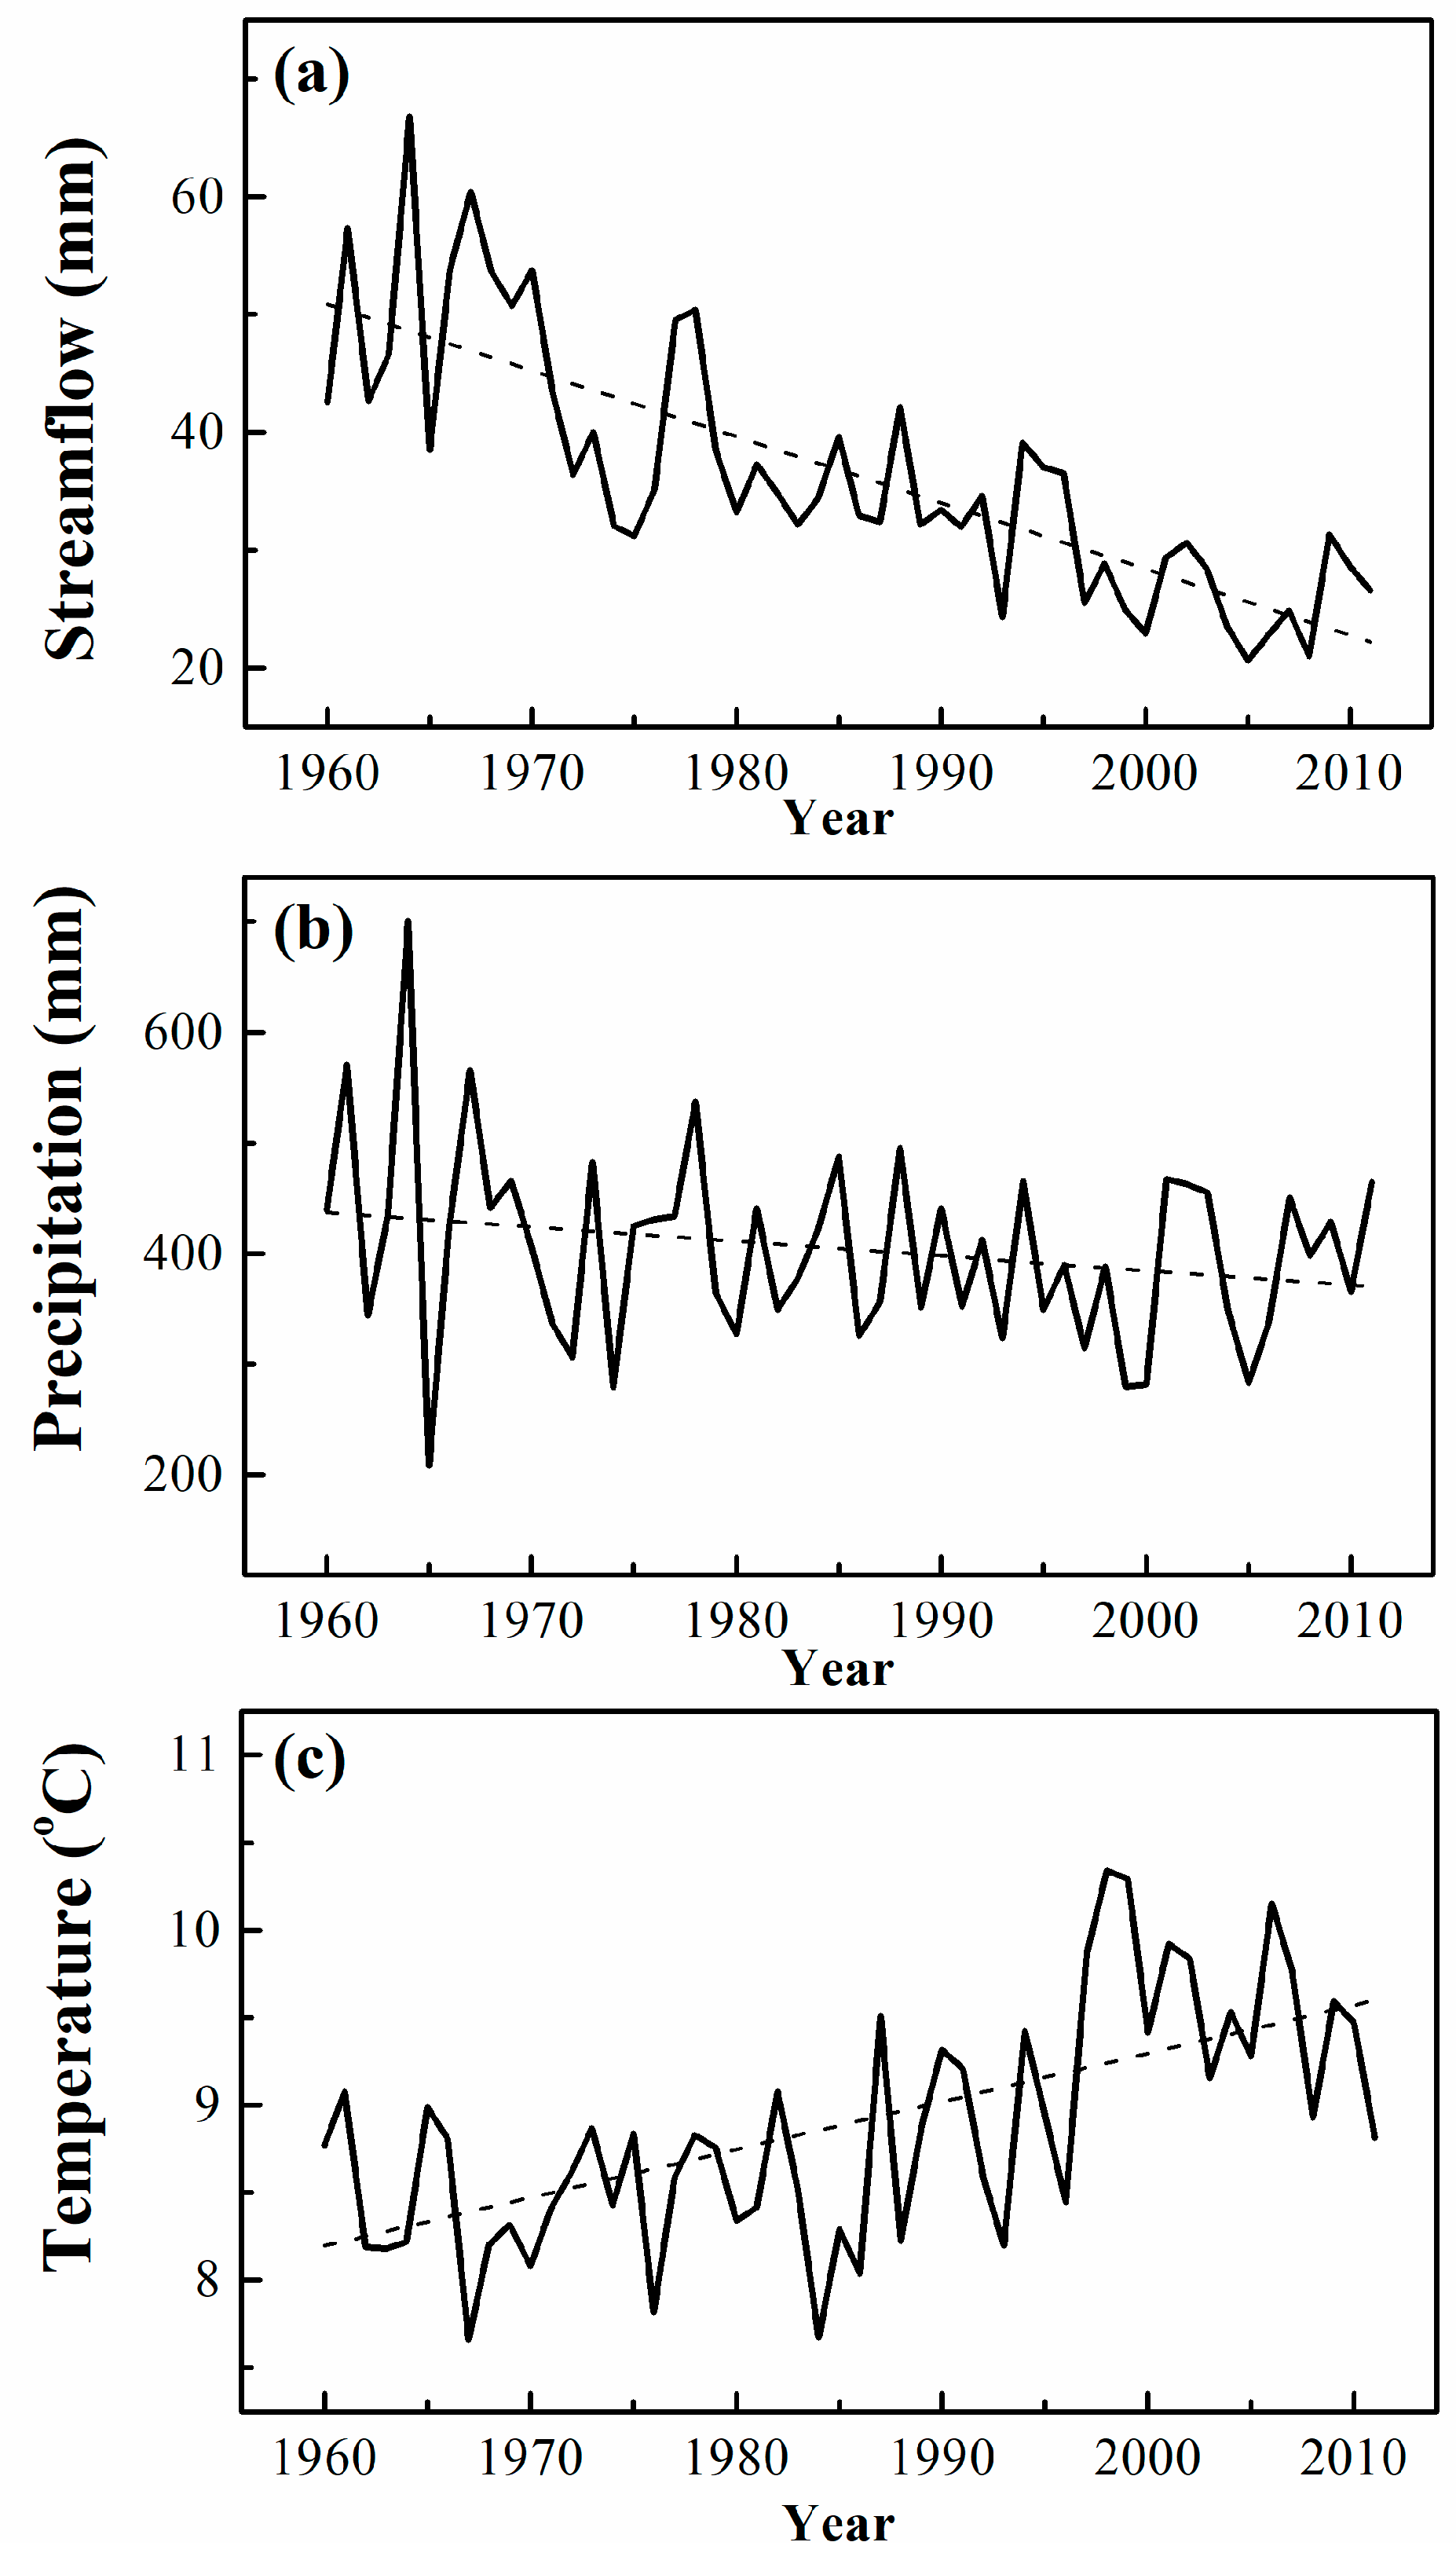
4.1.1. Temporal Trends of Streamflow
4.1.2. Temporal Trends of Precipitation and Temperature
4.2. Determination of Timescale in the Budyko Equation
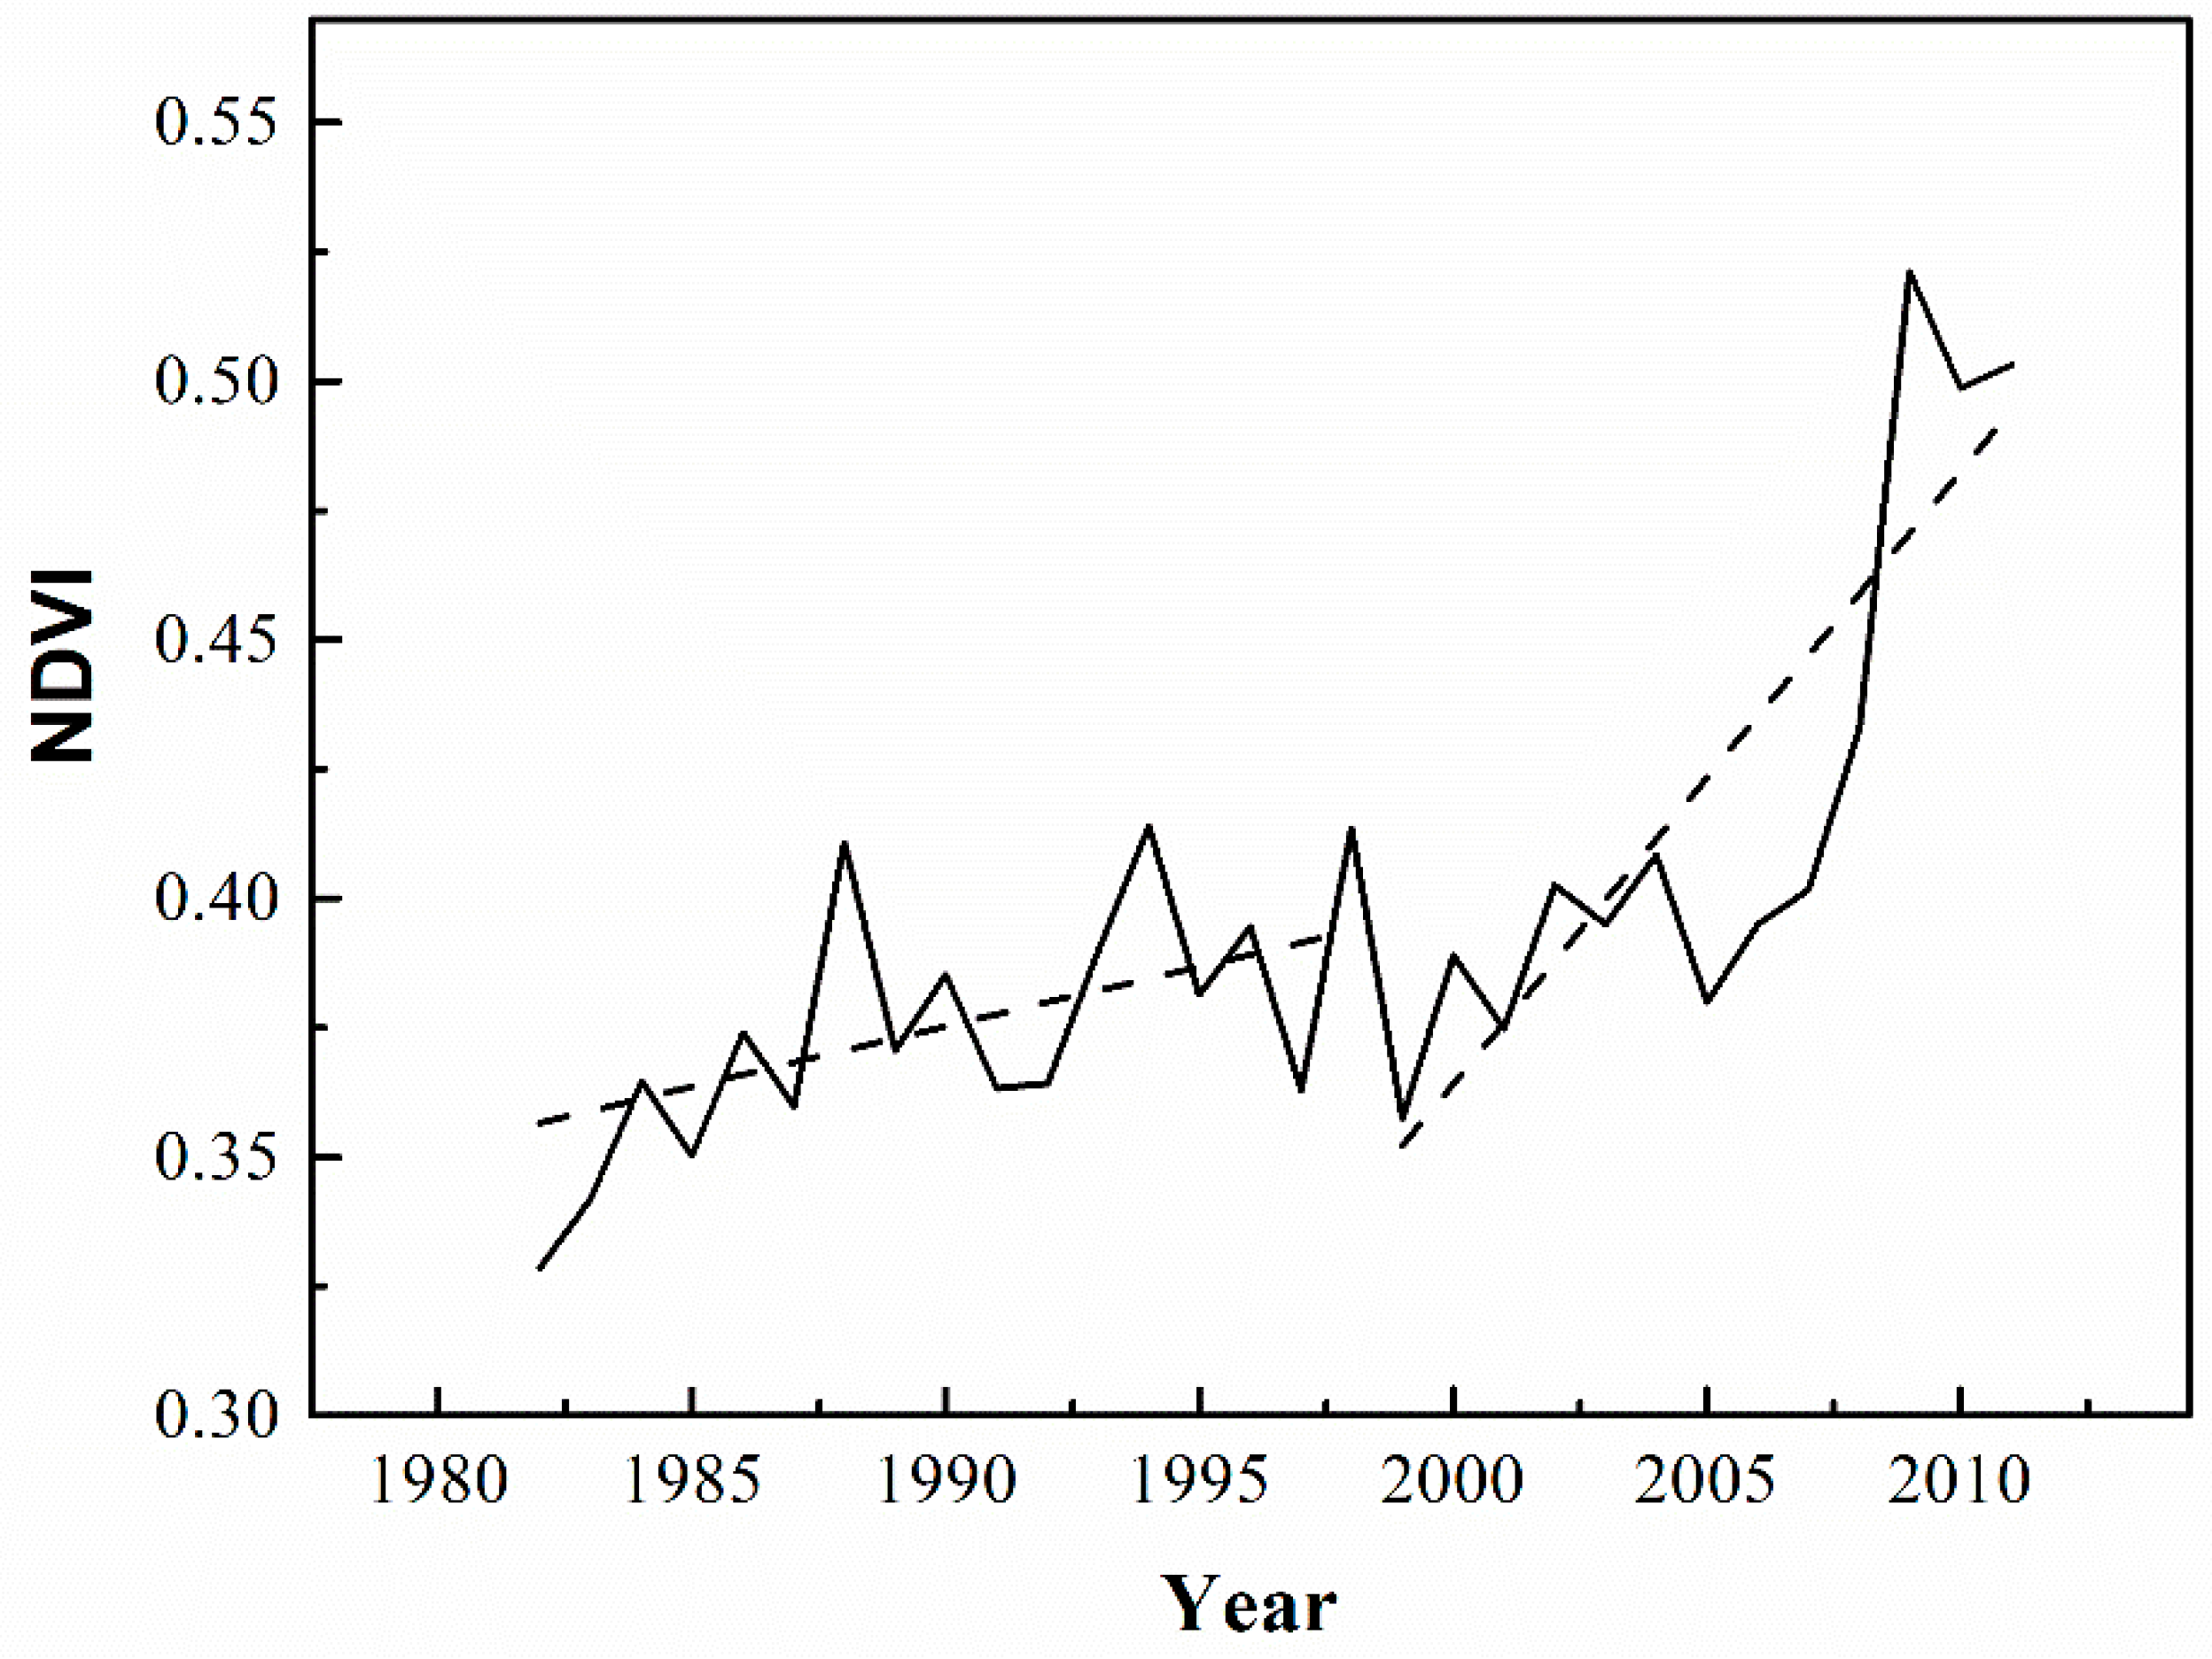
4.3. Temporospatial Changes in Vegetation
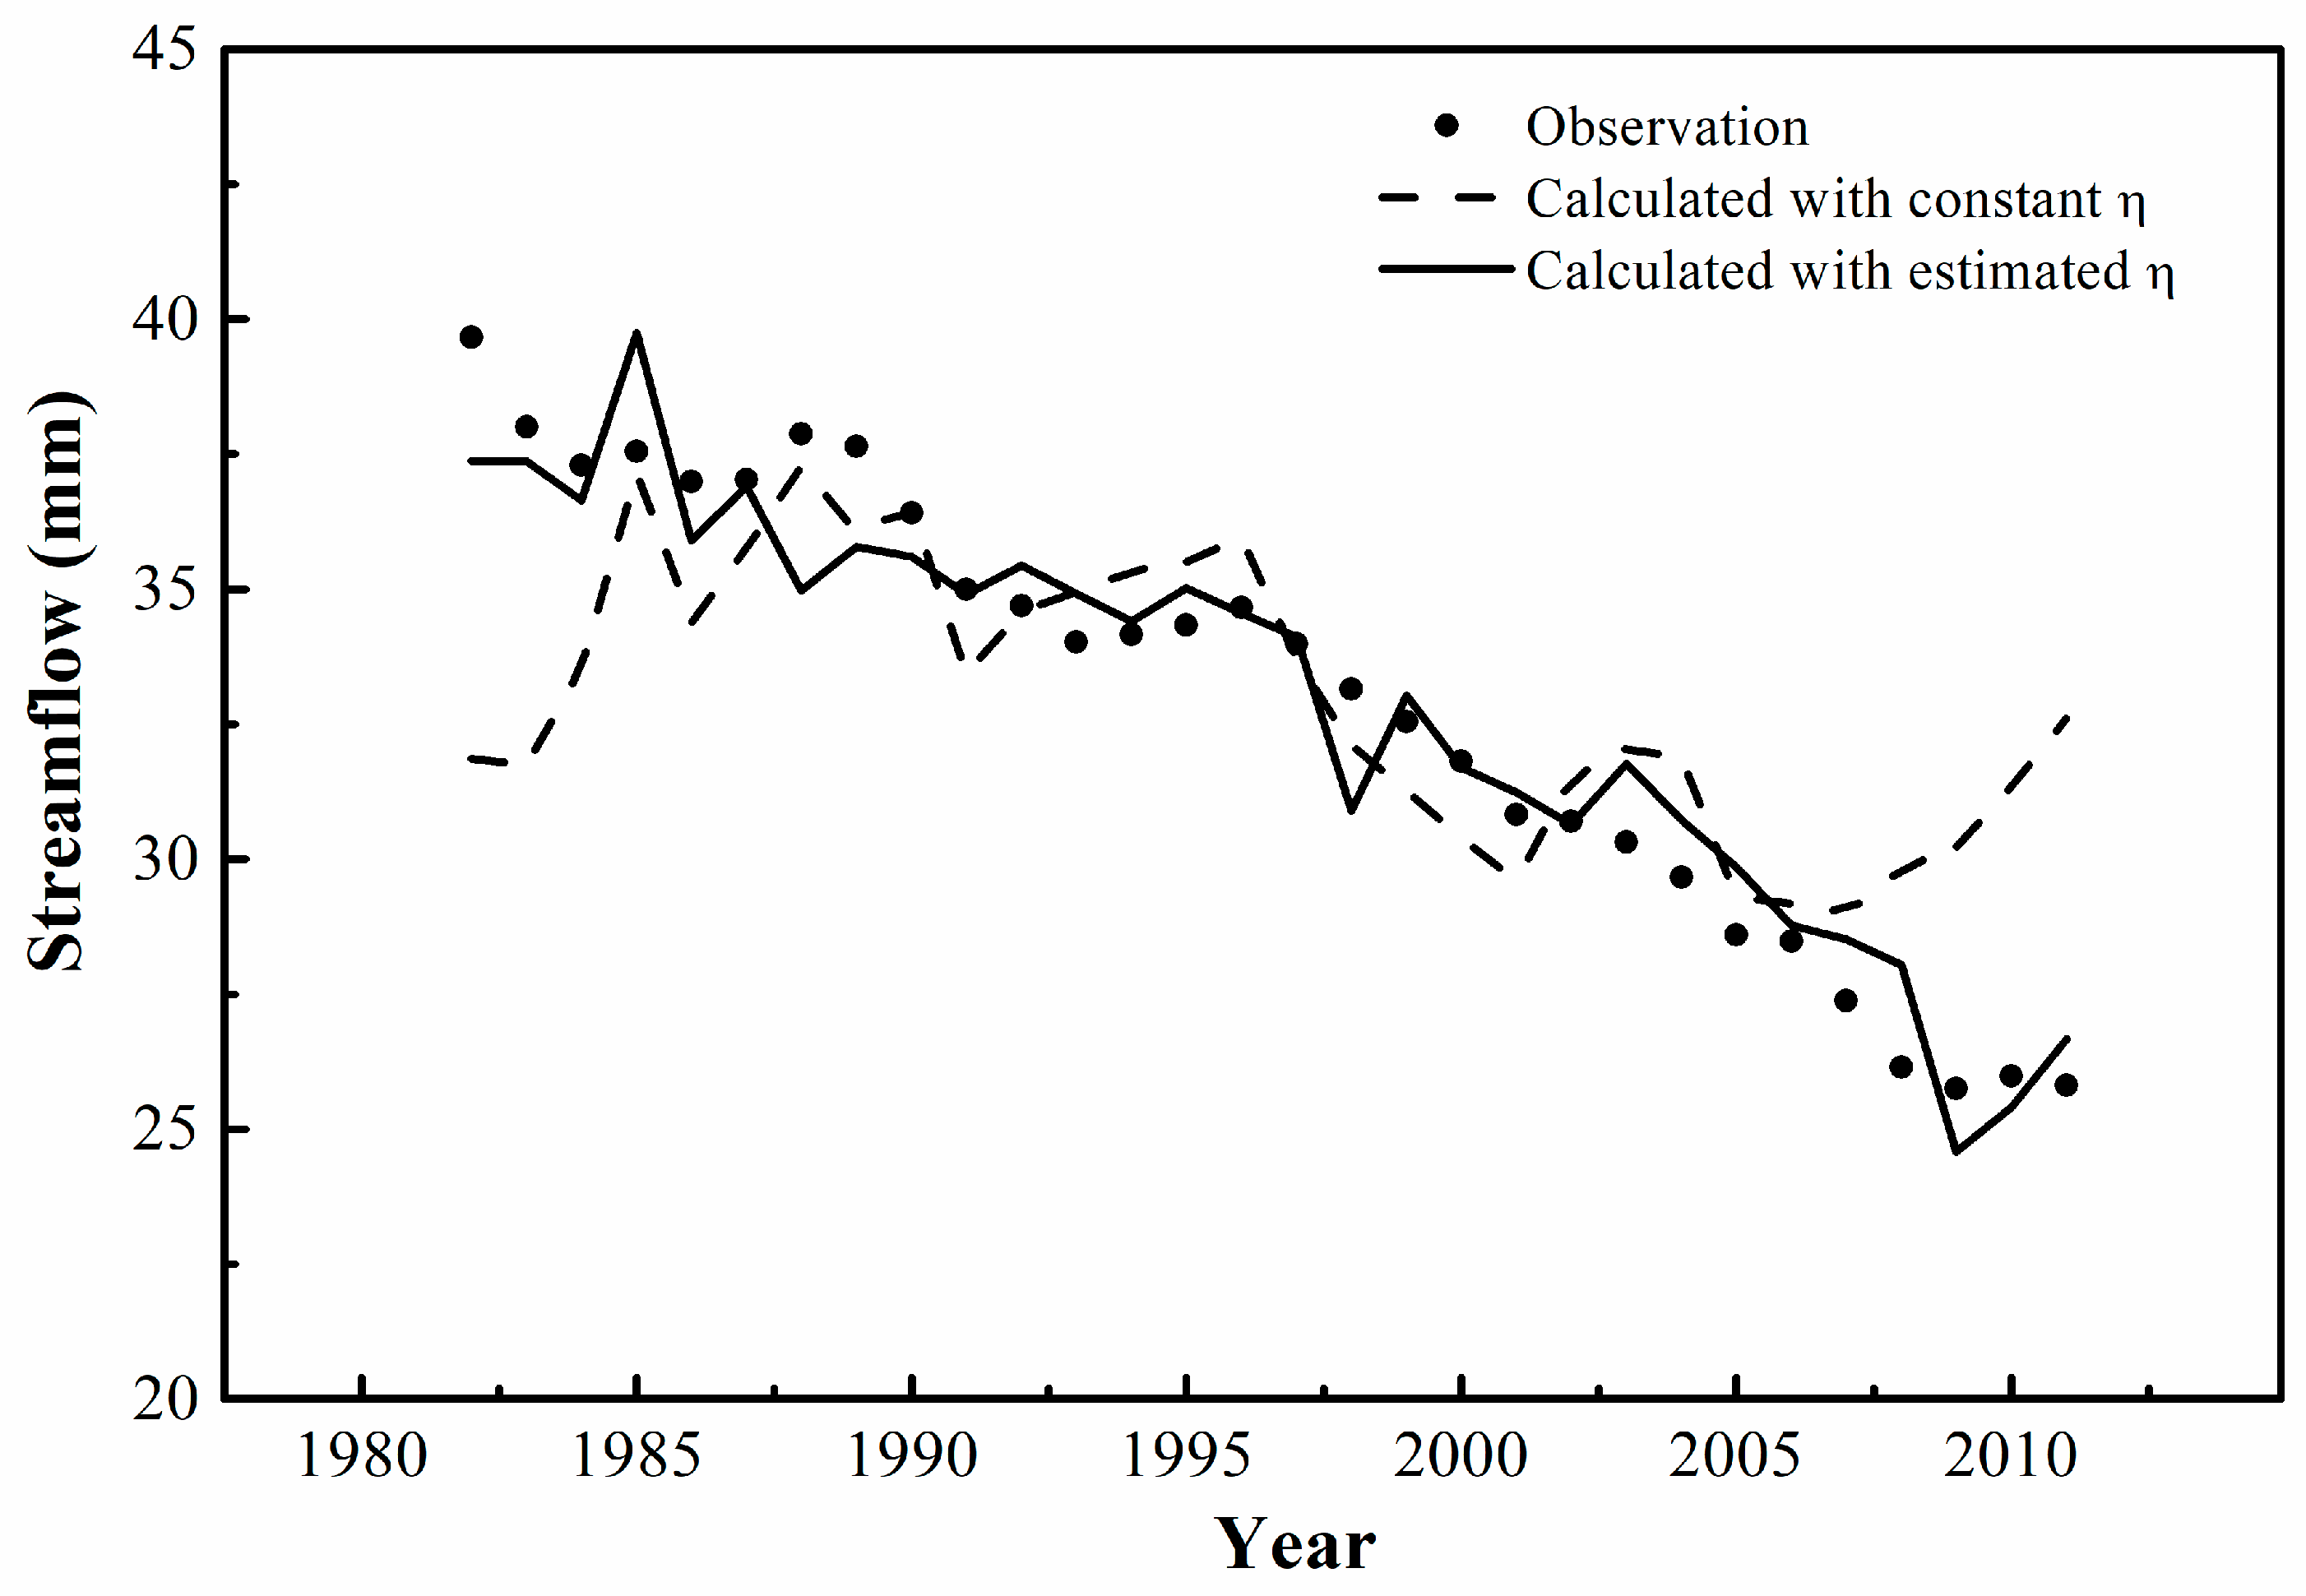
4.4. Estimation of Parameter in the Budyko Equation
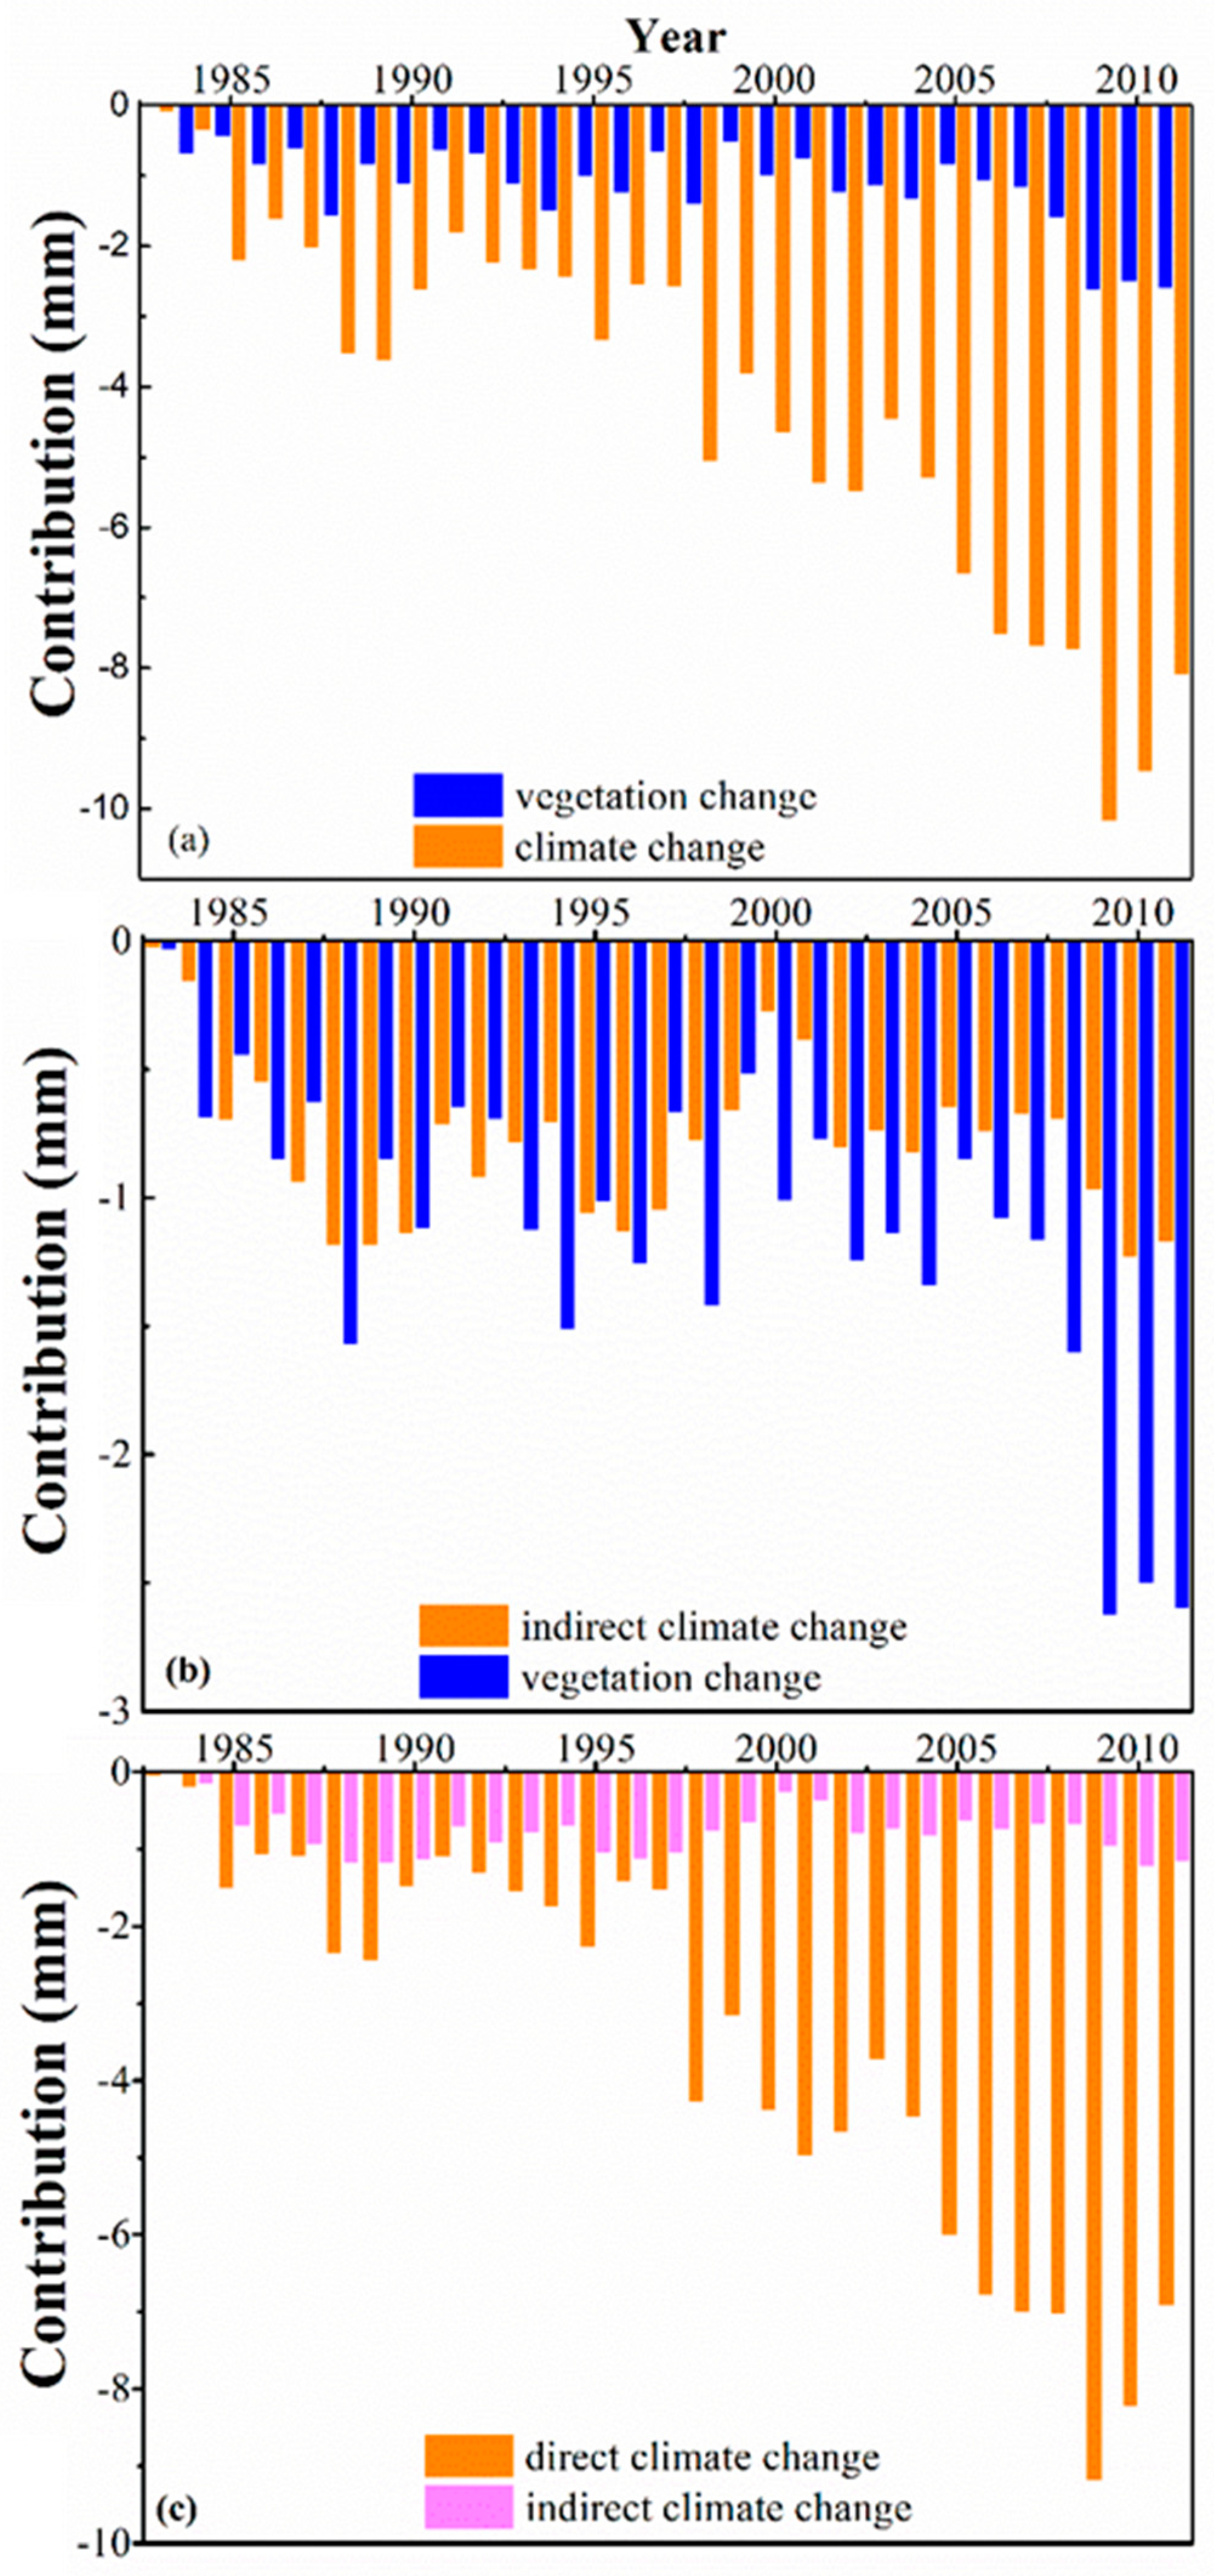
4.5. Contributions of Climate Change and Vegetation to Streamflow
5. Conclusions
Author Contributions
Funding
Conflicts of Interest
References
- Neupane, R.P.; Kumar, S. Estimating the effects of potential climate and land use changes on hydrologic processes of a large agriculture dominated watershed. J. Hydrol. 2015, 529, 418–429. [Google Scholar] [CrossRef]
- Serpa, D.; Nunes, J.P.; Santos, J.; Sampaio, E.; Jacinto, R.; Veiga, S.; Lima, J.C.; Moreira, M.; Corte-Real, J.; Keizer, J.J.; et al. Impacts of climate and land use changes on the hydrological and erosion processes of two contrasting Mediterranean catchments. Sci. Total Environ. 2015, 538, 64–77. [Google Scholar] [CrossRef] [PubMed]
- Tan, M.L.; Ibrahim, A.L.; Yusop, Z.; Duan, Z.; Ling, L. Impacts of land-use and climate variability on hydrological components in the Johor River basin, Malaysia. Hydrol. Sci. J. 2015, 60, 873–889. [Google Scholar] [CrossRef]
- Kahil, M.T.; Dinar, A.; Albiac, J. Modeling water scarcity and droughts for policy adaptation to climate change in arid and semiarid regions. J. Hydrol. 2015, 522, 95–109. [Google Scholar] [CrossRef]
- Salazar, A.; Baldi, G.; Hirota, M.; Syktus, J.; McAlpine, C. Land use and land cover change impacts on the regional climate of non-Amazonian South America: A review. Glob. Planet. Chang. 2015, 128, 103–119. [Google Scholar] [CrossRef]
- Yin, J.; He, F.; Xiong, Y.J.; Qiu, G.Y. Effects of land use/land cover and climate changes on surface runoff in a semi-humid and semi-arid transition zone in northwest China. Hydrol. Earth Syst. Sci. 2017, 21, 183–196. [Google Scholar] [CrossRef]
- Hattermann, F.F.; Krysanova, V.; Gosling, S.N.; Dankers, R.; Daggupati, P.; Donnelly, C.; Flörke, M.; Huang, S.; Motovilov, Y.; Buda, S.; et al. Cross-scale intercomparison of climate change impacts simulated by regional and global hydrological models in eleven large river basins. Clim. Chang. 2017, 141, 561–576. [Google Scholar] [CrossRef]
- Zhang, K.; Kimball, J.S.; Nemani, R.R.; Running, S.W.; Hong, Y.; Gourley, J.J.; Yu, Z. Vegetation greening and climate change promote multidecadal rises of global land evapotranspiration. Sci. Rep. 2015, 5, 15956. [Google Scholar] [CrossRef]
- Sowers, J.; Vengosh, A.; Weinthal, E. Climate change, water resources, and the politics of adaptation in the Middle East and North Africa. Clim. Chang. 2011, 104, 599–627. [Google Scholar] [CrossRef]
- Greenwood, W.J.; Buttle, J.M. Effects of reforestation on near-surface saturated hydraulic conductivity in a managed forest landscape, southern Ontario, Canada. Ecohydrology 2014, 7, 45–55. [Google Scholar] [CrossRef]
- Locatelli, B.; Catterall, C.P.; Imbach, P.; Kumar, C.; Lasco, R.; Marín-Spiotta, E.; Mercer, B.; Powers, J.S.; Schwartz, N.; Uriarte, M. Tropical reforestation and climate change: Beyond carbon. Restor. Ecol. 2015, 23, 337–343. [Google Scholar] [CrossRef]
- Coe, M.T.; Marthews, T.R.; Costa, M.H.; Galbraith, D.R.; Greenglass, N.L.; Imbuzeiro, H.M.A.; Levine, N.M.; Malhi, Y.; Moorcroft, P.R.; Muza, M.N.; et al. Deforestation and climate feedbacks threaten the ecological integrity of south-southeastern Amazonia. Philos. Trans. R. Soc. B 2013, 368, 20120155. [Google Scholar] [CrossRef] [PubMed]
- Panday, P.K.; Coe, M.T.; Macedo, M.N.; Lefebvre, P.; de Almeida Castanho, A.D. Deforestation offsets water balance changes due to climate variability in the Xingu River in eastern Amazonia. J. Hydrol. 2015, 523, 822–829. [Google Scholar] [CrossRef]
- Wang, D.; Tang, Y. A one-parameter Budyko model for water balance captures emergent behavior in darwinian hydrologic models. Geophys. Res. Lett. 2014, 41, 4569–4577. [Google Scholar] [CrossRef]
- Guardiola-Claramonte, M.; Troch, P.A.; Breshears, D.D.; Huxman, T.E.; Switanek, M.B.; Durcik, M.; Cobb, N.S. Decreased streamflow in semi-arid basins following drought-induced tree die-off: A counter-intuitive and indirect climate impact on hydrology. J. Hydrol. 2011, 406, 225–233. [Google Scholar] [CrossRef]
- Hughes, J.D.; Petrone, K.C.; Silberstein, R.P. Drought, groundwater storage and stream flow decline in southwestern Australia. Geophys. Res. Lett. 2012, 39. [Google Scholar] [CrossRef]
- Cong, Z.; Zhang, X.; Li, D.; Yang, H.; Yang, D. Understanding hydrological trends by combining the Budyko hypothesis and a stochastic soil moisture model. Hydrol. Sci. J. 2015, 60, 145–155. [Google Scholar] [CrossRef]
- Yang, H.; Yang, D.; Hu, Q. An error analysis of the Budyko hypothesis for assessing the contribution of climate change to runoff. Water Resour. Res. 2014, 50, 9620–9629. [Google Scholar] [CrossRef]
- Budyko, M. Climate and Life; Academic Press: New York, NY, USA, 1974; ISBN 9780080954530. [Google Scholar]
- Abatzoglou, J.T.; Ficklin, D.L. Climatic and physiographic controls of spatial variability in surface water balance over the contiguous United States using the Budyko relationship. Water Resour. Res. 2017, 53, 7630–7643. [Google Scholar] [CrossRef]
- Koppa, A.; Gebremichael, M. A Framework for validation of remotely sensed precipitation and evapotranspiration based on the Budyko hypothesis. Water Resour. Res. 2017, 53, 8487–8499. [Google Scholar] [CrossRef]
- Wang, C.; Wang, S.; Fu, B.; Zhang, L. Advances in hydrological modelling with the Budyko framework: A review. Prog. Phys. Geogr. 2016, 40, 409–430. [Google Scholar] [CrossRef]
- Yang, H.; Yang, D. Derivation of climate elasticity of runoff to assess the effects of climate change on annual runoff. Water Resour. Res. 2011, 47. [Google Scholar] [CrossRef]
- Jiang, C.; Xiong, L.; Wang, D.; Liu, P.; Guo, S.; Xu, C.-Y. Separating the impacts of climate change and human activities on runoff using the Budyko-type equations with time-varying parameters. J. Hydrol. 2015, 522, 326–338. [Google Scholar] [CrossRef]
- Donohue, R.J.; Roderick, M.L.; McVicar, T.R. Assessing the differences in sensitivities of runoff to changes in climatic conditions across a large basin. J. Hydrol. 2011, 406, 234–244. [Google Scholar] [CrossRef]
- Han, S.; Hu, H.; Yang, D.; Liu, Q. Irrigation impact on annual water balance of the oases in Tarim Basin, Northwest China. Hydrol. Process. 2011, 25, 167–174. [Google Scholar] [CrossRef]
- Xu, X.; Yang, D.; Yang, H.; Lei, H. Attribution analysis based on the Budyko hypothesis for detecting the dominant cause of runoff decline in Haihe basin. J. Hydrol. 2014, 510, 530–540. [Google Scholar] [CrossRef]
- Du, C.; Sun, F.; Yu, J.; Liu, X.; Chen, Y. New interpretation of the role of water balance in an extended Budyko hypothesis in arid regions. Hydrol. Earth Syst. Sci. 2016, 20, 393–409. [Google Scholar] [CrossRef]
- Zhang, S.; Yang, H.; Yang, D.; Jayawardena, A.W. Quantifying the effect of vegetation change on the regional water balance within the Budyko framework. Geophys. Res. Lett. 2016, 43, 1140–1148. [Google Scholar] [CrossRef]
- Allen, R.G.; Pereira, L.S.; Raes, D.; Smith, M.J.F. Crop Evapotranspiration-Guidelines for Computing Crop Water Requirements-FAO Irrigation and Drainage Paper 56; FAO: Rome, Italy, 1998; Volume 300, p. D05109. [Google Scholar]
- Gentine, P.; D’Odorico, P.; Lintner, B.R.; Sivandran, G.; Salvucci, G. Interdependence of climate, soil, and vegetation as constrained by the Budyko curve. Geophys. Res. Lett. 2012, 39. [Google Scholar] [CrossRef]
- Liu, Q.; McVicar, T.R.; Yang, Z.; Donohue, R.J.; Liang, L.; Yang, Y. The hydrological effects of varying vegetation characteristics in a temperate water-limited basin: Development of the dynamic Budyko-Choudhury-Porporato (dBCP) model. J. Hydrol. 2016, 543, 595–611. [Google Scholar] [CrossRef]
- Troch, P.A.; Carrillo, G.; Sivapalan, M.; Wagener, T.; Sawicz, K. Climate-vegetation-soil interactions and long-term hydrologic partitioning: Signatures of catchment co-evolution. Hydrol. Earth Syst. Sci. 2013, 17, 2209–2217. [Google Scholar] [CrossRef]
- Carlson, T.N.; Ripley, D.A. On the relation between NDVI, fractional vegetation cover, and leaf area index. Remote Sens. Environ. 1997, 62, 241–252. [Google Scholar] [CrossRef]
- Montandon, L.M.; Small, E.E. The impact of soil reflectance on the quantification of the green vegetation fraction from NDVI. Remote Sens. Environ. 2008, 112, 1835–1845. [Google Scholar] [CrossRef]
- Yang, H.; Yang, Z. A modified land surface temperature split window retrieval algorithm and its applications over China. Glob. Planet. Chang. 2006, 52, 207–215. [Google Scholar] [CrossRef]
- Yang, D.; Shao, W.; Yeh, P.J.-F.; Yang, H.; Kanae, S.; Oki, T. Impact of vegetation coverage on regional water balance in the nonhumid regions of China. Water Resour. Res. 2009, 45. [Google Scholar] [CrossRef]
- Gao, X.; Wu, P.; Zhao, X.; Zhou, X.; Zhang, B.; Shi, Y.; Wang, J. Estimating soil moisture in gullies from adjacent upland measurements through different observation operators. J. Hydrol. 2013, 486, 420–429. [Google Scholar] [CrossRef]
- Qiu, L.; Wu, Y.; Wang, L.; Lei, X.; Liao, W.; Hui, Y.; Meng, X. Spatiotemporal response of the water cycle to land use conversions in a typical hilly-gully basin on the Loess Plateau, China. Hydrol. Earth Syst. Sci. 2017, 21, 6485–6499. [Google Scholar] [CrossRef]
- Zhang, B.; Long, B.; Wu, Z.; Wang, Z. An evaluation of the performance and the contribution of different modified water demand estimates in drought modeling over water-stressed regions. Land Degrad. Dev. 2017, 28, 1134–1151. [Google Scholar] [CrossRef]
- Fan, X.; Ma, Z.; Yang, Q.; Han, Y.; Mahmood, R.; Zheng, Z. Land use/land cover changes and regional climate over the Loess Plateau during 2001–2009. Part I: Observational evidence. Clim. Chang. 2015, 129, 427–440. [Google Scholar] [CrossRef]
- Hamed, K.H. Trend detection in hydrologic data: The Mann-Kendall trend test under the scaling hypothesis. J. Hydrol. 2008, 349, 350–363. [Google Scholar] [CrossRef]
- Ibrahim, Y.; Balzter, H.; Kaduk, J.; Tucker, C. Land degradation assessment using residual trend analysis of GIMMS NDVI3g, soil moisture and rainfall in Sub-Saharan West Africa from 1982 to 2012. Remote Sens. 2015, 7, 5471–5494. [Google Scholar] [CrossRef]
- Pinzon, J.; Tucker, C. A non-stationary 1981–2012 AVHRR NDVI3g time series. Remote Sens. 2014, 6, 6929–6960. [Google Scholar] [CrossRef]
- Zhang, B.; Wu, P.; Zhao, X.; Wang, Y.; Gao, X. Changes in vegetation condition in areas with different gradients (1980–2010) on the Loess Plateau, China. Environ. Earth Sci. 2013, 68, 2427–2438. [Google Scholar] [CrossRef]
- Zou, C.; Yin, G.; Feng, L.; Wang, Z. Nonparametric maximum likelihood approach to multiple change-point problems. Ann. Stat. 2014, 42, 970–1002. [Google Scholar] [CrossRef]
- Wang, G.; Fan, Z. Study on Changes of Water and Sediment of the Yellow River; The Yellow River Water Conservancy Press: Zheng Zhou, China, 2002; Volume 3, p. 385. ISBN 9787806215708. [Google Scholar]
- Root, T.L.; Price, J.T.; Hall, K.R.; Schneider, S.H.; Rosenzweig, C.; Pounds, J.A. Fingerprints of global warming on wild animals and plants. Nature 2003, 421, 57–60. [Google Scholar] [CrossRef] [PubMed]
- Zhang, B.; He, C.; Burnham, M.; Zhang, L. Evaluating the coupling effects of climate aridity and vegetation restoration on soil erosion over the Loess Plateau in China. Sci. Total Environ. 2016, 539, 436–449. [Google Scholar] [CrossRef]
- Akaike, H. Akaike’s information criterion. In International Encyclopedia of Statistical Science; Springer: Berlin, Germany, 2011; p. 25. ISBN 9783642048975. [Google Scholar]
- Kang, S.; Zhang, L.; Song, X.; Zhang, S.; Liu, X.; Liang, Y.; Zheng, S. Runoff and sediment loss responses to rainfall and land use in two agricultural catchments on the Loess Plateau of China. Hydrol. Process. 2001, 15, 977–988. [Google Scholar] [CrossRef]
- Wang, D.; Hejazi, M. Quantifying the relative contribution of the climate and direct human impacts on mean annual streamflow in the contiguous United States. Water Resour. Res. 2011, 47. [Google Scholar] [CrossRef]
- Sankarasubramanian, A.; Vogel, R.M.; Limbrunner, J.F. Climate elasticity of streamflow in the United States. Water Resour. Res. 2001, 37, 1771–1781. [Google Scholar] [CrossRef]
- Wang, G.; Fan, Z. Study on Changes of Water and Sediment of the Yellow River; The Yellow River Water Conservancy Press: Zheng Zhou, China, 2002; Volume 2, p. 705. ISBN 9787806215692. [Google Scholar]
- Wang, G.; Fan, Z. Study on Changes of Water and Sediment of the Yellow River; The Yellow River Water Conservancy Press: Zheng Zhou, China, 2002; Volume 3, pp. 428–429. ISBN 9787806215708. [Google Scholar]
- Dai, A. Characteristics and trends in various forms of the Palmer Drought Severity Index during 1900–2008. J. Geophys. Res. Atmos. 2011, 116. [Google Scholar] [CrossRef]
- Dai, A. Drought under global warming: A review. Wiley Interdiscip. Rev. Clim. Chang. 2011, 2, 45–65. [Google Scholar] [CrossRef]
- Wells, N.; Goddard, S.; Hayes, M.J. A self-calibrating Palmer Drought Severity Index. J. Clim. 2004, 17, 2335–2351. [Google Scholar] [CrossRef]


© 2018 by the authors. Licensee MDPI, Basel, Switzerland. This article is an open access article distributed under the terms and conditions of the Creative Commons Attribution (CC BY) license (http://creativecommons.org/licenses/by/4.0/).
Share and Cite
Tian, L.; Jin, J.; Wu, P.; Niu, G.-y. Quantifying the Impact of Climate Change and Human Activities on Streamflow in a Semi-Arid Watershed with the Budyko Equation Incorporating Dynamic Vegetation Information. Water 2018, 10, 1781. https://doi.org/10.3390/w10121781
Tian L, Jin J, Wu P, Niu G-y. Quantifying the Impact of Climate Change and Human Activities on Streamflow in a Semi-Arid Watershed with the Budyko Equation Incorporating Dynamic Vegetation Information. Water. 2018; 10(12):1781. https://doi.org/10.3390/w10121781
Chicago/Turabian StyleTian, Lei, Jiming Jin, Pute Wu, and Guo-yue Niu. 2018. "Quantifying the Impact of Climate Change and Human Activities on Streamflow in a Semi-Arid Watershed with the Budyko Equation Incorporating Dynamic Vegetation Information" Water 10, no. 12: 1781. https://doi.org/10.3390/w10121781
APA StyleTian, L., Jin, J., Wu, P., & Niu, G.-y. (2018). Quantifying the Impact of Climate Change and Human Activities on Streamflow in a Semi-Arid Watershed with the Budyko Equation Incorporating Dynamic Vegetation Information. Water, 10(12), 1781. https://doi.org/10.3390/w10121781