Measuring Inundation Depth in a Subway Station Using the Laser Image Analysis Method


Abstract
1. Introduction
2. Water Depth Measurement Using the Image Processing Method
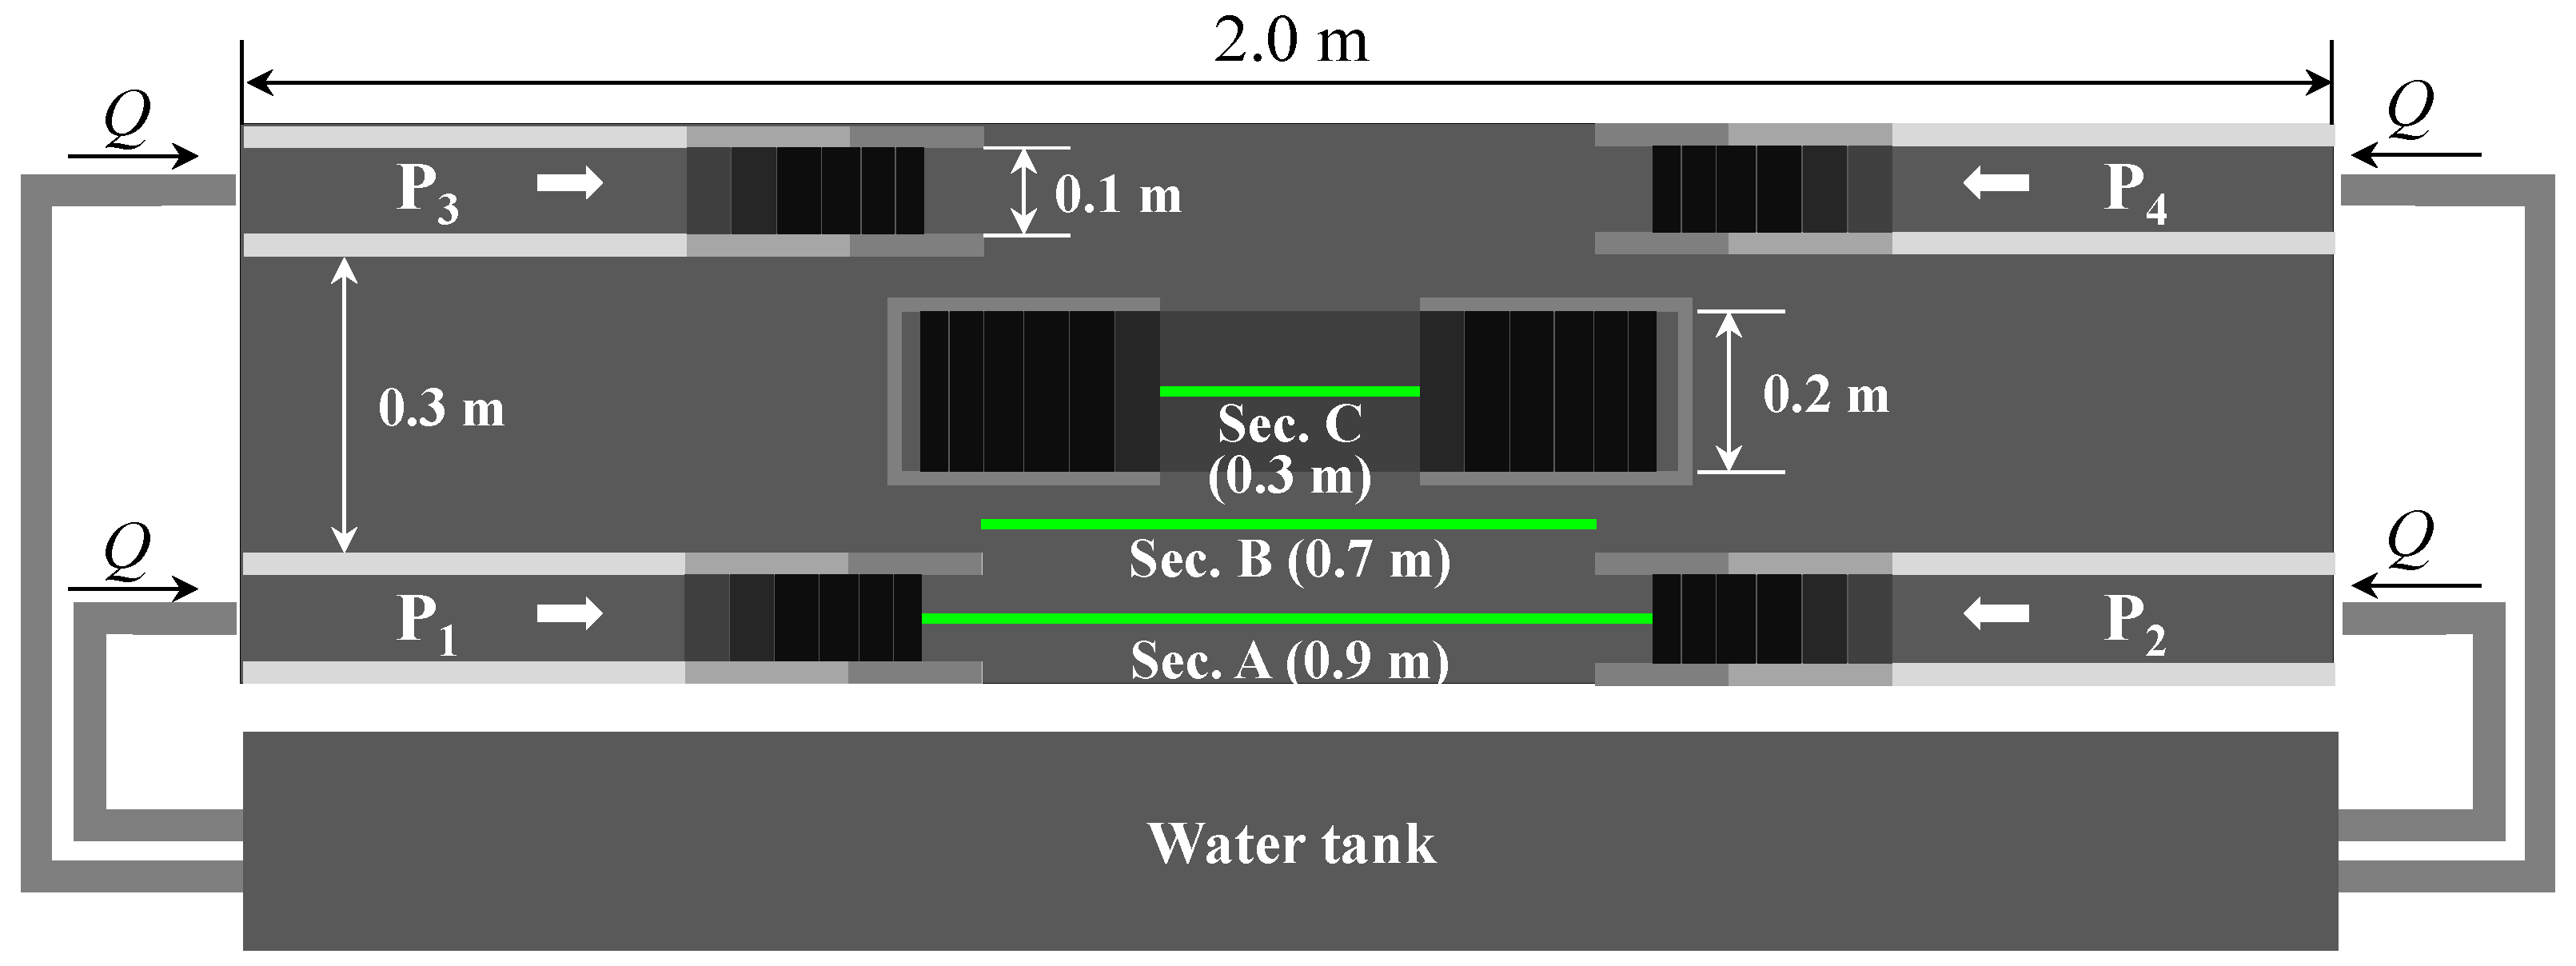
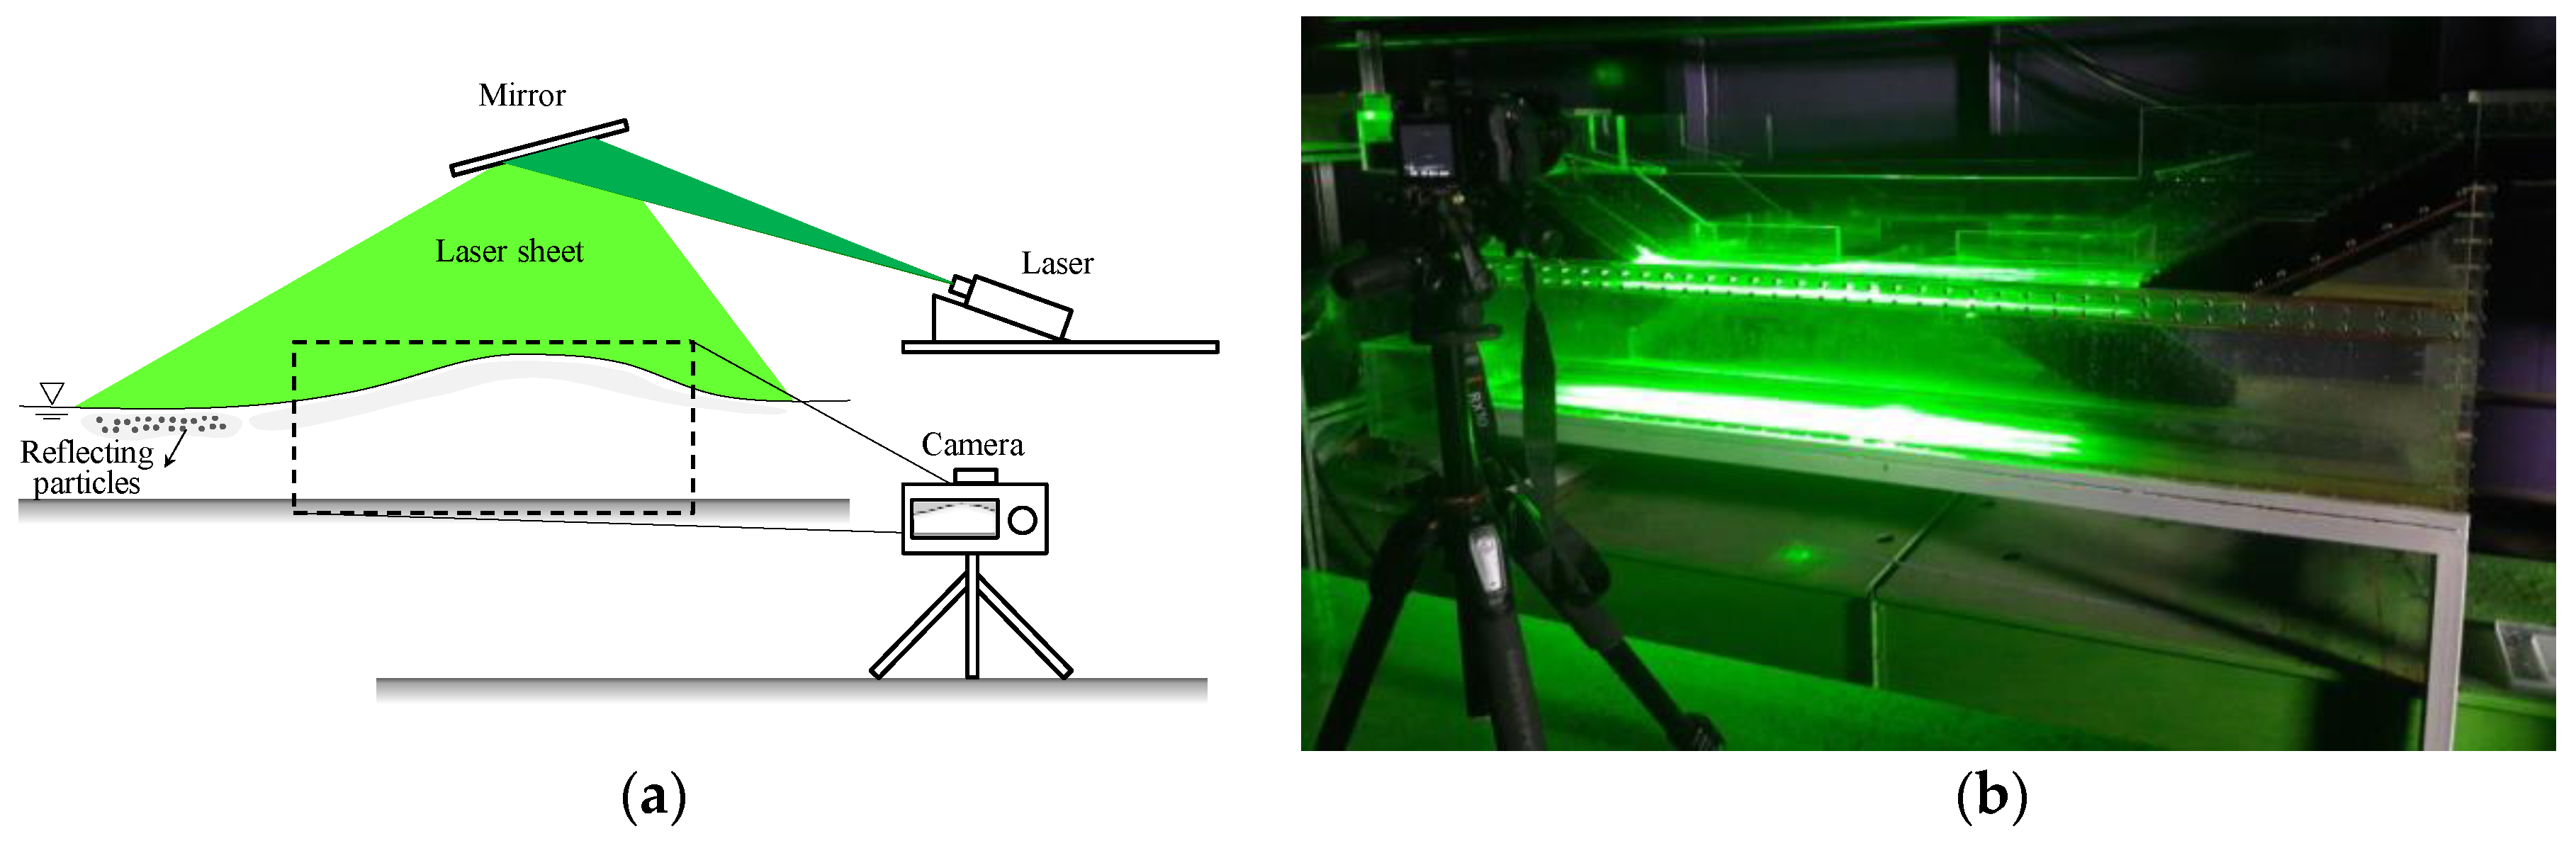
2.1. Descriptions of Experiment Methods
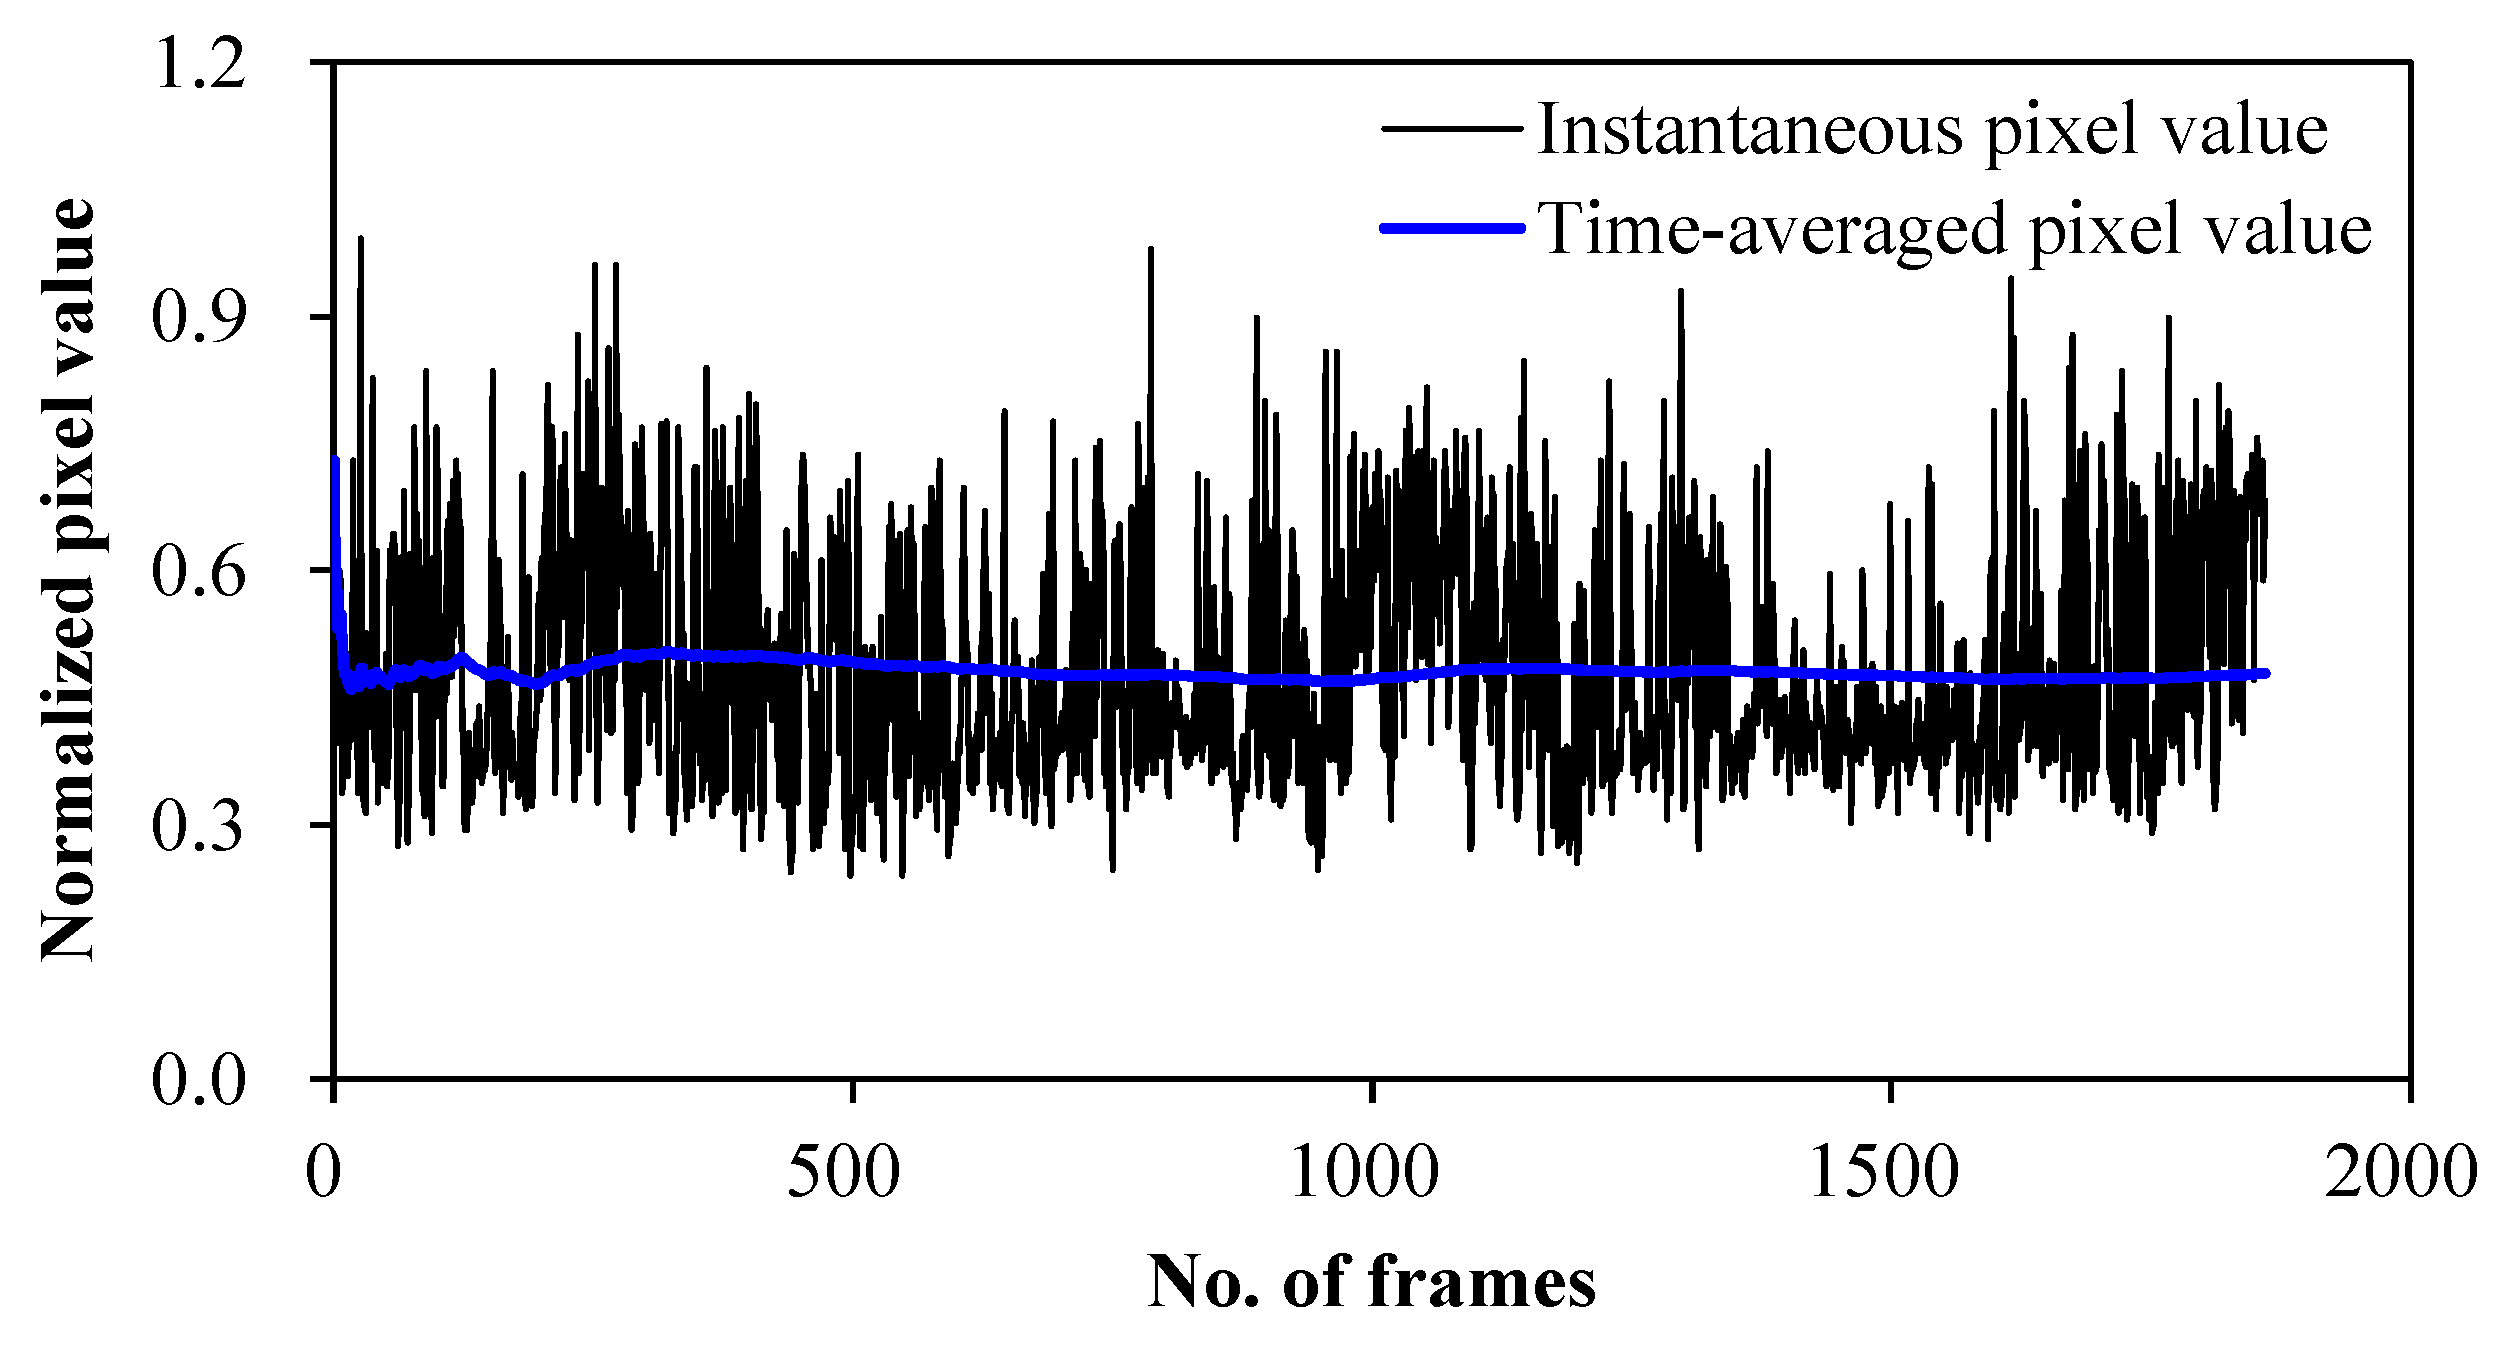
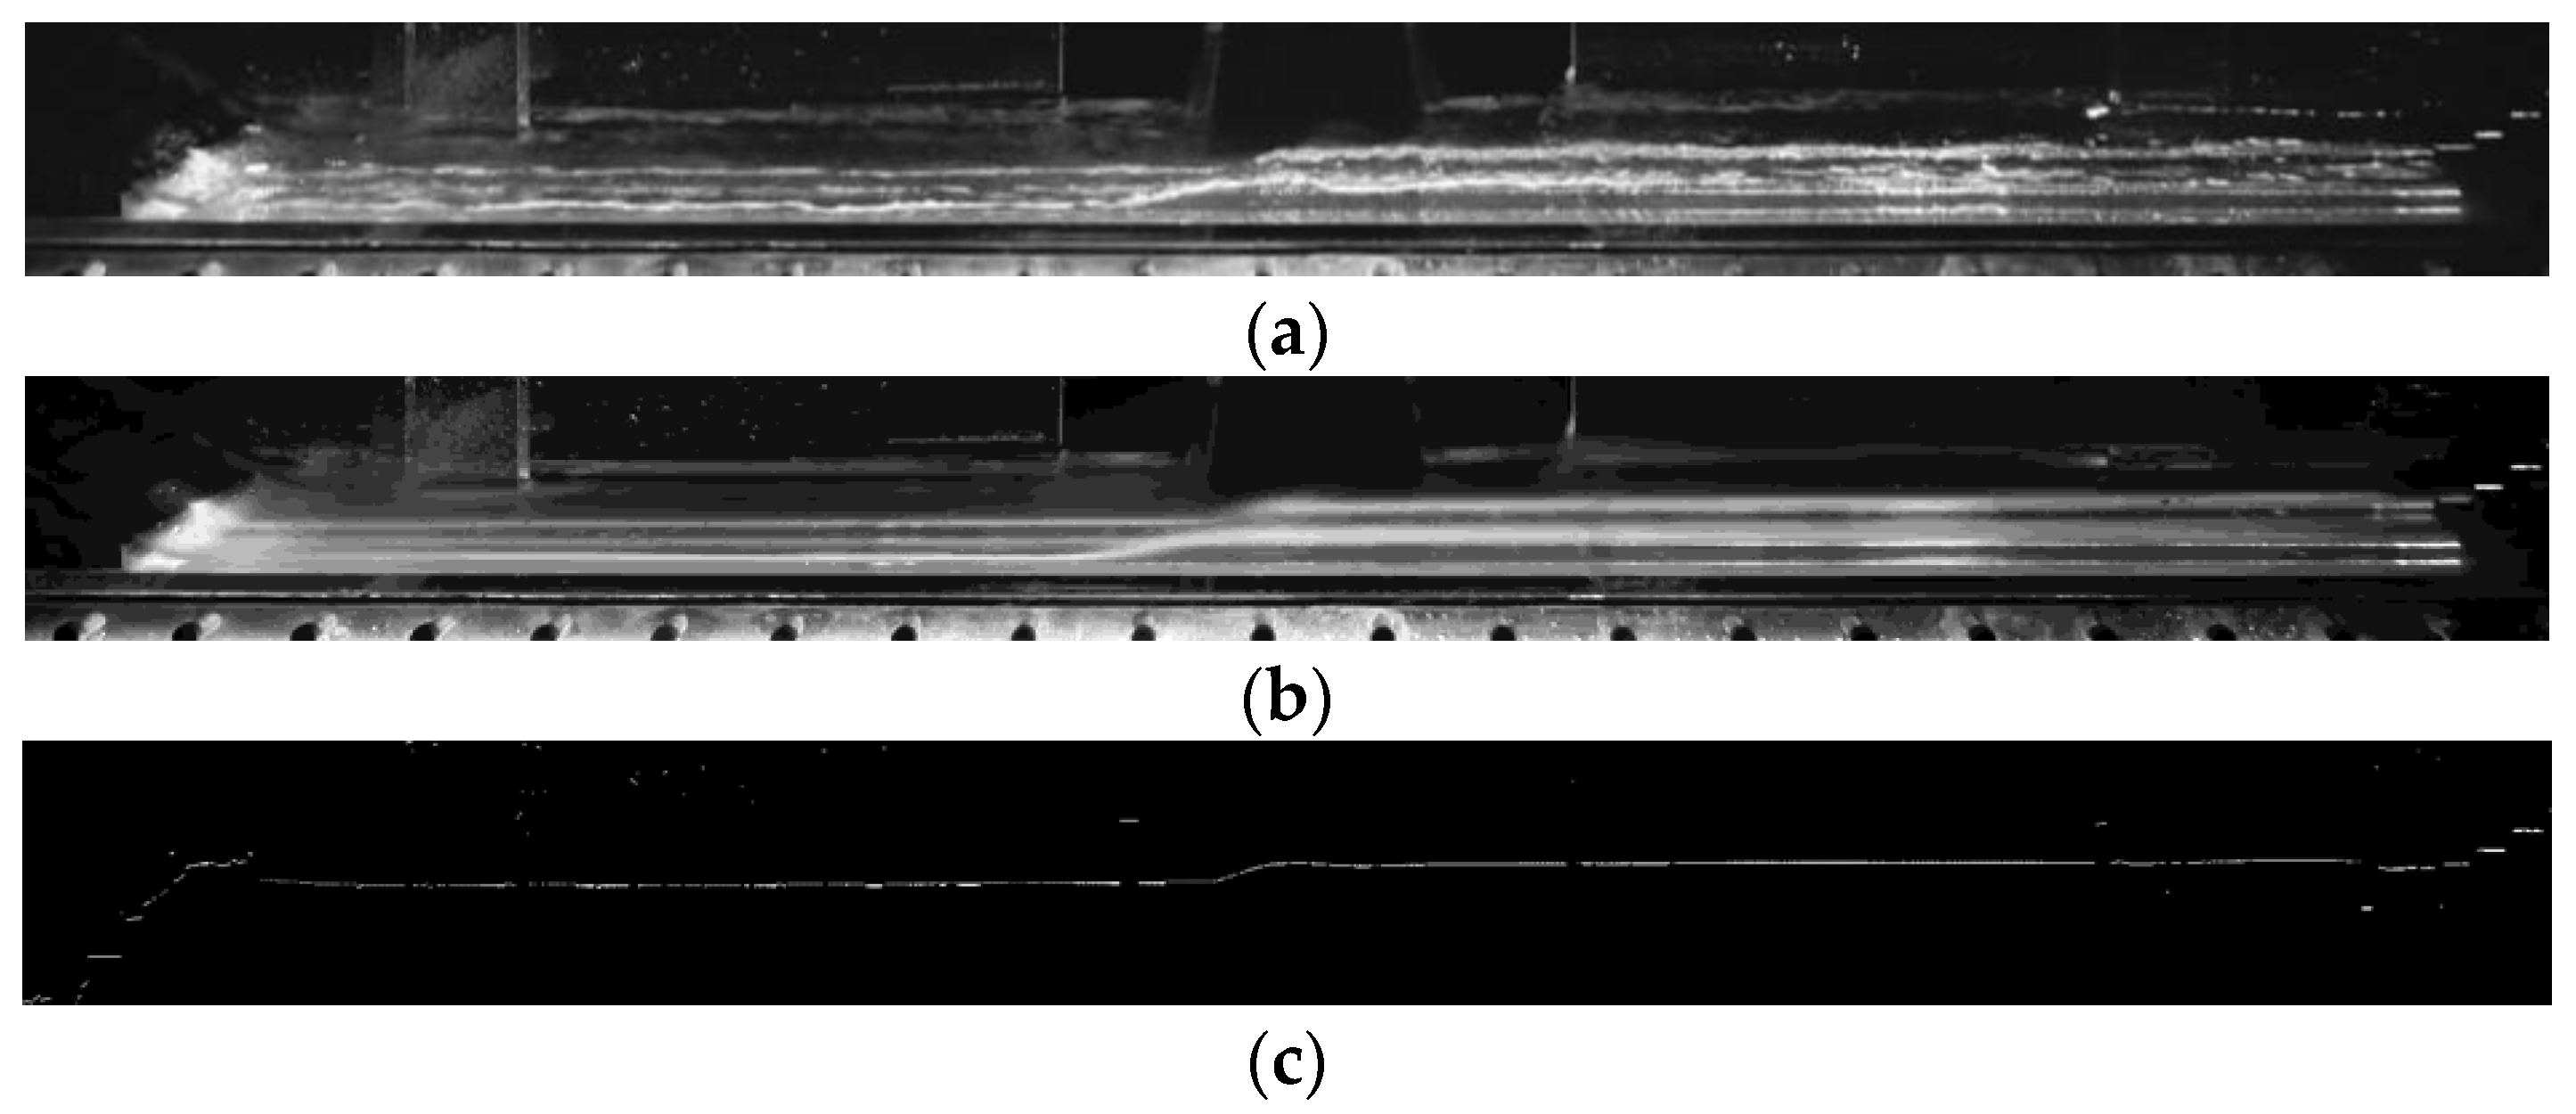
2.2. Development of the Algorithm
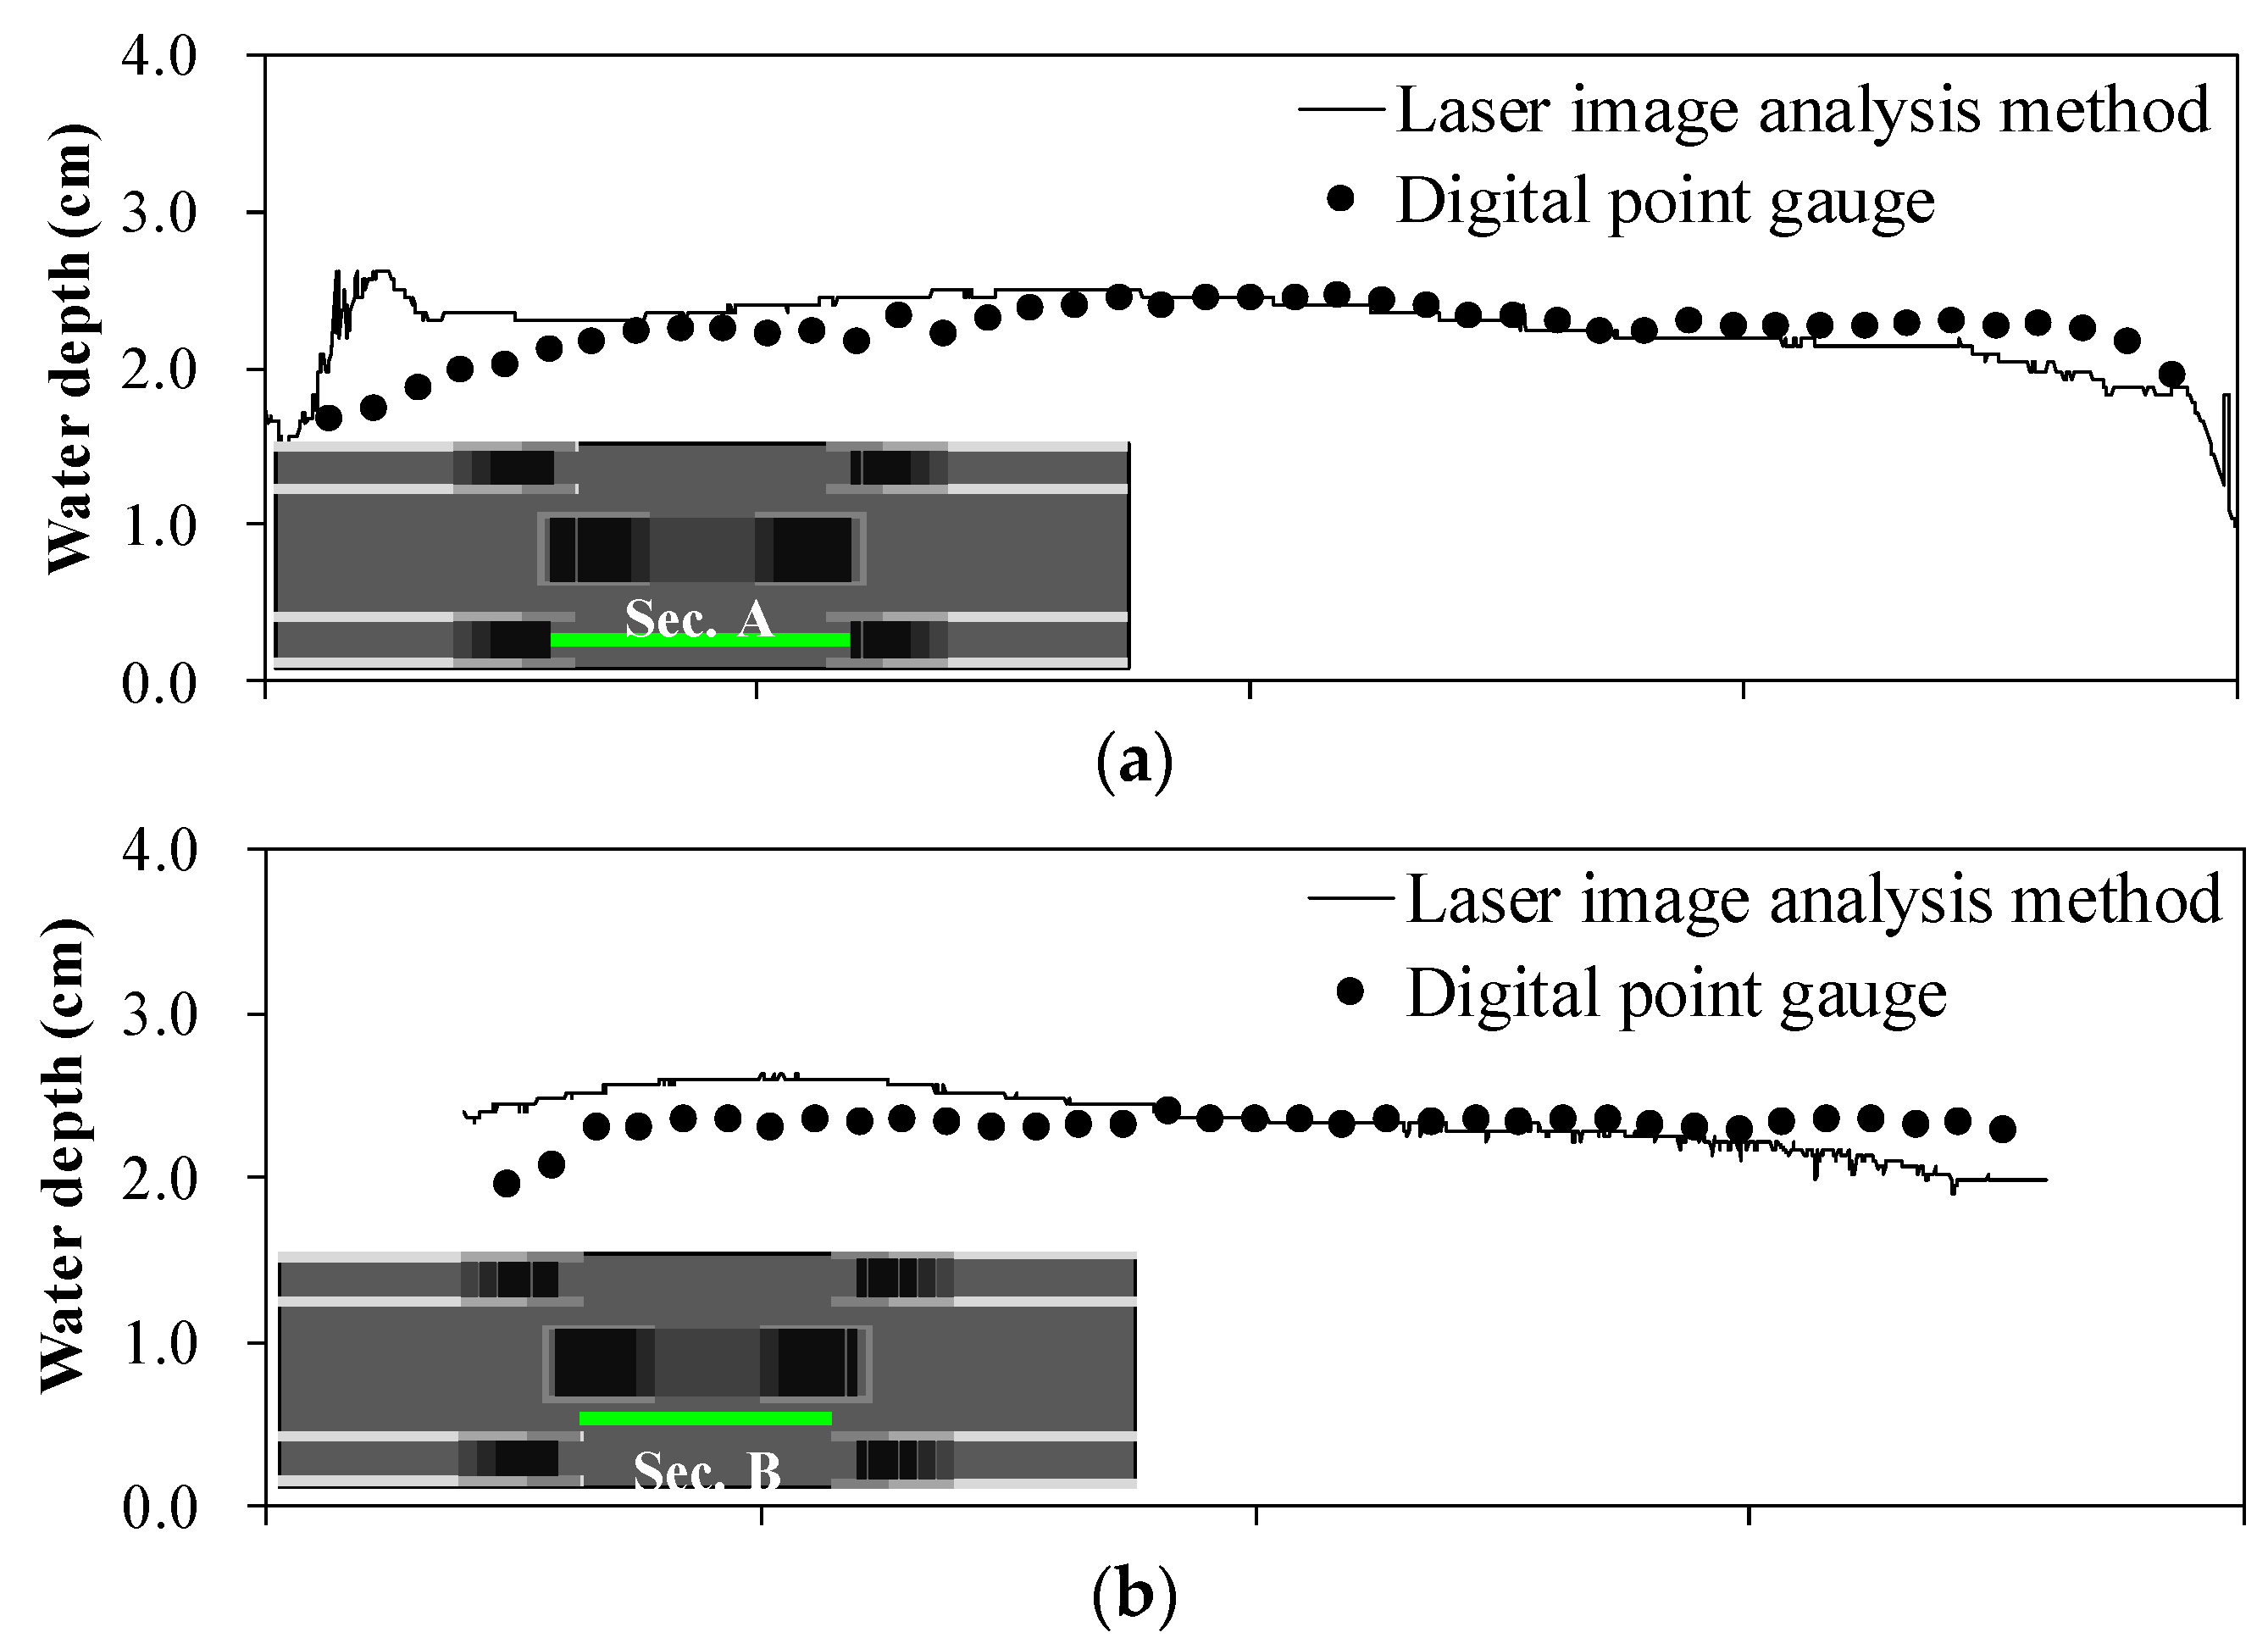
2.3. Verification of Inundation Depth Measurements
3. Inundation Depth in the Subway Station
3.1. Depth Change by the Inflow Positions
3.2. Depth Change by the Non-Uniformly Distributed Flowrate
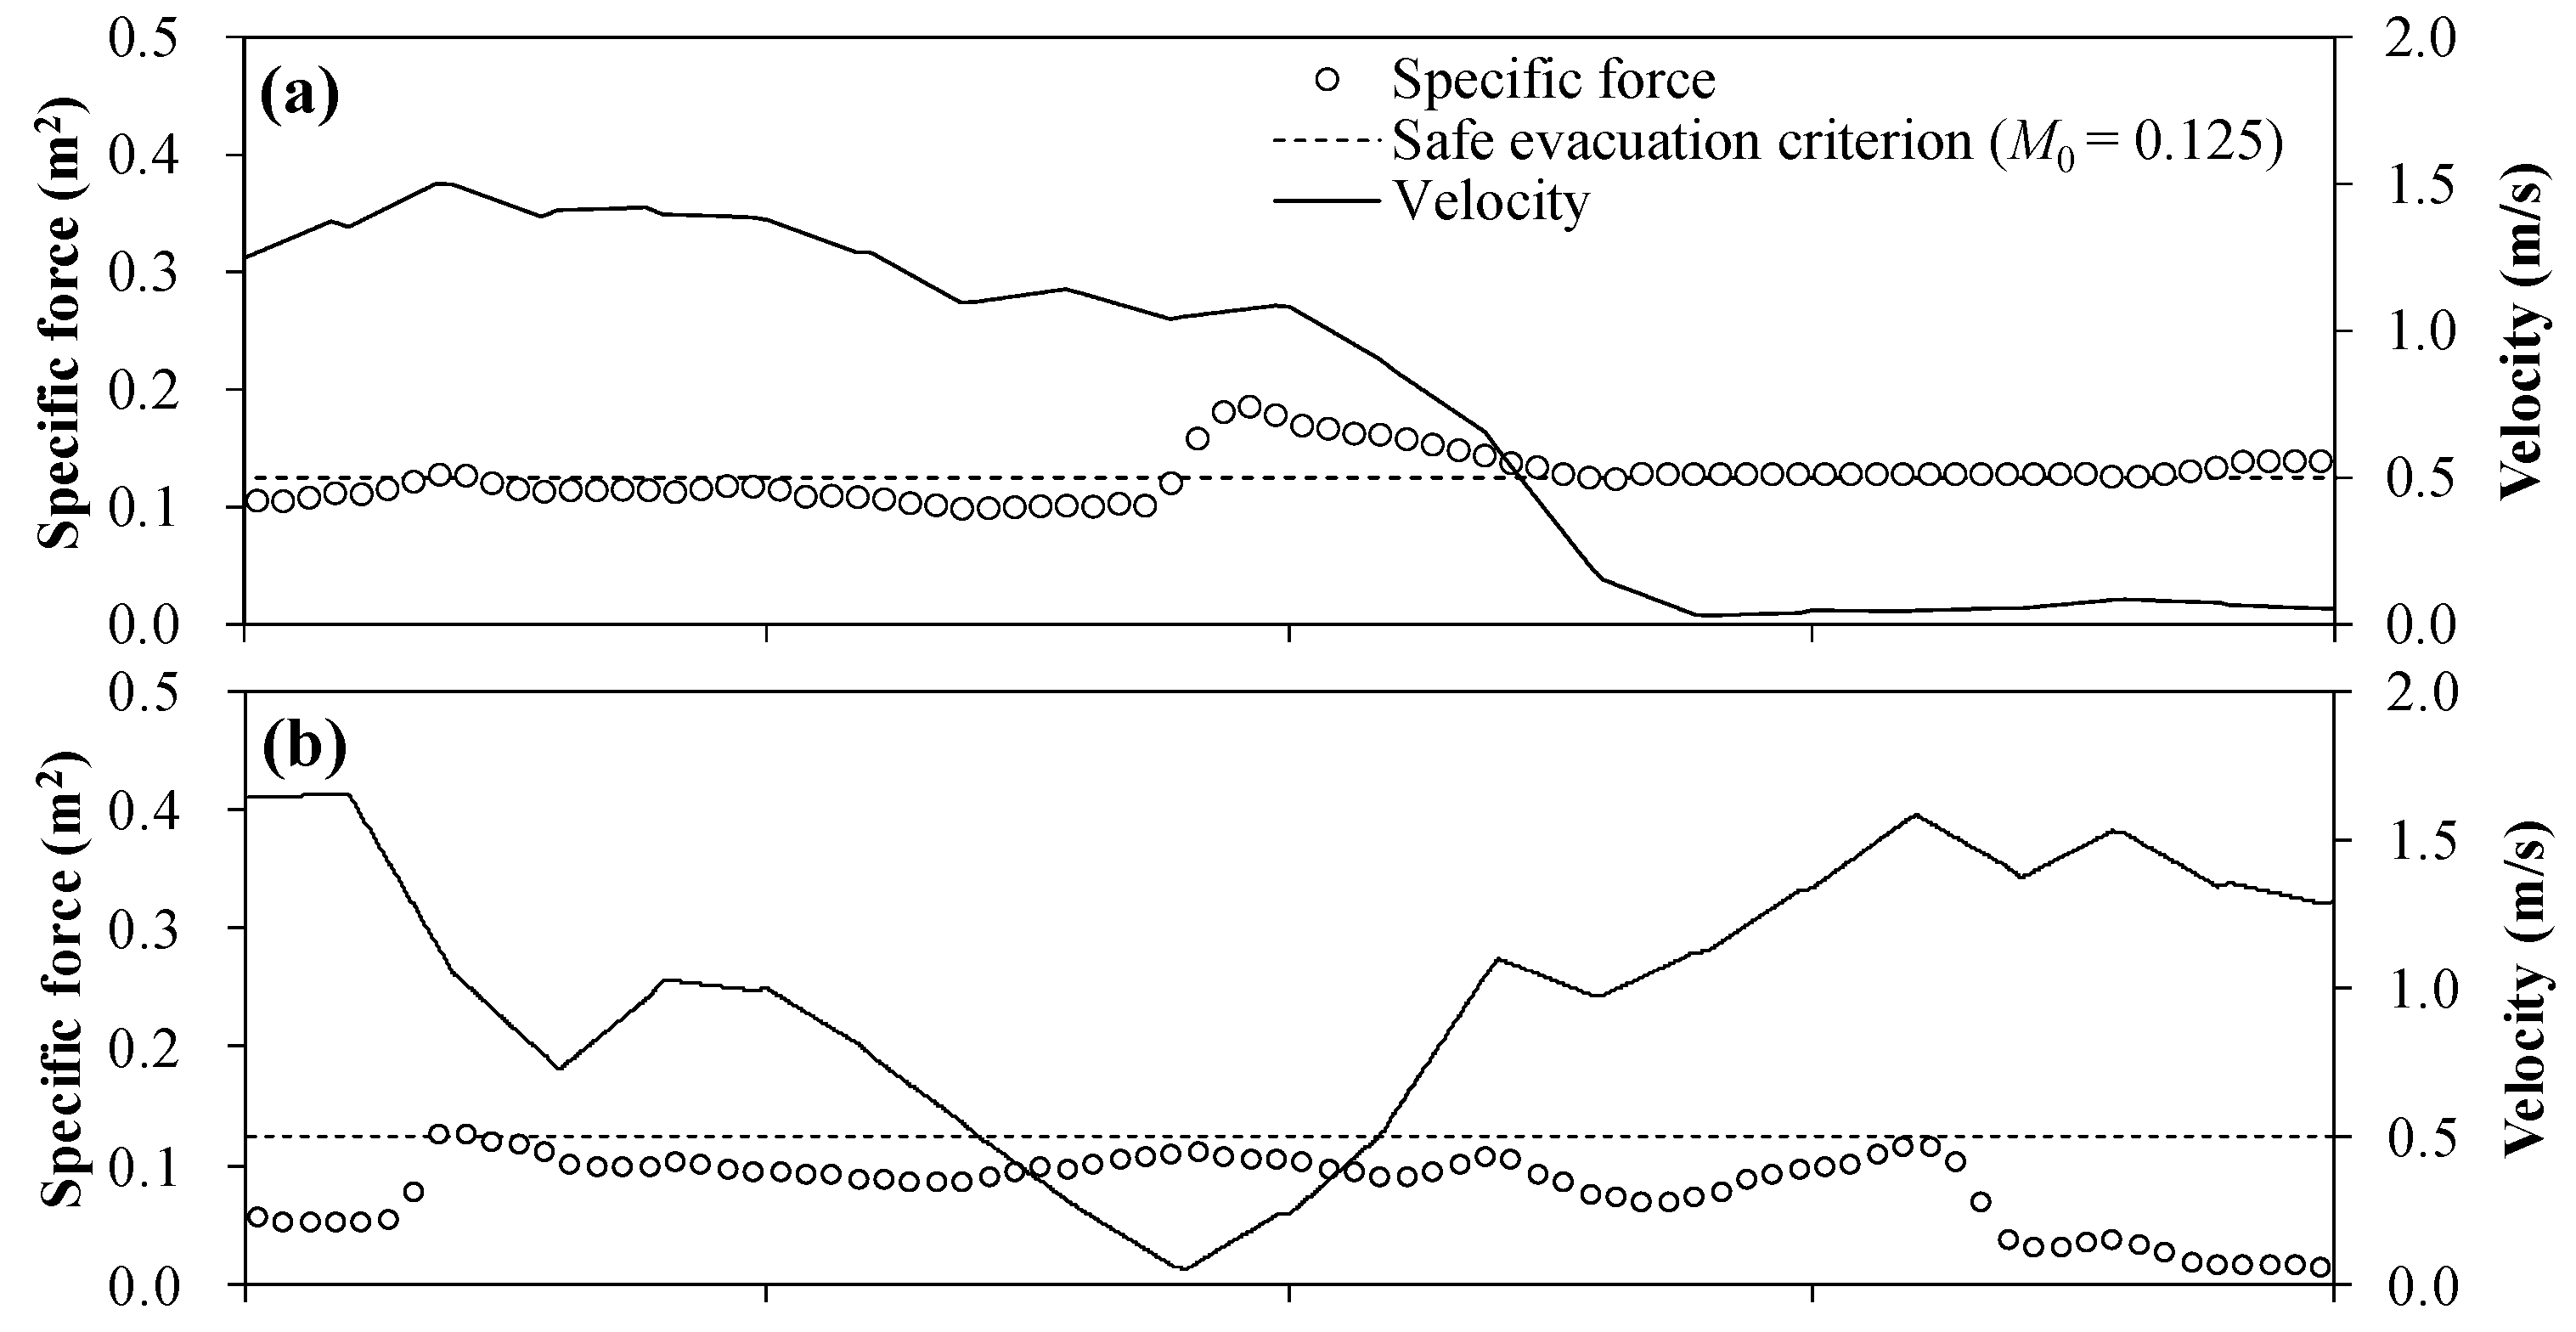
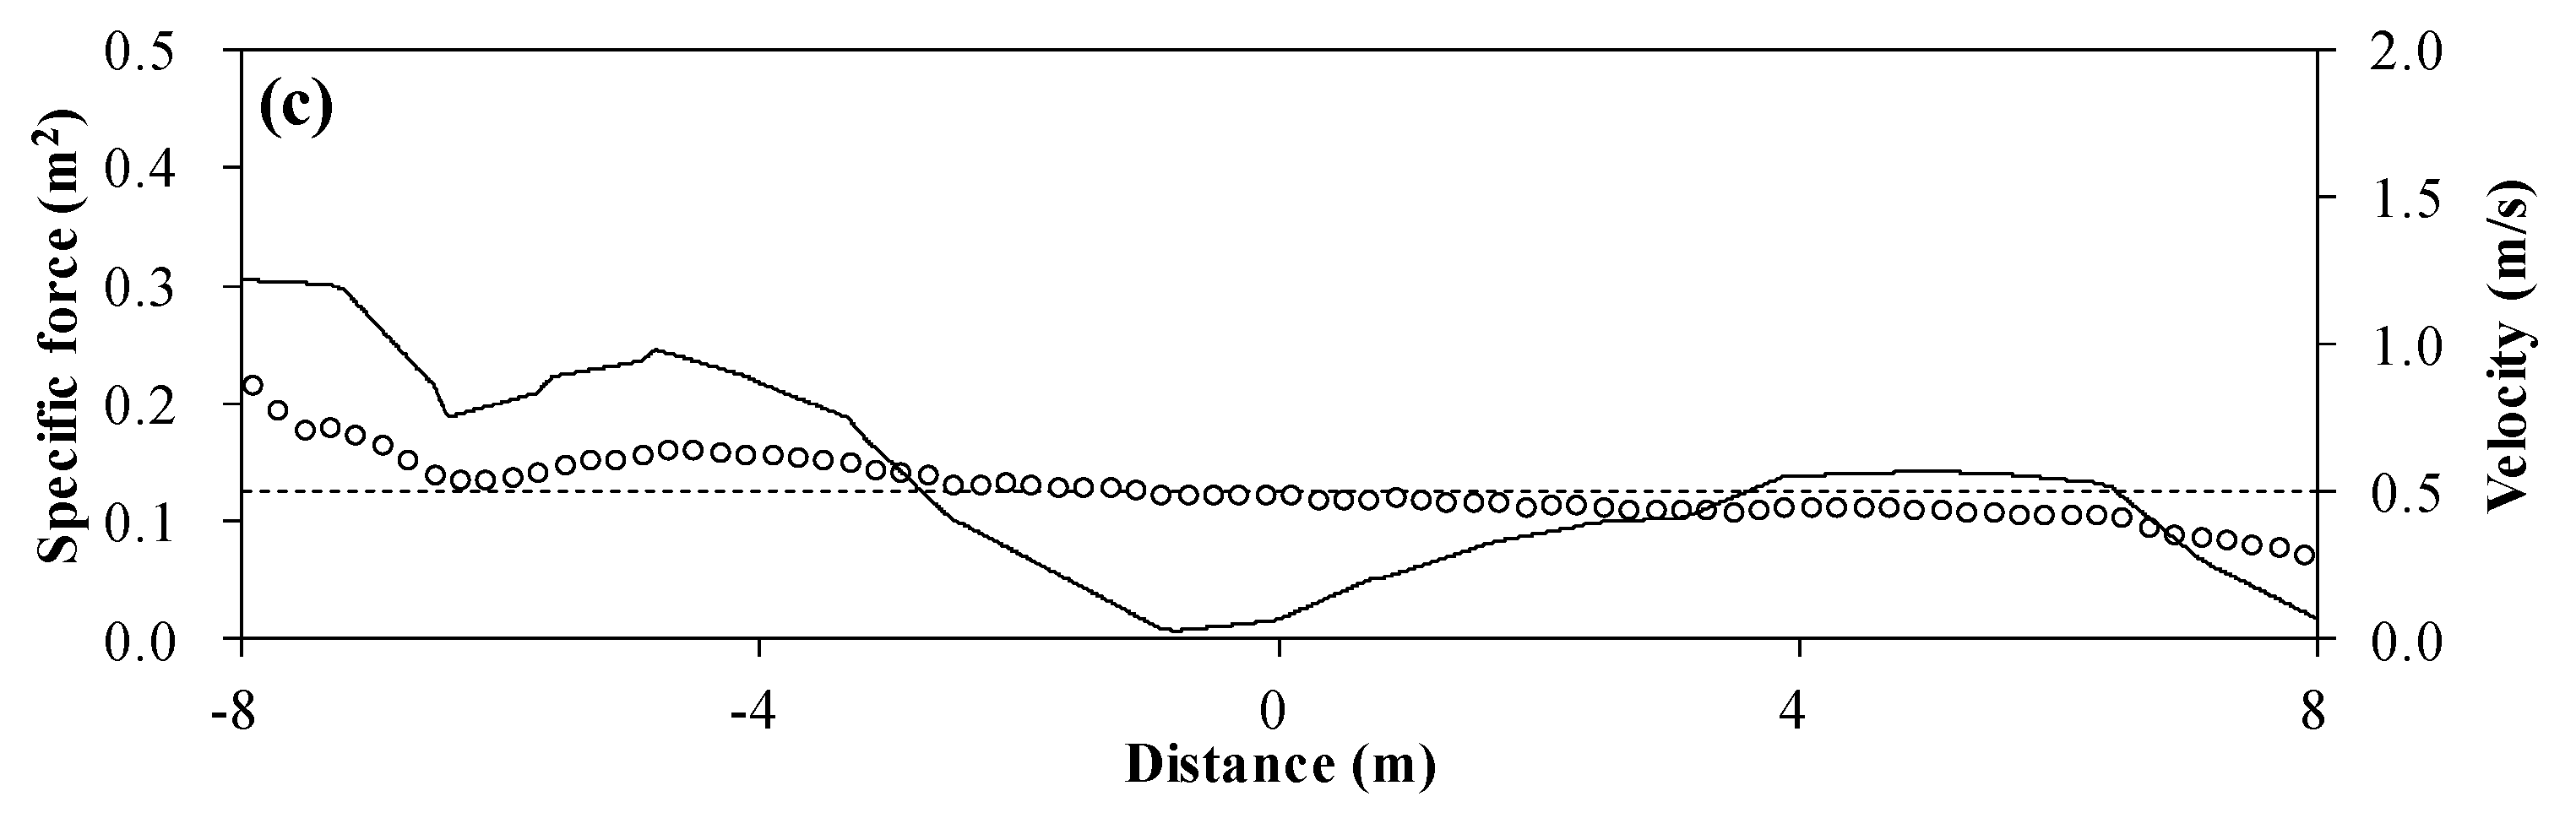
4. Evacuation Time from the Underground Space
5. Concluding Remarks
Author Contributions
Funding
Conflicts of Interest
References
- Ishigaki, T.; Asai, Y.; Nakahaata, Y.; Shimada, H.; Baba, Y.; Toda, K. Evacuation of aged persons from underground space. Water Sci. Technol. 2010, 62, 1807–1812. [Google Scholar] [CrossRef] [PubMed]
- Shao, W. Critical rainfall intensity for safe evacuation from underground spaces with flood prevention measures. J. Zhejiang Univ. Sci. A 2010, 11, 668–676. [Google Scholar] [CrossRef]
- Joo, J.; Kim, T.H. An experimental study on evacuation ability during underground space inundation. J. Korean Soc. Hazard Mitig. 2015, 15, 189–196. (In Korean) [Google Scholar] [CrossRef]
- Kim, H.-J.; Rhee, D.S.; Song, C.G. Numerical computation of underground inundation in multiple layers using the adaptive transfer method. Water 2018, 10, 85. [Google Scholar] [CrossRef]
- Takagi, Y.; Tsujikawa, A.; Takato, M.; Saito, T.; Kaida, M. Development of a noncontact liquid level measuring system using image processing. Water Sci. Technol. 1998, 37, 381–387. [Google Scholar] [CrossRef]
- Nguyen, L.S.; Schaeli, B.; Sage, D.; Kayal, S.; Jeanbourquin, D.; Barry, D.A.; Rossi, L. Vision-based system for the control and measurement of wastewater flow rate in sewer systems. Water Sci. Technol. 2009, 60, 2281–2289. [Google Scholar] [CrossRef] [PubMed]
- Kim, J.; Han, Y.; Hahn, H. Image-based water level measurement method adapting to ruler’s surface condition. J. Korea Soc. Comput. Inf. 2010, 15, 67–76. (In Korean) [Google Scholar]
- Kim, Y.; Park, H.; Lee, C.; Kim, D. Development of a cloud-based image water level gauge. IT Converg. Pract. 2014, 2, 22–29. [Google Scholar]
- Zhang, D.; Li, C.; Wang, G. A new style ruler and supporting image detection algorithm for urban flood water level measurement. In Proceedings of the 2013 IAHR World Congress, Chengdu, China, 8–13 September 2013. [Google Scholar]
- Aberle, J.; Rennie, C.; Admiraal, D.; Muste, M. Experimental Hydraulics: Methods, Instrumentation, Data Processing and Management: Volume II: Instrumentation and Measurement Techniques; CRC Press: Boca Raton, FL, USA, 2017. [Google Scholar]
- Duan, J.; Tench, C.; Gottlob, I.; Proudlock, F.; Bai, L. Automated segmentation of retinal layers from optical coherence tomography images using geodesic distance. Pattern Recognit. 2017, 72, 158–175. [Google Scholar] [CrossRef]
- Voulgaropoulos, V.; Angeli, P. Optical measurements in evolving dispersed pipe flows. Exp. Fluids 2017, 58, 170. [Google Scholar] [CrossRef]
- Committee of Countermeasures against Inundation Disasters in Underground Spaces (CCIDUS). Guideline for Measures against Inundation of Underground Spaces; Ministry of Land, Infrastructure, Transport and Tourism (MLIT): Tokyo, Japan, 2002. (In Japanese)
- Lee, C.J.; Seo, M.B.; Kim, D.G.; Kwon, S.I. A novel water surface detenction method based on correlation analysis for rectangular control area. J. Korea Water Resour. Assoc. 2012, 45, 1227–1241. (In Korean) [Google Scholar] [CrossRef]
- Wang, H.; Pope, S.B. Time-averaging strategies in the finite-volum/particle hybrid algorithm for the joint PDF equation of turbuelnt reactive flows. Combust. Theory Model. 2008, 12, 529–544. [Google Scholar] [CrossRef]
- Kim, H.; Lee, D.H.; Park, H.; Rhee, D.S.; Ryu, Y.; Park, M.; Kim, H.; Lee, K.-O.; Eom, J.-H.; Kim, M.; et al. Smart Flood Management; KICT 2017-179; Korea Institute of Civil Engineering and Building Technology (KICT): Goyang-si, Korea, 2017. [Google Scholar]


| Case | Q (m3/s) | |||
|---|---|---|---|---|
| P1 | P2 | P3 | P4 | |
| P1Q1 | 3.78 × 10⁻⁴ | - | - | - |
| P12Q1 | 3.78 × 10⁻⁴ | 3.78 × 10⁻⁴ | - | - |
| P13Q1 | 3.78 × 10⁻⁴ | - | 3.78 × 10⁻⁴ | - |
| P14Q1 | 3.78 × 10⁻⁴ | - | - | 3.78 × 10⁻⁴ |
| P123Q1 | 3.78 × 10⁻⁴ | 3.78 × 10⁻⁴ | 3.78 × 10⁻⁴ | - |
| P1234Q1 | 3.78 × 10⁻⁴ | 3.78 × 10⁻⁴ | 3.78 × 10⁻⁴ | 3.78 × 10⁻⁴ |
| P1Q2 | 4.92 × 10⁻⁴ | - | - | - |
| P12Q2 | 4.92 × 10⁻⁴ | 4.92 × 10⁻⁴ | - | - |
| P13Q2 | 4.92 × 10⁻⁴ | - | 4.92 × 10⁻⁴ | - |
| P14Q2 | 4.92 × 10⁻⁴ | - | - | 4.92 × 10⁻⁴ |
| P123Q2 | 4.92 × 10⁻⁴ | 4.92 × 10⁻⁴ | 4.92 × 10⁻⁴ | - |
| P1234Q2 | 4.92 × 10⁻⁴ | 4.92 × 10⁻⁴ | 4.92 × 10⁻⁴ | 4.92 × 10⁻⁴ |
| Case | Q (m3/s) | |||
|---|---|---|---|---|
| P1 | P2 | P3 | P4 | |
| P1Q1P2Q2 | 3.78 × 10⁻⁴ | 4.92 × 10⁻⁴ | - | - |
| P1Q1P3Q2 | 3.78 × 10⁻⁴ | - | 4.92 × 10⁻⁴ | - |
| P13Q1P24Q2 | 3.78 × 10⁻⁴ | 4.92 × 10⁻⁴ | 3.78 × 10⁻⁴ | 4.92 × 10⁻⁴ |
© 2018 by the authors. Licensee MDPI, Basel, Switzerland. This article is an open access article distributed under the terms and conditions of the Creative Commons Attribution (CC BY) license (http://creativecommons.org/licenses/by/4.0/).
Share and Cite
Park, I.; Seong, H.; Ryu, Y.; Rhee, D.S. Measuring Inundation Depth in a Subway Station Using the Laser Image Analysis Method. Water 2018, 10, 1558. https://doi.org/10.3390/w10111558
Park I, Seong H, Ryu Y, Rhee DS. Measuring Inundation Depth in a Subway Station Using the Laser Image Analysis Method. Water. 2018; 10(11):1558. https://doi.org/10.3390/w10111558
Chicago/Turabian StylePark, Inhwan, Hoje Seong, Yonguk Ryu, and Dong Sop Rhee. 2018. "Measuring Inundation Depth in a Subway Station Using the Laser Image Analysis Method" Water 10, no. 11: 1558. https://doi.org/10.3390/w10111558
APA StylePark, I., Seong, H., Ryu, Y., & Rhee, D. S. (2018). Measuring Inundation Depth in a Subway Station Using the Laser Image Analysis Method. Water, 10(11), 1558. https://doi.org/10.3390/w10111558