Abstract
Iran faces climate disparities due to extreme topographic anomalies, the Caspian Sea and the Persian Gulf water bodies, influences from diverse air masses and moisture sources, and its considerable area. FLEXPART model has been utilized to determine the main marine and continental moisture sources for south-central (Shiraz box) and northeastern (Mashhad box) parts of Iran. The marine moisture sources directly influenced extreme drought and wet conditions in Shiraz and Mashhad boxes during the wet period, while no correlation was observed during the dry period. In addition to local components, extreme drought and wet conditions have also been influenced by the climatic teleconnections. Extreme drought conditions mainly occurred during the La Niña phase, while wet conditions mainly occurred during the El Niño phase. Scrutinizing the effect of marine moisture sources on the hydrology of water resources demonstrated that the moisture contribution from the Arabian Sea directly influenced the discharges of Chenar-rahdar (in the Shiraz box) and Kardeh (in the Mashhad box) rivers during the wet period. However, the Red Sea inversely correlated with the discharges of both rivers during the dry period. Hydrogeologists, hydrologists, and meteorologists can utilize the outputs of this survey to develop climatology and hydrology models in the future.
1. Introduction
In recent decades, numerous studies have been done to deepen our understanding about the identification of moisture sources and mechanisms controlling moisture transport in the atmosphere [1] as a major component of the water cycle. Although studies on the identification of precipitation moisture sources and their transport mechanisms are growing, few studies focus on various microscale and mesoscale parameters which influence moisture sources and their variations throughout a year. Sea surface temperature (SST), wind speed, solar radiation, as well as climatic teleconnections are among the parameters which influence moisture sources. According to the place of their origin, the major climatic teleconnections are: IOD (Indian Ocean Dipole) which occurs in the Indian Ocean; MJO (Madden–Julian Oscillation) which occurs between the Indian and Pacific Oceans; PNA (Pacific North American), ENSO (El Niño–Southern Oscillation), Southern Oscillation Index (SOI) and PDO (Pacific Decadal Oscillation) which occur in the Pacific Ocean; AMO (Atlantic Multi-decadal Oscillation), NAO (North Atlantic Oscillation), and TAV (Tropical Atlantic Variability) which occur in the Atlantic Ocean; AO (Arctic Oscillation) and AAO (Antarctica Oscillation) which occur in the polar regions and QBO (Quasi-Biennial Oscillation) which occurs in the tropical stratosphere. The influence of these climatic indices on atmospheric and hydrological parameters have been appraised in many studies in Iran [2,3,4,5,6,7,8] and elsewhere in the world [9,10,11,12,13,14,15,16,17,18].
Moisture sources are normally identified using analytical models, numerical models, and isotope techniques [19]. Isotope techniques have been widely used in hydro-climatological studies since Craig discovered the relationship between 18O and 2H isotopes in the water molecules of natural meteoric waters from many parts of the world [20]. On the other hand, numerical models have less often been applied compared to physical methods and are mainly limited to the studies in recent decades. Among the various recently developed numerical models, the Lagrangian dispersion model FLEXPART developed by [21,22] has a great importance. This model enables scientists to track air parcels backward and forward in time. Thus, the outputs of this model can be used to compute the gain and loss of moisture along air particle trajectories [1]. This model has been widely and successfully utilized in many projects in different parts of the world [21,22,23,24,25,26,27,28,29,30].
The moisture uptake rate from various moisture sources directly influences the amount of precipitation and also extreme drought and wet conditions in each region. In addition to climatological or meteorological drought (as the quickest response of precipitation decrease in the environment), hydrological drought has also had a great role in hydrological and hydroclimatological studies. In contrast to climatological or meteorological drought, hydrological drought needs more time to reveal itself and causes a decline in surface and groundwater levels, deteriorates water quality, and leads to numerous other economic and social obstacles. Standardized streamflow index (SSI) [31] is normally utilized to quantify extreme drought and wet conditions in surface water resources.
Iran has always been threatened by extreme drought and wet conditions due to its semi-arid and arid climate. Freshwater availability in Iran has been estimated to be around 2000 m3 per capita yr−1 in 2000 and has been predicted to decrease to 1500 m3 per capita per yr−1 until 2030 [32,33]. During the last few decades, numerous villages—mainly in central, eastern, and southern parts of Iran—have been evacuated due to the lack of water and millions head of livestock and hundreds of thousands of hectares of farmlands have been damaged due to far-reaching and lengthy droughts. The intense 1998–2000 drought in Iran inflicted a 3.5-billion-dollar damage and many major lakes and rivers were dried during this period across the country. Although numerous publications exist in the literature regarding spatial and temporal variations of precipitation and extreme drought and wet conditions in Iran including [3,34,35,36,37,38,39], few studies such as [3,40] have focused on the main moisture sources of Iran’s precipitations and their variations across the country.
As most of the previous investigations in Iran have studied climatological variations across the country, the objective of the present study is to identify the marine and continental moisture sources and their contribution rates in the northeastern (Mashhad box) and south-central (Shiraz box) parts of Iran. The effect of manifold marine sources on extreme drought and wet conditions and also two river discharges (Chenar-rahdar River in Shiraz box and Kardeh River in Mashhad box) has been investigated. In addition, the role of climatic teleconnections on marine moisture sources, extreme drought, and wet conditions, and also Chenar-rahdar and Kardeh river discharges have been investigated using regression methods.
2. Study Area
With an area of 1,648,195 km2 in the Middle East, Iran is situated in latitudes 25° N to 40° N and longitudes 44° E to 64° E, with a semi-arid and arid climate according to Koppen’s method [41]. Iran’s climate has a broad spectrum ranging from the arid zones of central Iran with less than 120 mm annual precipitation to rainy jungles in the Caspian Sea coasts with more than 1000 mm average annual precipitation. This intense climate variation is due to two large mountain ranges (Alborz and Zagros) which border two extremely arid deserts in central Iran “Dasht-e Lut and Dasht-e Kavir”. The Alborz mountain range prevents the flow of moisture from the Caspian Sea to the central part of Iran, while the Zagros mountain range prevents the flow of moisture from the west and southwest of Iran toward central Iran [34]. In addition, the Persian Gulf and the Oman Sea in the south, and the Caspian Sea in the north of Iran predominantly affect Iran climate and transfer considerable amount of moisture via various air masses to Iran.
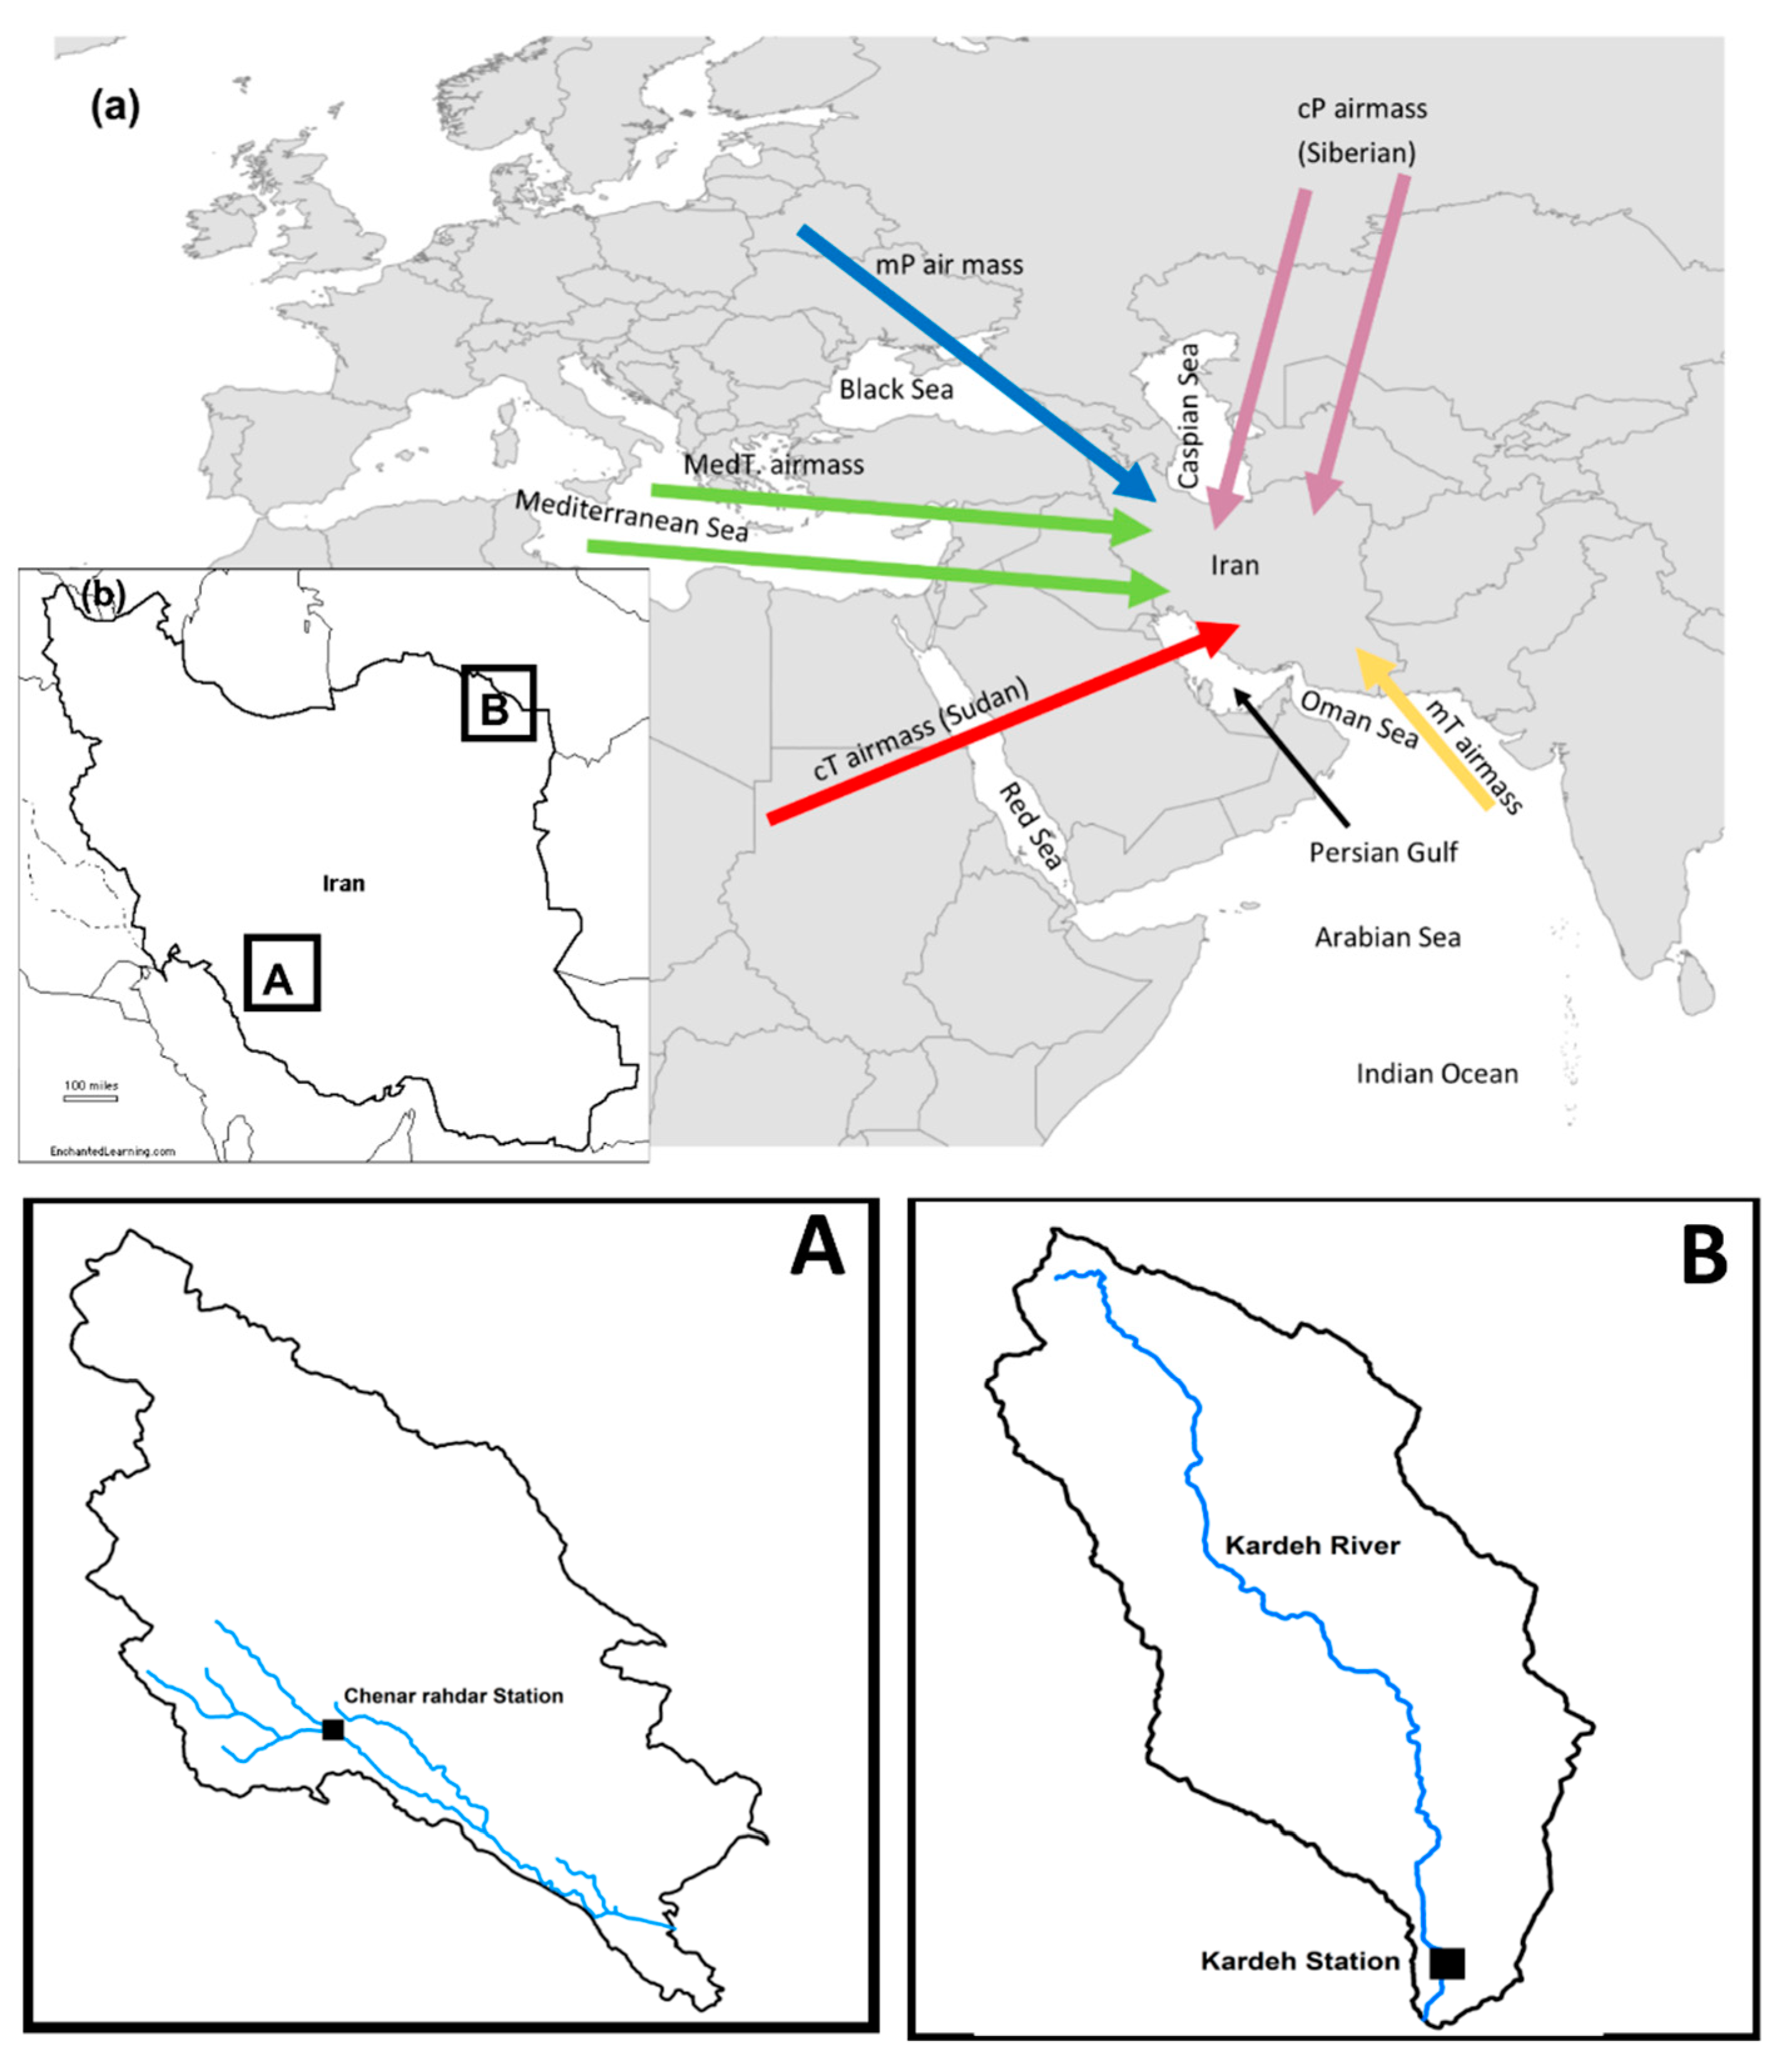
Five major air masses influence Iran through the year. The Mediterranean air mass (MedT) which influences the western and southwestern parts of the country. Mediterranean cyclones contain high amounts of moisture and enhance cloudiness and precipitation mainly in the western part of Iran, while the Mediterranean frontal system and Sudan heat-flow system influence the southwestern part of Iran. The simultaneous merging of the Mediterranean frontal system and Sudan air mass cause huge precipitation events. The intensity of the Mediterranean system is weakened by the penetration of the Azores subtropical high-pressure system over Iran during April and May. The continental tropical air mass (cT) known as Sudan air mass mainly affects the southwest of Iran. The northwestern part of Iran is affected by maritime polar (mP) air mass. This air mass does not often influence Iran and brings humid cold air from northern and north parts of Europe. Continental polar (cP) air mass (known as the Siberian air mass) affects the northern and northeastern parts of Iran and its interaction with the Alborz mountain range causes huge rainfalls in Caspian Sea coast. Finally, the maritime tropical (mT) air mass rarely causes sudden intense rains in the south and southeast part of Iran in the dry period [34,42] (Figure 1).
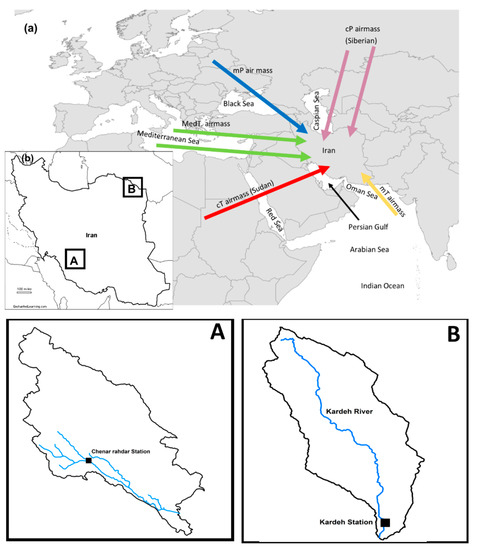
Figure 1.
(a) Air masses influencing Iran and (b) spatial distribution of the Shiraz (A) and Mashhad (B) boxes in Iran plateau.
Extreme topographic anomalies, the Caspian Sea and the Persian Gulf water bodies, diverse air mass and moisture source influences and considerable area cause climate disparities across Iran. Two boxes, sized 1° × 1°, including Shiraz (A) and Mashhad (B) have been chosen in the south-central and northeastern parts of Iran, respectively (Figure 1). The Shiraz box in the south-central part and the Mashhad box in the northeastern part of Iran have been chosen as indicators to investigate the spatial climate variations across Iran. The Shiraz box is located in a synclinal plain of the Zagros Mountain range in Fars province in the south-central part of Iran. The climate of Shiraz box is semi-arid, with the average annual precipitation of 337 mm and long-term mean annual temperature of 18 °C. Chenar-rahdar River with a wide discharge range from 0.02 to 5.28 m3/s−1 and the discharge average of 0.75 m3/s−1 (measured in Chenar-rahdar gauge station) is the main river in the Shiraz box (Figure 1). The Mashhad box located in the northeast of Iran in Kopeh Dagh mega anticline is a semi-arid region with an average annual precipitation of 250 mm [43]. Kardeh River is one of the largest rivers in Khorasan Razavi province located in the Mashhad box with a discharge varying from 0.05 to 6.16 m3/s−1 and average discharge of 0.64 m3/s−1 (measured in Kardeh gauge station) (Figure 1).
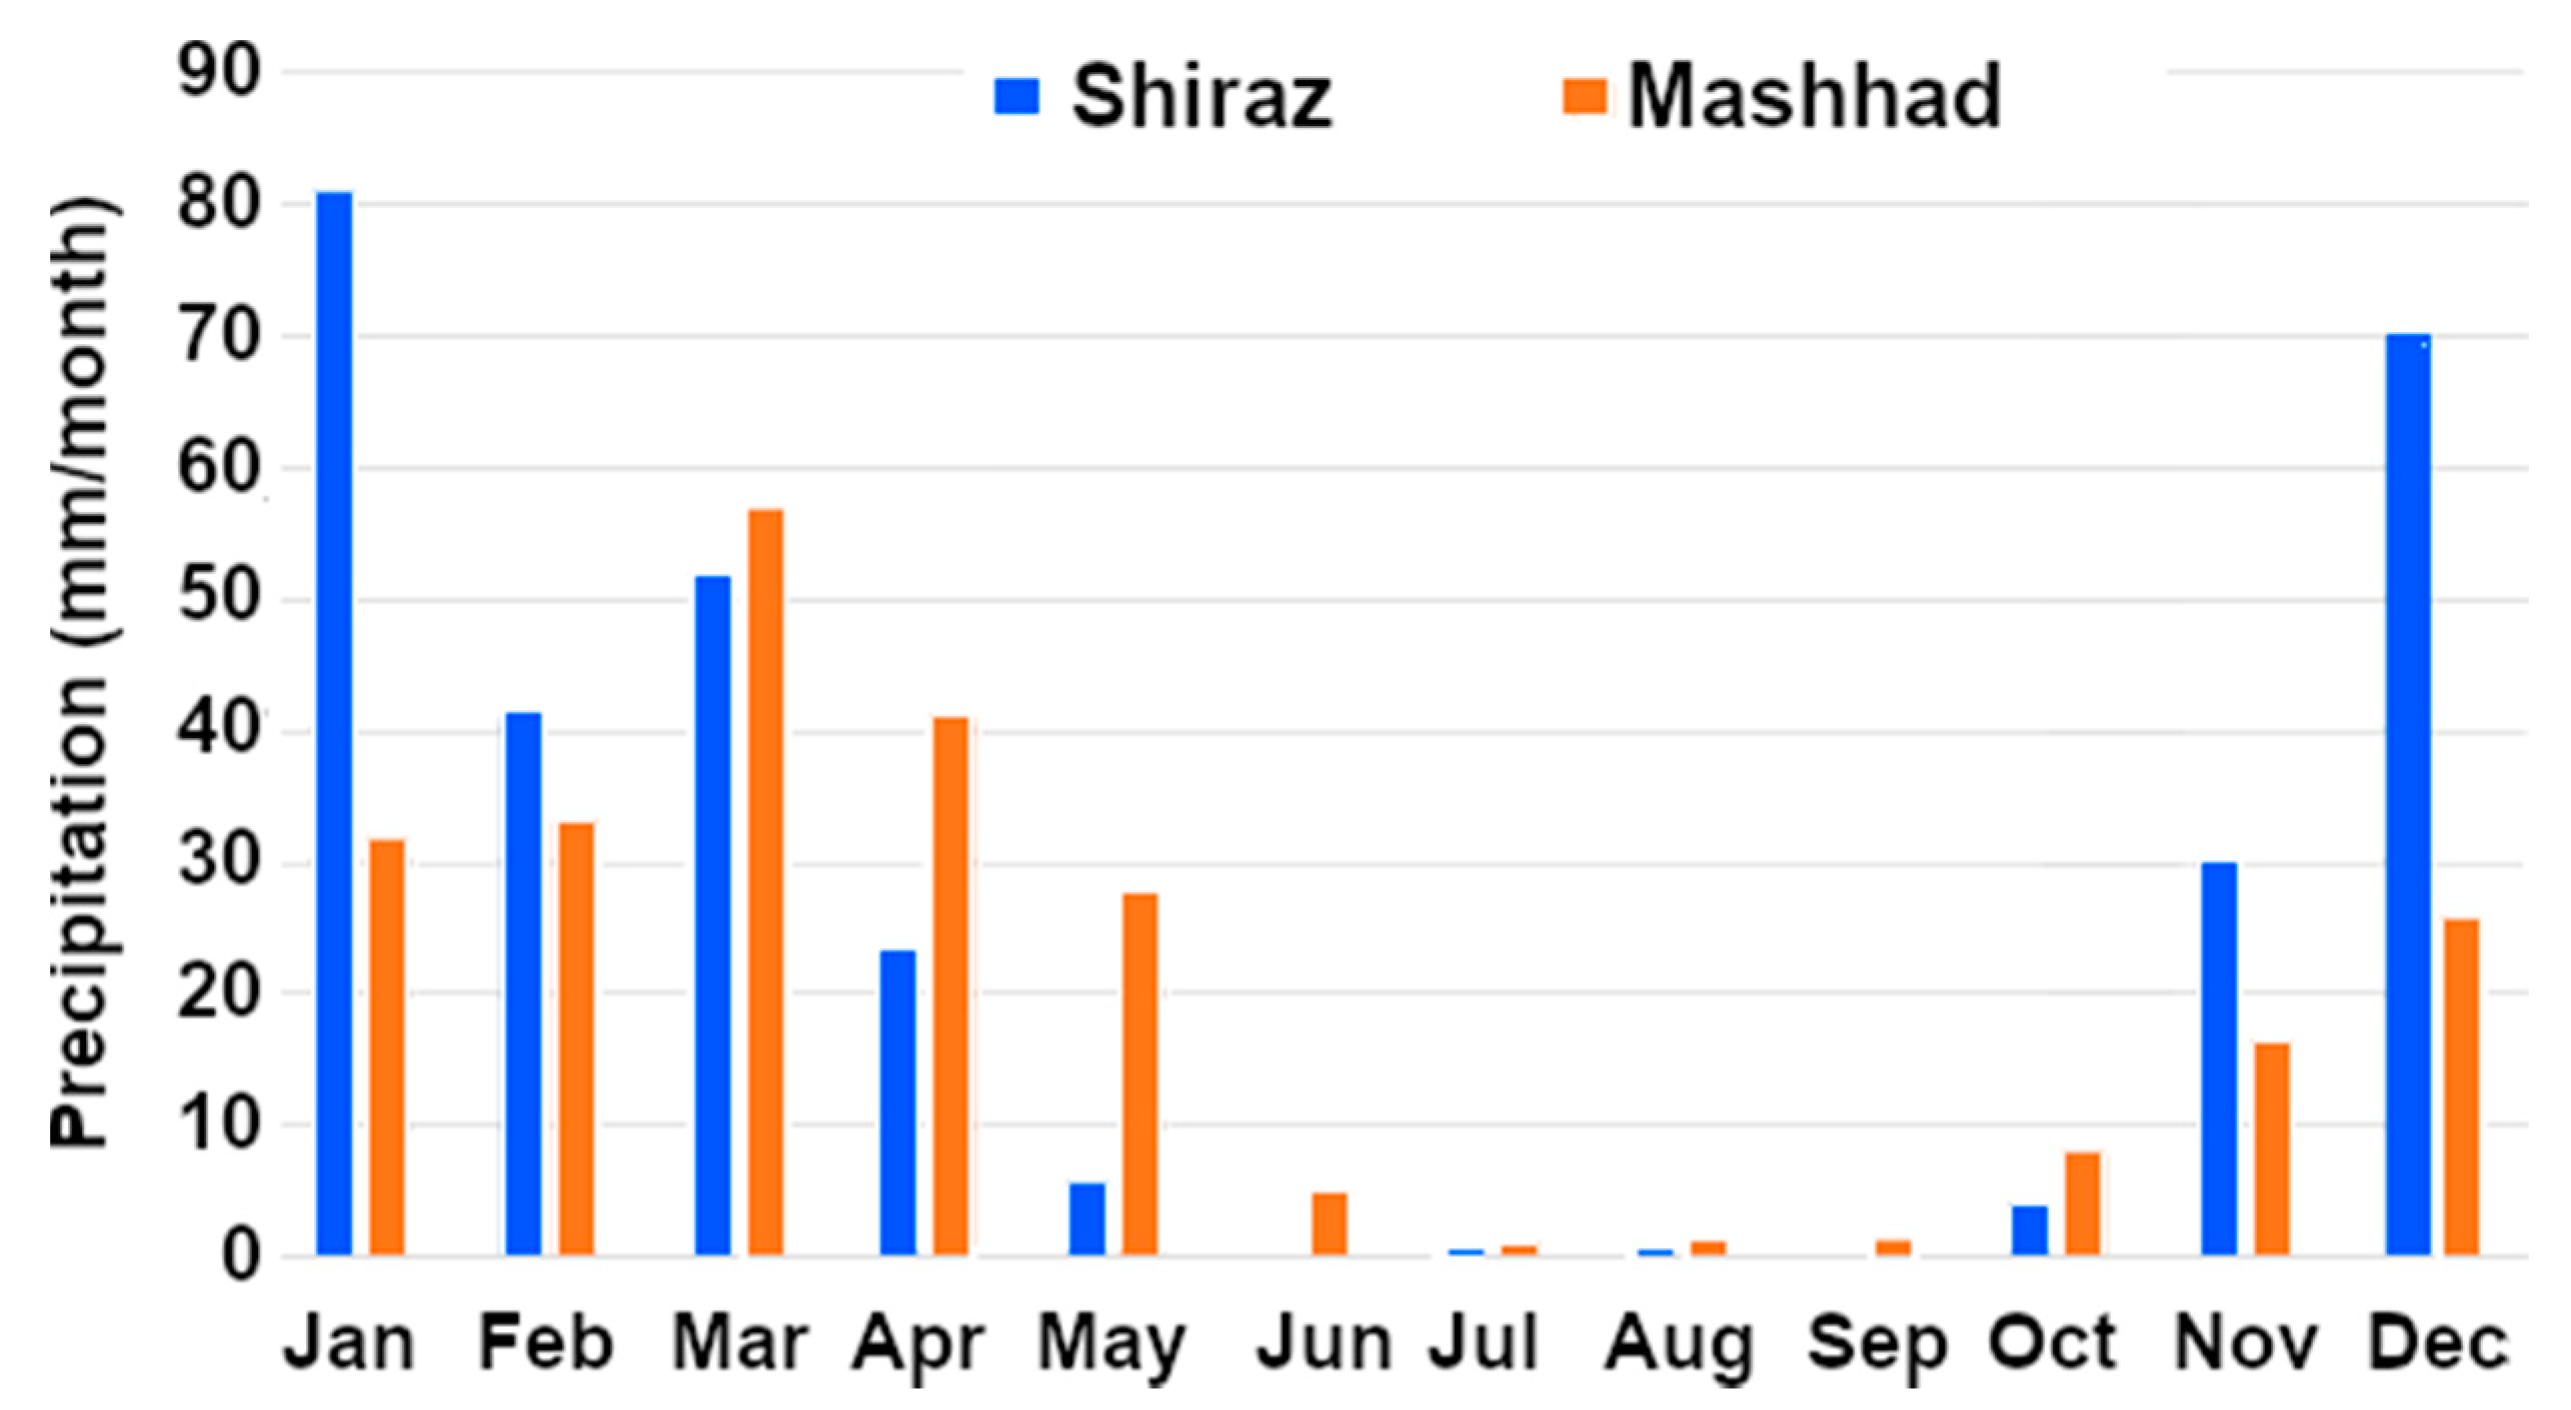
The monthly precipitation variations of Mashhad and Shiraz boxes (Figure 2) confirms the climate variations across Iran. In Shiraz box, most of the precipitation occurs during winter to early spring (December to March). However, in Mashhad box, spring time precipitation (March to May) is dominant, while winter precipitation events (December to February) have a minor role. During summer (June to September), the Mashhad box demonstrates a very low amount of precipitation, while for the Shiraz box, precipitation is almost null.
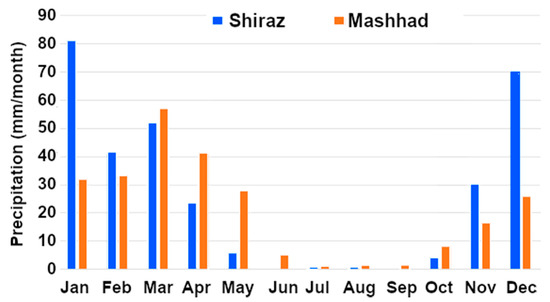
Figure 2.
Monthly precipitation variations in Mashhad and Shiraz boxes based on 1981–2014 data derived from Iran Meteorological Organization.
3. Materials and Methods
To investigate the origin of moisture arriving in Shiraz and Mashhad boxes has been utilised the Lagrangian particle dispersion model (FLEXPART v9.0) developed by Stohl and James [21,22]. Respect previous versions of the model, in our experiment, FLEXPART v.9 allows considering a greater number of air particles, near 2 million, each representing a part of the whole atmospheric mass. There are diverse options for how particles are generated in the model, and what they represent (air, or a certain trace gas). FLEXPART permits the tracking of global air masses forward and/or backward in time, or it just considers the air masses residing over a target region using the atmospheric winds. Along each particle trajectory, the specific humidity (q) can be interpolated to compute the net change of the water content because of the mutual effects of evaporation (e) and precipitation (p). This calculus in Equation (1), was obtained over cycles of 10 days, considering the water vapor average residence time in the atmosphere [44,45]. In this calculation, a small error occurs for considering constant the mass (m) of every particle. Nevertheless, Stohl and James, [22] consider that the atmosphere’s mass changes slightly through the addition and removal of water.
Resolving the Equation (1) for all particles (K), residing over an area A, permits to diagnose the surface freshwater flux (Evaporation (E) − Precipitation (P)) according to the Equation (2)
To identify the moisture sources for the Mashhad and Shiraz boxes (Figure 1), the air masses residing over each box were tracked backward in time. Where (E − P) > 0 indicate those regions where prevail the moisture uptake by air masses before reaching the Mashahd and Shiraz boxes. Conversely, those regions where the moisture loss prevails, (E − P) < 0, are considered moisture sinks. Positive values of (E − P) have only been considered, due to the main goals of this survey which tries to determine the predominant moisture sources for the Shiraz and Mashhad boxes. The analysis was performed for the wet (November–April) and dry (May–October) periods from 1981 to 2015. The length of dry and wet periods has been specified in previous studies of the precipitation in Iran [36,37] and also Iran meteorological database. To delimit the most important seasonal moisture sources according to the moisture uptake intensity, a percentile method was applied. This approach has been previously utilised for the same objective by several authors [28,46,47]. The sources are separated into marine and continental, which further allows comparing the amount of moisture uptake ((E − P) > 0) over each one.
The main advantage of FLEXPART respect Eulerian methods is that it allows to compute the budget of (e − p) along the particles trajectories [19]. Besides, it utilises turbulence and convection parametrizations, which are particularly important to simulate the moisture changes in the atmosphere [48,49]. Nevertheless, although the model has numerous advantages, it has some limitations—including its weakness to calculate the precipitation (P) and evaporation (E) severally. However, when rain falls, it normally exceeds evaporation. Thus, supposing that E and P cannot coexist in the same location at the same time, the average instantaneous rates of E and P over a longer period (e.g., years), permits to estimate average E and P [21]. Another problem discussed by these authors is that q fluctuations along individual trajectories may occur for nonphysical reasons, such as q interpolation, or trajectory errors affecting the values of (e − p). However, these errors are partially annulled when considering the many particles in an atmospheric column over the area A. Further details about the model are described by [21].
In this study, FLEXPART input’s data belong to ERA-Interim reanalysis [50] at 6 h intervals (00:00, 06:00, 12:00, and 18:00 UTC) at a resolution of 1° in latitude and longitude on 60 model levels from 0.1 to 1000 hPa has been used. The closure of the water cycle in the global atmospheric reanalysis models—ERA-Interim Re-Analysis; Modern-Era Retrospective Analysis for Research and Applications (MERRA); and Climate Forecast System Reanalysis (CFSR)—was evaluated and compared with independent observations in the period 1989–2006, by [51]. Their results revealed that generally, ERA-Interim shows a reasonable closure of the terrestrial and atmospheric water balance and a reasonable agreement with the observation datasets. When using FLEXPART with ERA interim datasets, it is expected to reduce the uncertainties of (E − P) and thus representing better the hydrological cycle.
Precipitation data for both the Mashhad and Shiraz boxes have been provided by Iran Meteorological Database from 1981 to 2014. Drought and wet conditions in the Mashhad and Shiraz boxes have been identified using the standardized precipitation index (SPI) [52] by DIP software developed in Iran’s Ministry of Energy [53]. The positive SPI values demonstrate wet conditions, while negative values demonstrate drought conditions. The intensities of wet and drought conditions have been determined according to the classification of Mckee [52] (Table 1). On the other hand, the hydrological droughts in Chenar-rahdar River in the Shiraz box and Kardeh River in the Mashhad box have been investigated by the standardized streamflow index (SSI) [31]. Monthly discharges data of Chenar-rahdar (Sept. 1982 to Sept. 2013) and Kardeh (Sept. 1984 to Sept. 2008) rivers were provided by Khorasan Razavi and Fars Regional Water Authority.

Table 1.
SPI classification according to McKee et al. [52]
Other precipitation datasets utilized in this study with a resolution of 0.5° × 0.5° were from the Climatic Research Unit CRU3.23TS [54]. Datasets of Omega (vertical velocity) were used to diagnose the seasonal atmospheric stability over Shiraz and Mashhad boxes was available at [55]. The regression method was used to verify the effects of climatic indices, namely Bivariate ENSO (BEST) [56], North Atlantic Oscillation (NAO) [57], Southern Oscillation Index (SOI), and Quasi-Biennial Oscillation (QBO) indices (derived from [58,59]) on moisture uptake sources, extreme drought and wet conditions in the Shiraz and Mashhad boxes, and Chenar-rahdar and Kardeh river discharges.
4. Results and Discussion
4.1. Identification the Main Moisture Uptake Sources for the Shiraz and Mashhad Boxes and Their Contribution Rates
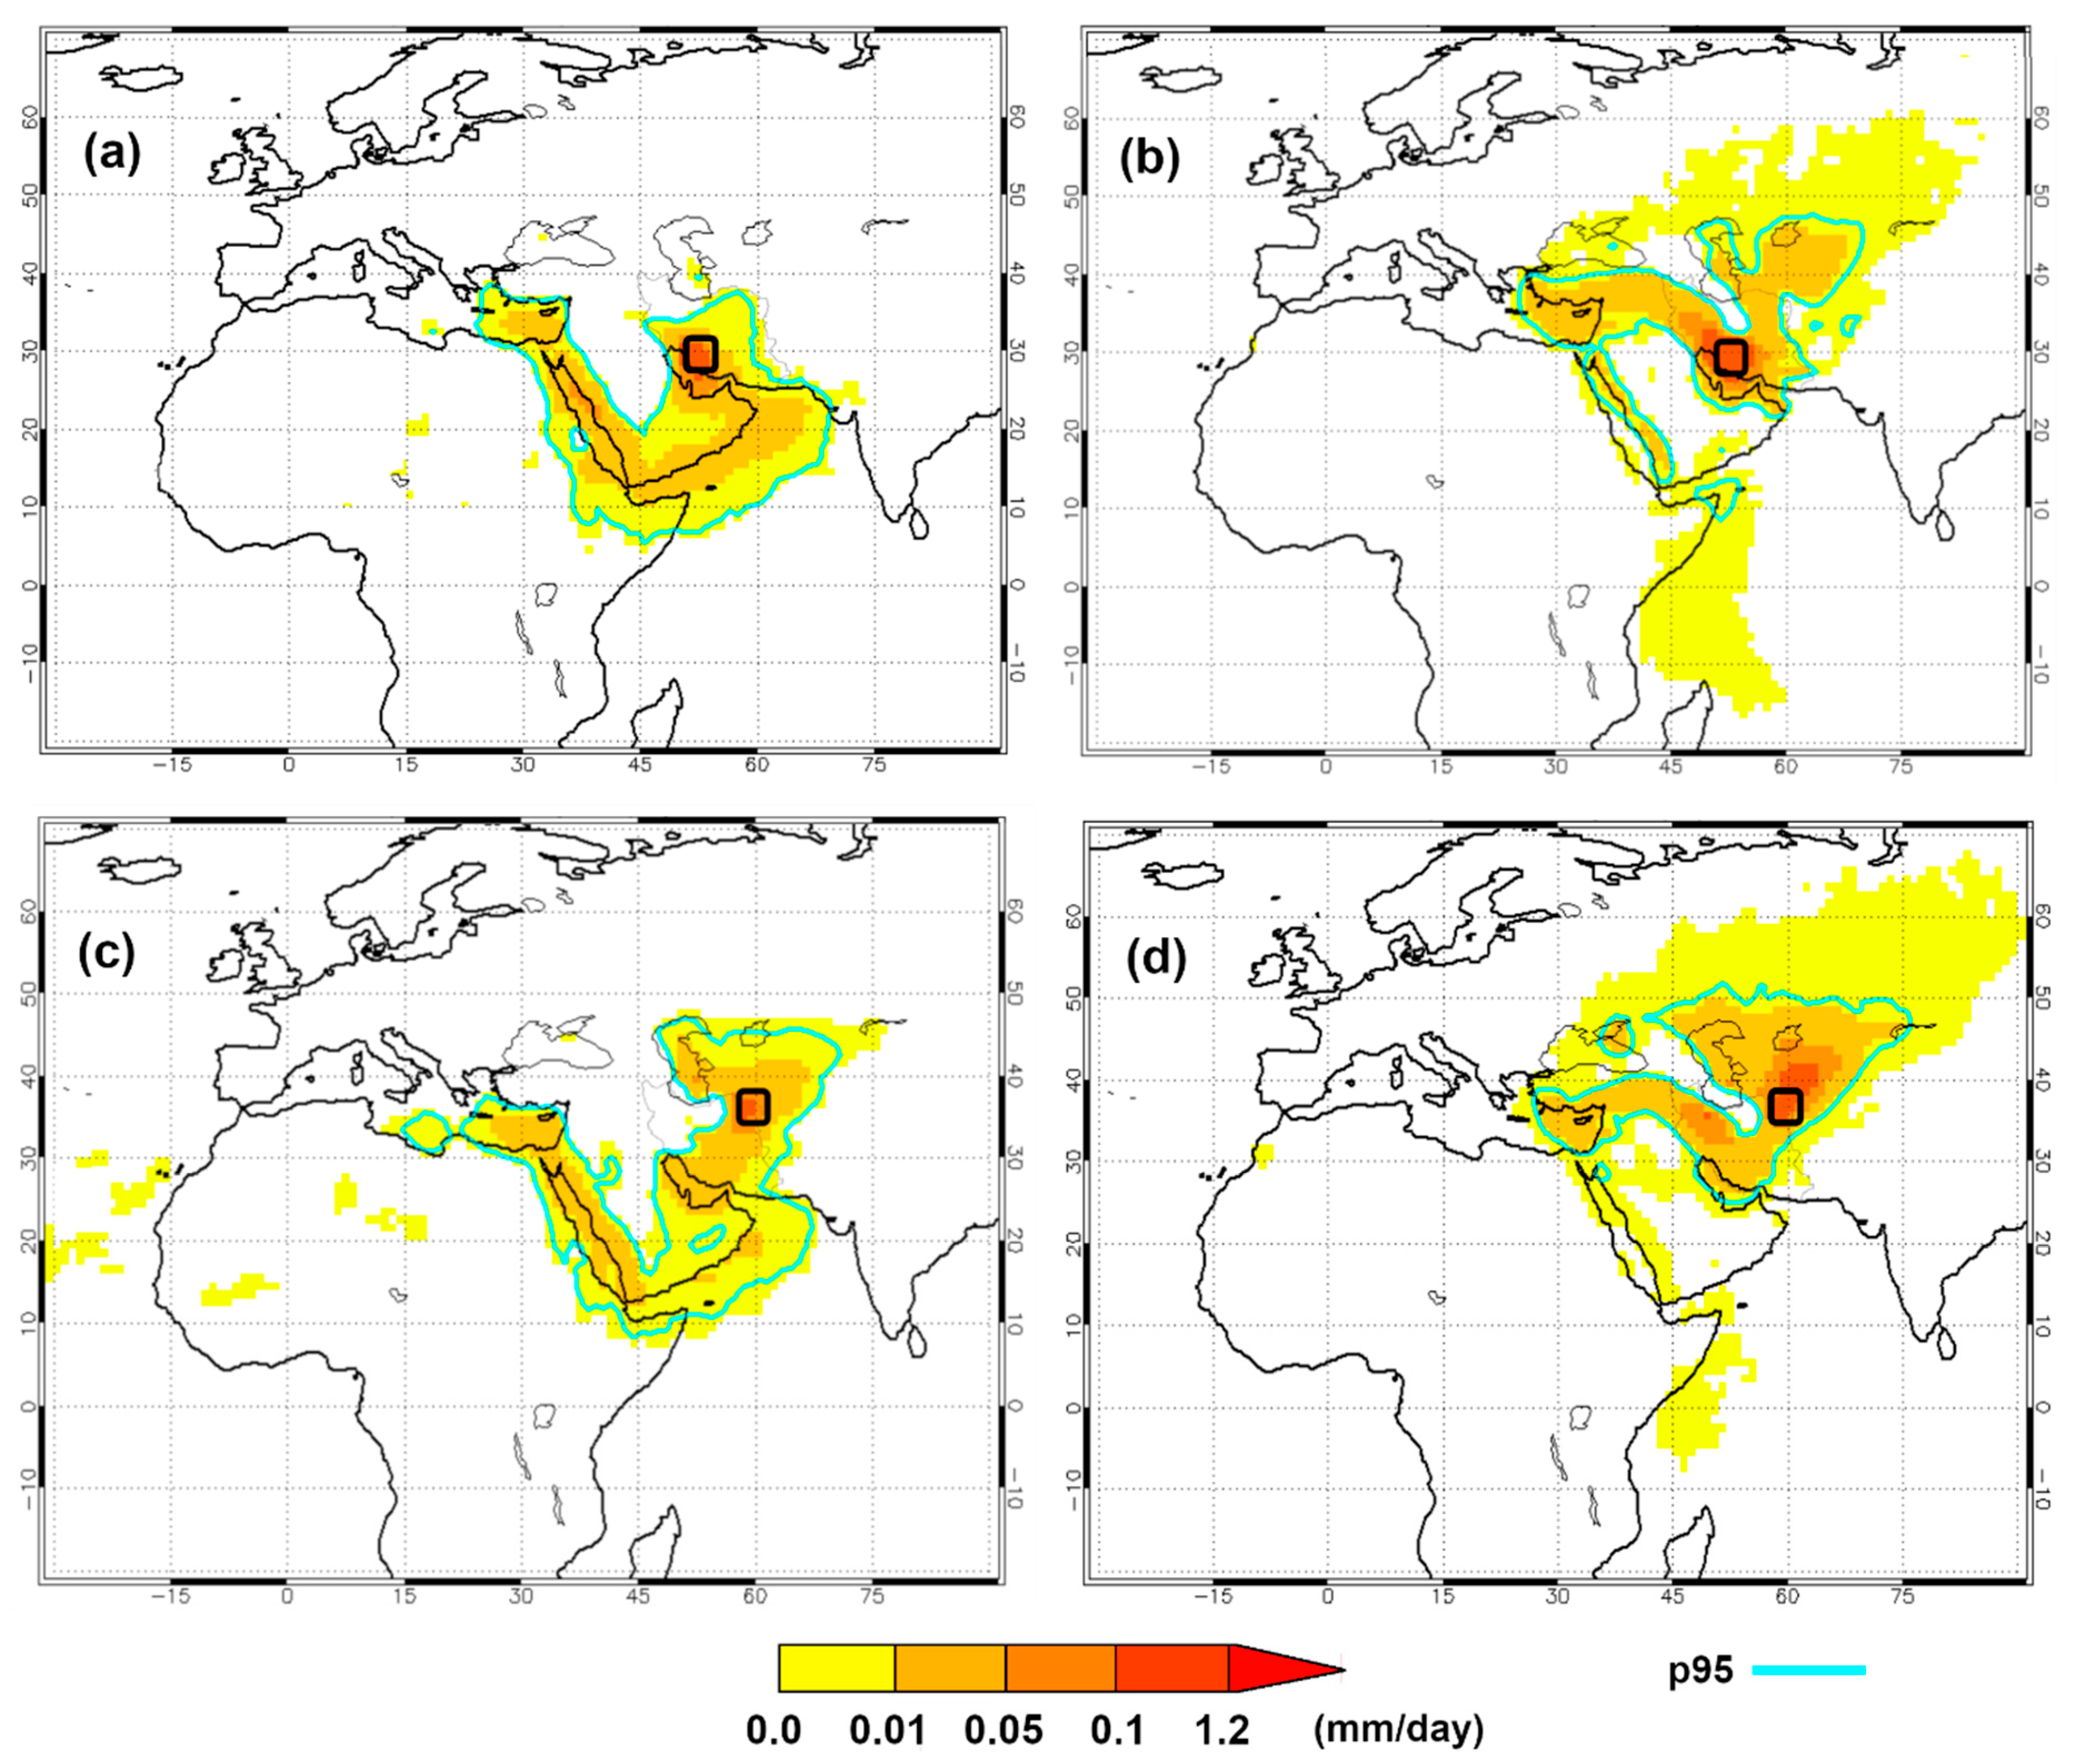
The dominant moisture origins have been identified for the Shiraz and Mashhad boxes (Figure 3). The p95 delimitation of maximum moisture uptake is represented by the light blue line. Thus, over these regions within the light blue line is evident that the number of trajectories that coincide is high. In the wet period, the maximum (E − P) > 0 values obtained in air masses in travel to Shiraz and Mashhad boxes occur over the boxes themselves and to the south. In the dry period, the most intense (E − P) > 0 still occur over both boxes, but it is clear according to the visual analysis of Figure 3b,d, that most important regions supplying moisture to the boxes are located to their northeast.
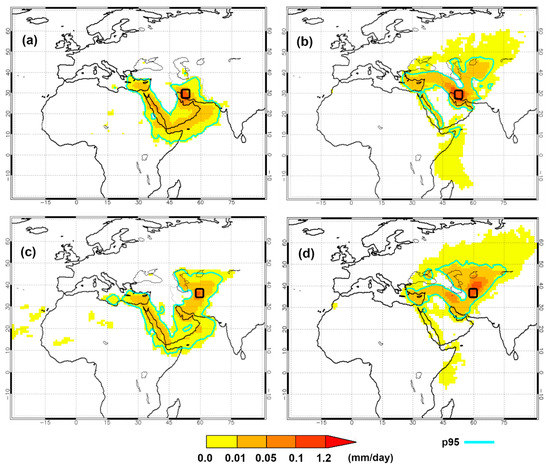
Figure 3.
(E − P) > 0 values (mm/day) obtained in air masses tracked backward in time from Shiraz and Mashhad boxes during the wet (November to April) (a,c) and dry (May to October) (b,d) periods, respectively, from 1981 to 2015. The light blue line shows the boundaries of 95 percentiles of (E − P) > 0.
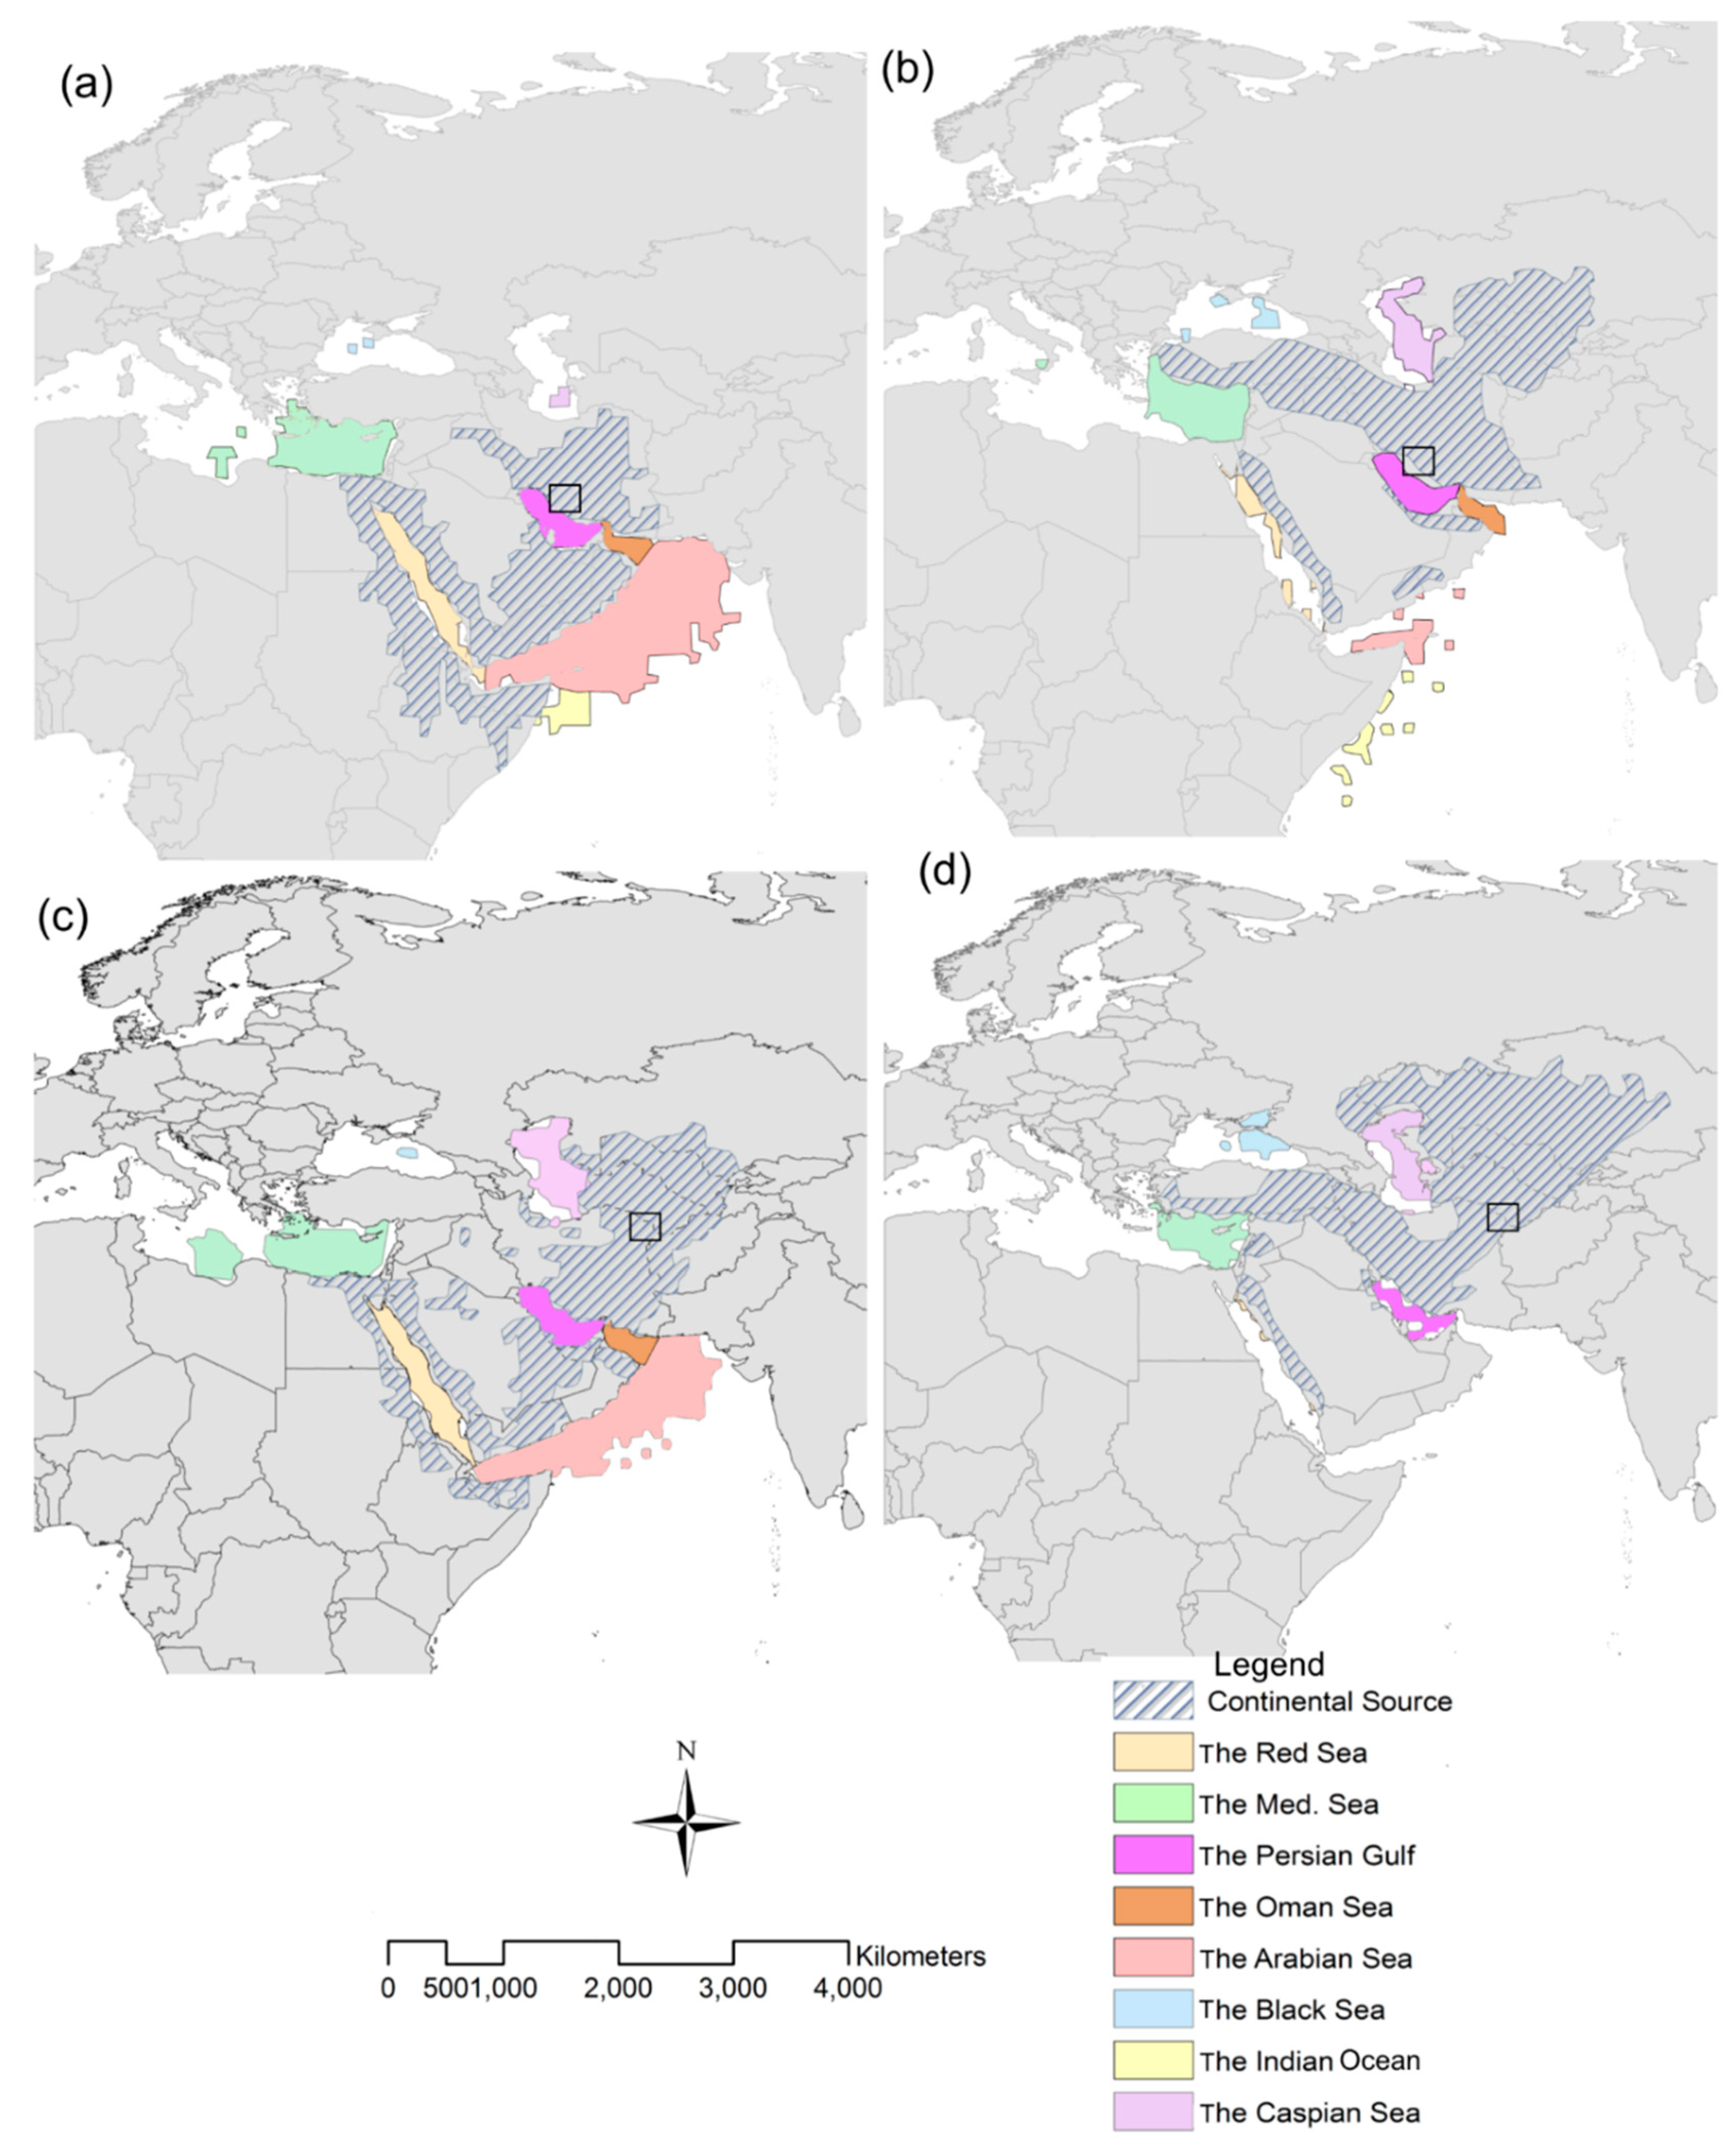
Those regions of great moisture uptake presented in Figure 3 have been divided considering the geographical locations. The spatial distribution of moisture uptake sources over the Shiraz and Mashhad boxes has been shown in Figure 4 and their contribution rates have been tabulated in Table 2.
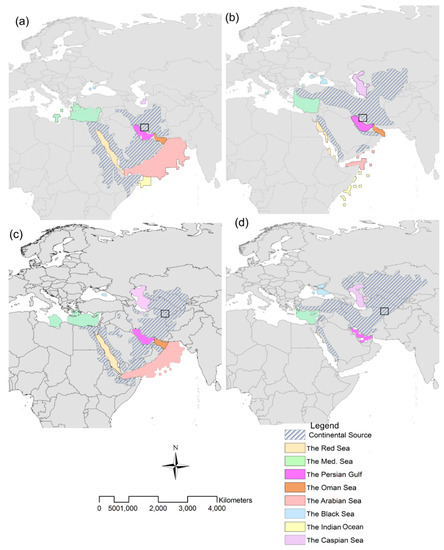
Figure 4.
Main continental and marine moisture sources over the Shiraz and Mashhad boxes in the wet (a,c) and dry (b,d) periods, respectively, according to p95 percentile of (E − P) > 0 boundaries in Figure 2.

Table 2.
The percentage of moisture uptake from diverse marine origins during the wet and dry periods for the Shiraz and Mashhad boxes from 1981 to 2015
During the wet period, marine moisture sources provide 52 and 40 percent of total moisture income to Shiraz and Mashhad boxes, respectively. However, during the dry period, the role of marine moisture sources highly decreases and reaches 20 and 14 percent of total moisture uptake by air masses in travel to Shiraz and Mashhad boxes, respectively [60].
Although the continental moisture sources play a dominant role over Iran mainly during the dry period, these sources do not lead to a considerable precipitation and their influences are limited to local precipitation events [34,40]. (E − P) > 0 and precipitation amount correlation in Shiraz and Mashhad boxes have also asserted this reality (Supplementary Figure S1). Because the following survey tries to determine the main moisture sources which affect Iran’s precipitation throughout the year, only marine sources are considered in this study. The percentage of moisture uptake from various marine sources for Shiraz and Mashhad boxes has been tabulated in Table 2. The superior moisture uptake sources for the south-central (the Shiraz box) and northeastern (the Mashhad box) parts of the country and also for the dry and wet conditions are different. In the south of Iran, the role of moisture arriving from the Arabian Sea is dominant during the wet period, while the moisture sources located in the Mediterranean and the Arabian Seas are dominant in the north of Iran. During the dry period, the moisture uptake from the Caspian Sea and the Persian Gulf dominantly intensify in the north and south of Iran, respectively [60].
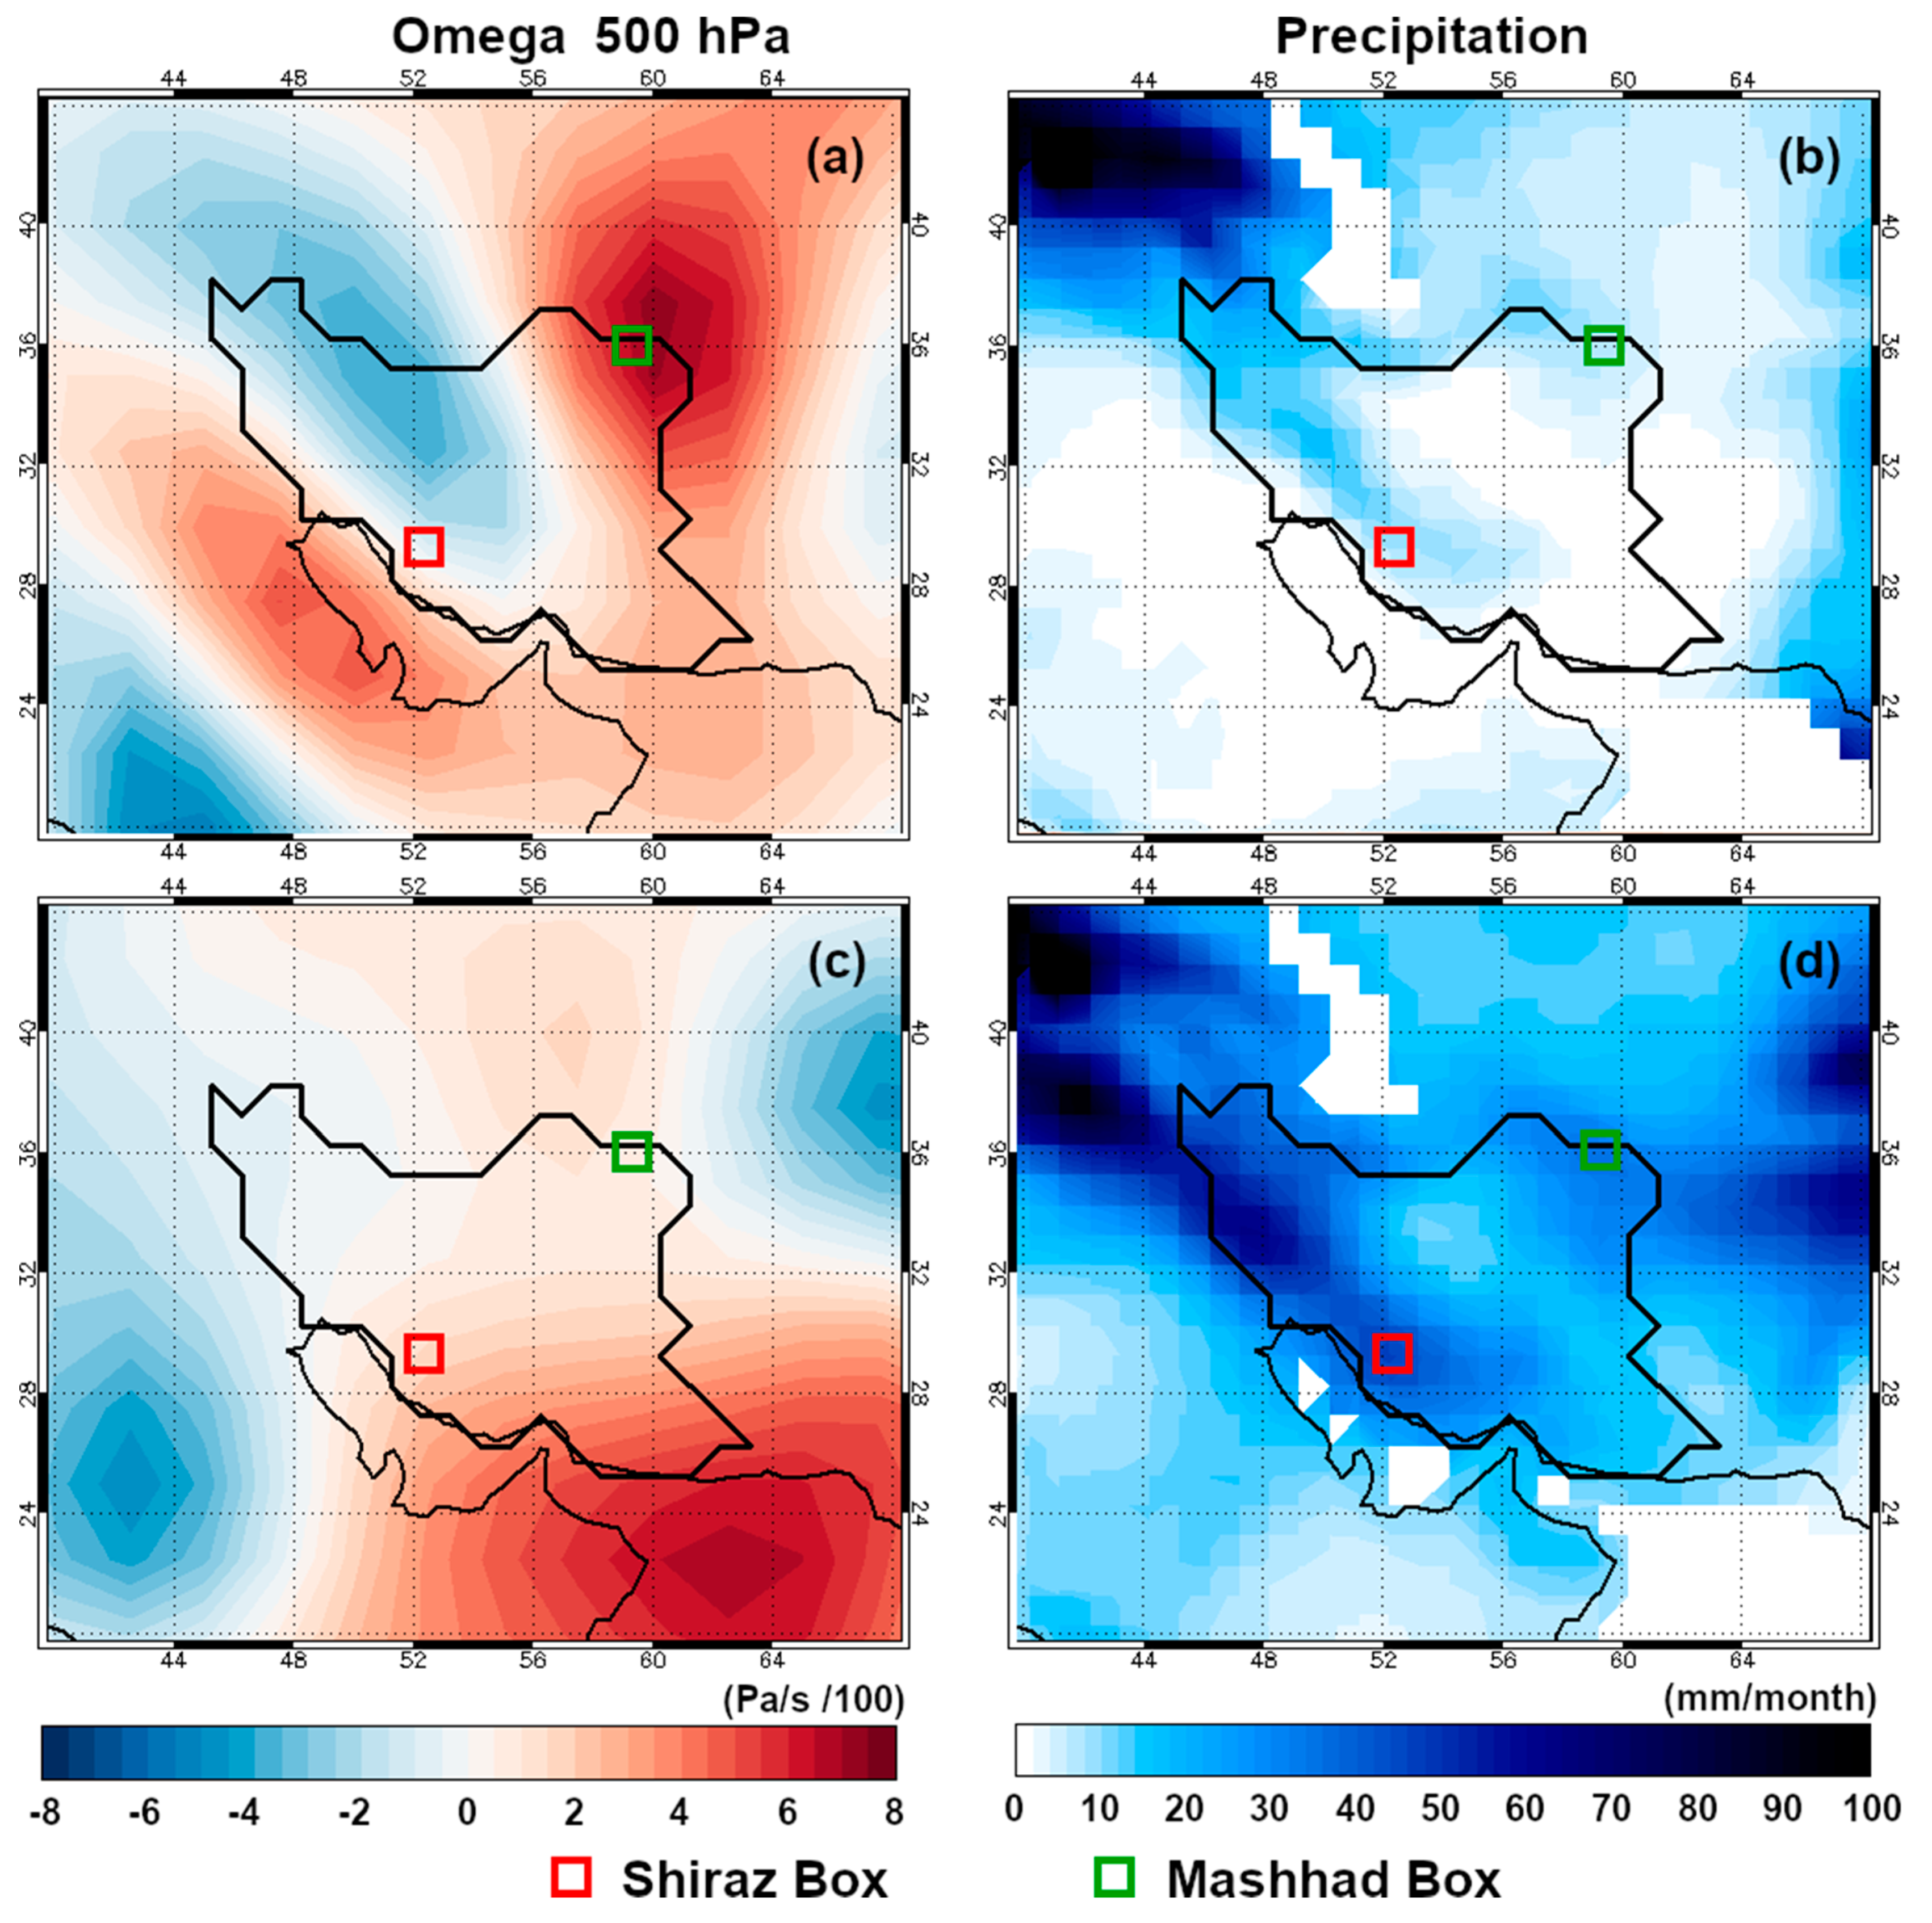
During the wet period, the roles of the Mediterranean (MedT) and Continental polar (cP) air masses in transferring moisture to the northeast of Iran (Mashhad box) are more dominant, while the continental tropical (cT) air mass transfers the dominant part of moisture to the south-central part of Iran (Shiraz box). Although moisture uptake from marine and continental sources is also high in the dry period, this moisture cannot lead to precipitation due to the influence of Azores subtropical high-pressure system over Iran causing an intense atmospheric stability over large parts of Iran and preventing precipitation [34,40,61]. Monthly precipitation distribution and ω variations over Mashhad and Shiraz boxes have been demonstrated for the dry and wet periods in Figure 5. The positive values of omega indicate descending motion of air parcels and stability in atmosphere and on the contrary negative values of Omega represent ascending motion and instability in atmosphere [62].
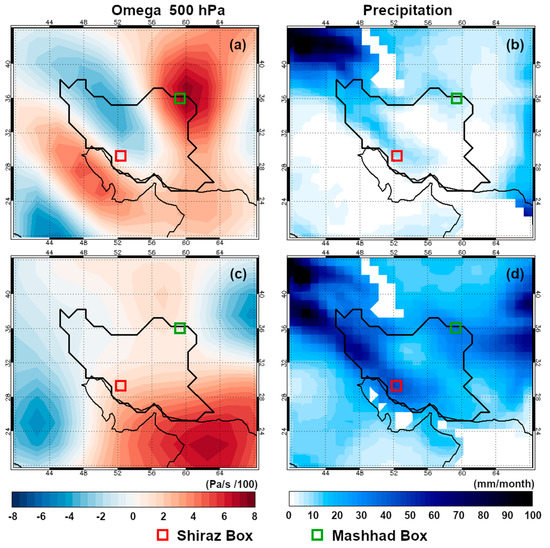
Figure 5.
The stability of atmosphere (Omega ω) variations (a,c) and precipitation amount distribution (b,d) over Iran and nearby regions for the dry and wet periods, respectively (1981–2014).
4.2. Studying the Role of Marine Moisture Uptake Sources on Extreme Drought and Wet Conditions in the Shiraz and Mashhad Boxes
Extreme drought and wet conditions in the Shiraz and Mashhad boxes have been studied by the calculation of 1-month, 6-month, and 12-month SPI (Supplementary Figure S2). Both of these boxes showed disparity in SPI values which are related to a severe continental effect dominating large parts of Iran. Some of the wet and drought conditions in Shiraz and Mashhad boxes were severe according to Mckee classification [52] and continuous for several months. For example, the drought conditions which occurred from April 2008 to February 2009 in the Shiraz box and the drought conditions which occurred from April 2000 to October 2000 in the Mashhad box are among the most severe and continuous drought conditions in these two boxes. On the other hand, the most severe and continuous wet conditions happened from January 1993 to November 1993, February 1996 to November 1996, and also December 2004 to November 2005 in the Shiraz box. However, in the Mashhad box, the most intense and continuous wet conditions happened from January 1982 to December 1983, February 1986 to December 1986, and also June 1992 to March 1994. Extreme wet and drought conditions have also been observed in the discharges of Chenar-rahdar River in Shiraz and Kardeh River in Mashhad boxes. SSI index also showed that extreme drought conditions occurred during September to November 1984, November 2002 to February 2003, and also June to August 2008 in Kardeh River discharges. However, extreme wet conditions happened during March 1992 to January 1994, February 1998 to August 1998, and March 2007 to January 2007. In the Shiraz box, the most drought conditions occurred during December 1982 to February 1984, May 1984 to October 1986, and also December 1997 to October 1998 in Chanar-rahdar River discharges. On the other hand, the most wet conditions observed in November 1994 to January 1995 and February 1996 to October 1996. It can be inferred that extreme wet and drought conditions mostly occurred in different periods of time in these two boxes which confirms that climate conditions vary across Iran.
The influence of marine moisture sources on 1-month, 6-month, and 12-month SPI has been verified by multi-regression method in Shiraz and Mashhad boxes (Supplementary Table S1). The resulted regression equations showed the highest correlation coefficient (r = 0.72) for the 6 month SPI in the Shiraz box during the wet period. The results also demonstrated that among the various moisture sources, the Arabian Sea directly influences the extreme wet and drought conditions in both the Shiraz and Mashhad boxes in the wet period p-value (<0.05). However, during the dry period, none of the moisture uptake sources influenced drought conditions p-value (>0.05) in both boxes. The direct influence of the Arabian Sea moisture source on 1-month, 6-month, and 12-month SPI for Shiraz box and 1-month SPI for Mashhad box during the wet period is due to its dominant role in providing moisture for precipitation. During the dry period, the moisture sources have no influence on SPI values due to the intense atmospheric stability caused by Azores subtropical high-pressure system over Iran which prevents precipitation. In this case, local parameters influence Iran’s precipitation mainly in the Zagros region and the Caspian Sea coasts [34,61].
4.3. Studying the Role of Climatic Teleconnections on Extreme Drought and Wet Conditions in the Shiraz and Mashhad Boxes
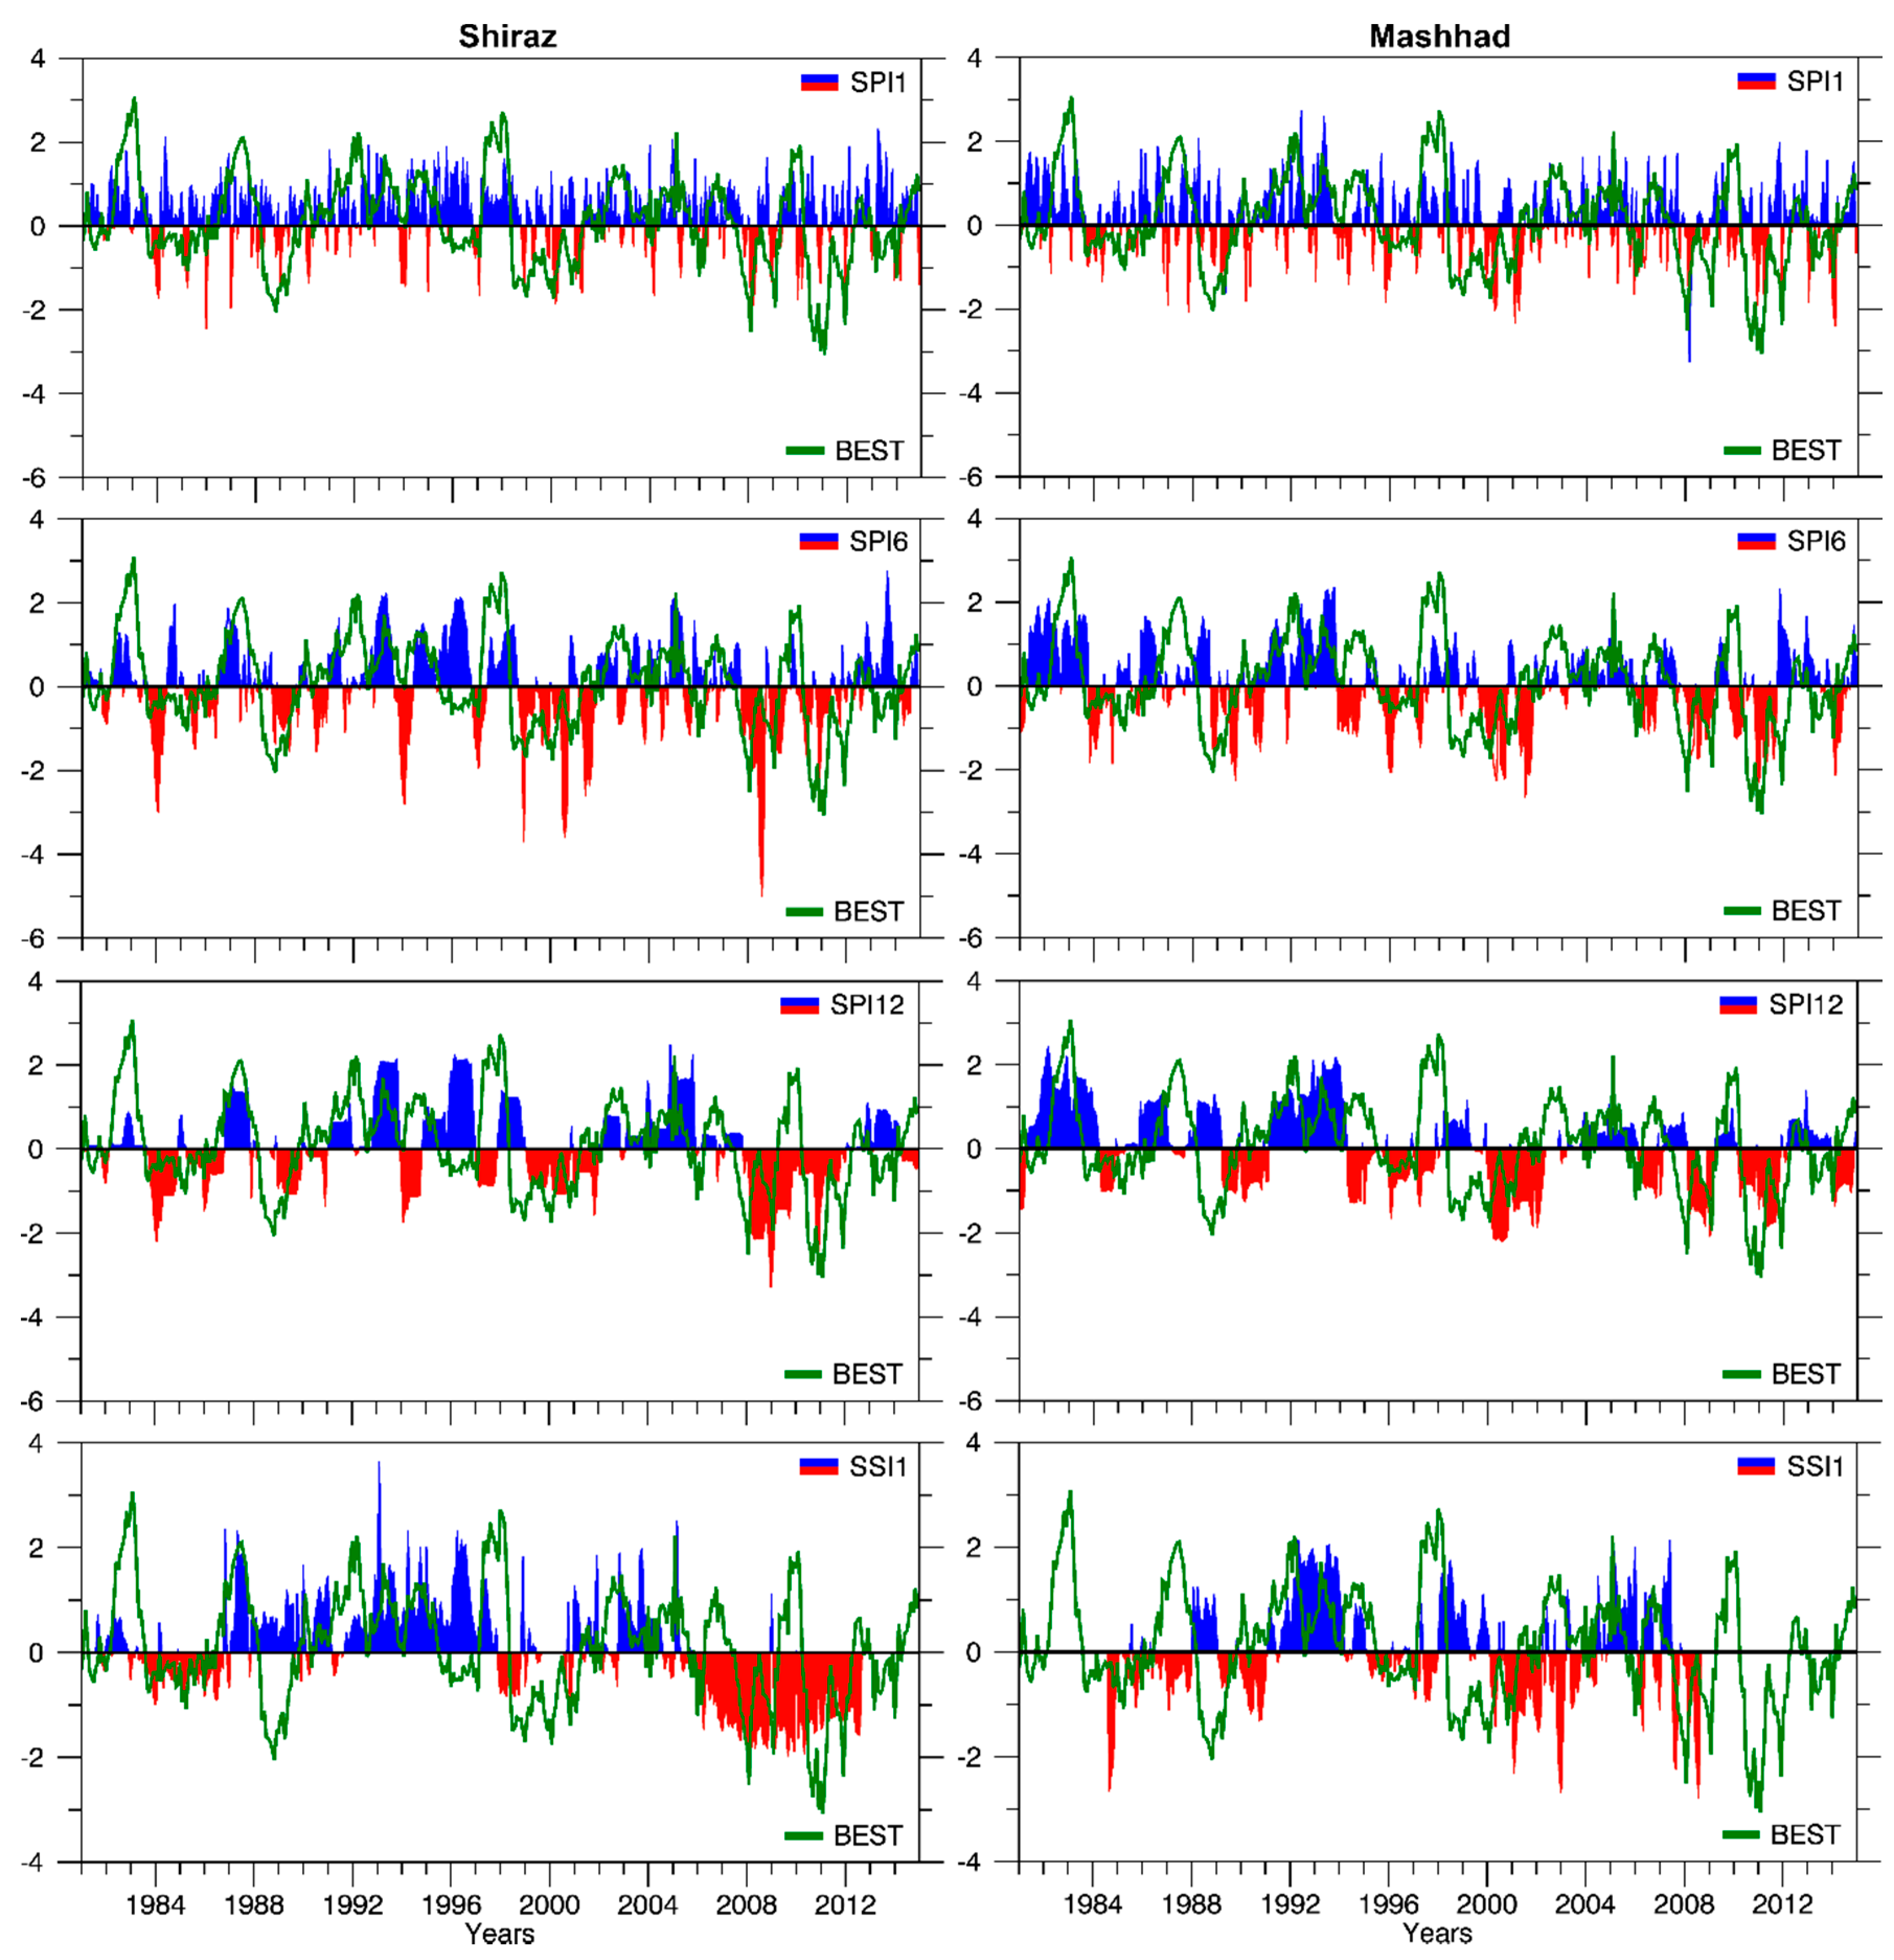
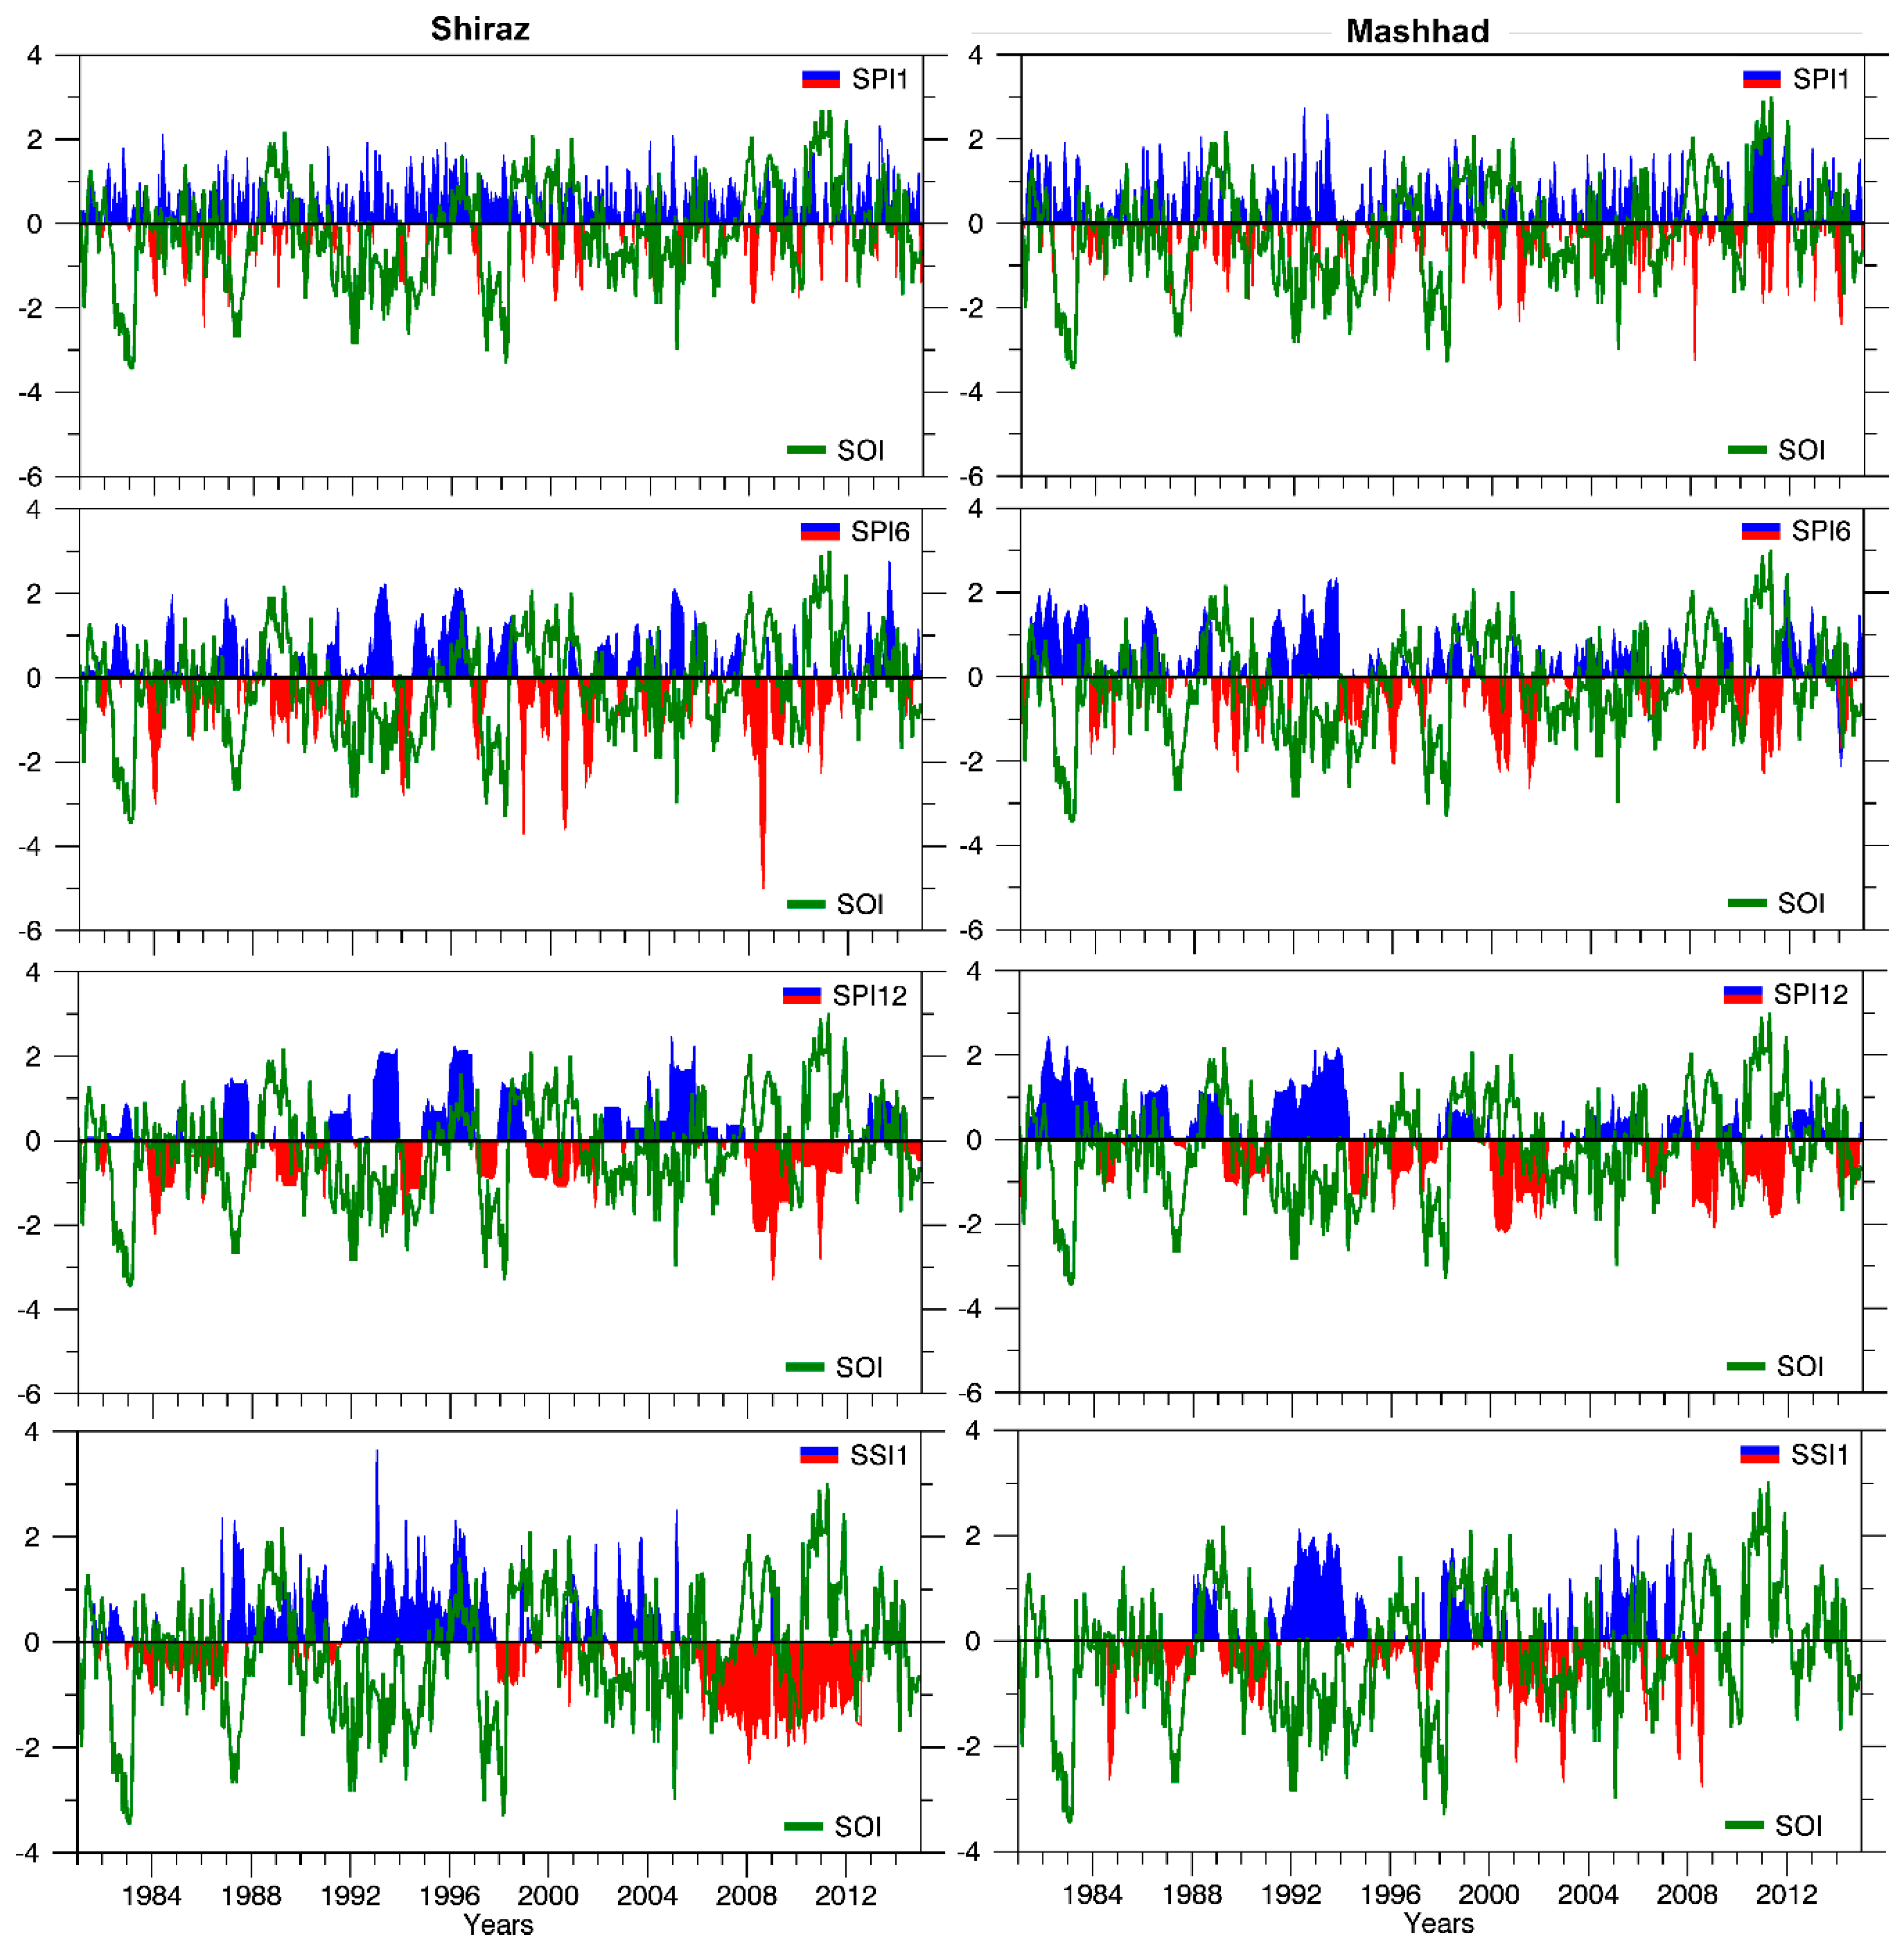
The role of climatic teleconnections on extreme drought and wet conditions in the Shiraz and Mashhad boxes and also Chenar-rahdar and Kardeh River discharges was studied using the simple linear regression method and least square method has been used to determine the best fit line. The models with the p-value (<0.05) show meaningful correlation between climatic teleconnection indices and (1-month, 6-month, and 12-month SPI) drought conditions, while the p-value (>0.05) demonstrated insignificant correlation. Extreme drought and wet conditions in Iran are not only influenced by local climatological components but also by large-scale climatic teleconnections. The results demonstrated that among BEST, SOI, NAO, and QBO indices (independent variables) only BEST and SOI indices directly influence 1-month, 6-month, and 12-month SPI and SSI (dependent variables) in the Shiraz and Mashhad boxes (Table 3). The regression models showed the highest correlation coefficient (r = 0.3) between BEST indices and 6-month SPI in the Shiraz box. In Table 3 positive correlation was observed between BEST and SPI and SSI values, while negative correlation was observed between SOI indices and these drought indicators. The drought conditions often occurred during the negative phase of BEST and the positive phase of SOI (La Niña phase). However, the wet conditions often occurred during the positive phase of BEST and the negative phase of SOI indices (El Niño phase).

Table 3.
Regression analysis between BEST, SOI, NAO, and QBO indices and 1-month, 6-month, and 12-month SPI and SSI hydrological drought index in the Mashhad and Shiraz boxes.
The temporal variations of monthly BEST and SOI climatic indices with 1-month, 6-month, and 12-month SPI and SSI for Shiraz and Mashhad boxes have also been shown in Figure 6 and Figure 7.
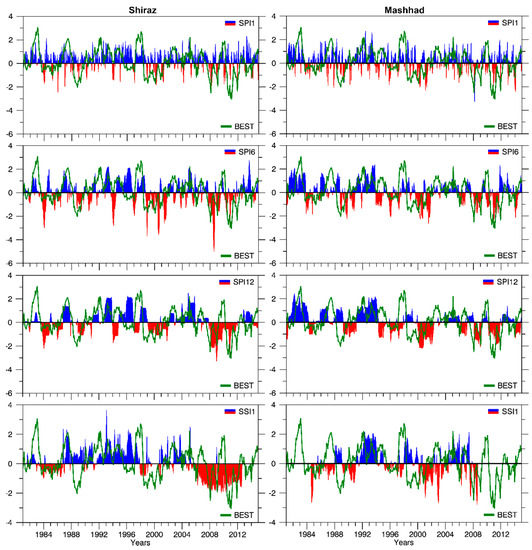
Figure 6.
Temporal variations of 1-month, 6-month, and 12-month SPI and SSI with the variations of BEST in the Shiraz and Mashhad boxes. Negative SPI and SSI values—drought conditions in red, positive SPI and SSI values—wet conditions in blue and BEST variations in green color.
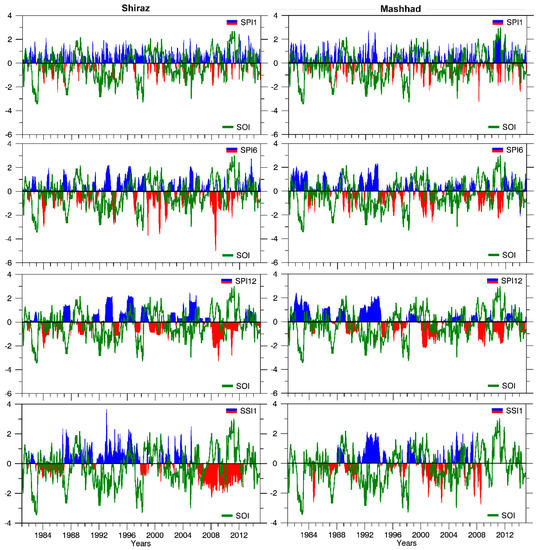
Figure 7.
Temporal variations of 1-month, 6-month, and 12-month SPI and SSI with the variations of SOI in the Shiraz and Mashhad boxes. Negative SPI and SSI values—drought conditions in red, positive SPI and SSI values—wet conditions in blue and SOI variations in green color.
4.4. Studying the Effect of the Dominant Moisture Sources on the Hydrology of Water Resources in the Shiraz and Mashhad Boxes
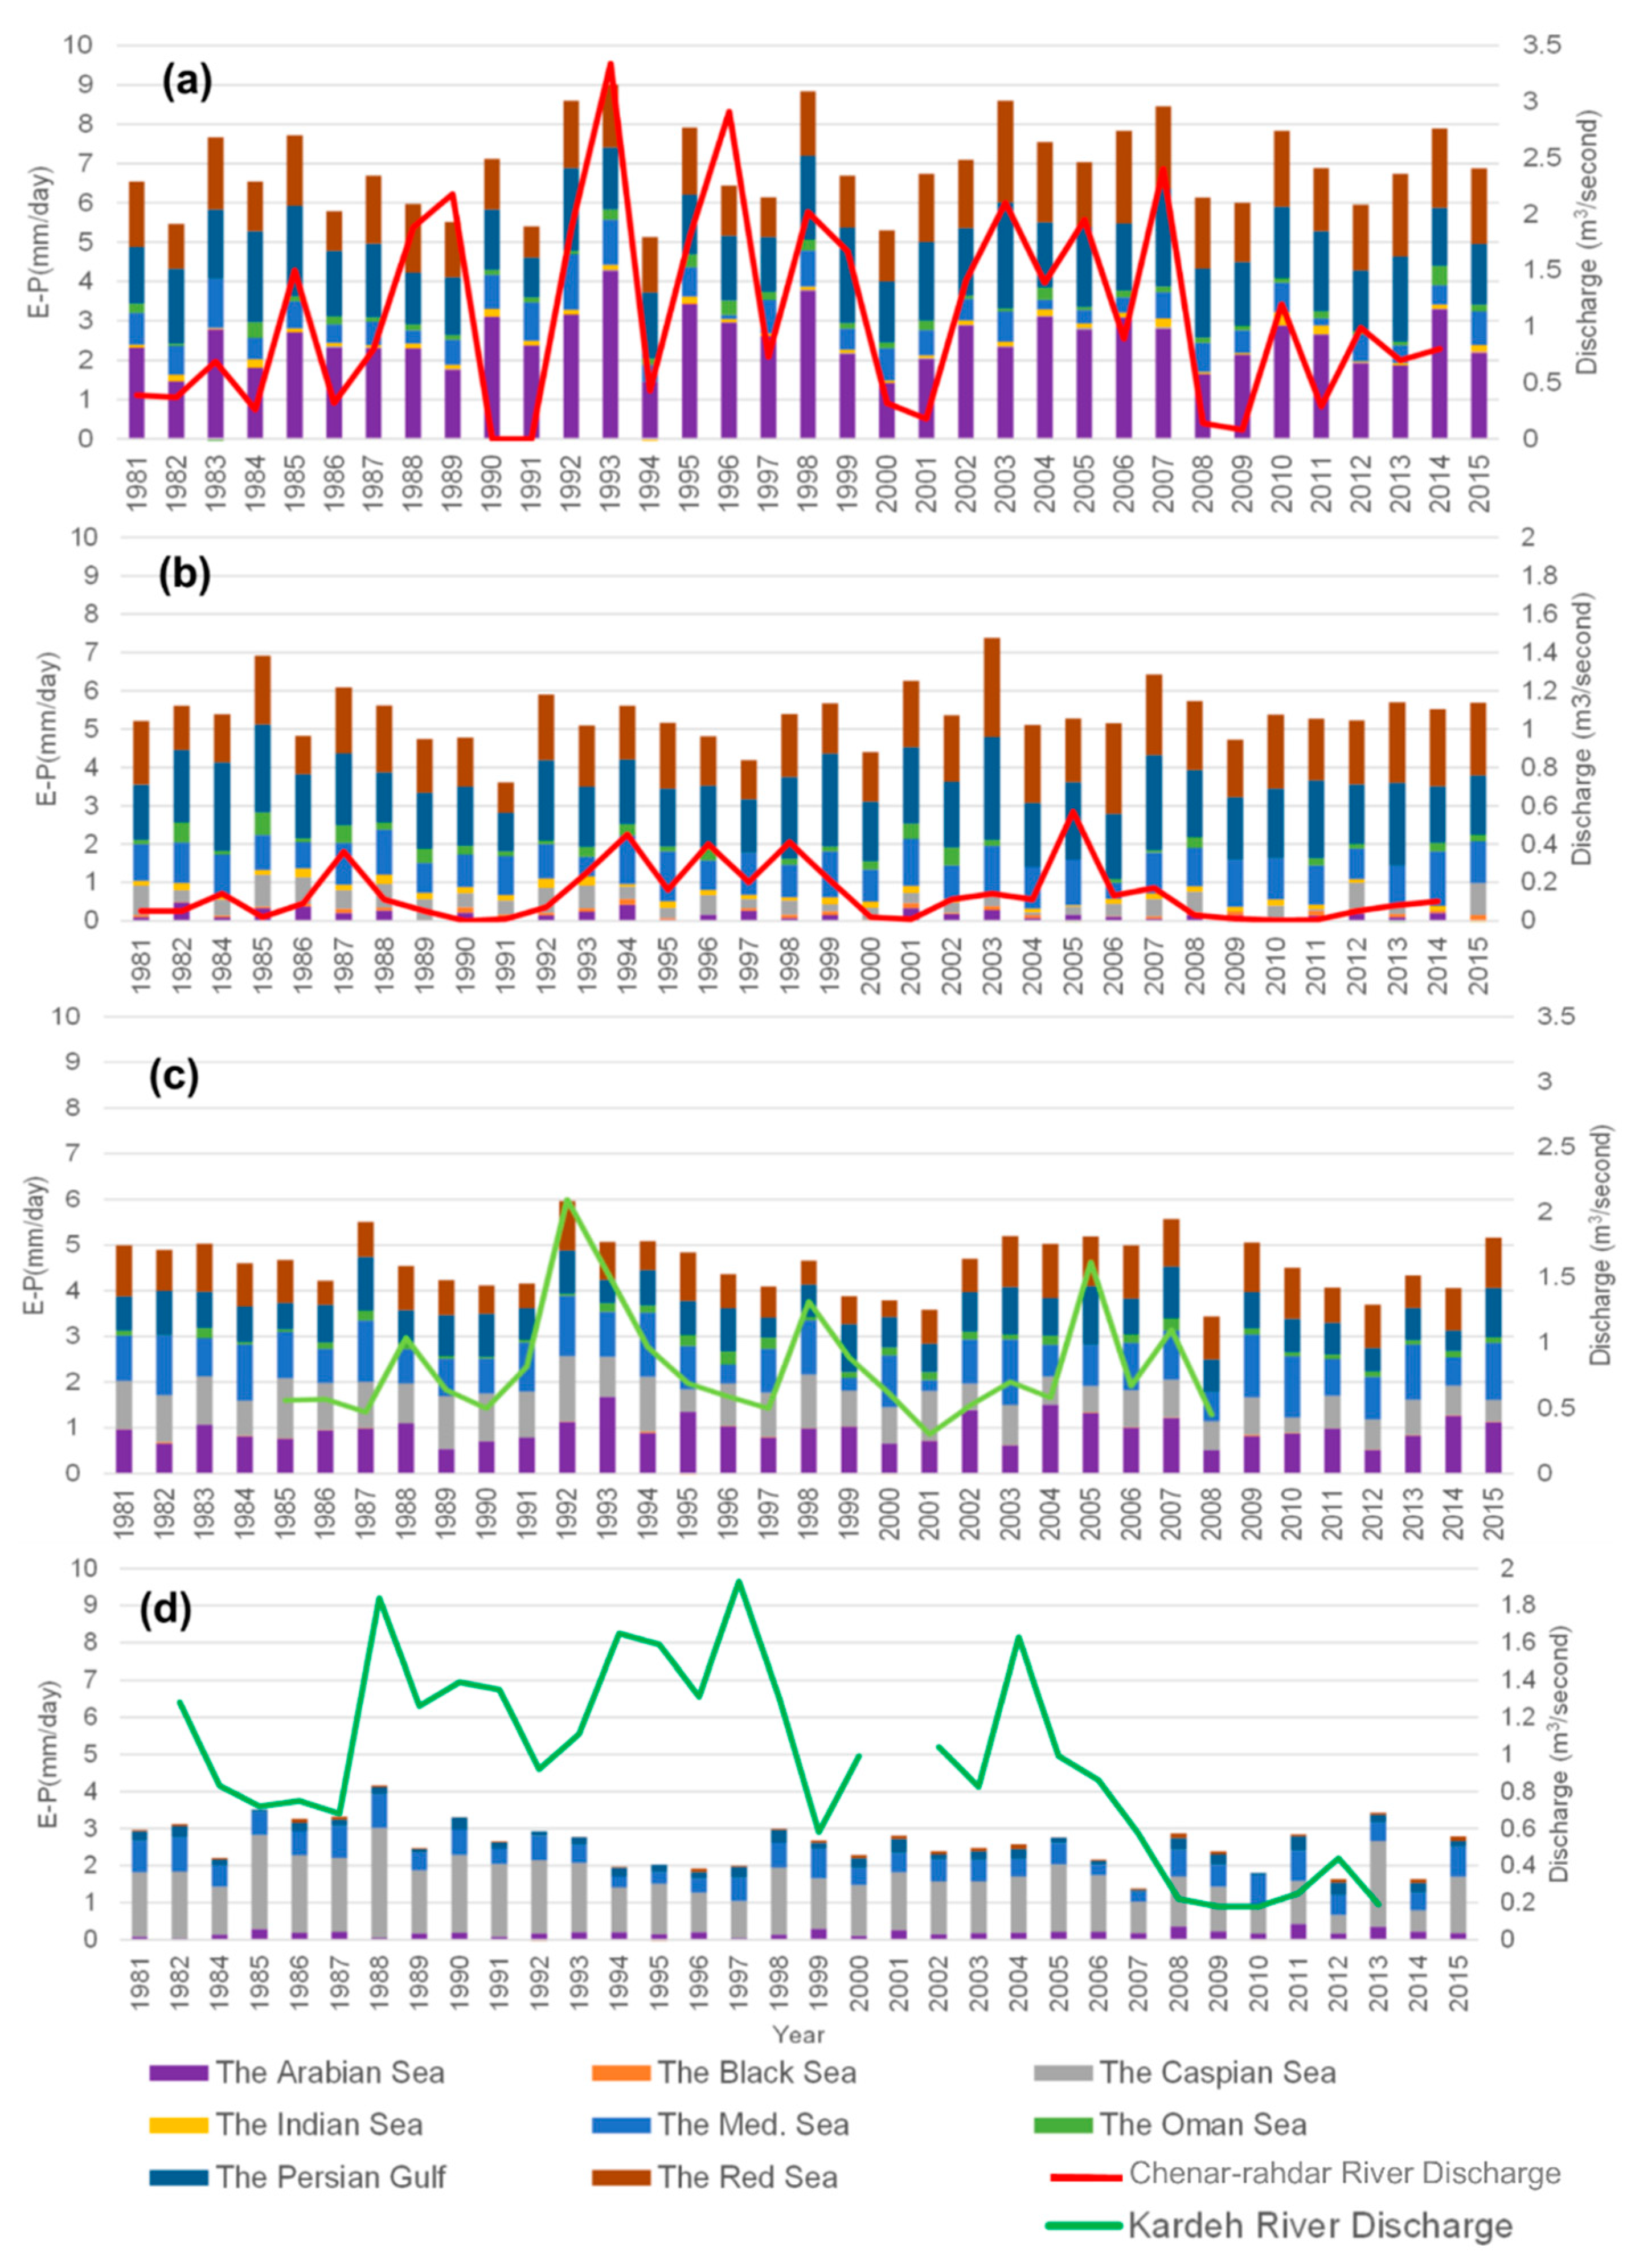
The temporal variations of moisture uptake rate from marine sources and Chenar-rahdar River discharges in the Shiraz box and Kardeh River discharges in the Mashhad box have been shown in Figure 8. During the wet period, the discharge variations of both rivers often follow the same trend as the total moisture uptake rate (E − P) > 0 (Figure 8a,c). This is because the discharges of both Chenar-rahdar River in the Shiraz box (Figure 8a) and Kardeh River (Figure 8c) in the Mashhad box are dominantly supplied by precipitation originating from the mentioned marine moisture sources. During the dry period, moisture sources (E − P) > 0 do not show the same trend as the discharges of Chenar-rahdar and Kardeh rivers (Figure 8b,d) respectively and cannot lead to precipitation due to the intense atmospheric stability caused by Azores subtropical high-pressure system which prevents precipitation. Chenar-rahdar and Kardeh rivers are mainly supplied by groundwater base flow and to a lower extent by infrequent precipitation events during the dry period.
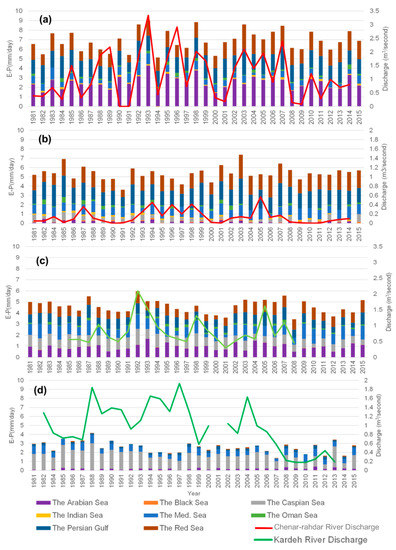
Figure 8.
Variations of marine moisture sources (E − P) > 0 over the Shiraz box in the wet (a) and dry (b) periods and over the Mashhad box in the wet (c) and dry (d) periods.
The simultaneous effect of each marine moisture source (E − P) > 0 on Chenar-rahdar and Kardeh rivers in the Shiraz and Mashhad boxes, respectively, has been investigated by the multi-regression model (Supplementary Table S2). Among the various moisture origins during the wet period, only the Arabian Sea moisture source directly influenced the discharges of Chenar-rahdar and Kardeh rivers. However, during the dry period, the Red Sea has an inverse correlation with the discharges of Chenar-rahdar and Kardeh rivers. During the dry period, when the Middle East and North Africa experience higher than average weather temperature, the (E − P) >0 values of the Red Sea notably intensify due to its huge evaporation and higher SST. These conditions reinforce the Azores subtropical high-pressure system and the atmospheric stability over Iran which results in the decrease of precipitation and also leads to the decline of river discharges.
5. Conclusions
This study revealed that the Arabian Sea and the Arabian and Mediterranean seas were predominant marine moisture sources in the south-central (Shiraz box) and northeastern (Mashhad box) parts of Iran during the wet period, while moisture uptake from the Persian Gulf and the Caspian Sea were dominant in Shiraz and Mashhad boxes, respectively during the dry period. The Arabian Sea moisture source dominantly influenced drought and wet conditions and also river discharges in Shiraz and Mashhad boxes during the wet period. However, during the dry period, due to the intense atmospheric stability caused by Azores subtropical high-pressure system which prevented precipitation, no correlation was observed. The large-scale climatic teleconnections BEST and SOI also influenced drought and wet conditions in Shiraz and Mashhad boxes. Extreme wet conditions mainly occurred during the El Niño phase, while extreme drought conditions mainly occurred during the La Niña phase. Scrutinizing the role of the marine moisture sources on Chenar-rahdar and Kardeh rivers discharge demonstrated that the Arabian Sea moisture source had a direct influence on these rivers during the wet period, while no correlation was observed during the dry period. These rivers were mainly supplied by precipitation during the wet period, while groundwater base flow and, to a lower extent, infrequent precipitation supplied their discharges during the dry period.
Supplementary Materials
The following are available online at http://www.mdpi.com/2073-4441/10/11/1550/s1, Table S1: The regression analysis between marine moisture uptake sources (E − P) > 0 and 1-month, 6-month, and 12-month SPI and SSI hydrological drought index in the Shiraz and Mashhad boxes; Table S2: The multi-regression analysis between marine moisture uptake sources (E − P) > 0 and the discharges of Kardeh River in the Mashhad box and Chenar-rahdar River in the Shiraz box; Figure S1: (E − P) > 0 and precipitation correlation in Shiraz (a) and Mashhad (b) boxes during the wet and dry periods; Figure S2: 1-month, 6-month, and 12-month SPI variations (negative SPI values and drought conditions in red and positive SPI values and wet conditions in blue columns) and precipitation variations (light blue columns) in both the Shiraz (a) and Mashhad (b) boxes.
Author Contributions
Conceptualization, M.H., R.S., and L.G.; Investigation, M.H. and R.S.; Methodology, M.H., R.S., and L.G.; Project administration, M.H., E.R., L.G., and R.N.; Software, R.S., L.G., and R.N.; Supervision, E.R., L.G., and R.N.; Writing—original draft, M.H. and E.R.
Funding
This research received no external funding.
Acknowledgments
Special thanks to our friends in Shiraz University in Iran and also Vigo University (Ourense Campus) in Spain who assisted during this study. Authors would like to thank reviewers for their insightful comments which improved the quality of this manuscript.
Conflicts of Interest
There authors declare no conflict of interest.
References
- Sori, R.; Nieto, R.; Vicente-Serrano, S.M.; Drumond, A.; Gimeno, L. A Lagrangian perspective of the hydrological cycle in the Congo River basin. Earth Syst. Dyn. 2017, 8, 653–675. [Google Scholar] [CrossRef]
- Sabziparvar, A.A.; Mirmasoudi, S.H.; Tabari, H.; Nazemosadat, M.J.; Maryanaji, Z. ENSO teleconnection impacts on reference evapotranspiration variability in some warm climates of Iran. Int. J. Climatol. 2011, 31, 1710–1723. [Google Scholar] [CrossRef]
- Tabari, H.; Talaee, P.H. Temporal variability of precipitation over Iran: 1966–2005. J. Hydrol. 2011, 396, 313–320. [Google Scholar] [CrossRef]
- Tabari, H.; Aragi, H.; Hosseinzadeh Talaee, P. Impact of the North Atlantic Oscillation on streamflow in Western Iran. Hydrol. Process. 2014, 28, 4411–4418. [Google Scholar] [CrossRef]
- Araghi, A.; Mousavi-Baygi, M.; Adamowski, J.; Martinez, C. Association between three prominent climatic teleconnections and precipitation in Iran using wavelet coherence. Int. J. Climatol. 2016, 37, 2809–2830. [Google Scholar] [CrossRef]
- Nazemosadat, M.J. ENSO’ s Impact on the Occurrence of Autumnal Drought in Iran. Drought Netw. News 1999, 11, 15–18. [Google Scholar]
- Ghasemi, A.R.; Khalili, D. The influence of the Arctic Oscillation on winter temperatures in Iran. Theor. Appl. Climatol. 2006, 85, 149–164. [Google Scholar] [CrossRef]
- Azimi, M.; Golpayegani, F.; Tajrishi, M.; Abrishamchi, A. Seasonal Prediction of Karoon Streamflow Using Large-Scale Climate Indices. In World Environmental and Water Resources Congress; American Socitiey of Civil Engineers: Palm Spring, CA, USA, 2011; pp. 1184–1193. [Google Scholar]
- Regonda, S.K.; Rajagopalan, B.; Clark, M.; Pitlick, J. Seasonal Cycle Shifts in Hydroclimatology over the Western United States. J. Clim. 2005, 18, 372–384. [Google Scholar] [CrossRef]
- Camargo, S.J.; Emanuel, K.A.; Sobel, A.H. Use of a Genesis Potential Index to Diagnose ENSO Effects on Tropical Cyclone Genesis. J. Clim. 2007, 20, 4819–4834. [Google Scholar] [CrossRef]
- Tindall, J.C.; Valdes, P.J.; Sime, L.C. Stable water isotopes in HadCM3: Isotopic signature of El Niño–Southern Oscillation and the tropical amount effect. J. Geophys. Res. Atmos. 2009, 114, 111. [Google Scholar] [CrossRef]
- Yang, H.; Johnson, K.R.; Griffiths, M.; Yoshimura, K. Interannual controls on oxygen isotope variability in Asian monsoon precipitation and implications for paleoclimate reconstructions: Oxygen Isotopes of Asian Monsoon Precip. J. Geophys. Res. Atmos. 2016. [Google Scholar] [CrossRef]
- Cai, Z.; Tian, L.J.; Bowen, G. ENSO variability reflected in precipitation oxygen isotopes across the Asian Summer Monsoon region. Earth Planet. Sci. Lett. 2017, 475, 25–33. [Google Scholar] [CrossRef]
- Gao, J.; He, Y.; Masson-Delmotte, V.; Yao, T. ENSO Effects on Annual Variations of Summer Precipitation Stable Isotopes in Lhasa, Southern Tibetan Plateau. J. Clim. 2018, 31, 1173–1182. [Google Scholar] [CrossRef]
- Mares, I.; Mares, C.; Mihailescu, M. NAO impact on the summer moisture variability across Europe. Phys. Chem. Earth Parts A/B/C 2002, 27, 1013–1017. [Google Scholar] [CrossRef]
- Chan Steven, C.; Behers, S.K.; Toshio, Y. Indian Ocean Dipole influence on South American rainfall. Geophys. Res. Lett. 2008, 35, L14S12. [Google Scholar] [CrossRef]
- Zablone, O.; Ogalo, L. Linkages between the Indian Ocean Dipole and East African Rainfall Anomalies. J. Kenya Meteorol. Soc. 2008, 2, 3–17. [Google Scholar]
- Power, S.B.; Kociuba, G. The impact of global warming on the Southern Oscillation Index. Clim. Dyn. 2011, 37, 1745–1754. [Google Scholar] [CrossRef]
- Gimeno, L.; Stohl, A.; Trigo, R.M.; Dominguez, F.; Yoshimura, K.; Yu, L.; Drumond, A.; Durán-Quesada, A.M.; Nieto, R. Oceanic and terrestrial sources of continental precipitation. Rev. Geophys. 2012, 50. [Google Scholar] [CrossRef]
- Criag, H. Isotopic Variations in Meteoric Waters. Science 1961, 133, 1702–1703. [Google Scholar] [CrossRef] [PubMed]
- Stohl, A.; James, P. A Lagrangian Analysis of the Atmospheric Branch of the Global Water Cycle. Part II: Moisture Transports between Earth’s Ocean Basins and River Catchments. J. Hydrometeorol. 2005, 6, 961–984. [Google Scholar] [CrossRef]
- Stohl, A.; James, P. Lagrangian Analysis of the Atmospheric Branch of the Global Water Cycle. Part I: Method Description, Validation, and Demonstration for the August 2002 Flooding in Central Europe. J. Hydrometeorol. 2004, 5, 656–678. [Google Scholar] [CrossRef]
- Nieto, R.; Gimeno, L.; Trigo, R.M. A Lagrangian identification of major sources of Sahel moisture. Geophys. Res. Lett. 2006, 33, L18707. [Google Scholar] [CrossRef]
- Nieto, R.; Gallego, D.; Trigo, R.; Ribera, P.; Gimeno, L. Dynamic identification of moisture sources in the Orinoco basin in equatorial South America. Hydrol. Sci. J. 2008, 53, 602–617. [Google Scholar] [CrossRef]
- Durán-Quesada, A.M.; Gimeno, L.; Amador, J.A.; Nieto, R. Moisture sources for Central America: Identification of moisture sources using a Lagrangian analysis technique. J. Geophys. Res. Atmos. 2010, 115, 103. [Google Scholar] [CrossRef]
- Gómez-Hernández, M.; Drumond, A.; Gimeno, L.; Garcia-Herrera, R. Variability of moisture sources in the Mediterranean region during the period 1980–2000. Water Resour. Res. 2013, 49, 6781–6794. [Google Scholar] [CrossRef]
- Ciric, D.; Nieto, R.M.; Ramos, A.; Drumond, A.; Gimeno, L. Contribution of Moisture from Mediterranean Sea to Extreme Precipitation Events over Danube River Basin. Water 2018, 10, 1182. [Google Scholar] [CrossRef]
- Sorí, R.; Nieto, R.; Drumond, A.; Gimeno, L. The Niger River Basin Moisture Sources: A Lagrangian Analysis. Atmosphere 2017, 8, 38. [Google Scholar] [CrossRef]
- Sodemann, H.; Schwierz, C.; Wernli, H. Interannual variability of Greenland winter precipitation sources: Lagrangian moisture diagnostic and North Atlantic Oscillation infuence. J. Geophys. Res. 2008, 113, D03107. [Google Scholar] [CrossRef]
- Salih, A.A.M.; Zhang, Q.; Tjernstrom, M. Lagrangian tracing of Sahelian Sudan moisture sources. J. Geophys. Res. Atmos. 2015, 120, 6793–6808. [Google Scholar] [CrossRef]
- Vicente-Serrano, S.; López-Moreno, J.I.; Beguería, S.; Lorenzo-Lacruz, J.; Azorin-Molina, C.; Morán-Tejeda, E. Accurate Computation of a Streamflow Drought Index. J. Hydrol. Eng. 2012, 17, 318–332. [Google Scholar] [CrossRef]
- Yang, H.; Reichert, P.; Abbaspour, K.C.; Zehnder, A.J.B. A Water Resources Threshold and Its Implications for Food Security. Environ. Sci. Technol. 2003, 37, 3048–3054. [Google Scholar] [CrossRef] [PubMed]
- Abbaspour, K.C.; Faramarzi, M.; Ghasemi, S.S.; Yang, H. Assessing the impact of climate change on water resources in Iran. Water Resour. Res. 2009, 45, 434. [Google Scholar] [CrossRef]
- Alijani, B. Iran Climatology; Payam Nour Publication: Tehran, Iran, 2000; ISBN 978-964-455-621-0. [Google Scholar]
- Rahimzadeh, F.; Asgari, A.; Fattahi, E. Variability of extreme temperature and precipitation in Iran during recent decades. Int. J. Climatol. 2009, 29, 329–343. [Google Scholar] [CrossRef]
- Modarres, R.; Sarhadi, A. Rainfall trends analysis of Iran in the last half of the twentieth century. J. Geophys. Res. Atmos. 2009, 114, 101. [Google Scholar] [CrossRef]
- Balling, R.; Keikhosravi, M.; Roy, S.; Khoshhal, J. Trends in Extreme Precipitation Indices in Iran: 1951–2007. Adv. Meteorol. 2016, 1–8. [Google Scholar] [CrossRef]
- Ghalhari, G.A.F.; Roudbari, A.A.D.; Asadi, M. Erratum to: Identifying the spatial and temporal distribution characteristics of precipitation in Iran. Arab. J. Geosci. 2016, 9, 629. [Google Scholar] [CrossRef]
- Javari, M. Trend and Homogeneity Analysis of Precipitation in Iran. Climate 2016, 4, 44. [Google Scholar] [CrossRef]
- Karimi, M.; Farajzadeh, M. Spatial and Temporal distribution of Iran’s precipitation moisture. J. Geogr. Sci. Stud. 2011, 19, 109–127. [Google Scholar]
- Dinpashoh, Y.; Jhajharia, D.; Fakheri-Fard, A.; Singh, V.P.; Kahya, E. Trends in reference crop evapotranspiration over Iran. J. Hydrol. 2011, 399, 422–433. [Google Scholar] [CrossRef]
- Sabziparvar, A.A.; Movahedi, S.; Asakereh, H.; Maryanaji, Z.; Masoodian, S.A. Geographical factors affecting variability of precipitation regime in Iran. Theor. Appl. Climatol. 2015, 120, 367–376. [Google Scholar] [CrossRef]
- Najmeddin, A.; Moore, F.; Keshavarzi, B.; Sadegh, Z. Pollution, source apportionment and health risk of potentially toxic elements (PTEs) and polycyclic aromatic hydrocarbons (PAHs) in urban street dust of Mashhad, the second largest city of Iran. J. Geochem. Explor. 2018, 190, 154–169. [Google Scholar] [CrossRef]
- Eltahir, E.A.B.; Bras, R.L. Precipitation recycling. Rev. Geophys. 1996, 34, 367–378. [Google Scholar] [CrossRef]
- Numaguti, A. Origin and recycling processes of precipitating water over the Eurasian continent: Experiments using an atmospheric general circulation model. J. Geophys. Res. Atmos. 1999, 104, 1957–1972. [Google Scholar] [CrossRef]
- Drumond, A.; Marengo, J.; Ambrizzi, T.; Nieto, R.; Moreira, L.; Gimeno, L. The role of the Amazon Basin moisture in the atmospheric branch of the hydrological cycle: A Lagrangian analysis. Hydrol. Earth Syst. Sci. 2014, 18, 2577–2598. [Google Scholar] [CrossRef]
- Drumond, A.; Taboada, E.; Nieto, R.; Gimeno, L.; Vicente-Serrano, S.M.; Ignacio López-Moreno, J. Lagrangian analysis of the present-day sources of moisture for major ice-core sites. Earth Syst. Dynam 2016, 7, 549–558. [Google Scholar] [CrossRef]
- Stohl, A.; Forster, C.; Frank, A.; Seibert, P.; Wotawa, G. Technical note: The Lagrangian particle dispersion model FLEXPART version 6.2. Atmos. Chem. Phys. 2005, 5, 2461–2474. [Google Scholar] [CrossRef]
- Forster, C.; Stohl, A.; Seibert, P. Parameterization of Convective Transport in a Lagrangian Particle Dispersion Model and Its Evaluation. J. Appl. Meteorol. Climatol. 2007, 46, 403–422. [Google Scholar] [CrossRef]
- Dee, D.P.; Uppala, S.M.; Simmons, A.J.; Berrisford, P.; Poli, P.; Kobayashi, S.; Andrae, U.; Balmaseda, M.A.; Balsamo, G.; Bauer, P.; et al. The ERA-Interim reanalysis: Configuration and performance of the data assimilation system. Q. J. R. Meteorol. Soc. 2011, 137, 553–597. [Google Scholar] [CrossRef]
- Lorenz, C.; Kunstmann, H. The Hydrological Cycle in Three State-of-the-Art Reanalyses: Intercomparison and Performance Analysis. J. Hydrometeorol. 2012, 13, 1397–1420. [Google Scholar] [CrossRef]
- Mckee, T.B.; Doesken, N.J.; Kleist, J. The relationship of drought frequency and duration to time scales. In The IX Conference on Applied Climatology; American Meteorological Society: Boston, MA, USA, 1993; pp. 179–184. [Google Scholar]
- Morid, S.; Moghadasi, M.; Arshad, S.; Omid, M. Drought Indicies Package; Version 2; Tarbiat Modarres University: Tehran, Iran, 2008. [Google Scholar]
- Harris, I.; Jones, P.D.; Osborn, T.J.; Lister, D.H. Updated high-resolution grids of monthly climatic observations—The CRU TS3.10 Dataset. Int. J. Climatol. 2014, 34, 623–642. [Google Scholar] [CrossRef]
- NOAA. Available online: https://www.esrl.noaa.gov (accessed on 21 October 2018).
- Smith, C.; Sardeshmukh, P. The effect of ENSO on the intraseasonal variance of surface temperatures in winter. Int. J. Climatol. 2000, 20, 1543–1557. [Google Scholar] [CrossRef]
- Jones, P.D.; Jónsson, T.; Wheeler, D. Extension to the North Atlantic Oscillation using early instrumental pressure observations from Gibraltar and South-West Iceland. Int. J. Clim. 1997, 17, 1433–1450. [Google Scholar] [CrossRef]
- NOAA. Available online: http://www.cpc.ncep.noaa.gov (accessed on 15 October 2018).
- NOAA. Available online: https://www.ncdc.noaa.gov (accessed on 15 October 2018).
- Heydarizad, M.; Raeisi, E.; Sori, R.; Gimeno, L. The Identification of Iran’s Moisture Sources Using a Lagrangian Particle Dispersion Model. Atmosphere 2018, 9, 408. [Google Scholar] [CrossRef]
- Barati, G.R.; Heydari, I. Classification of Iran western Precipitation. In The First Iran National Climate Change Conference; Iran Meteorological Organization: Tehran, Iran, 2003; pp. 16–23. [Google Scholar]
- Holton, J.R. An Introduction to Dynamic Meteorology, 4th ed.; Dmowska, R., Holton, J.R., Thomasrossbay, H., Eds.; ElsevierAcademic Press: San Diego, CA, USA, 2004; ISBN 0-12-354015-1. [Google Scholar]
© 2018 by the authors. Licensee MDPI, Basel, Switzerland. This article is an open access article distributed under the terms and conditions of the Creative Commons Attribution (CC BY) license (http://creativecommons.org/licenses/by/4.0/).

