2.1. Study Area
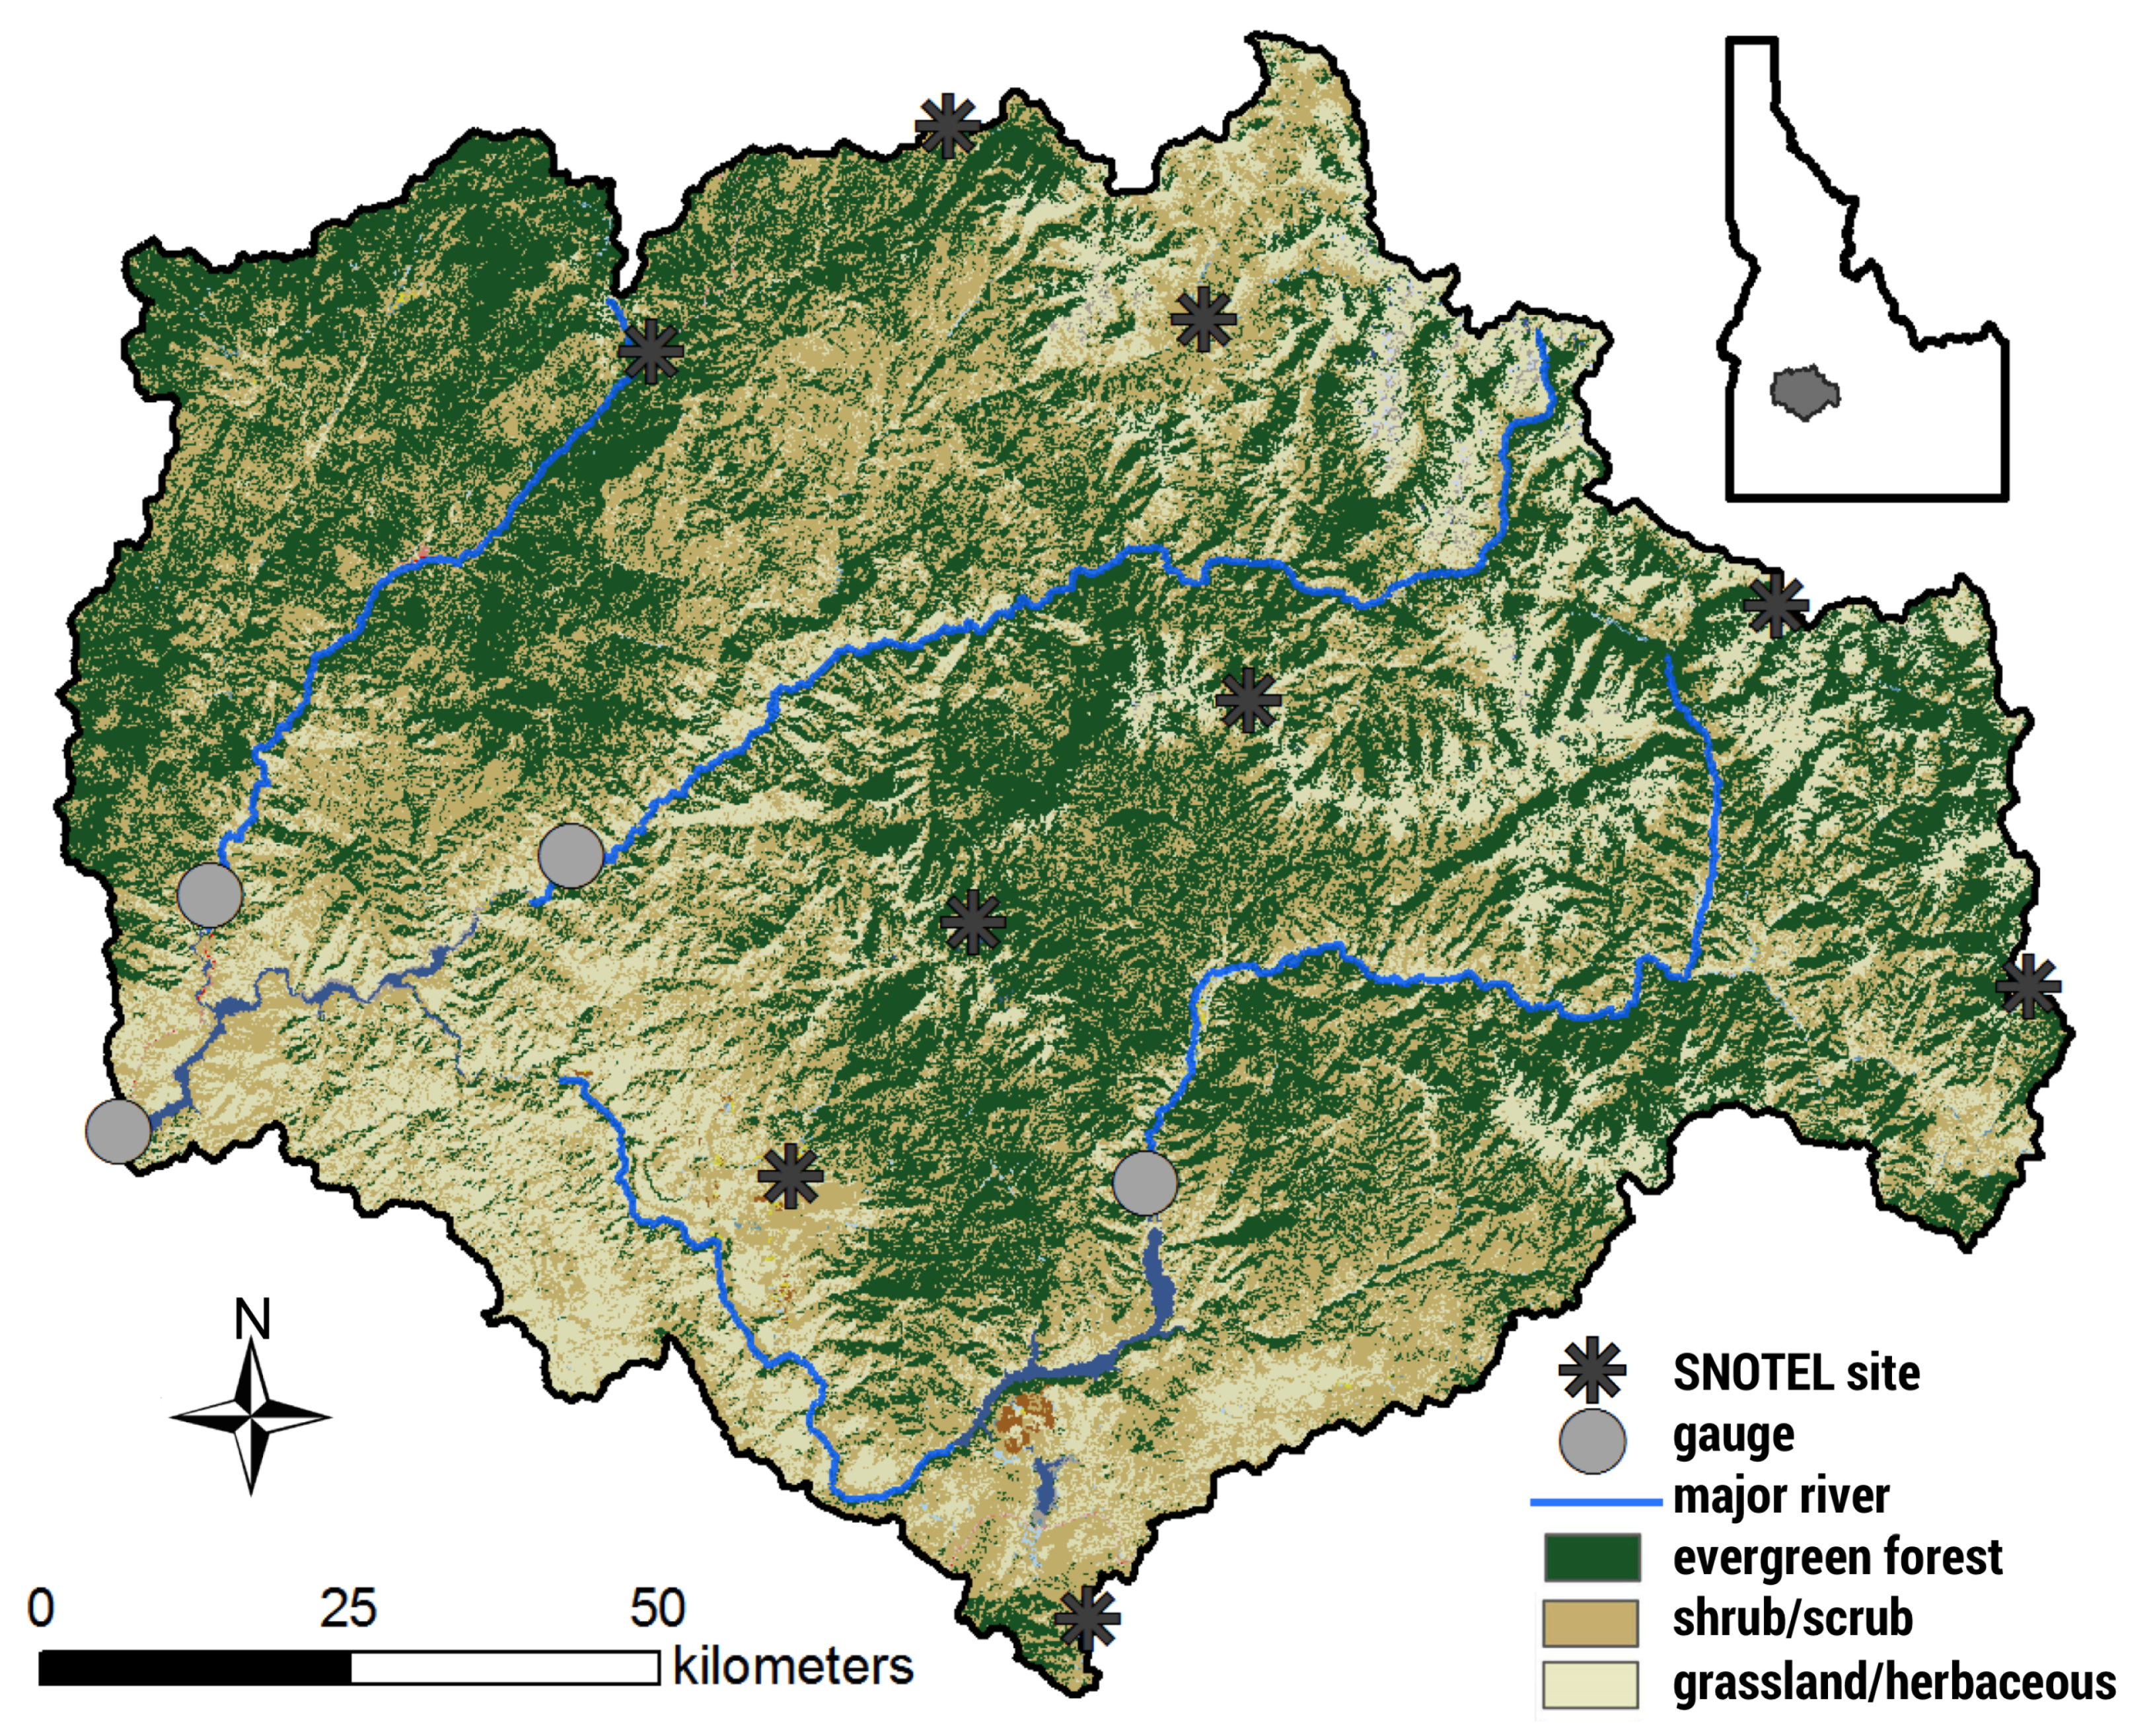
The Upper Boise River Basin (UBRB) is located in southwest Idaho (
Figure 1) and supplies water for downstream users in the populated Boise metropolitan region. This watershed encompasses an area of 6935 km
with elevation ranging from approximately 930 to 3000 m. It is bounded by the Sawtooth range in the east, the Payette River Basin to the north, and the Snake River Plain to the southwest. We delineated the study area by combining three Hydrologic Unit Code (HUC) 8 watersheds: the North and Middle Forks Boise (U.S. Geological Survey streamflow station 17050111), the South Fork Boise (U.S. Geological Survey streamflow station 17050113), and Boise-Mores (U.S. Geological Survey streamflow station 17050112). Due to the large variation in topography throughout the study area, regions shift from semi-arid grasslands and shrublands in the lowlands to coniferous forests in the highlands. In the UBRB, the dominant land covers are forest (43.0%), shrubland (34.6%) and grassland (20.9%), with sparse human development within the watershed. The climate in this region is a continental Mediterranean climate (Köppen
Dsb) with cold winters, warm summers, and the majority of precipitation falling in winter as snow. The overall average precipitation is ∼800 mm, with averages ranging from ∼400 mm at low elevations to over 1300 mm at high elevations [
20].
The UBRB is the primary source of water for the downstream Treasure Valley region, which contains the state’s three largest cities (Boise, Nampa, and Meridian) and roughly 40% of the state’s total population. The Treasure Valley is an agriculturally intensive region and contains approximately 1300 km of farmlands, many of which rely on irrigation water from the UBRB. Like many other snowmelt-dominated watersheds in the West, the UBRB is heavily managed via three large storage reservoirs to fulfill the needs of flood control and downstream uses, especially for direct consumption in the Treasure Valley. Similar to other western states, water rights in this region follow the Prior Appropriation Doctrine, also known as “first in time–first in right.” This doctrine states that the earliest beneficial users (i.e., senior water rights) retain their full water right, and those that came later (i.e., junior water rights) may retain their water rights as long as they do not infringe on those that came beforehand. As such, many junior water rights are curtailed during low water years, as total surface water rights in the Treasure Valley surpass 14,000 ft/s, far exceeding the natural flow of the Boise River.
Previous studies indicate that the UBRB has already begun to respond hydrologically to climate change, noting an increase in summer streamflow temperatures [
21], earlier timing of streamflow [
22], lengthened growing season [
23], and declining extreme low flow discharges [
24]. Additionally, there have been previous modeling studies that have used this basin to anticipate changes in hydrology under climate change [
14,
25]. However, both of the aforementioned studies used an older generation of global climate models as their climate input and calibrated their models to streamflow alone. This study extends those previous works by making use of climate projections from the 5th Coupled Model Intercomparison Project (CMIP5) [
26], calibrating the hydrological model to multiple hydrological metrics, and producing results that may provide additional meaning to water users.
2.2. Modeling Framework
Here we employ the Envision framework, a multiagent-based, spatially explicit modeling framework, to model how regional hydrology may change with climate. Envision was created to explicitly simulate the coupled dynamics of human and natural environmental systems [
27]. It does this by providing a core set of utilities to represent landscapes in spatially explicit ways and a software framework for component models of natural systems interact with human actions that occur at places and times specified by a user or a more complex model of human intervention. To this end, the modeling framework and software infrastructure of Envision support the integration of a variety of social and biophysical models in a spatiotemporally dynamic way. It is freely available and users can extend and enhance model capabilities by adding additional models as plugins. It has been extensively used recently in a wide variety of studies, from understanding urbanization impacts on streamflow [
28] to projecting climate change impacts of land cover and land use [
29], and even to understand when fire occurrence and size is ’surprising’ [
30]. Additionally, it has been used to integrate water rights to spatially allocate irrigation in the agriculturally intensive region below the UBRB [
31].
In this study, we use Envision version 6.197 and utilize the Flow extension to model future hydrology under various climate scenarios. In the following sections, we provide an overview of the modeling structure and the inputs needed for the various components.
2.2.1. Spatial Coverage in Envision
In Envision, owing to the heritage of the framework for simulating coupled human-natural systems, the most refined spatial elements where model algorithms are applied are referred to as Integrated Decision Units (IDUs). An IDU is meant to represent a contiguous portion of the landscape with relatively constant physiographic (e.g., vegetation cover, soil type, etc.) and socio-political (e.g., land ownership, zoning, land use, etc.) characteristics. The size and geometry of these polygons are dependent on the type of modeling being performed and the geospatial datasets required as input to those models. As such, there is no universally accepted method for creating IDU coverage. In this study, we used three datasets to form the IDU geometry: surface management agency, land cover, and HUC 12 stream catchments (
Table 1). As such, the IDU coverage will preserve boundaries between HUC 12 catchments, cognizant land management agencies, as well as boundaries between vegetation classes.
The datasets were processed in ArcMap 10.1. To shorten Envision’s computational time, we coarsened the land cover dataset from 30 to 100 m in increments of 10 m. This allowed a substantial reduction in computational time required to create the IDU domain without a significant loss is gradients of vegetation cover, particularly those associated with contrasting vegetation cover on South- and North-facing hillslopes. We used a nearest neighbor algorithm to resample land cover types to more accurately capture the original distribution of coverage in the land cover dataset. The other two datasets were polygon geospatial datasets that required very little processing besides renaming attributes to be consistent with the Envision framework requirements.
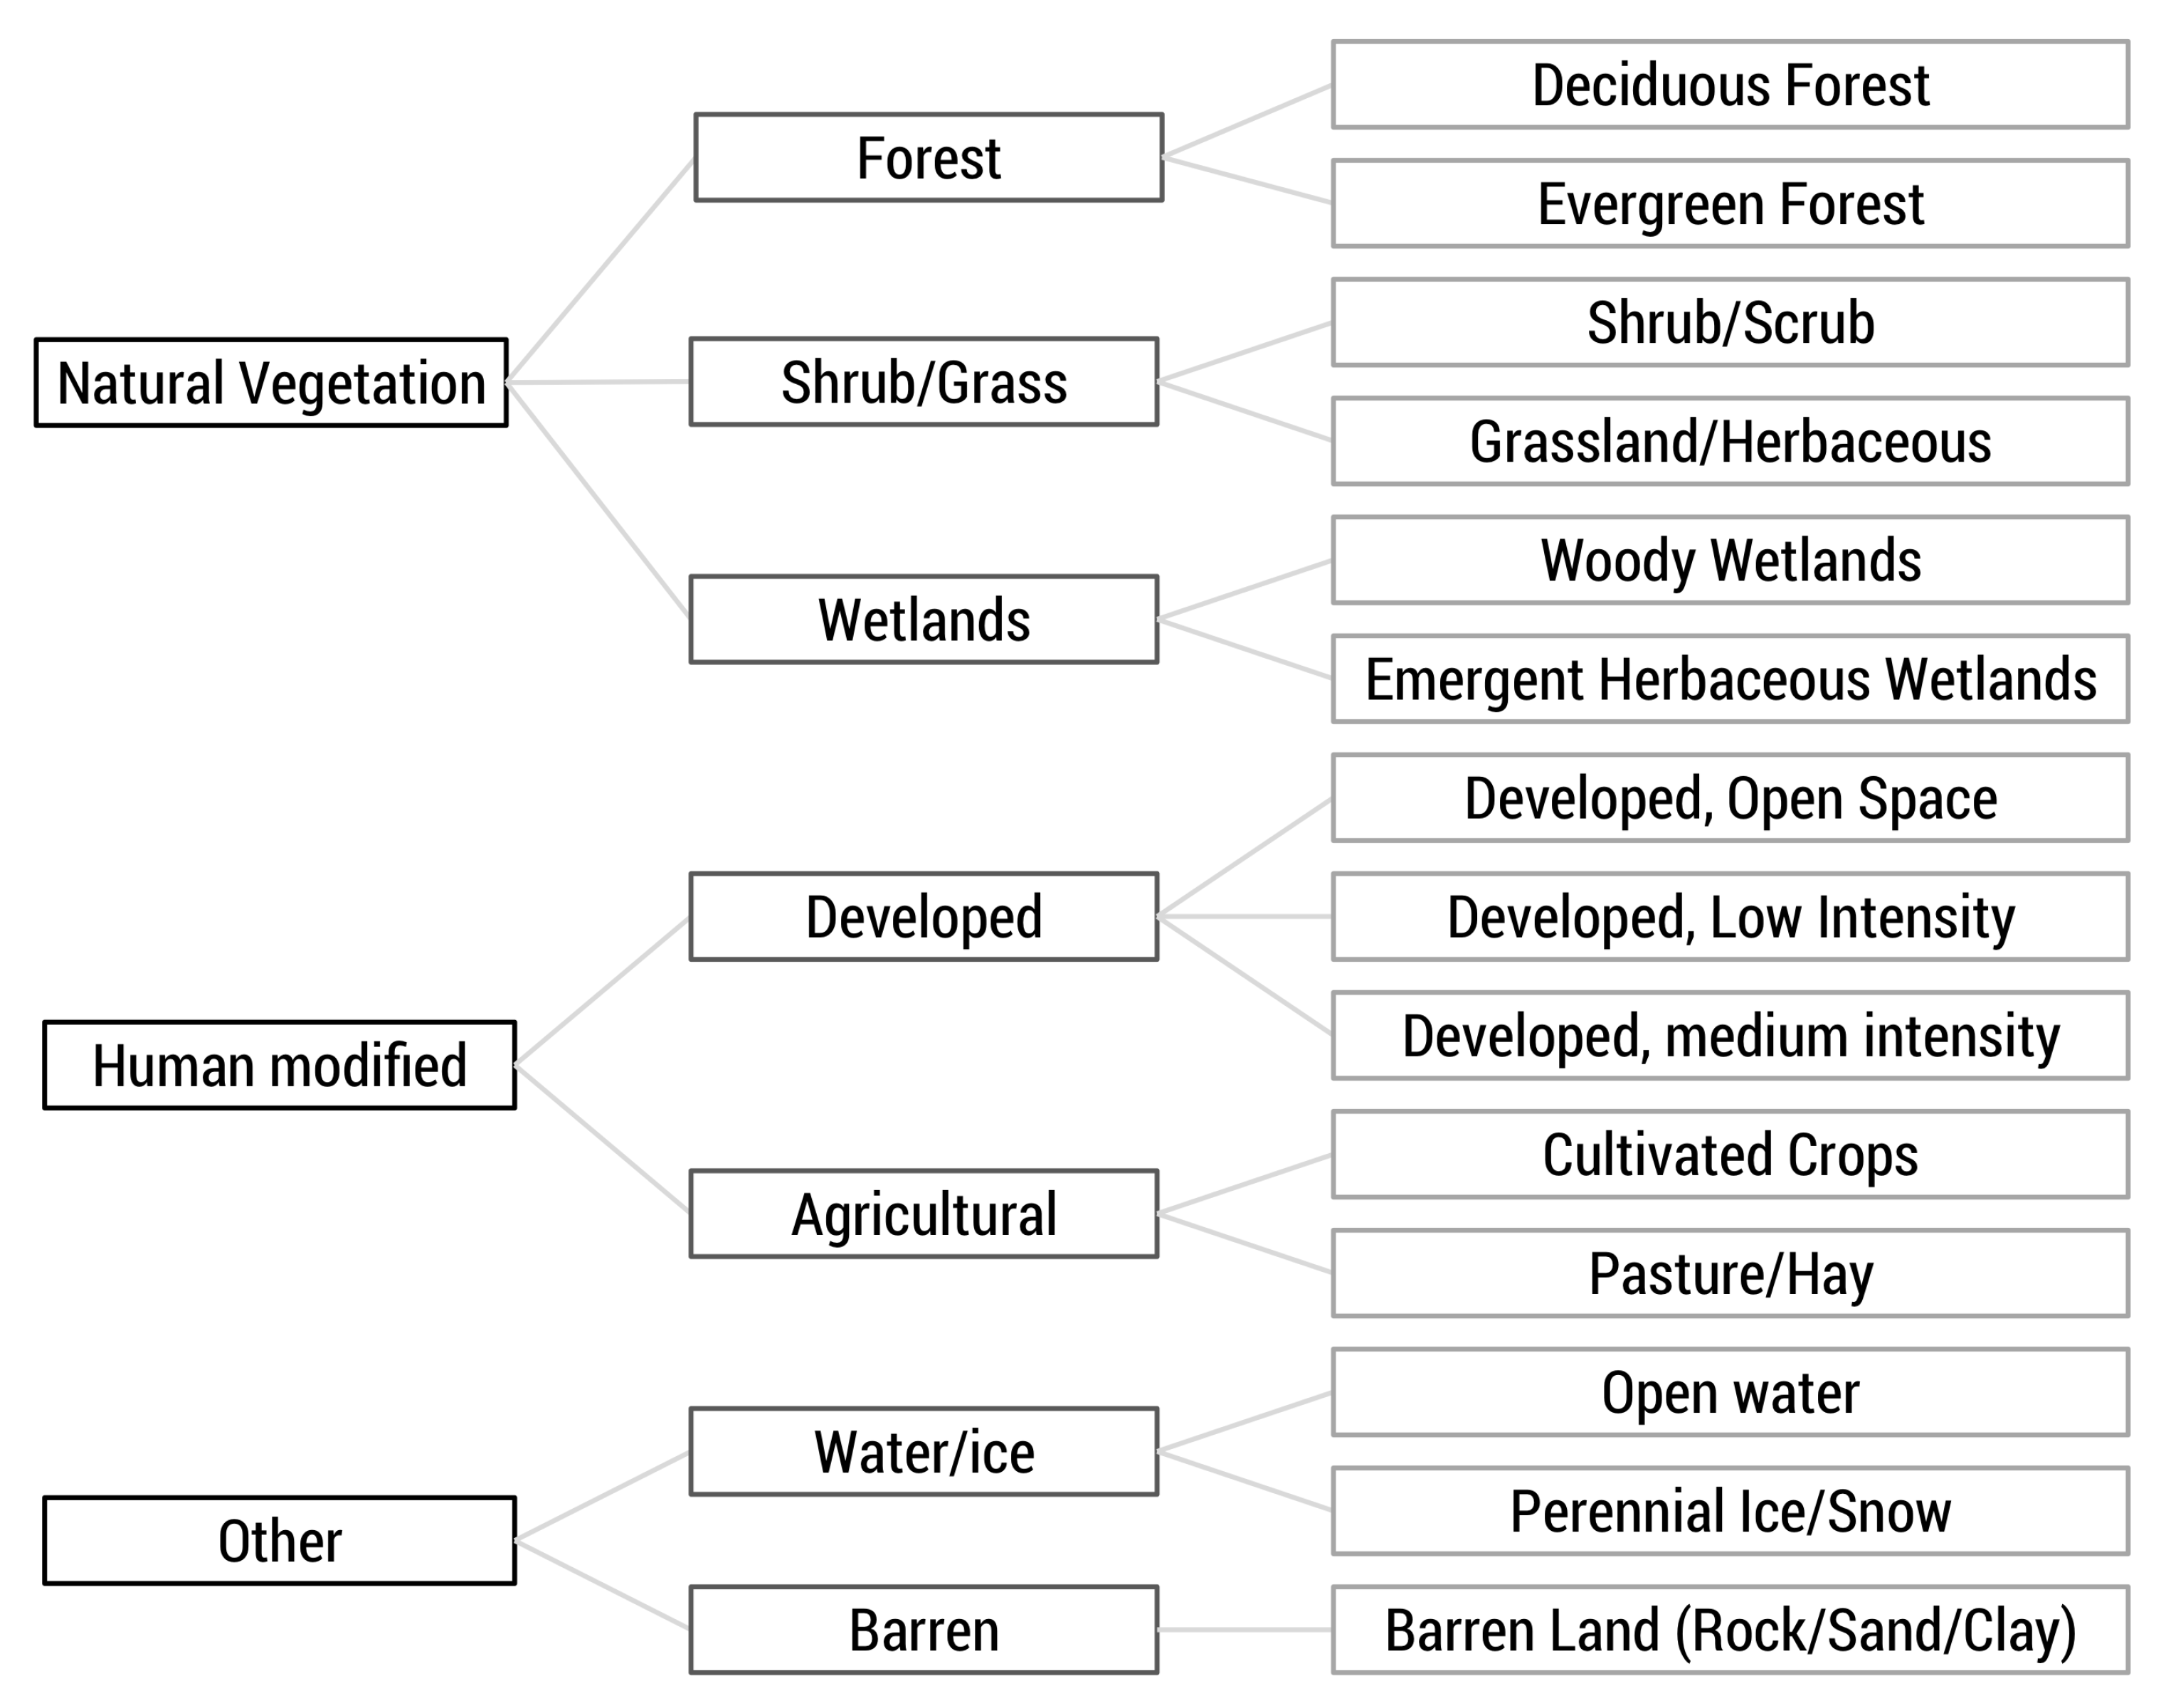
We created our IDU coverage by intersecting the three aforementioned datasets, creating 31,625 polygons. We extracted the average elevation for each IDU and also assigned an elevation class from 1–4, corresponding to 0–1500, 1500–2000, 2000–2500, and >2500 m, respectively, to allow examination of results by elevation band. Although the boundaries between these elevation bands are arbitrary, there are enough IDU polygons within each band to provide meaningful comparisons between elevation bands. Additionally, to aid in analysis and querying we created a three-tiered hierarchy of land cover classification ranging from general (e.g., Natural Vegetation) to more specific (e.g., Evergreen Forest), which was formed by grouping NLCD classifications that are similar (
Figure 2).
2.2.2. Hydrological System Model
An extension in Envision called Flow provides flexibility in modeling hydrology and the use of different model representations of hydrological processes. Flow operates on contiguous collections of IDUs that behave in a similar hydrological manner. Each collection of IDUs is referred to as a Hydrologic Response Units (HRUs) [
14,
32]. We created the HRU coverage by grouping contiguous polygons with identical land cover at the intermediate level (i.e., middle column) level in
Figure 2, identical elevation class, and were located in the same HUC-12 catchment. This aggregation process resulted in resulted in 9465 HRUs.
In this study, we used a modified version of the HBV (Hydrologiska Byråns Vattenbalansavdelning) rainfall-runoff model [
33] for surface hydrology. HBV is a commonly used conceptual model [
34,
35,
36,
37] but has been modified by Envision’s developers to be semi-distributed, operating at the HRU level. Each HRU is conceptualized as a linked reservoir with five layers of storage: snowpack, lakes, soil, upper groundwater, and lower groundwater (
Figure 3). Runoff from each HRU is routed to streams using the flowlines associated with the HUC 12 catchments from a modified version of the US National Hydrography Dataset developed by
http://www.horizon-systems.com/nhdplus/nhdplusv2_home.php (NHD Plus V2,
Table 1). The water balance in each HRU is described by the following equation:
where
P is precipitation (mm/day),
is evapotranspiration (mm/day),
Q is runoff (mm/day),
is snow storage (mm),
is soil moisture storage (mm),
is upper groundwater storage (mm),
is lower groundwater storage (mm), and
refers to lake storage (mm). A more thorough description of the HBV model can be found in other papers [
37,
38] and a more detailed description of Flow can be found on Envision’s website (
http://envision.bioe.orst.edu/).
Evapotranspiration (
) is calculated via a modified Penman-Monteith approach described in the Food and Agriculture Organization’s Irrigation and Drainage paper 56 (FAO56) where a crop coefficient is applied to the
of a reference plant [
39] and was later developed specifically for Idaho [
40] using the following equation:
where
= evapotranspiration,
= reference evapotranspiration (alfalfa, for Idaho), and
= crop coefficient.
We used this equation and applied crop coefficient curves that either matched our land cover type directly or estimated crop coefficient curves based upon similarities of crops to land cover types (
Table 2). Crop coefficients were obtained from AgriMet and [
40], with a few modified land cover coefficients from [
41].
2.3. Climate Inputs
We used statistically downscaled climate data using the MACA (Multivariate Adaptive Constructed Analogs) method version 1.0 for both historic and future simulations [
42]. This data has a spatial resolution of 4 km across the continental U.S. and is available daily for 1950–2100. Downscaled data is available for 20 Global Climate Models (GCMs) from CMIP5 for both Representative Concentration Pathway (RCP) 4.5 and 8.5 scenarios. RCPs are a consistent set of projections that are named according to their additional radiating forcing level at 2100, such that RCP 4.5 equates to +4.5 W/m
radiative forcing relative to pre-industrial values by the end of the century [
43].
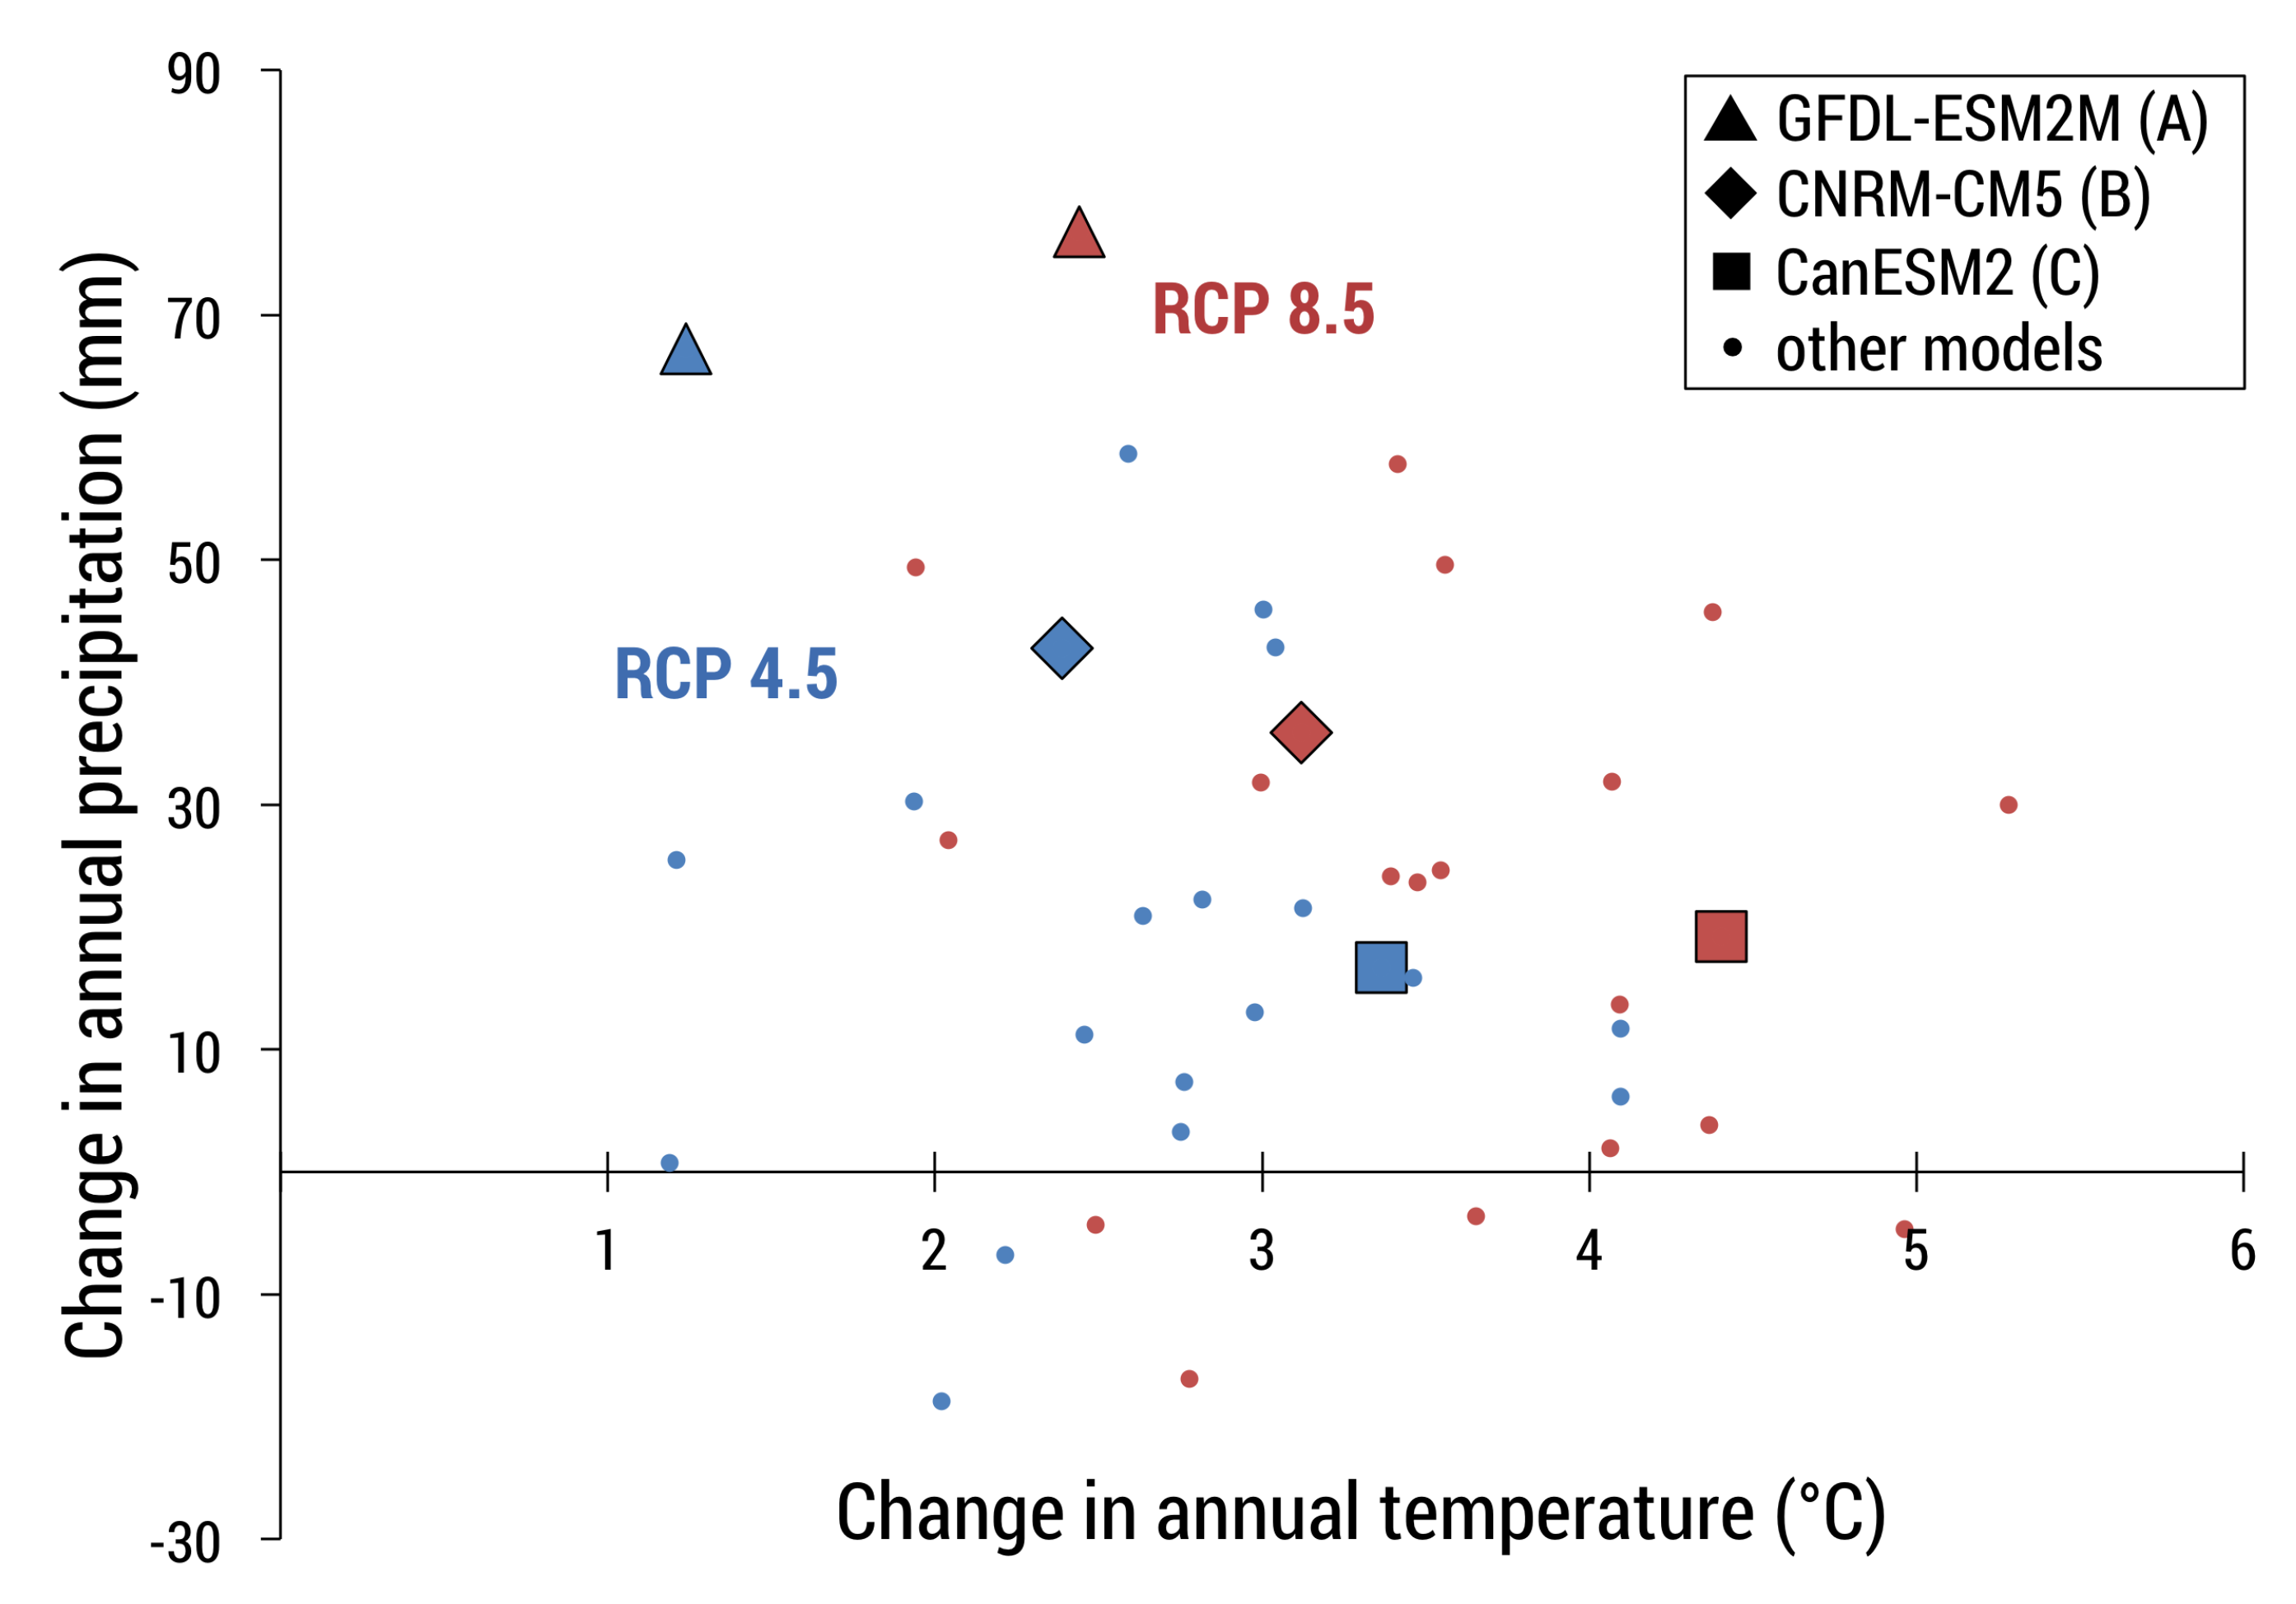
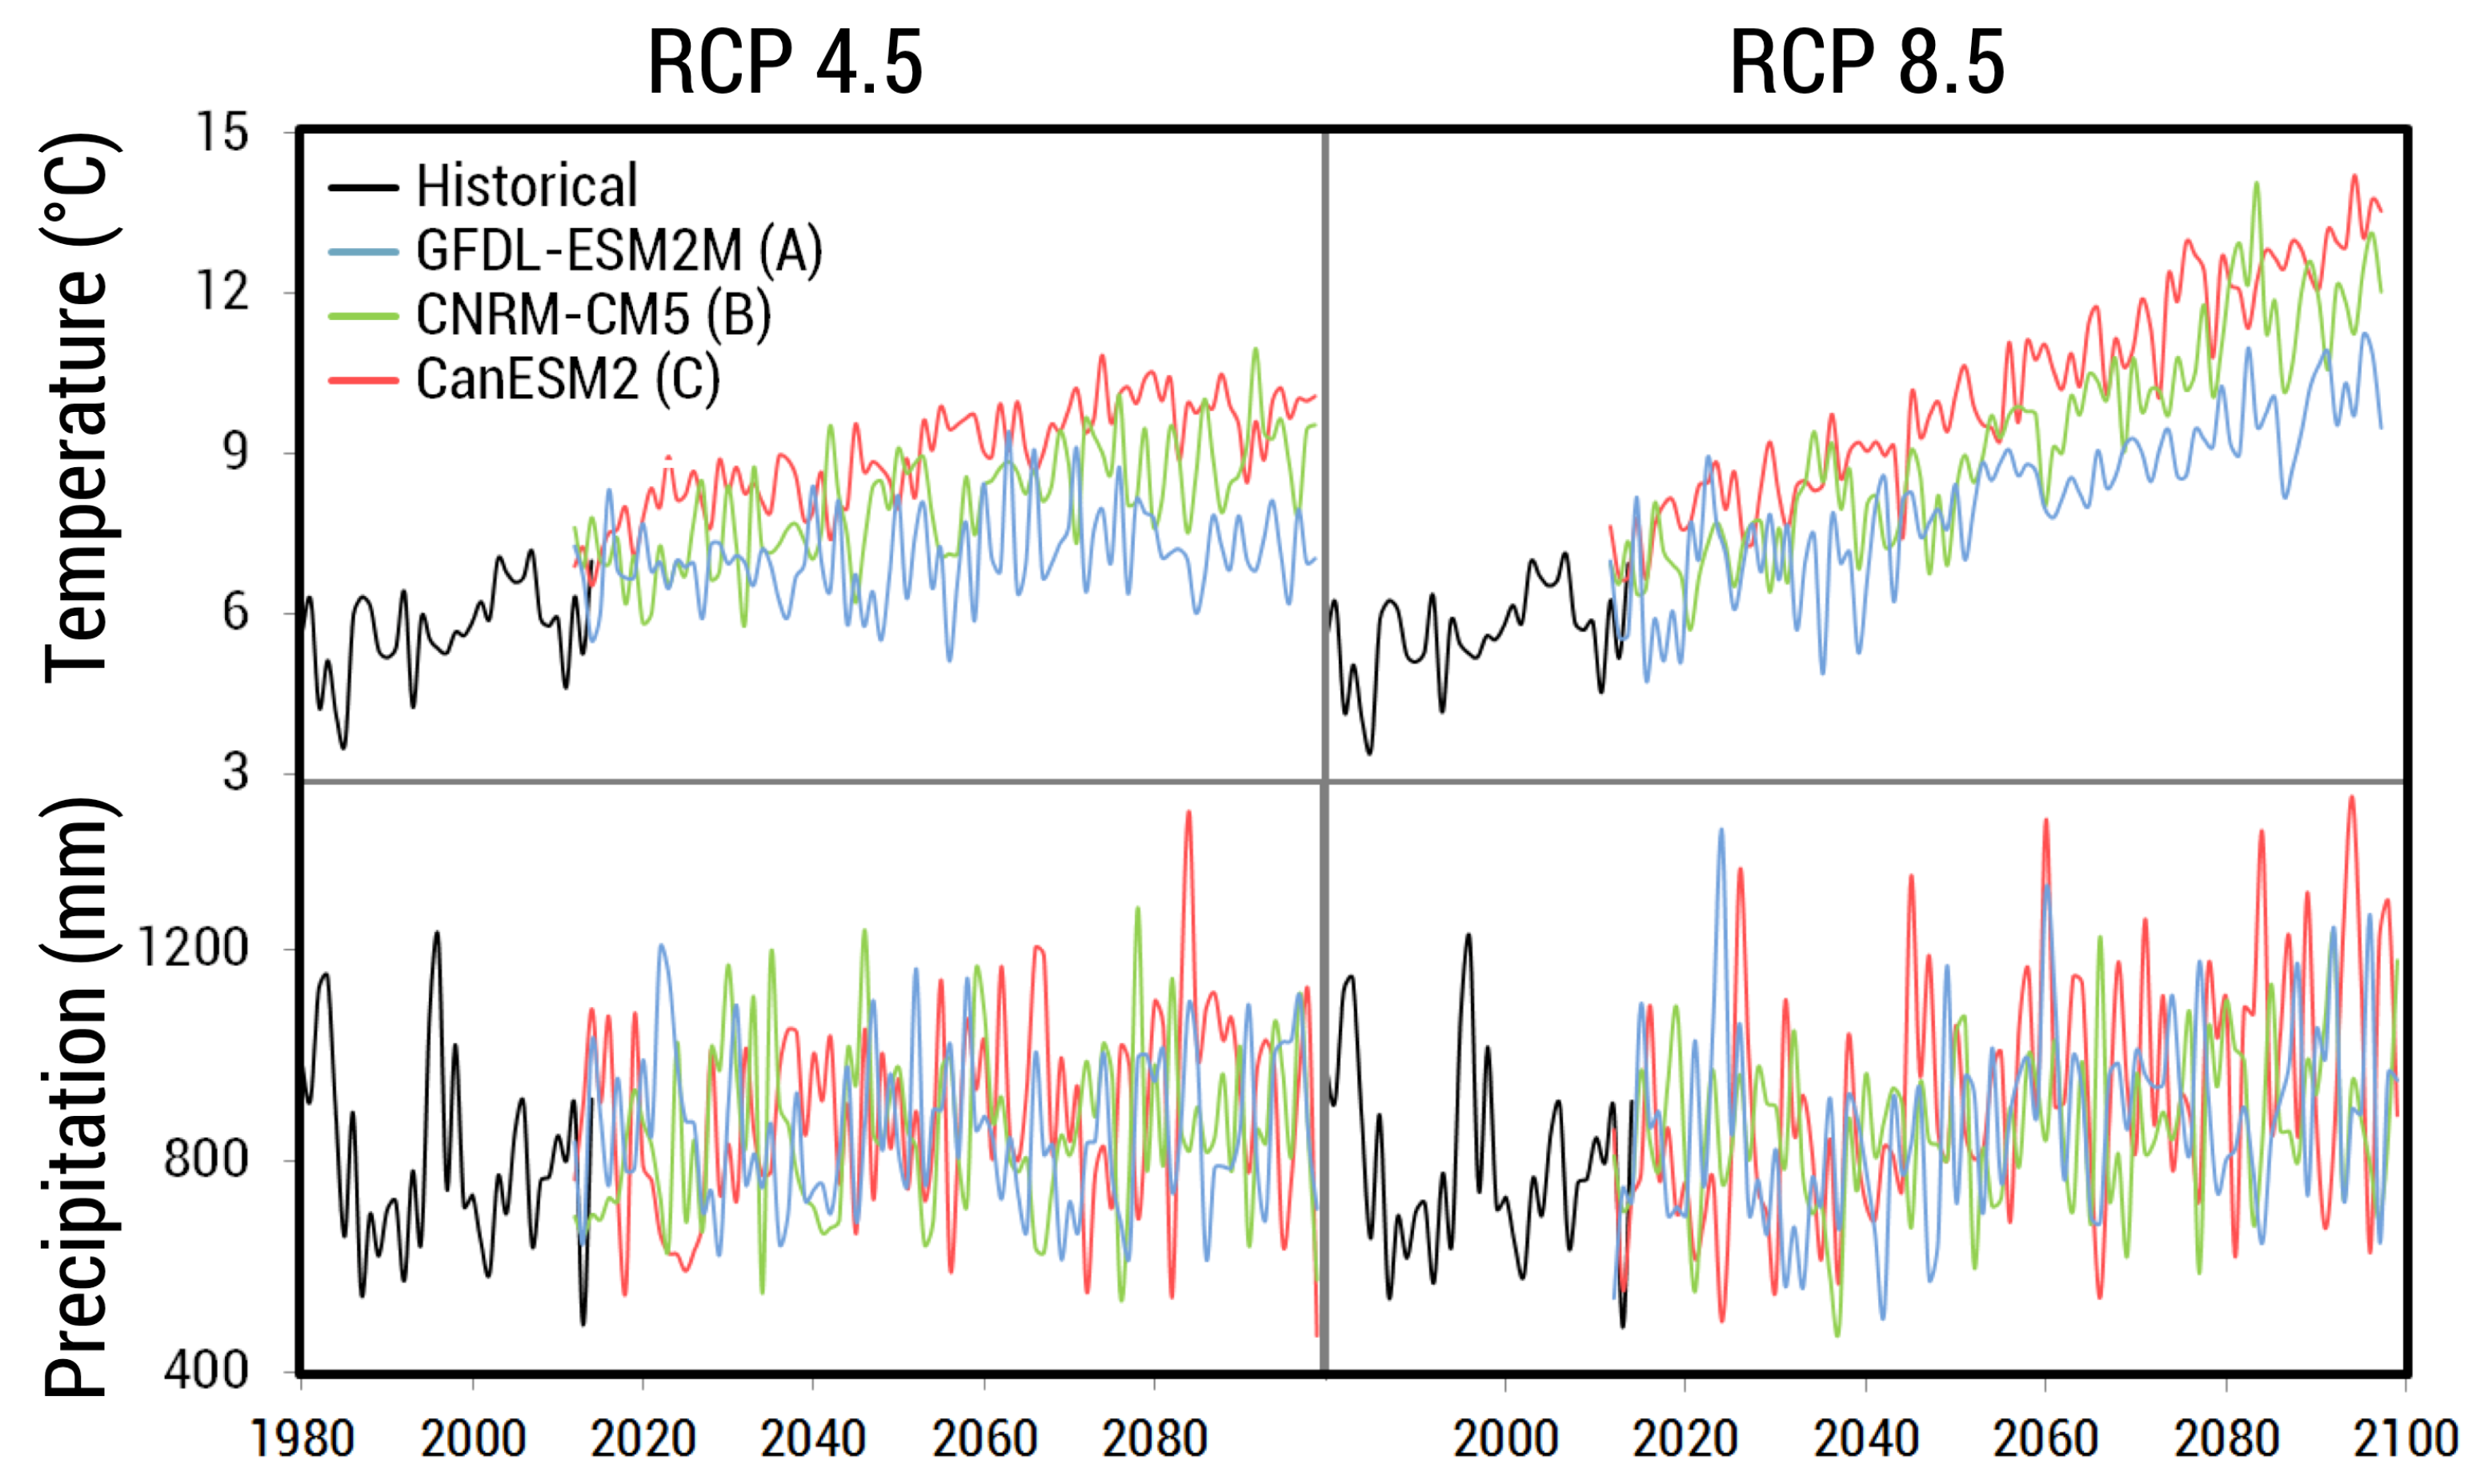
For future simulations, we selected GCMs based upon two criteria. First, we halved our GCM selection to models that performed relatively well when ran over the historical period in the Pacific Northwest region [
44], meaning they produced less relative error when compared across several metrics. Secondly, we selected GCMs that captured the range of variability between models as it related to changes in precipitation and temperature (
Figure 4). We selected three climate models: CanESM2 (hotter, wetter), CNRM-CM5 (warmer, slightly wetter), and GFDL-ESM2M (less warm, drier), and ran each one for RCP 4.5 and 8.5 scenarios, which resulted in six total simulations of future climate (
Figure 5).
Table 3 provides a naming convention for these six simulations to ease in discussing results and implications. For historical simulations from 1980–2014, we used a historical climate dataset, METDATA [
45], which was developed using data from the North American Land Data Assimilation System Phase 2 (NLDAS-2) [
46] and from the Parameter-elevation Regressions on Independent Slopes Model (PRISM) [
20].
The downscaled variables Envision requires for Flow are daily maximum, minimum, and average temperature, precipitation amount, specific humidity, daily downward shortwave radiation, and wind speed. To format the variables for Envision, the following procedure was followed: (1) subset data to the specified region, (2) convert units and rename variables where needed, (3) compute average temperature as the average between minimum and maximum temperature, (4) calculate overall wind speed from the eastward and northward components provided by MACA, and (5) subset into annual files. Scripts created for pre-processing MACA climate data are available online at
https://github.com/asteimke/MACA_EnvisionClimate.
2.4. Calibration and Validation
HBV is a semi-conceptual model, and as such, parameters required as input to the model are obtained through calibration because most parameters cannot be physically measured [
37]. Numerous combinations of parameter values can yield equally good results (i.e., the equifinality issue) [
47,
48], which makes it difficult to select the best parameter set. To combat this issue, some studies [
41,
49] build an objective function to find an adequate parameter set based on the type of information they want to yield from the model (e.g., streamflow volume, timing, snowpack, etc.). Typically, the calibration-validation procedure takes the form of a data-denial experiment. The model is run over a calibration period to select best parameter sets and then re-run over a validation period to ensure that the selected parameter set performs well during this period for which data was not used to calibrate the model.
Fourteen parameters are included within the HBV model and govern rates of exchange between reservoirs. We held five of them constant, while the remaining nine were calibrated.
and
are insensitive parameters and were held constant as is often done in HBV applications [
50]. While many of the parameters are conceptual and cannot be measured, three of them are based on physical properties, so we fixed those parameters to better represent the reality of our study area. We used the Global Gridded Surfaces of Selected Soil Characteristics (IGBP-DIS) dataset [
51] and took the average of values for the study area. We used the following datasets from IGBP-DIS: soil field capacity, soil profile available water capacity, and soil wilting point for the parameters
,
, and
, respectively (
Table 4). In each model run, we randomly selected the remaining nine parameters from a uniform distribution between ranges of possible values (
Table 4) defined based on previous studies [
31,
41].
We ran the model for 1000 simulations at a daily time step over the years 1988–2000 (12 years + 1 spin-up year). We selected this time interval for calibration because it encompasses a reasonably long time period and includes both wet and dry years. We compared model output to historical stream discharge records from three long-term USGS gaging stations and snowpack observations from nine SNOTEL (SNOw TELemetry) stations, omitting all leap days from these datasets (
Table 5). For each run, we calculated the Nash-Sutcliffe Efficiency (
) [
52],
, and a volume error (
) using the following equations:
where
is the observed value and
is the simulated value at each daily time step.
coefficients range from
to 1, with 1 indicating a perfect fit of the model to the observed data, and a value of
> 0 indicating the model is a better predictor than the historically observed mean. Typically, a model is deemed satisfactory if the
is larger than 0.5 [
53]. The logarithmic form of the
also ranges from
to 1, but is more sensitive to low flow and still reacts to peak flows [
54]. The volume error provides insight into whether the model overestimates (
< 0) or underestimates (
> 0) total volume, with a value closest to 0 being ideal.
We created an objective function to select the best-performing parameter set and was developed based on work by [
41]:
where
is the Nash-Sutcliffe Coefficient of discharge weighted by an areal average of the gauges,
is the volume error for the gauges weighted by an areal average, and
is the averaged Nash-Sutcliffe Coefficient for SWE (snow water equivalent) for all SNOTEL sites.
The objective function ideally is as close to 1 as possible, as we wish to maximize and minimize volume bias. The top 1% best performing parameter sets were run over the eight-year validation period (2001–2008) and the set that performed on average the best in both calibration and validation years was chosen for our model. Results of the calibration/validation exercises are reported in the Results section of this manuscript.


