Infilling Missing Data in Hydrology: Solutions Using Satellite Radar Altimetry and Multiple Imputation for Data-Sparse Regions
Abstract
:1. Introduction
- Determine the effectiveness of RA and MI approaches for filling missing data in hydrological timeseries.
- Assess the impact of both approaches on flood frequency that is estimated given varying quantities of missing data.
- Quantify the magnitude of the devastating 2012 flood in Nigeria (the study region for this research), after identifying the optimal infilling approach.
2. Study Region
3. Materials and Methods
3.1. In Situ Hydrological Data
3.2. Radar Altimetry Hydrological Data
3.3. Missing Data Imputation, Pre-Processing, and Flood Frequency Analysis
3.3.1. Radar Altimetry Data Processing
3.3.2. Multiple Imputation of Missing Data
3.3.3. Hydrological Data Pre-Processing
- Pettitt’s test [74]: to assess historical data homogeneity;
- One-unit lag correlation coefficient statistics [75]: to test the serial correlation between the independent observations of a time-series,
- Ratings Ratio [76]: to assesses possible rating curve extrapolation effects by dividing the maximum discharge for each year by the maximum measured discharge applied in the ratings curve development.
3.3.4. Flood Frequency Estimation
3.3.5. Assessment of Missing Data Imputation Method Impact on Flood Frequency Estimates
3.5.6. Missing Data Imputation Methodology Outcome Evaluation
4. Results and Discussion
4.1. Missing Data Infilling with Radar Altimetry and Multiple Imputation
4.2. Preliminary Data Analysis
4.3. Flood Frequency Estimation, Uncertainties, and Application
4.4. Assessment of the Effects of Data Infilling Methods on Flood Quantile Estimates
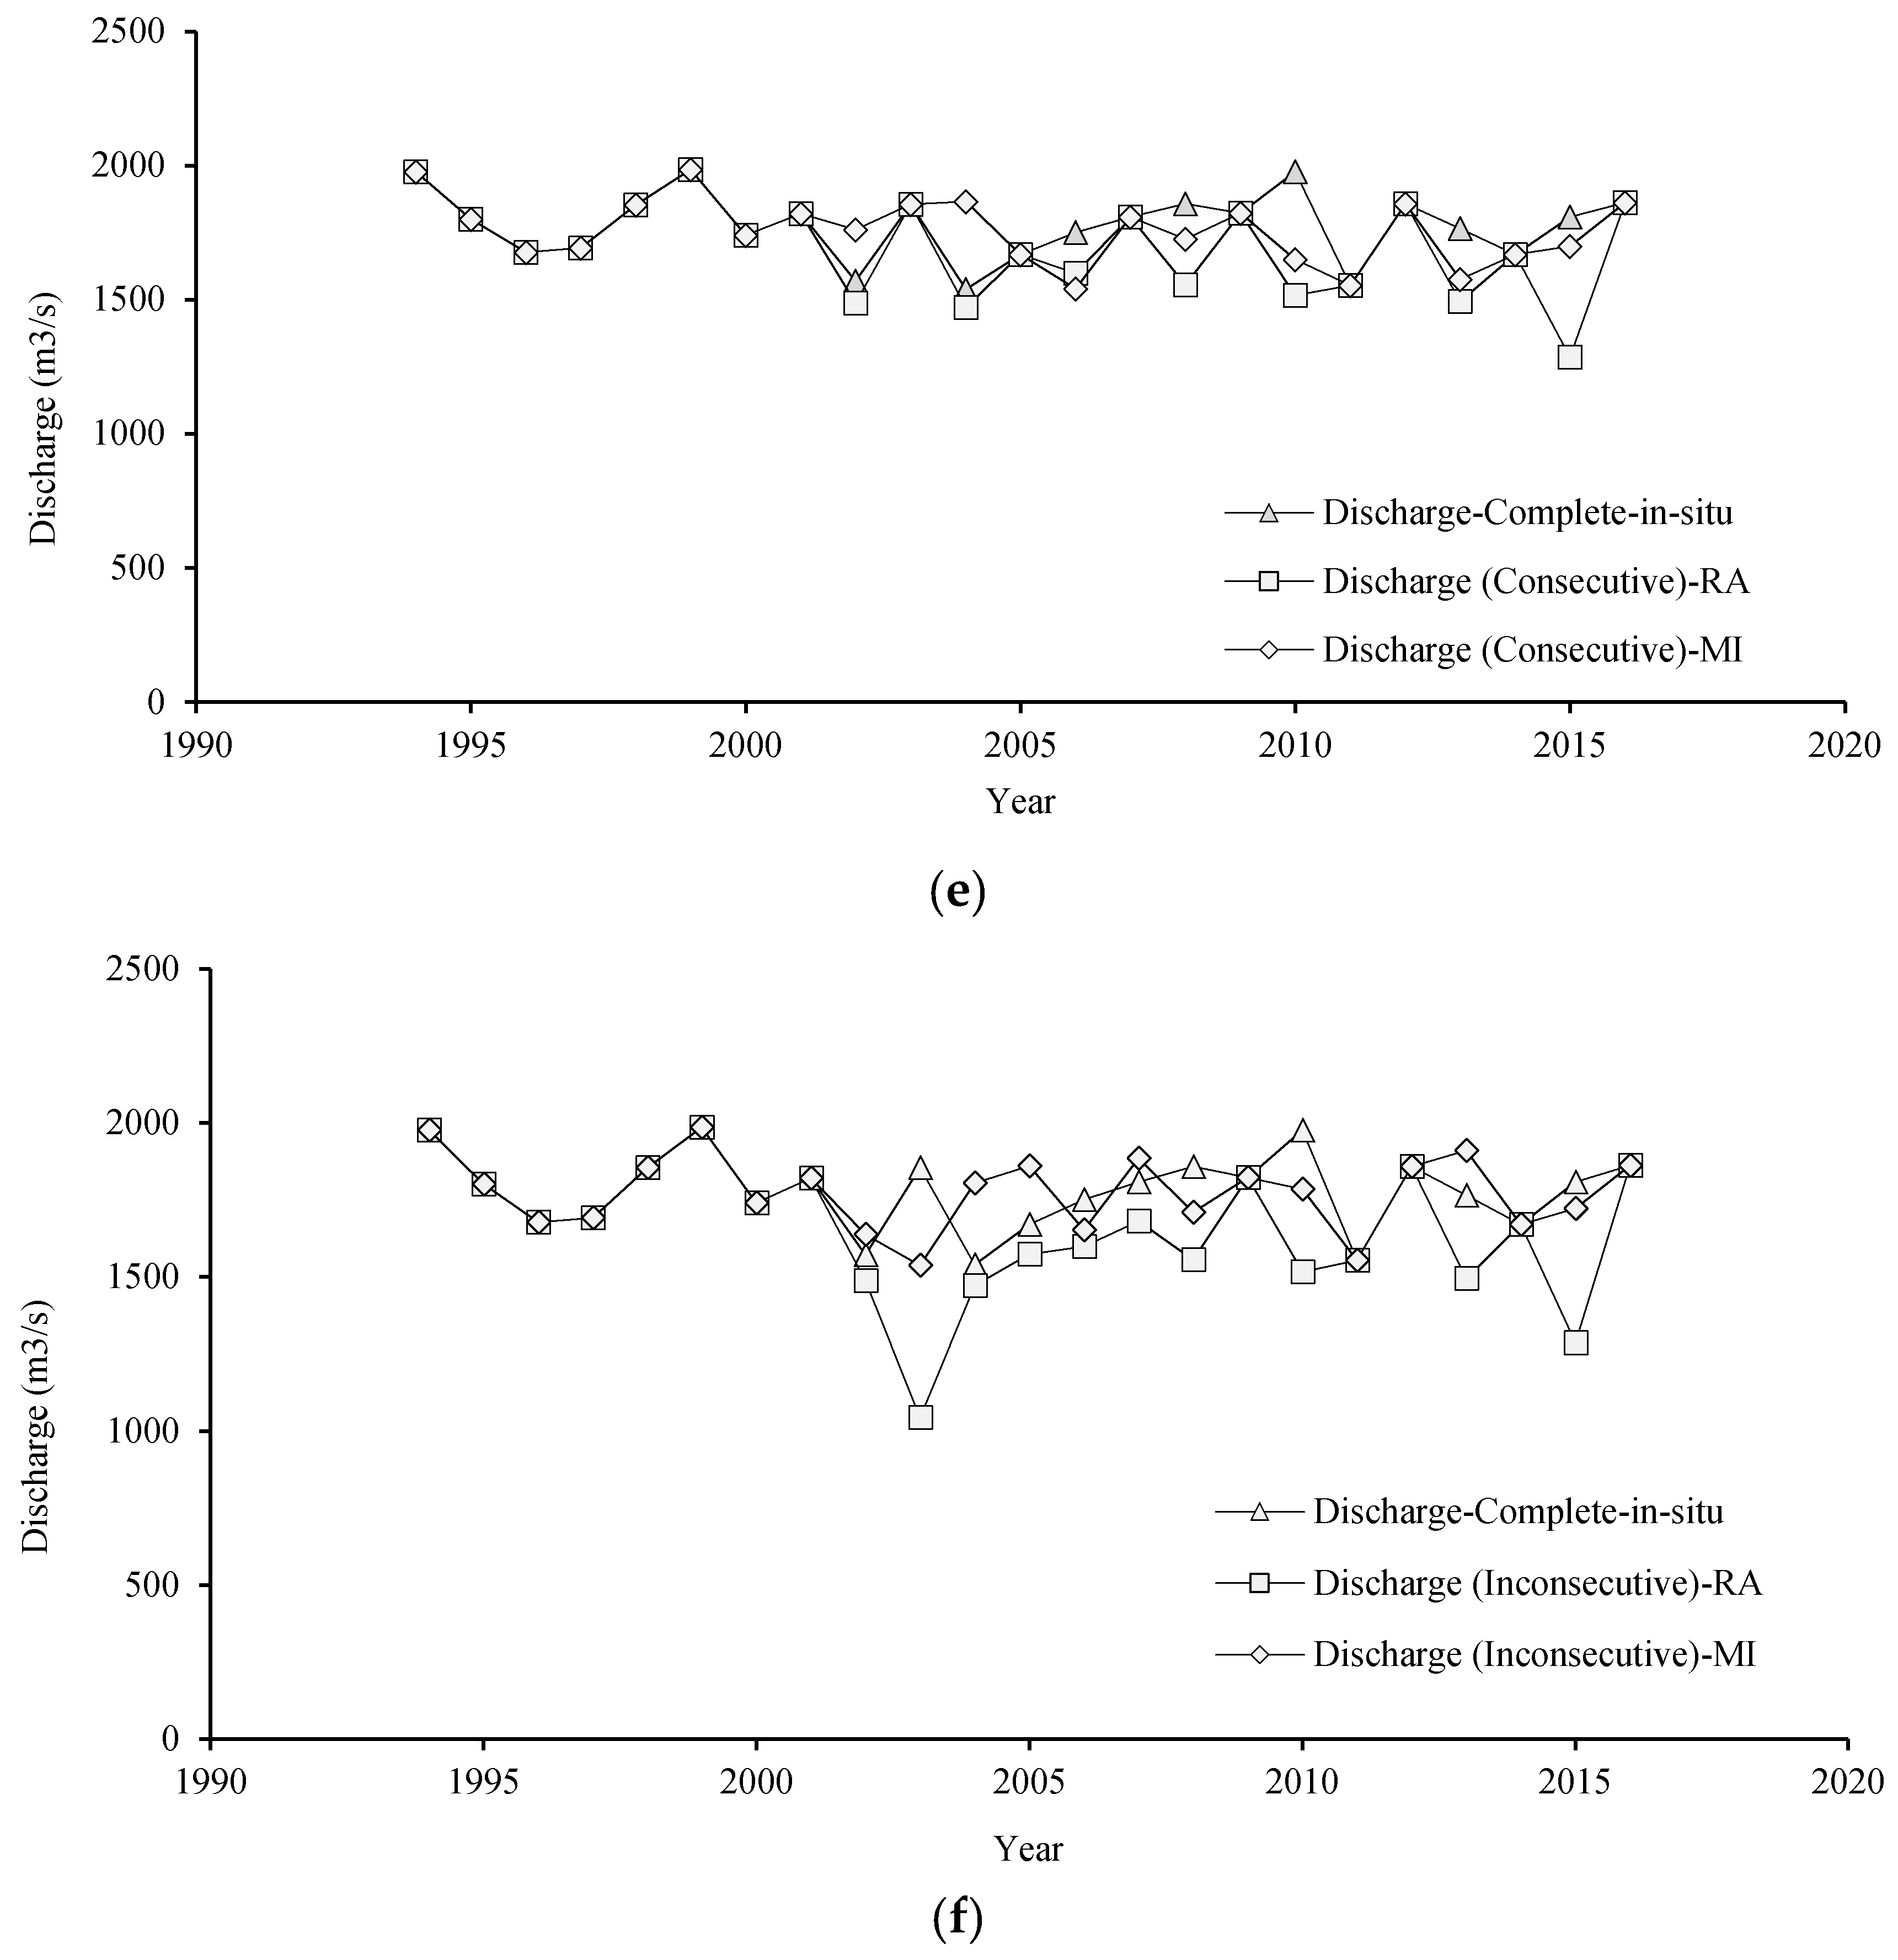
4.5. Assessment of Radar Altimetry and Multiple Imputation Infilling at Taoussa, Mali
4.6. The 2012 Flood Event Return Period Estimations
5. Conclusions
Supplementary Materials
Author Contributions
Funding
Acknowledgments
Conflicts of Interest
References
- Lavender, S.L.; Matthews, A.J. Response of the West African Monsoon to the Madden-Julian Oscillation. J. Clim. 2009, 22, 4097–4116. [Google Scholar] [CrossRef]
- Bshir, D.; Garba, M. Hydrological Monitoring and Information System for Sustainable Basin Management. In Proceedings of the First Annual Conference of the Nigerian Association of Hydrological Sciences, Yola, Nigeria, 2–4 December 2003. [Google Scholar]
- Herschy, R.W. Streamflow Measurement, 3rd ed.; Taylor & Francis: New York, NY, USA, 2008. [Google Scholar]
- Olayinka, D.N.; Nwilo, P.C.; Emmanuel, A. From Catchment to Reach: Predictive Modelling of Floods in Nigeria. In Proceedings of the FIG Working Week 2013, Environment for Sustainability, Abuja, Nigeria, 6–10 May 2013. [Google Scholar]
- Giustarini, L.; Parisot, O.; Ghoniem, M.; Hostache, R.; Trebs, I.; Otjacques, B. A User-Driven Case-Based Reasoning Tool for Infilling Missing Values in Daily Mean River Flow Records. Environ. Model. Softw. 2016, 82, 308–320. [Google Scholar] [CrossRef]
- Ekeu-Wei, I.T.; Blackburn, G.A. Applications of Open-Access Remotely Sensed Data for Flood Modelling and Mapping in Developing Regions. Hydrology 2018, 5, 39. [Google Scholar] [CrossRef]
- Merz, B.; Thieken, A.H. Separating Natural and Epistemic Uncertainty in Flood Frequency Analysis. J. Hydrol. 2005, 309, 114–132. [Google Scholar] [CrossRef]
- Tarpanelli, A.; Brocca, L.; Lacava, T.; Melone, F.; Moramarco, T.; Faruolo, M.; Pergola, N.; Tramutoli, V. Toward the Estimation of River Discharge Variations Using Modis Data in Ungauged Basins. Remote Sens. Environ. 2013, 136, 47–55. [Google Scholar] [CrossRef]
- Birkinshaw, S.J.; Moore, P.; Kilsby, C.G.; Donnell, G.M.; Hardy, A.J.; Berry, P.A.M. Daily Discharge Estimation at Ungauged River Sites Using Remote Sensing. Hydrol. Process. 2014, 28, 1043–1054. [Google Scholar] [CrossRef]
- Neal, J.; Schumann, G.; Bates, P. A Subgrid Channel Model for Simulating River Hydraulics and Floodplain Inundation over Large and Data Sparse Areas. Water Resour. Res. 2012, 48. [Google Scholar] [CrossRef]
- Pereira Cardenal, S.J.; Riegels, N.; Berry, P.; Smith, R.; Yakovlev, A.; Siegfried, T.; Bauer-Gottwein, P. Real-Time Remote Sensing Driven River Basin Modelling Using Radar Altimetry. Hydrol. Earth Syst. Sci. 2010, 7, 8347–8385. [Google Scholar] [CrossRef] [Green Version]
- Jarihani, A.A.; Larsen, J.R.; Callow, J.N.; Mcvicar, T.R.; Johansen, K. Where Does All the Water Go? Partitioning Water Transmission Losses in a Data-Sparse, Multi-Channel and Low-Gradient Dryland River System Using Modelling and Remote Sensing. J. Hydrol. 2015, 529, 1511–1529. [Google Scholar] [CrossRef]
- Jotish, N.; Parthasarathi, C.; Nazrin, U.; Victor, S.K.; Silchar, A. A Geomorphological Based Rainfall-Runoff Model for Ungauged Watersheds. Int. J. Geomat. Geosci. 2011, 2, 676–687. [Google Scholar]
- Smith, A.; Sampson, C.; Bates, P. Regional Flood Frequency Analysis at the Global Scale. Water Resour. Res. 2015, 51, 539–553. [Google Scholar] [CrossRef]
- Hrachowitz, M.; Savenije, H.; Blöschl, G.; Mcdonnell, J.; Sivapalan, M.; Pomeroy, J.; Arheimer, B.; Blume, T.; Clark, M.; Ehret, U. A Decade of Predictions in Ungauged Basins (Pub)—A Review. Hydrol. Sci. J. 2013, 58, 1198–1255. [Google Scholar] [CrossRef]
- Jung, Y.; Merwade, V. Estimation of Uncertainty Propagation in Flood Inundation Mapping Using a 1-D Hydraulic Model. Hydrol. Process. 2015, 29, 624–640. [Google Scholar] [CrossRef]
- Campozano, L.; Sánchez, E.; Aviles, A.; Samaniego, E. Evaluation of Infilling Methods for Time Series of Daily Precipitation and Temperature: The Case of the Ecuadorian Andes. Maskana 2014, 5, 99–115. [Google Scholar]
- Westerberg, I.; Mcmillan, H. Uncertainty in Hydrological Signatures. Hydrol. Earth Syst. Sci. 2015, 12, 4233–4270. [Google Scholar] [CrossRef]
- Lee, H.; Kang, K. Interpolation of Missing Precipitation Data Using Kernel Estimations for Hydrologic Modeling. Adv. Meteorol. 2015, 2015, 935868. [Google Scholar] [CrossRef]
- Hasan, M.M.; Croke, B. Filling Gaps in Daily Rainfall Data: A Statistical Approach. In Proceedings of the 20th International Congress on Modelling and Simulation (MODSIM2013), Adelaide, Australia, 1–6 December 2013; pp. 380–386. [Google Scholar]
- Steven, K.S.; Shelli, K.S.T.H.; Travis, H.; Yunsheng, S.; Denny, T.; Mark, B. Filling in Missing Peakflow Data Using Artificial Neural Networks. J. Eng. Appl. Sci. 2010, 5, 49–55. [Google Scholar]
- Peugh, J.L.; Enders, C.K. Missing Data in Educational Research: A Review of Reporting Practices and Suggestions for Improvement. Rev. Educ. Res. 2004, 74, 525–556. [Google Scholar] [CrossRef]
- King, G.; Honaker, J.; Joseph, A.; Scheve, K. List-Wise Deletion is Evil: What to Do about Missing Data in Political Science. In Proceedings of the Annual Meeting of the American Political Science Association, Boston, MA, USA, 19 August 1988. [Google Scholar]
- Little, R.J.A. Statistical Analysis with Missing Data, 2nd ed.; Wiley: Hoboken, NJ, USA, 2002. [Google Scholar]
- Donders, A.R.T.; Van Der Heijden, G.J.M.G.; Stijnen, T.; Moons, K.G.M. Review: A Gentle Introduction to Imputation of Missing Values. J. Clin. Epidemiol. 2006, 59, 1087–1091. [Google Scholar] [CrossRef] [PubMed]
- Jolliffe, I.T. Principal Component Analysis [Electronic Resource], 2nd ed.; Springer: New York, NY, USA, 2002. [Google Scholar]
- Graham, J.; Olchowski, A.; Gilreath, T. How Many Imputations Are Really Needed? Some Practical Clarifications of Multiple Imputation Theory. Prev. Sci. 2007, 8, 206–213. [Google Scholar] [CrossRef] [PubMed]
- Khalifeloo, M.H.; Mohammad, M.; Heydari, M. Multiple Imputation for Hydrological Missing Data by Using a Regression Method (Klang River Basin). Int. J. Res. Eng. Technol. 2015, 4, 519–524. [Google Scholar]
- Tyler, C.M.; Sue Ellen, H.; George, S.Y. The Effects of Imputing Missing Data on Ensemble Temperature Forecasts. J. Comput. 2011, 6, 162–171. [Google Scholar]
- Lee, K.J.; Carlin, J.B. Multiple Imputation for Missing Data: Fully Conditional Specification Versus Multivariate Normal Imputation. Am. J. Epidemiol. 2010, 171, 624–632. [Google Scholar] [CrossRef] [PubMed] [Green Version]
- Pan, F.; Nichols, J. Remote Sensing of River Stage Using the Cross-Sectional Inundation Area-River Stage Relationship (Iarsr) Constructed from Digital Elevation Model Data. Hydrol. Process. 2013, 27, 3596–3606. [Google Scholar] [CrossRef]
- Tommaso, M.; Angelica, T.; Luca, B.; Silvia, B. River Discharge Estimation by Using Altimetry Data and Simplified Flood Routing Modeling. Remote Sens. 2013, 5, 4145–4162. [Google Scholar] [Green Version]
- Gleason, C.J.; Smith, L.C. Toward Global Mapping of River Discharge Using Satellite Images and at-Many-Stations Hydraulic Geometry. Proc. Natl. Acad. Sci. USA 2014, 111, 4788–4791. [Google Scholar] [CrossRef] [PubMed]
- Asadzadeh Jarihani, A.; Callow, J.N.; Johansen, K.; Gouweleeuw, B. Evaluation of Multiple Satellite Altimetry Data for Studying Inland Water Bodies and River Floods. J. Hydrol. 2013, 505, 78–90. [Google Scholar] [CrossRef]
- Pandey, R.; Amarnath, G. The Potential of Satellite Radar Altimetry in Flood Forecasting: Concept and Implementation for the Niger-Benue River Basin. Proc. IAHS 2015, 370, 223–227. [Google Scholar] [CrossRef]
- Silva, J.; Calmant, S.; Seyler, F.; Moreira, D.; Oliveira, D.; Monteiro, A. Radar Altimetry Aids Managing Gauge Networks. Water Resour. Manag. 2014, 28, 587–603. [Google Scholar] [CrossRef]
- Osti, R.; Tanaka, S.; Tokioka, T. Flood Hazard Mapping in Developing Countries: Problems and Prospects. Disaster Prev. Manag. Int. J. 2008, 17, 104–113. [Google Scholar] [CrossRef]
- Crétaux, J.-F.; Jelinski, W.; Calmant, S.; Kouraev, A.; Vuglinski, V.; Bergé-Nguyen, M.; Gennero, M.-C.; Nino, F.; Del Rio, R.A.; Cazenave, A. Sols: A Lake Database to Monitor in the near Real Time Water Level and Storage Variations from Remote Sensing Data. Adv. Space Res. 2011, 47, 1497–1507. [Google Scholar] [CrossRef]
- NESDIS. Jason 3 Has Reached Its Operational Orbit. 2016. Available online: http://www.nesdis.noaa.gov/news_archives/jason3_lift_off_is_just_the_beginning.html (accessed on 20 February 2016).
- European Space Agency (ESA). Third Sentinel Launch for Copernicus. 2016. Available online: http://www.esa.int/Our_Activities/Observing_the_Earth/Copernicus/Sentinel-3/Third_Sentinel_satellite_launched_for_Copernicus (accessed on 20 February 2016).
- Avisio. Avisio Satellite Altimetry Data. 2016. Available online: http://www.aviso.altimetry.fr/en/home.html (accessed on 1 January 2016).
- Clark, E.A.; Sylvainhossain, F.; Jean-Françoislettenmaier, D.P. Altimetry Applications to Transboundary River Basin Management. In Inland Water Altimetry; Benveniste, J., Vignudelli, S., Kostianoy, A., Eds.; Springer: Washington, DC, USA, 2014. [Google Scholar]
- Odunuga, S.; Adegun, O.; Raji, S.; Udofia, S. Changes in Flood Risk in Lower Niger-Benue Catchments. Proc. Int. Assoc. Hydrol. Sci. 2015, 370, 97–102. [Google Scholar] [CrossRef]
- The Project for Review and Update of Nigeria National Water Resources Master Plan; Federal Ministry of Water Resources: Abuja, Nigeria, 2013.
- Post-Disaster Needs Assessment 2012 Floods; The Federal Government of Nigeria: Abuja, Nigeria, 2013.
- Erekpokeme, L.N. Flood Disasters in Nigeria: Farmers and Governments’ Mitigation efforts. J. Biol. Agric. Healthc. 2015, 5, 150–154. [Google Scholar]
- Ojigi, M.; Abdulkadir, F.; Aderoju, M. Geospatial Mapping and Analysis of the 2012 Flood Disaster in Central Parts of Nigeria. In Proceedings of the 8th National GIS Symposium, Dammam, Saudi Arabia, 15–17 April 2013; pp. 1–14. [Google Scholar]
- Tami, A.G.; Moses, O. Flood Vulnerability Assessment of Niger Delta States Relative to 2012 Flood Disaster in Nigeria. Am. J. Environ. Prot. 2015, 3, 76–83. [Google Scholar]
- Olojo, O.O.; Asma, T.I.; Isah, A.A.; Oyewumi, A.S.; Adepero, O. The Role of Earth Observation Satellite During the International collaboration on the 2012 Nigeria Flood Disaster. In Proceedings of the 64th International Astronautical Congress, Beijing, China, 23–27 September 2013. [Google Scholar]
- Nigerian Hydrological Service Agency. Update on Nihsa Early Flood Warning in Nigeria as at 30th August 2018. 2018. Available online: http://nihsa.gov.ng/2018/08/30/update-on-nihsa-early-flood-warning-in-nigeria-as-at-30th-august-2018/ (accessed on 2 October 2018).
- Abam, T.K.S. Modification of Niger Delta Physical Ecology: The Role of Dams and Reservoirs. Hydro-Ecol. Link. Hydrol. Aquat. Ecol. 2001, 266, 19–29. [Google Scholar]
- Da Silva, J.S.; Calmant, S.; Seyler, F.; Rotunno Filho, O.C.; Cochonneau, G.; Mansur, W.J. Water Levels in the Amazon Basin Derived from the Ers 2 and Envisat Radar Altimetry Missions. Remote Sens. Environ. 2010, 114, 2160–2181. [Google Scholar] [CrossRef]
- Belaud, G.; Cassan, L.; Bader, J.; Bercher, N.; Feret, T. Calibration of a Propagation Model in Large River Using Satellite Altimetry. In Proceedings of the 6th International Symposium on Environmental Hydraulics, Athens, Greece, 23–25 June 2010; pp. 23–25. [Google Scholar]
- Musa, Z.; Popescu, I.; Mynett, A. A Review of Applications of Satellite Sar, Optical, Altimetry and Dem Data for Surface Water Modelling, Mapping and Parameter Estimation. Hydrol. Earth Syst. Sci. 2015, 12, 4857–4878. [Google Scholar] [CrossRef]
- Frappart, F.; Calmant, S.; Cauhopé, M.; Seyler, F.; Cazenave, A. Preliminary Results of Envisat Ra-2-Derived Water Levels Validation over the Amazon Basin. Remote Sens. Environ. 2006, 100, 252–264. [Google Scholar] [CrossRef] [Green Version]
- Jarihani, A.A.; Callow, J.N.; Mcvicar, T.R.; Van Niel, T.G.; Larsen, J.R. Satellite-Derived Digital Elevation Model (Dem) Selection, Preparation and Correction for Hydrodynamic Modelling in Large, Low-Gradient and Data-Sparse Catchments. J. Hydrol. 2015, 524, 489–506. [Google Scholar] [CrossRef]
- Papa, F.; Durand, F.; Rossow, W.B.; Rahman, A.; Bala, S.K. Satellite Altimeter-Derived Monthly Discharge of the Ganga-Brahmaputra River and Its Seasonal to Interannual Variations from 1993 to 2008. J. Geophys. Res. Oceans 2010, 115. [Google Scholar] [CrossRef]
- Michailovsky, C.I.; Mcennis, S.; Bauer-Gottwein, P.A.M.; Berry, R.; Smith, P. River Monitoring from Satellite Radar Altimetry in the Zambezi River Basin. Hydrol. Earth Syst. Sci. 2012, 16, 2181–2192. [Google Scholar] [CrossRef] [Green Version]
- Gill, M.K.; Asefa, T.; Kaheil, Y.; Mckee, M. Effect of Missing Data on Performance of Learning Algorithms for Hydrologic Predictions: Implications to an Imputation Technique. Water Resour. Res. 2007, 43. [Google Scholar] [CrossRef]
- Roderick, J.A.L. Regression with Missing X’s: A Review. J. Am. Stat. Assoc. 2011, 87, 1227–1237. [Google Scholar]
- Van Der Heijden, G.J.M.G.; Donders, A.R.T.; Stijnen, T.; Moons, K.G.M. Imputation of Missing Values Is Superior to Complete Case Analysis and the Missing-Indicator Method in Multivariable Diagnostic Research: A Clinical Example. J. Clin. Epidemiol. 2006, 59, 1102–1109. [Google Scholar] [CrossRef] [PubMed]
- Li, P.; Stuart, E.; Allison, D. Multiple Imputation a Flexible Tool for Handling Missing Data. JAMA 2015, 314, 1966–1967. [Google Scholar] [CrossRef] [PubMed]
- Yozgatligil, C.; Aslan, S.; Iyigun, C.; Batmaz, I. Comparison of Missing Value Imputation Methods in Time Series: The Case of Turkish Meteorological Data. Theor. Appl. Climatol. 2013, 112, 143–167. [Google Scholar] [CrossRef]
- Sattari, M.-T.; Rezazadeh-Joudi, A.; Kusiak, A. Assessment of Different Methods for Estimation of Missing Data in Precipitation Studies. Hydrol. Res. 2017, 48, 1032–1044. [Google Scholar] [CrossRef]
- Van Buuren, S. Multiple Imputation of Discrete and Continuous Data by Fully Conditional Specification. Stat. Methods Med. Res. 2007, 16, 219–242. [Google Scholar] [CrossRef] [PubMed]
- Barnes, S.A.; Lindborg, S.R.; Seaman, J.W. Multiple Imputation Techniques in Small Sample Clinical Trials. Stat. Med. 2006, 25, 233–245. [Google Scholar] [CrossRef] [PubMed]
- Lamontagne, J.R.; Stedinger, J.R.; Cohn, T.A.; Barth, N.A. Robust National Flood Frequency Guidelines: What Is an Outlier? In Proceedings of the World Environmental and Water Resources Congress, Cincinnati, OH, USA, 19–23 May 2013.
- Di Baldassarre, G.; Laio, F.; Montanari, A. Effect of Observation Errors on the Uncertainty of Design Floods. Phys. Chem. Earth 2012, 42–44, 85–90. [Google Scholar] [CrossRef]
- Haque, M.M.; Rahman, A.; Haddad, K. Rating Curve Uncertainty in Flood Frequency Analysis: A Quantitative Assessment. J. Hydrol. Environ. Res. 2014, 2, 50–58. [Google Scholar]
- Grubbs, F.E.; Beck, G. Extension of Sample Sizes and Percentage Points for Significance Tests of Outlying Observations. Technometrics 1972, 14, 847–854. [Google Scholar] [CrossRef]
- Rahman, A.S.; Haddad, K.; Rahman, A. Identification of Outliers in Flood Frequency Analysis: Comparison of Original and Multiple Grubbs-Beck Test. World Acad. Sci. Eng. Technol. 2014, 8, 732–740. [Google Scholar]
- Mann, H.B. Nonparametric Tests against Trend. Econom. J. Econom. Soc. 1945, 13, 245–259. [Google Scholar] [CrossRef]
- Kendall, M. Rank Correlation Methods, 4th ed.; Charles Griffin: London, UK, 1975. [Google Scholar]
- Pettitt, A. A Non-Parametric Approach to the Change-Point Problem. Appl. Stat. 1979, 28, 126–135. [Google Scholar] [CrossRef]
- Kendall, M.; Stuart, A. The Advanced Theory of Statistics (Volume 1); Griffin: London, UK, 1969. [Google Scholar]
- Haddad, K.; Rahman, A.; Weinmann, P.; Kuczera, G.; Ball, J. Streamflow Data Preparation for Regional Flood Frequency Analysis: Lessons from Southeast Australia. Aust. J. Water Resour. 2010, 14, 17–32. [Google Scholar] [CrossRef]
- Kuczera, G. Comprehensive at-Site Flood Frequency Analysis Using Monte Carlo Bayesian Inference. Water Resour. Res. 1999, 35, 1551–1557. [Google Scholar] [CrossRef]
- Reed, D. Procedures for Flood Freequency Estimation, Volume 3: Statistical Procedures for Flood Freequency Estimation; Institute of Hydrology: Parker, CO, USA, 1999. [Google Scholar]
- Laio, F.; Di Baldassarre, G.; Montanari, A. Model Selection Techniques for the Frequency Analysis of Hydrological Extremes. Water Resour. Res. 2009, 45. [Google Scholar] [CrossRef]
- Peel, M.; Wang, Q.J.; Vogel, R.; Mcmahon, T. The Utility of L-Moment Ratio Diagrams for Selecting a Regional Probability Distribution. Hydrol. Sci. J. 2001, 46, 147–155. [Google Scholar] [CrossRef]
- Komi, K.; Amisigo, B.A.; Diekkrüger, B.; Hountondji, F.C. Regional Flood Frequency Analysis in the Volta River Basin, West Africa. Hydrology 2016, 3, 5. [Google Scholar] [CrossRef]
- Hailegeorgis, T.T.; Alfredsen, K. Regional Flood Frequency Analysis and Prediction in Ungauged Basins Including Estimation of Major Uncertainties for Mid-Norway. J. Hydrol. Reg. Stud. 2017, 9, 104–126. [Google Scholar] [CrossRef]
- Izinyon, O.; Ehiorobo, J. L-Moments Approach for Flood Frequency Analysis of River Okhuwan in Benin-Owena River Basin in Nigeria. Niger. J. Technol. 2014, 33, 10–18. [Google Scholar] [CrossRef]
- Fasinmirin, J.T.; Olufayo, A.A. Comparison of Flood Prediction Models for River Lokoja, Nigeria. Geophys. Res. Abstr. 2006, 8, 02782. [Google Scholar]
- Ragulina, G.; Reitan, T. Generalized Extreme Value Shape Parameter and Its Nature for Extreme Precipitation Using Long Time Series and the Bayesian Approach. Hydrol. Sci. J. 2017, 62, 863–879. [Google Scholar] [CrossRef]
- Good, P.I. Permutation Tests: A Practical Guide to Resampling Methods for Testing Hypotheses, 2nd ed.; Springer: New York, NY, USA, 2000. [Google Scholar]
- Kolmogorov, A.N. Selected Works of A.N. Kolmogorov; Kluwer Academic Publishers: Dordrecht, The Netherland; Boston, MA, USA, 1991. [Google Scholar]
- Dubey, A.K.; Gupta, P.; Dutta, S.; Singh, R.P. Water Level Retrieval Using Saral/Altika Observations in the Braided Brahmaputra River, Eastern India. Mar. Geod. 2015, 38, 549–567. [Google Scholar] [CrossRef]
- Andrew, T.J.; Louis, E.; Wei, E.; Qiming, E. Time Series Analysis for Psychological Research: Examining and Forecasting Change. Front. Psychol. 2015, 6, 727. [Google Scholar]
- Kang, H.M.; Yusof, F. Homogeneity Tests on Daily Rainfall Series in Peninsular Malaysia. Int. J. Contemp. Math. Sci. 2012, 7, 9–22. [Google Scholar]
- Feaster, T.D. Importance of Record Length with Respect to Estimating the 1-Percent Chance Flood. In Proceedings of the 2010 South Carolina Water Resources Conference, Columbia, SC, USA, 13–14 October 2010. [Google Scholar]
- Baldassarre, G.D.; Montanari, A. Uncertainty in River Discharge Observations: A Quantitative Analysis. Hydrol. Earth Syst. Sci. 2009, 13, 913–921. [Google Scholar] [CrossRef]
- Ewemoje, T.A.; Ewemooje, O. Best Distribution and Plotting Positions of Daily Maximum Flood Estimation at Ona River in Ogun-Oshun River Basin, Nigeria. Agric. Eng. Int. CIGR J. 2011, 13, 1–11. [Google Scholar]
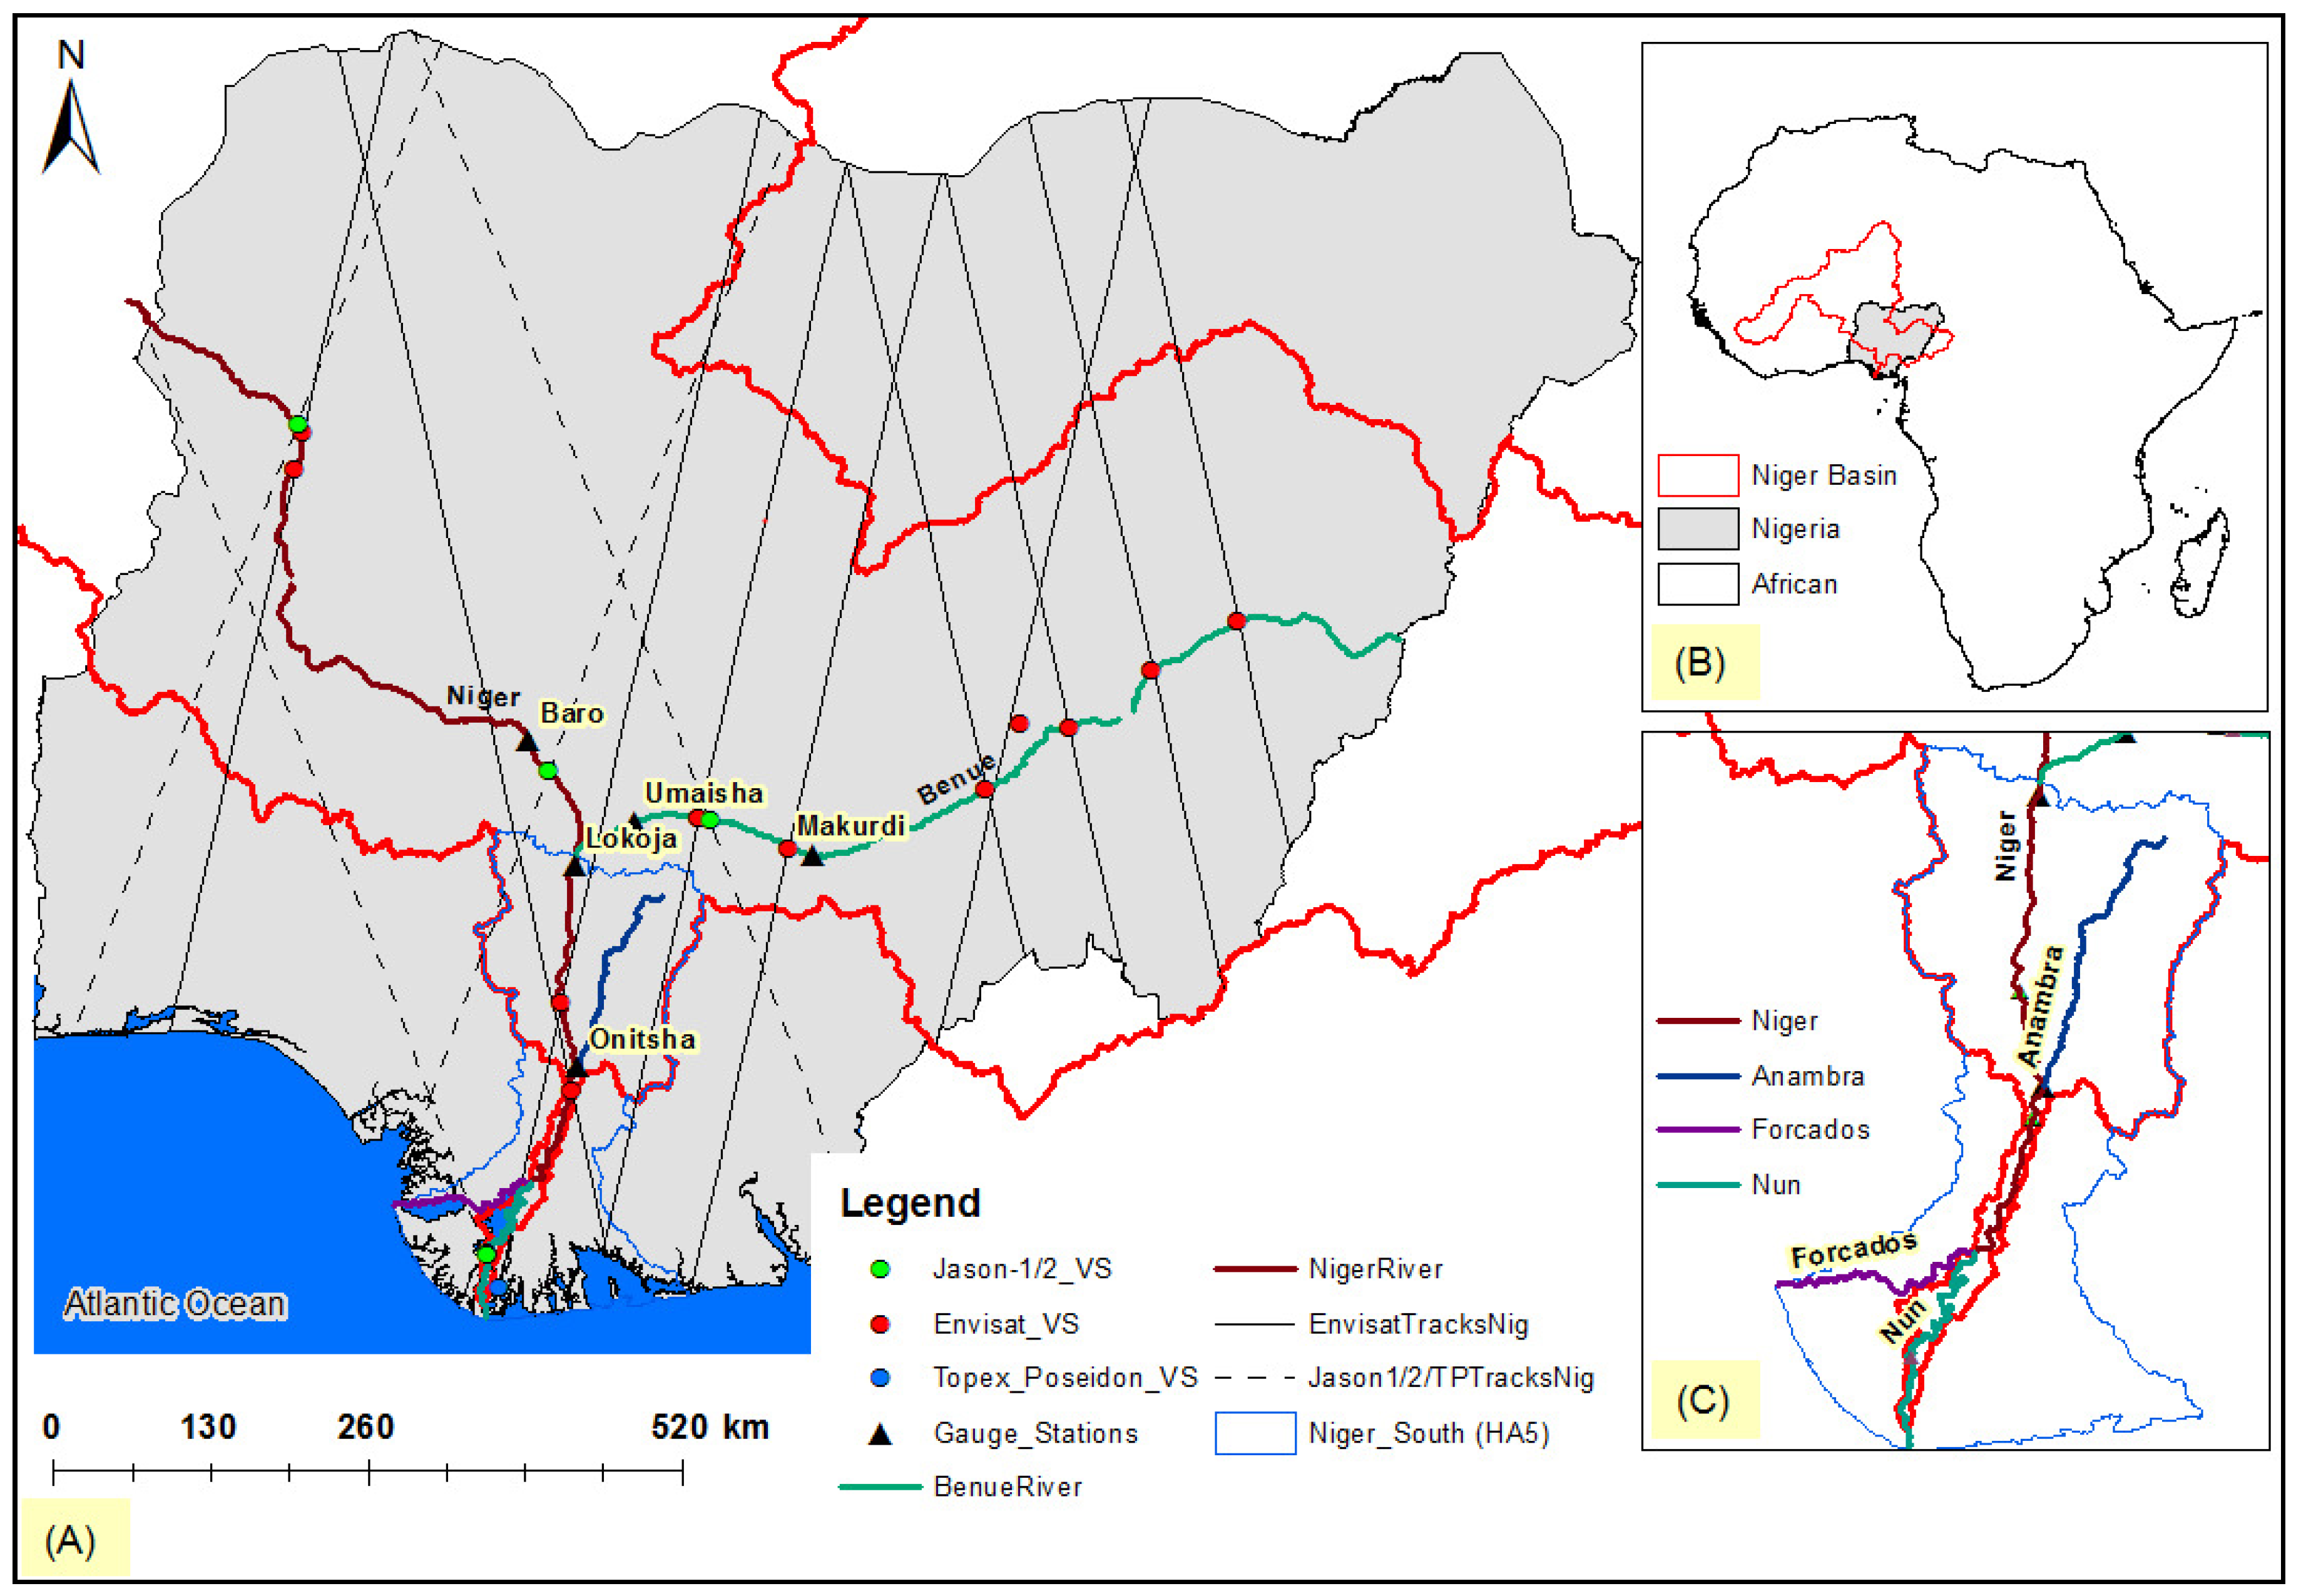
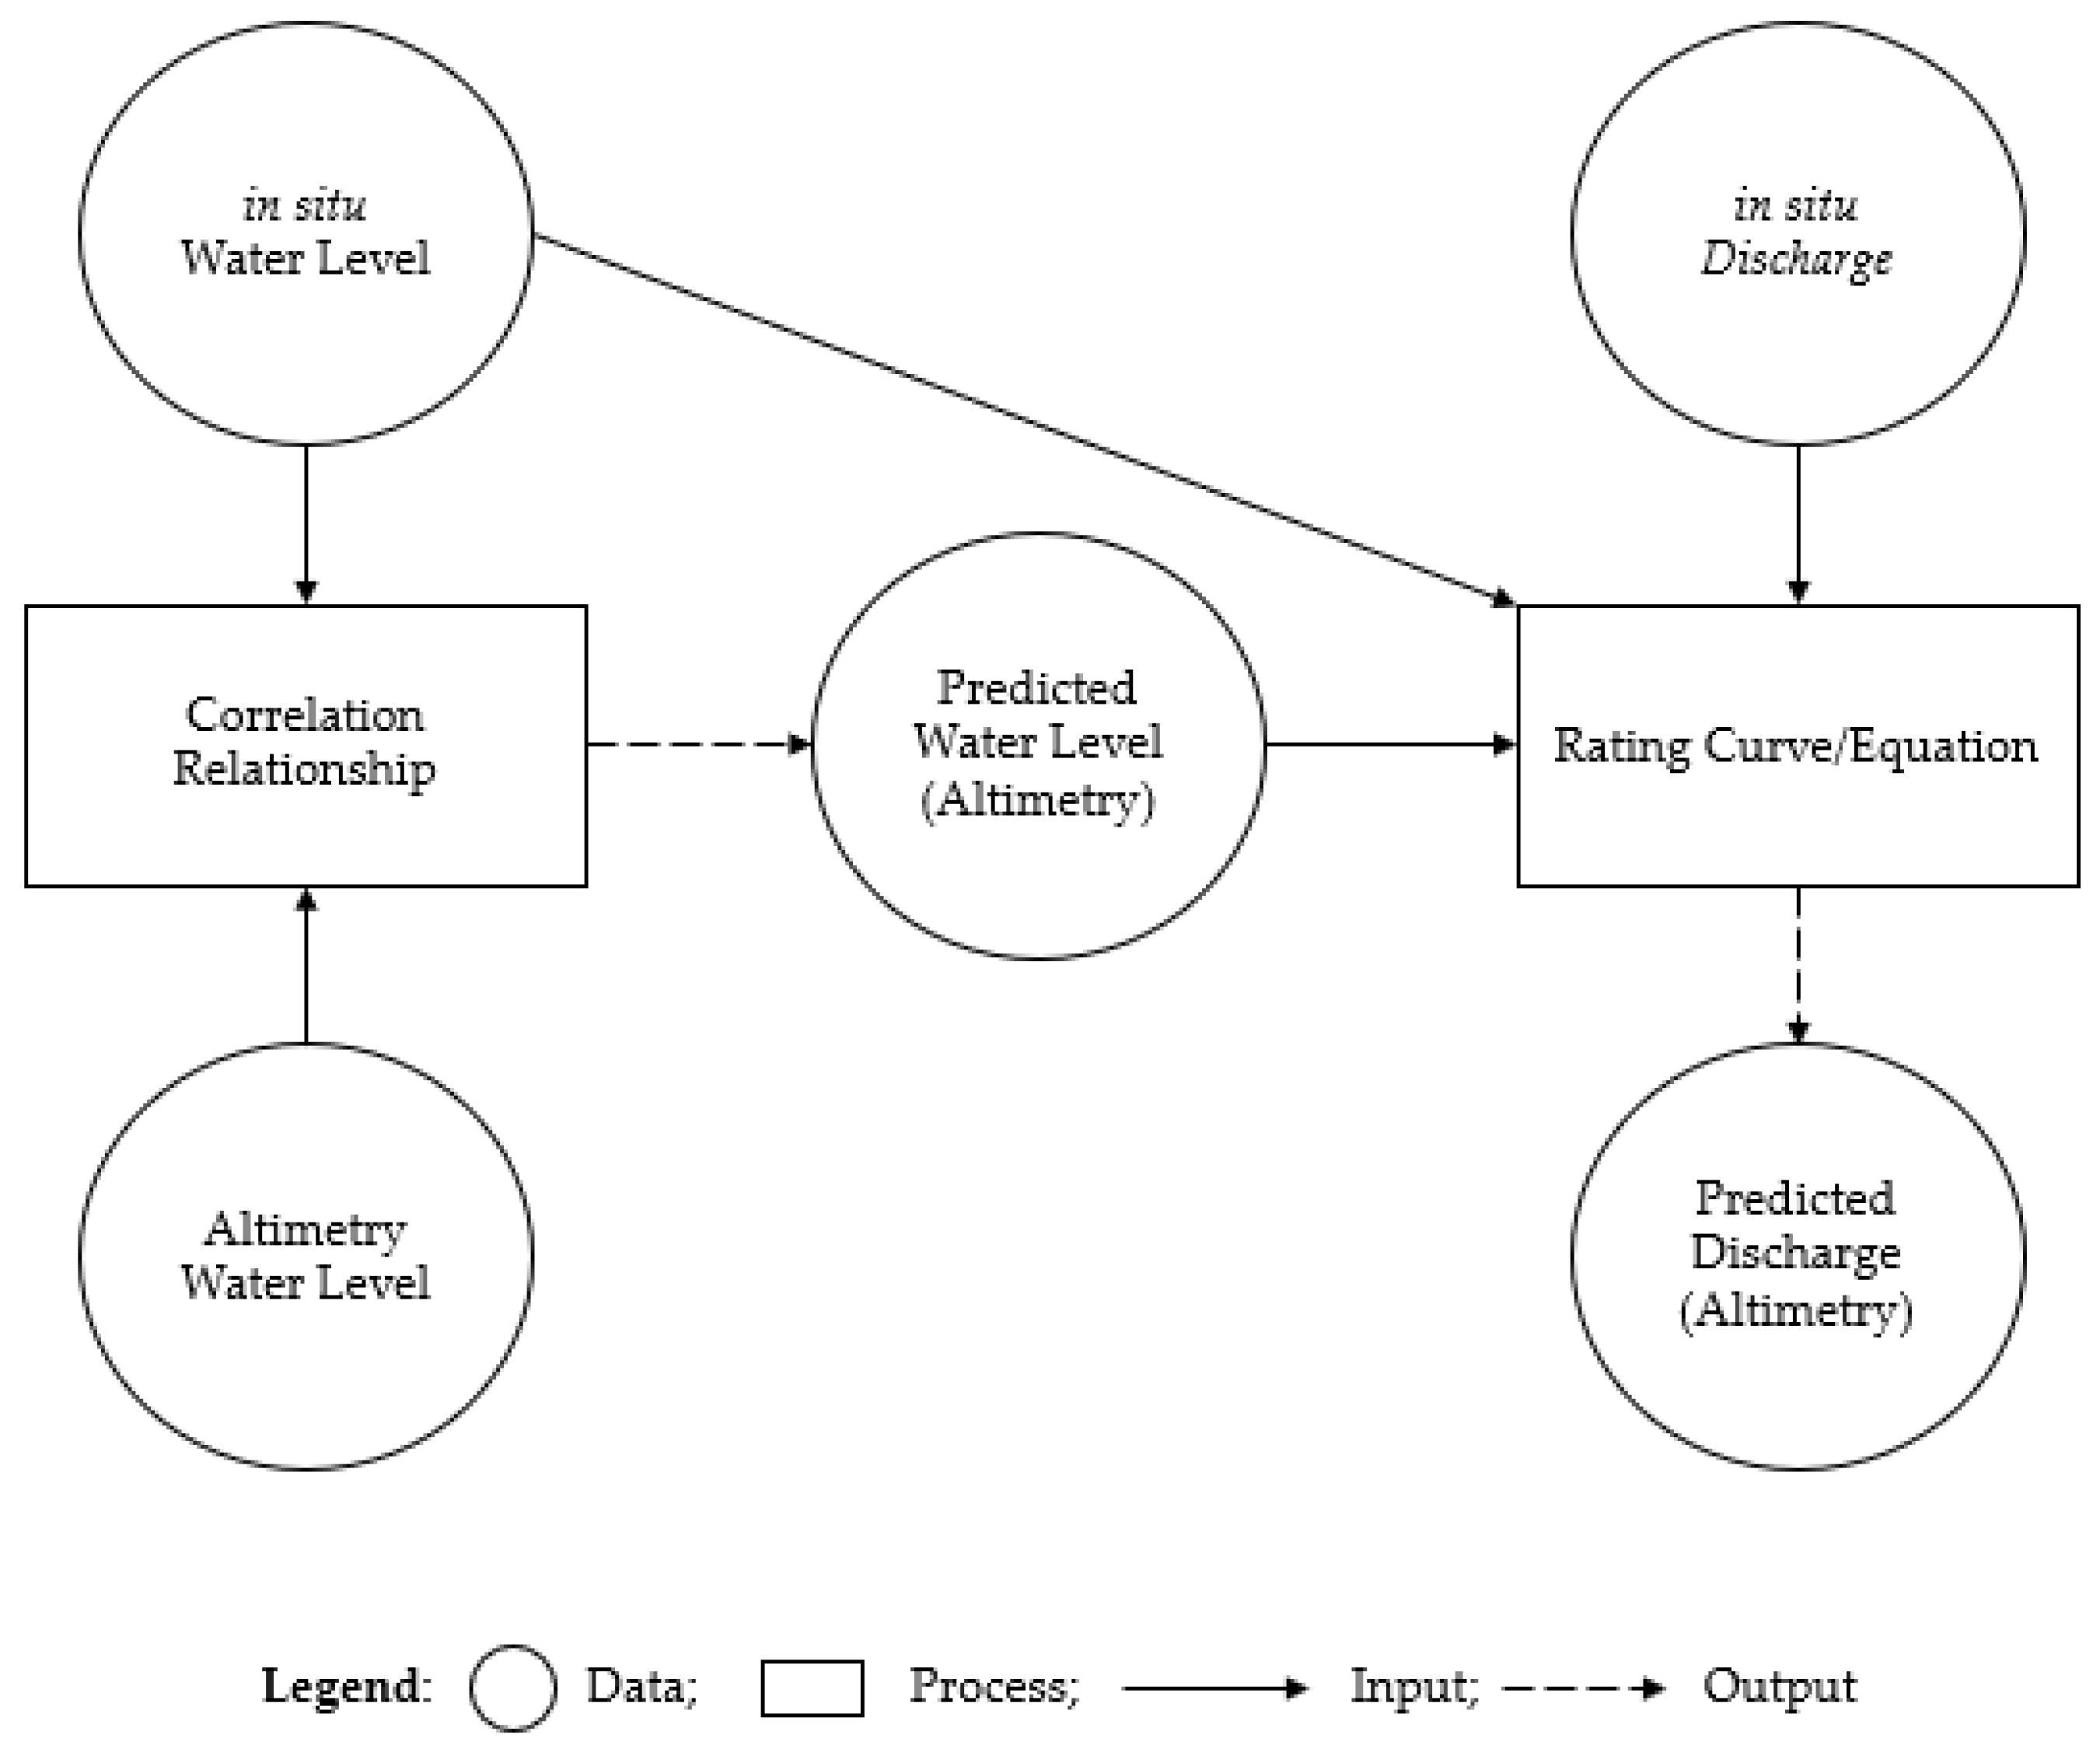
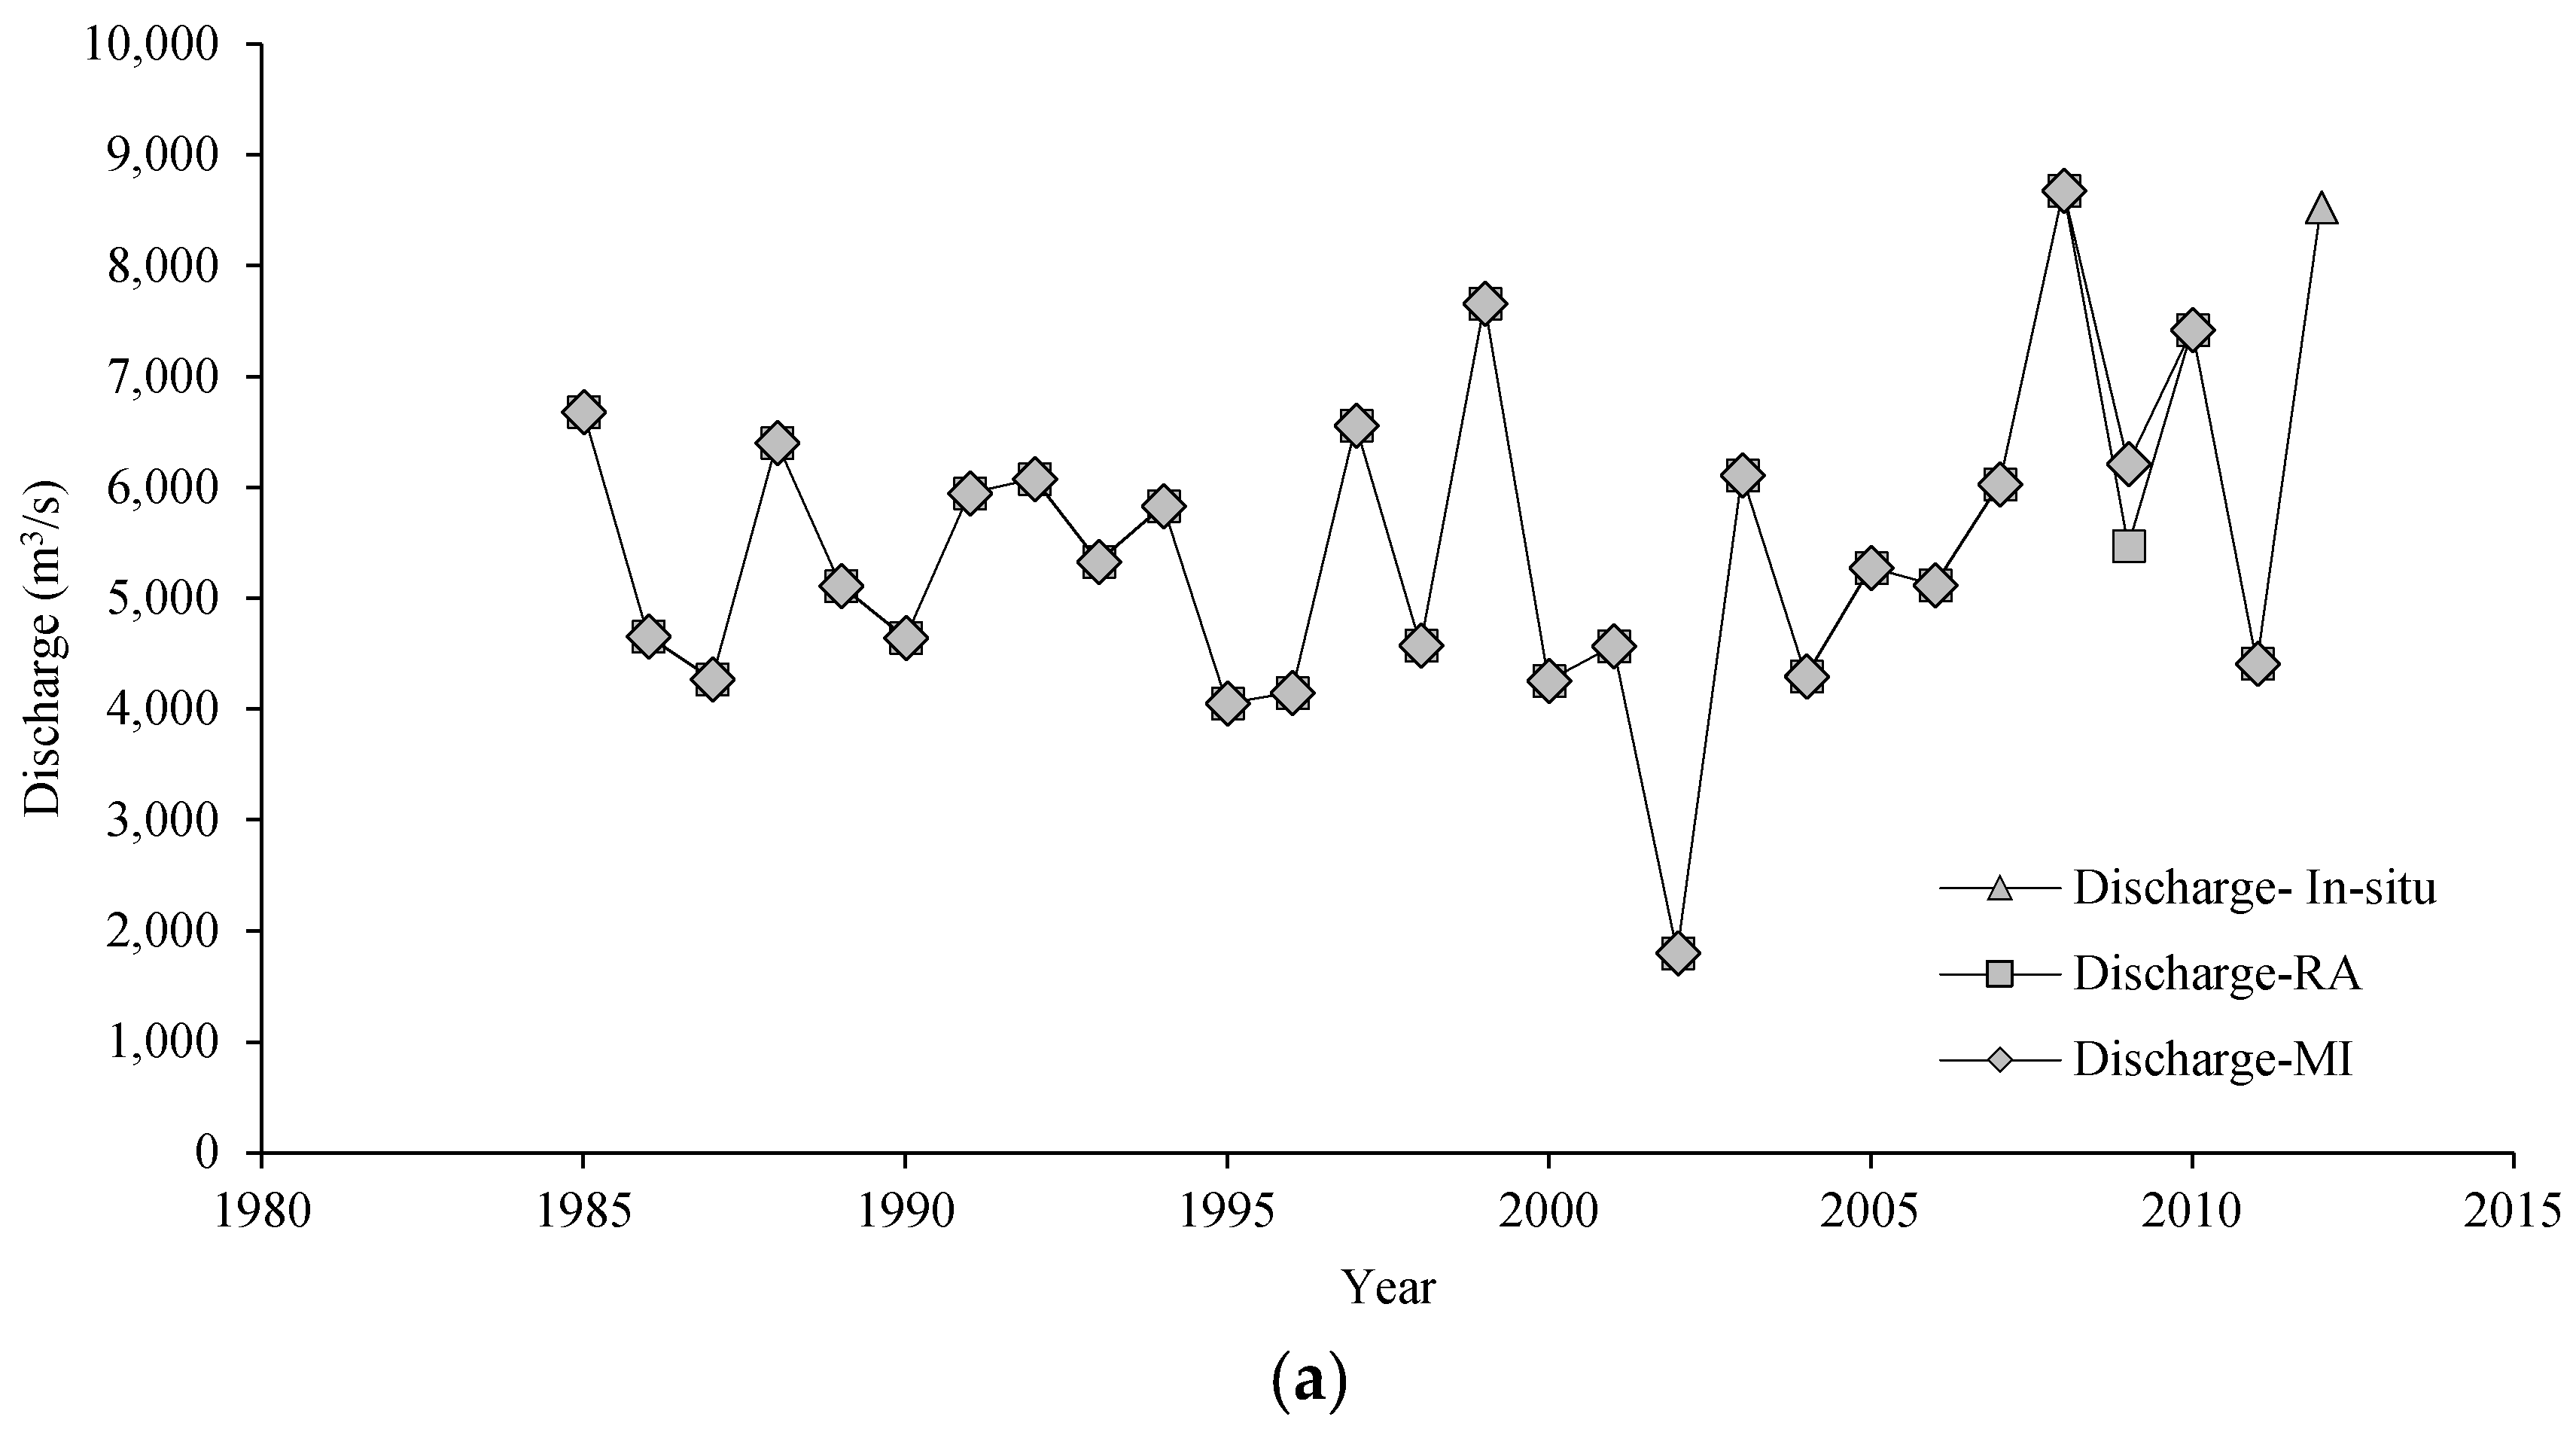
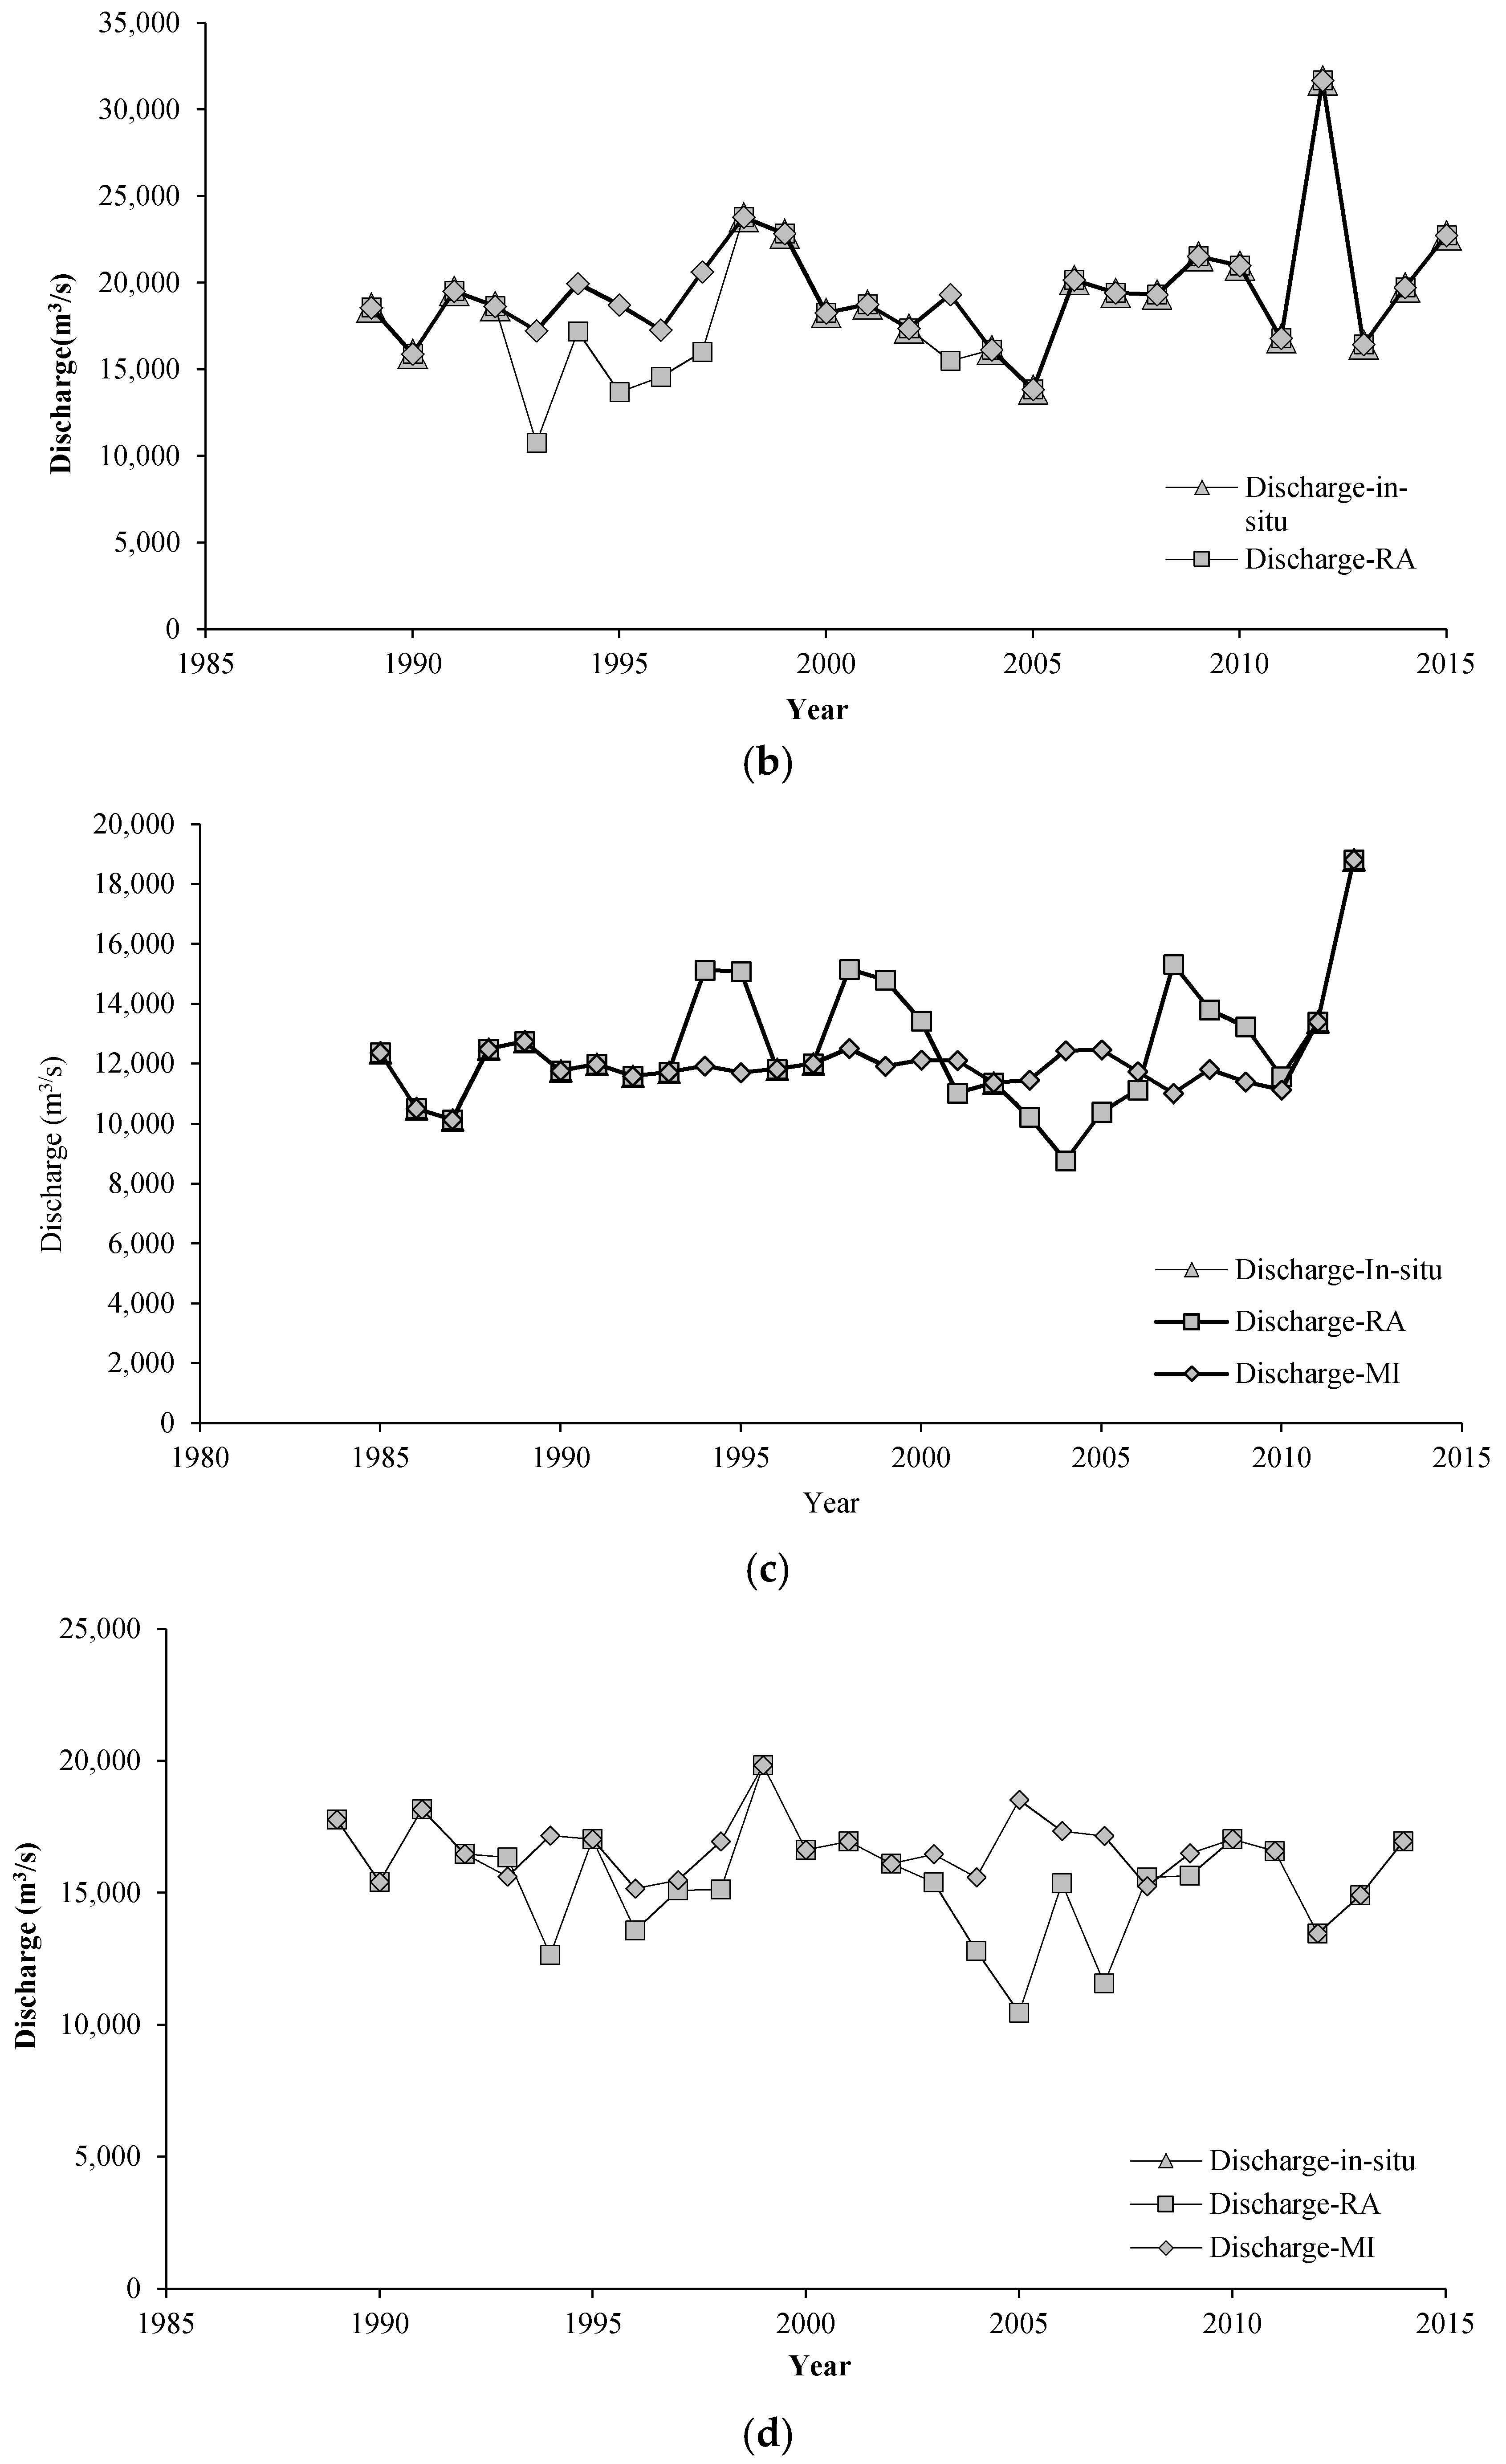
| Station Name | Date Established | River | Lat. (°) | Long. (°) | Area (km2) | Period of Record Used (years) | GBM (m) | River Width (km) | Missing Annual Peak Discharge Data | Data Source |
|---|---|---|---|---|---|---|---|---|---|---|
| Baro | 1915 | Niger | 8.6066 | 6.4170 | 730,000 | 1985–2012 | 57.22 | 0.64 | 12 | NIHSA |
| Lokoja | 1915 | Niger | 7.8167 | 6.7333 | 752,000 | 1989–2015 | 45.77 | 1.65 | 6 | NIHSA |
| Umaisha | 1980 | Benue | 8.0000 | 7.2333 | 335,000 | 1985–2012 | 18.87 | 0.61 | 19 | NIHSA |
| Onitsha | 1955 | Niger | 6.1667 | 6.7500 | 1,100,000 | 1989–2014 | 24.14 | 1.03 | 16 | NIWA |
| Taoussa | 1954 | Niger | 16.9500 | −0.5800 | 340,000 | 1985–2015 | N/A | 0.47 | 0 | NBA |
| S/N | Mission | Ground Footprint (m) | Return Period (Days) | Operation Timeline | Vertical Accuracy (m) | References |
|---|---|---|---|---|---|---|
| 1 | T/P | ~600 | 9.9 | 1993–2003 | 0.35 | [55] |
| 2 | Envisat | ~400 | 35 | 2002–2012 | 0.28 | [55] |
| 3 | Jason-1 | ~300 | 10 | 2002–2009 | 1.07 | [56] |
| 4 | Jason-2 | ~300 | 10 | 2008–Till date | 0.28 | [56] |
| Virtual Station Name | Mission | River | Temporal Coverage | Lat. | Long. | Distance from in situ Gauge (km) | River Width (km) | Available Data Points (Alt vs. in situ) | Regression Equation | R2 |
|---|---|---|---|---|---|---|---|---|---|---|
| Env_702_01 | Envisat | Niger | 2002–2010 | 6.6500 | 6.6500 | 115.4 (Lokoja)-DS | 0.49 | 10 | in situ = 0.8807(RA) + 29.821 | 0.876 |
| Env_029_01 | Envisat | Niger | 2002–2010 | 5.9900 | 6.7200 | 23.7 (Onitsha)-DS | 0.89 | 9 | in situ = 1.1004(RA) + 33.829 | 0.95 |
| Env_158_01 | Envisat | Benue | 2002–2010 | 8.0200 | 7.6700 | 54.3 (Umaisha)-US | 1.71 | 15! | in situ = 0.9409 (RA) − 19.621 | 0.947! |
| tp198_4_moy | T/P | Nun | 1993–2002 | 6.0981 | 4.7563 | 234.7 (Onitsha)-DS | 0.47 | 88 | in situ = 2.6861(RA) + 80.029 | 0.659 |
| j2_020_1 | Jason-2 | Benue | 2002–2011 | 8.0082 | 7.7540 | 62.9 (Umaisha)-US | 2.37 | 15 | in situ = 0.9409 (RA) − 19.621 | 0.947 |
| j2_211_3 | Jason-2 | Niger | 2002–2011 | 8.3675 | 6.5570 | 33.8 (Baro)-US | 0.72 | 20 | in situ = 0.9248(RA) + 3.9594 | 0.937 |
| j2_161_1 | Jason 2 | Niger | 2002–2015 | 17.0107 | −1.5247 | 112.5 (Taoussa)-US | 0.57 | 14 | in situ = 0.9226(RA) − 180.48 | 0.924 |
| Station | Mean | Homo. (p-Value) | Trend (p-Value [+/−]) | Outlier LO-UO (p-Value) | One-Unit Lag Correlation | |||||
|---|---|---|---|---|---|---|---|---|---|---|
| MI | RA | MI | RA | MI | RA | MI | RA | MI | RA | |
| Baro | 5414 | 5283 | 0.568 | 0.567 | 0.680 (+) | 0.967 (+) | 1806–8680 (0.149) | 1806–8680 (0.664) | −0.044 | −0.021 |
| Lokoja | 18,912 | 17,806 | 0.663 | 0.142 | 0.433 (+) | 0.228 (+) | 13,846–23,798 (0.415) | 10,753–23,798 (0.364) | 0.26 | 0.291 |
| Umaisha | 11,838 | 12,416 | 0.887 | 0.525 | 0.869 (−) | 0.680 (+) | 8775–15,319 (0.209) | 10,138–13,408 (0.893) | 0.05 | 0.519 |
| Onitsha | 16,742 | 15,457 | 0.963 | 0.29 | 0.917 (−) | 0.403 (−) | 15,162–19,820 (0.063) | 10,451–19,830 (0.286) | −0.103 | 0.119 |
| Taoussa 1 | 1759 | 1698 | 0.208 | 0.284 | 0.256 (−) | 0.132 (−) | 1542–1984 (0.208) | 1287–1984 (0.352) | 0.060 | −0.113 |
| Taoussa 2 | 1774 | 1653 | 0.129 | 0.052 | 0.791 (+) | 0.170 (−) | 1537–1985 (0.980) | 1044–1985 (0.054) | −0.072 | 0.191 |
| Return Period (One-in-Year) | Expected Quantile (m3/s) | Lower Uncertainty Limit (m3/s) | Upper Uncertainty Limit (m3/s) | ||||||
|---|---|---|---|---|---|---|---|---|---|
| RA | MI | in situ | RA | MI | in situ | RA | MI | in situ | |
| 2 | 5485 | 5525 | 5482 | 4965 | 5004 | 4947 | 6031 | 6076 | 6044 |
| 5 | 6886 | 6930 | 6909 | 6318 | 6369 | 6326 | 7556 | 7601 | 7604 |
| 20 | 8222 | 8255 | 8267 | 7537 | 7584 | 7557 | 9421 | 9411 | 9492 |
| 50 | 8858 | 8876 | 8910 | 8055 | 8082 | 8082 | 10,547 | 10,564 | 10,729 |
| 100 | 9250 | 9257 | 9306 | 8335 | 8350 | 8366 | 11,383 | 11,422 | 11,603 |
| Return Period (One-in-Year) | Expected Quantile (m3/s) | Lower Uncertainty Limit (m3/s) | Upper Uncertainty Limit (m3/s) | ||||||
|---|---|---|---|---|---|---|---|---|---|
| RA | MI | in situ | RA | MI | in situ | RA | MI | in situ | |
| 2 | 18,126 | 19,011 | 19,133 | 16,821 | 18,041 | 17,877 | 19,543 | 20,082 | 20,567 |
| 5 | 22,059 | 22,111 | 22,739 | 20,329 | 20,715 | 20,880 | 24,320 | 23,962 | 25,591 |
| 20 | 26,876 | 26,309 | 27,829 | 24,164 | 23,879 | 24,433 | 31,761 | 30,722 | 35,669 |
| 50 | 29,770 | 29,075 | 31,316 | 26,190 | 25,696 | 26,450 | 37,513 | 36,559 | 45,597 |
| 100 | 31,861 | 31,205 | 34,071 | 27,521 | 26,959 | 27,826 | 42,335 | 41,720 | 55,481 |
| Return Period (One-in-Year) | Expected quantile (m3/s) | Lower Uncertainty Limit (m3/s) | Upper Uncertainty Limit (m3/s) | ||||||
|---|---|---|---|---|---|---|---|---|---|
| RA | MI | in situ | RA | MI | in situ | RA | MI | in situ | |
| 2 | 12,320 | 11,875 | 6943 | 11,652 | 11,551 | 160 | 13,065 | 12,242 | 10,520 |
| 5 | 14,368 | 13,009 | 12,118 | 13,453 | 12,495 | 3778 | 15,604 | 13,730 | 16,583 |
| 20 | 16,953 | 14,706 | 18,083 | 15,449 | 13,723 | 15,796 | 20,003 | 16,507 | 143,517 |
| 50 | 18,550 | 15,932 | 21,471 | 16,488 | 14,491 | 17,324 | 23,786 | 18,965 | 1,421,543 |
| 100 | 19,727 | 16,936 | 23,828 | 17,163 | 15,070 | 18,055 | 26,960 | 21,324 | 7,922,767 |
| Return Period (1-in-Year) | Expected Quantile (m3/s) | Lower Uncertainty Limit (m3/s) | Upper Uncertainty Limit (m3/s) | ||||||
|---|---|---|---|---|---|---|---|---|---|
| RA | MI | in situ | RA | MI | in situ | RA | MI | in situ | |
| 2 | 15,566 | 16,526 | 16,263 | 14,778 | 16,053 | 15,494 | 16,373 | 17,038 | 17,085 |
| 5 | 17,500 | 17,794 | 17,908 | 16,736 | 17,268 | 17,035 | 18,391 | 18,452 | 19,107 |
| 20 | 19,131 | 19,057 | 19,598 | 18,328 | 18,387 | 18,437 | 20,540 | 20,213 | 22,591 |
| 50 | 19,819 | 19,684 | 20,460 | 18,947 | 18,887 | 19,044 | 21,697 | 21,376 | 25,132 |
| 100 | 20,211 | 20,081 | 21,017 | 19,269 | 19,182 | 19,374 | 22,446 | 22,240 | 27,444 |
| Stations | RA vs. MI Mean Discharge Difference-m3/s (p-value) | Mean Difference in Water Level (m) | RA vs. in situ Mean Discharge Difference-m3/s (p-value) | Mean Difference in Water Level (m) | MI vs. in situ Mean Discharge Difference-m3/s (p-value) | Mean Difference in Water Level (m) |
|---|---|---|---|---|---|---|
| Lokoja | 1257.34 (0.743) | 1.78 | 5187.91 (0.269) | 4.22 | 3930.57 (0.419) | 3.56 |
| Umaisha | 1018.14 (0.65) | 4.66 | 1981.86 (0.557) | 5.21 | 3124.97 (0.341) | 5.84 |
| Baro | 9.76 (0.994) | 1.26 | 27.32 (0.978) | 1.28 | 37.08 (0.965) | 1.29 |
| Onitsha | 643.24 (0.496) | 1.85 | 1281.52 (0.236) | 2.68 | 638.28 (0.505) | 1.84 |
| Stations. | RA vs. MI | RA vs. in situ | MI vs. in situ | |||
|---|---|---|---|---|---|---|
| Dks | p-Value | Dks | p-Value | Dks | p-Value | |
| Lokoja | 0.09 | 1.00 | 0.24 | 0.60 | 0.19 | 0.85 |
| Umaisha | 0.15 | 0.98 | 0.35 | 0.17 | 0.30 | 0.34 |
| Baro | 0.09 | 1.00 | 0.05 | 1.00 | 0.09 | 1.00 |
| Onitsha | 0.19 | 0.85 | 0.38 | 0.09 | 0.38 | 0.09 |
| Return Period (One-in-Year) | Discharge Complete | Discharge (Consecutive) MI | Discharge (Consecutive) RA | Discharge (Inconsecutive) MI | Discharge (Inconsecutive) RA | Lower Limit (Complete) | Upper Limit (Complete) |
|---|---|---|---|---|---|---|---|
| 2 | 1787.79 | 1760.15 | 1709.32 | 1779.18 | 1669.77 | 1734.88 | 1842.2 |
| 5 | 1898.39 | 1874.26 | 1861.13 | 1887.62 | 1835.12 | 1850.91 | 1954.0 |
| 20 | 1983.25 | 1978.07 | 1984.19 | 1976.08 | 1986.4 | 1938.07 | 2087.7 |
| 50 | 2015.89 | 2025.17 | 2034.14 | 2012.2 | 2055.43 | 1967.17 | 2170.6 |
| 100 | 2033.39 | 2053.36 | 2061.89 | 2032.35 | 2096.89 | 1978.96 | 2229.2 |
| Data Gap Infilling Comparison | Permutation Test | Kolmogorov–Simonov Test | ||
|---|---|---|---|---|
| Mean Discharge Difference-m3/s (p-Value) | Mean Difference in Water Level (m) | K–S Statistic (Dks) | pks-Value | |
| Complete vs. Consecutive (MI) | 21.12 (0.731) | 2.14 | 0.38 | 0.095 |
| Complete vs. Consecutive (RA) | 12.21 (0.881) | 2.12 | 0.43 | 0.041 |
| Complete vs. Inconsecutive (MI) | 2.15 (0.968) | 2.11 | 0.24 | 0.603 |
| Complete vs. Inconsecutive (RA) | 15.09 (0.841) | 2.13 | 0.48 | 0.016 |
| Gauging Station | Return Period (One-in-Year) | Expected Quantile (m3/s) | Lower Uncertainty Limit (m3/s) | Upper Uncertainty Limit (m3/s) | 2012 Flood Magnitude (m3/s) |
|---|---|---|---|---|---|
| Baro | 50 | 8858.22 | 8055.02 | 10,547.10 | 8533.00 |
| Lokoja | 50 | 29,770.27 | 26,190.00 | 37,513.20 | 31,692.00 |
| Umaisha | 100 | 19,727.03 | 17,163.37 | 26,960.00 | 18,816.00 |
© 2018 by the authors. Licensee MDPI, Basel, Switzerland. This article is an open access article distributed under the terms and conditions of the Creative Commons Attribution (CC BY) license (http://creativecommons.org/licenses/by/4.0/).
Share and Cite
Ekeu-wei, I.T.; Blackburn, G.A.; Pedruco, P. Infilling Missing Data in Hydrology: Solutions Using Satellite Radar Altimetry and Multiple Imputation for Data-Sparse Regions. Water 2018, 10, 1483. https://doi.org/10.3390/w10101483
Ekeu-wei IT, Blackburn GA, Pedruco P. Infilling Missing Data in Hydrology: Solutions Using Satellite Radar Altimetry and Multiple Imputation for Data-Sparse Regions. Water. 2018; 10(10):1483. https://doi.org/10.3390/w10101483
Chicago/Turabian StyleEkeu-wei, Iguniwari Thomas, George Alan Blackburn, and Philip Pedruco. 2018. "Infilling Missing Data in Hydrology: Solutions Using Satellite Radar Altimetry and Multiple Imputation for Data-Sparse Regions" Water 10, no. 10: 1483. https://doi.org/10.3390/w10101483
APA StyleEkeu-wei, I. T., Blackburn, G. A., & Pedruco, P. (2018). Infilling Missing Data in Hydrology: Solutions Using Satellite Radar Altimetry and Multiple Imputation for Data-Sparse Regions. Water, 10(10), 1483. https://doi.org/10.3390/w10101483


