Monitoring Temporal Change of River Islands in the Yangtze River by Remotely Sensed Data

Abstract
1. Introduction
2. Data
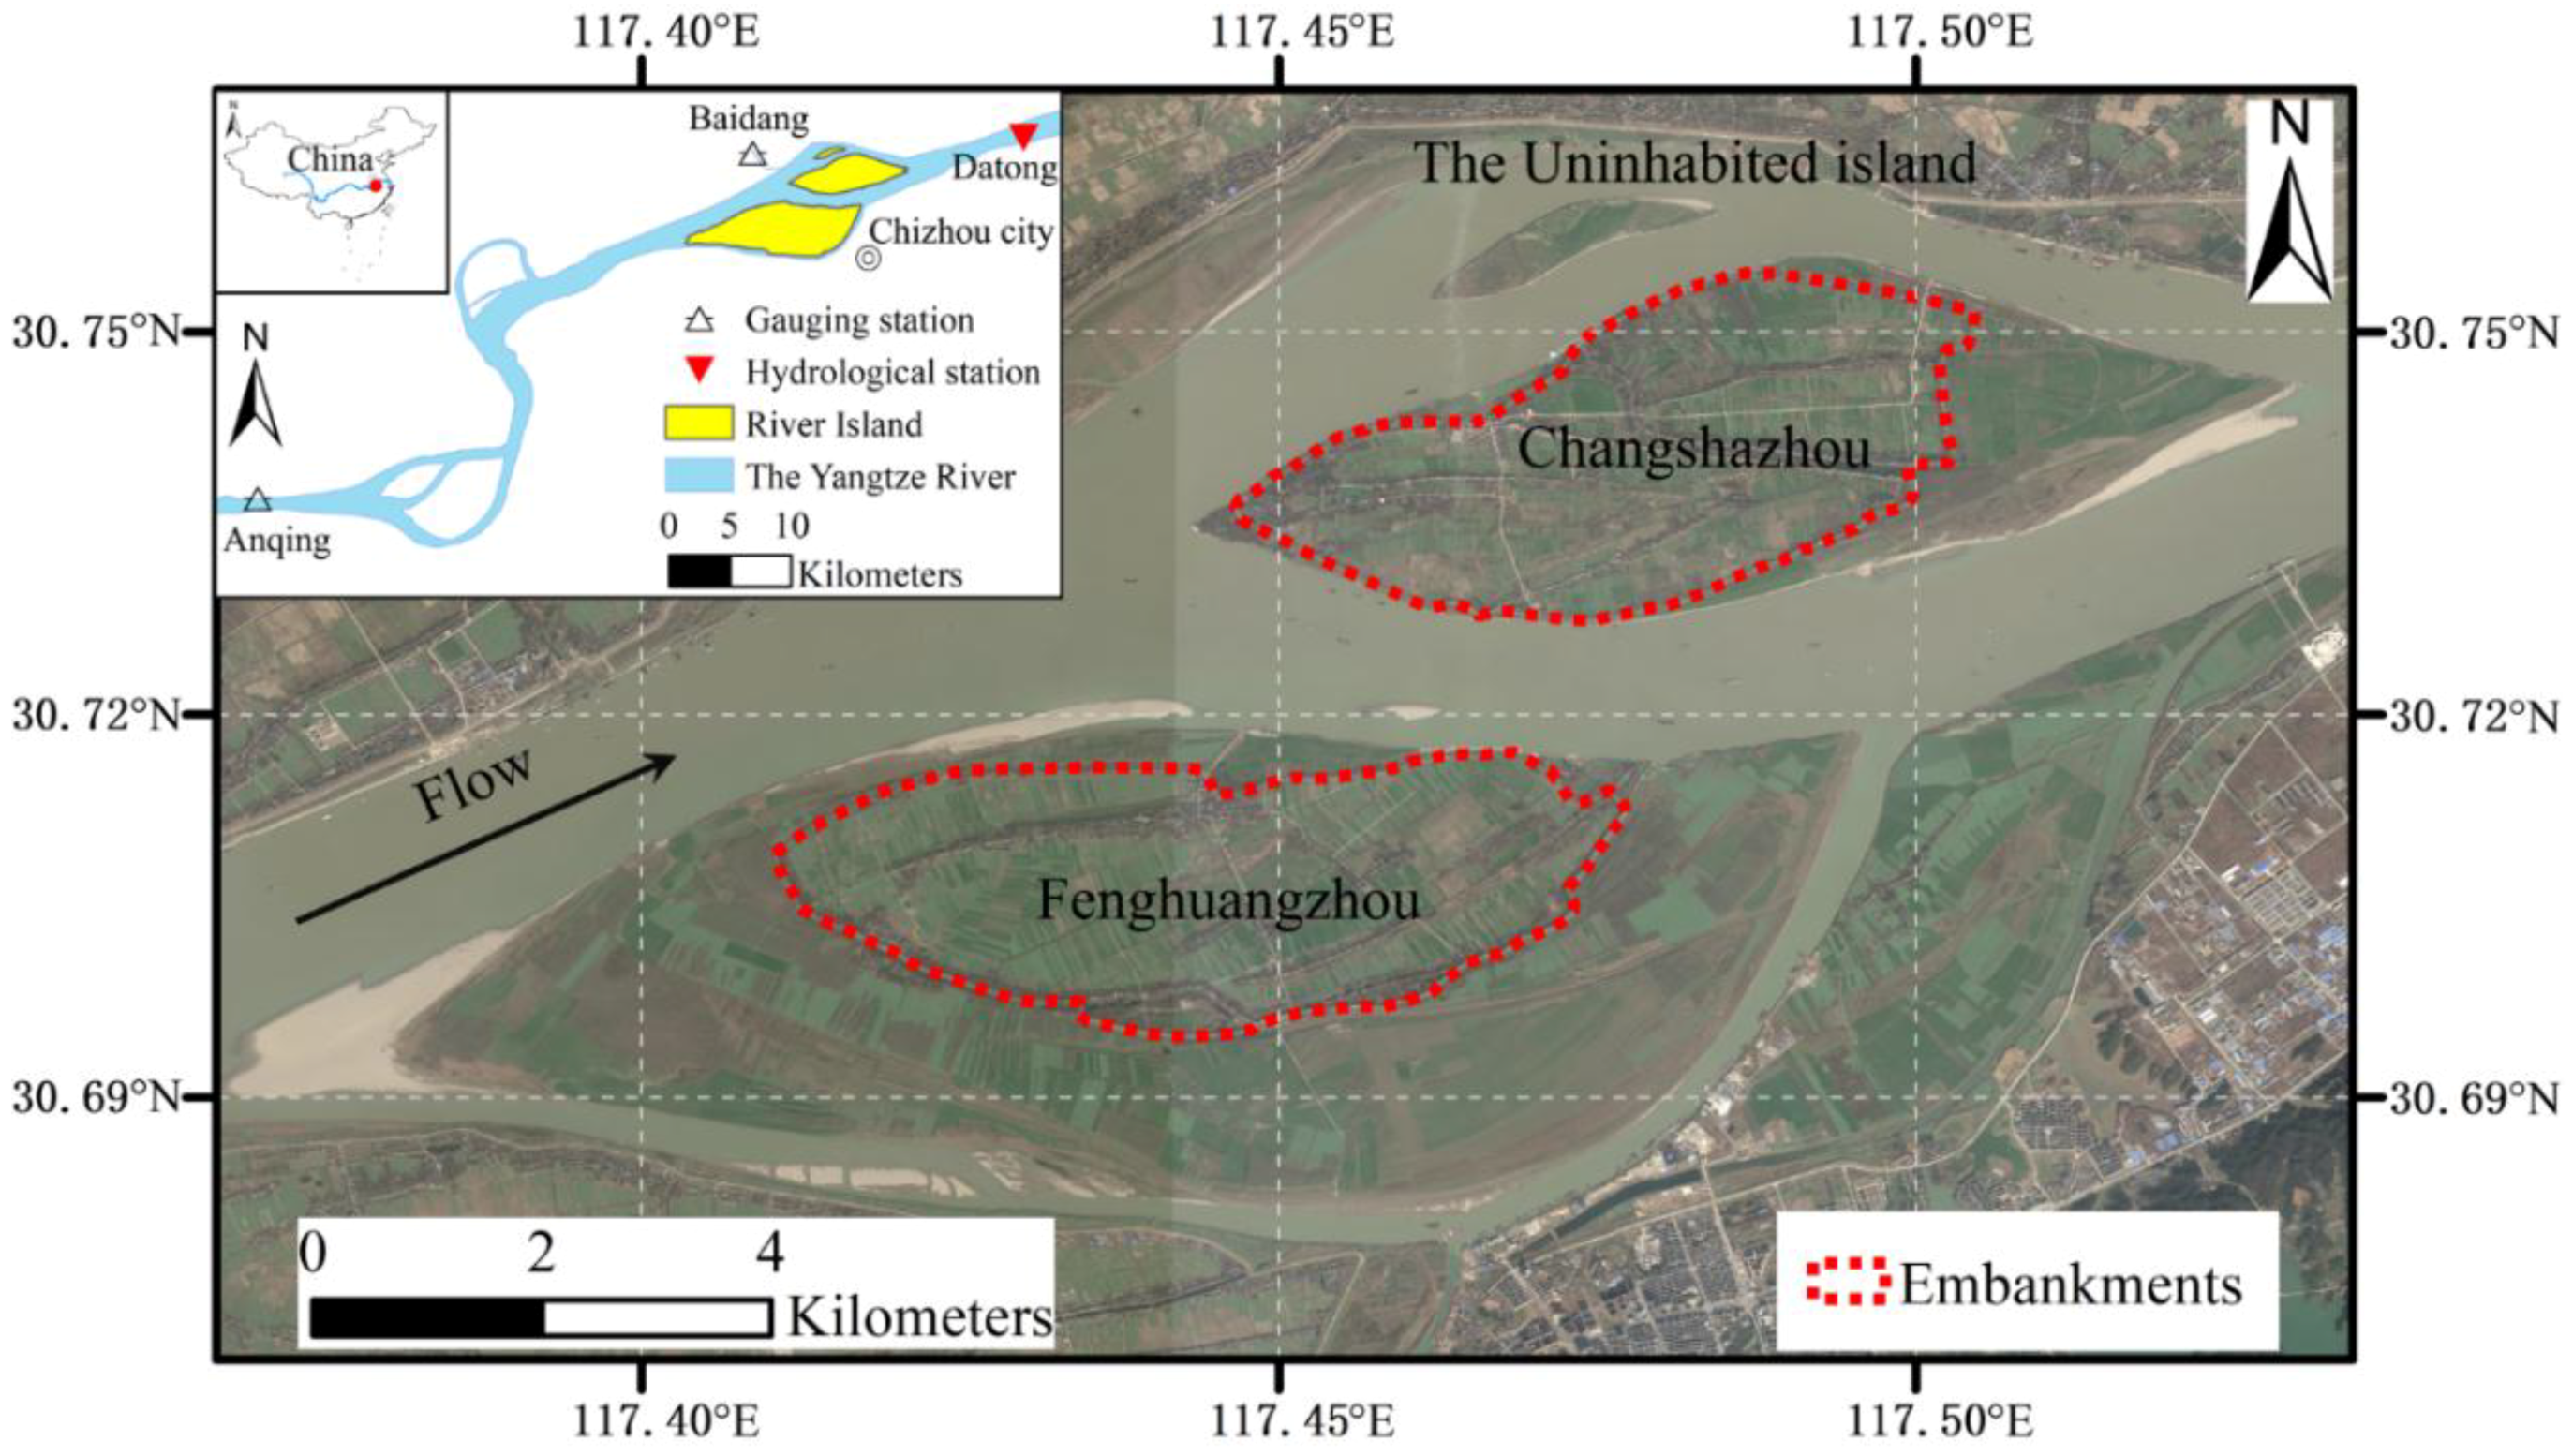
2.1. Study Area
2.2. Remotely Sensed Data
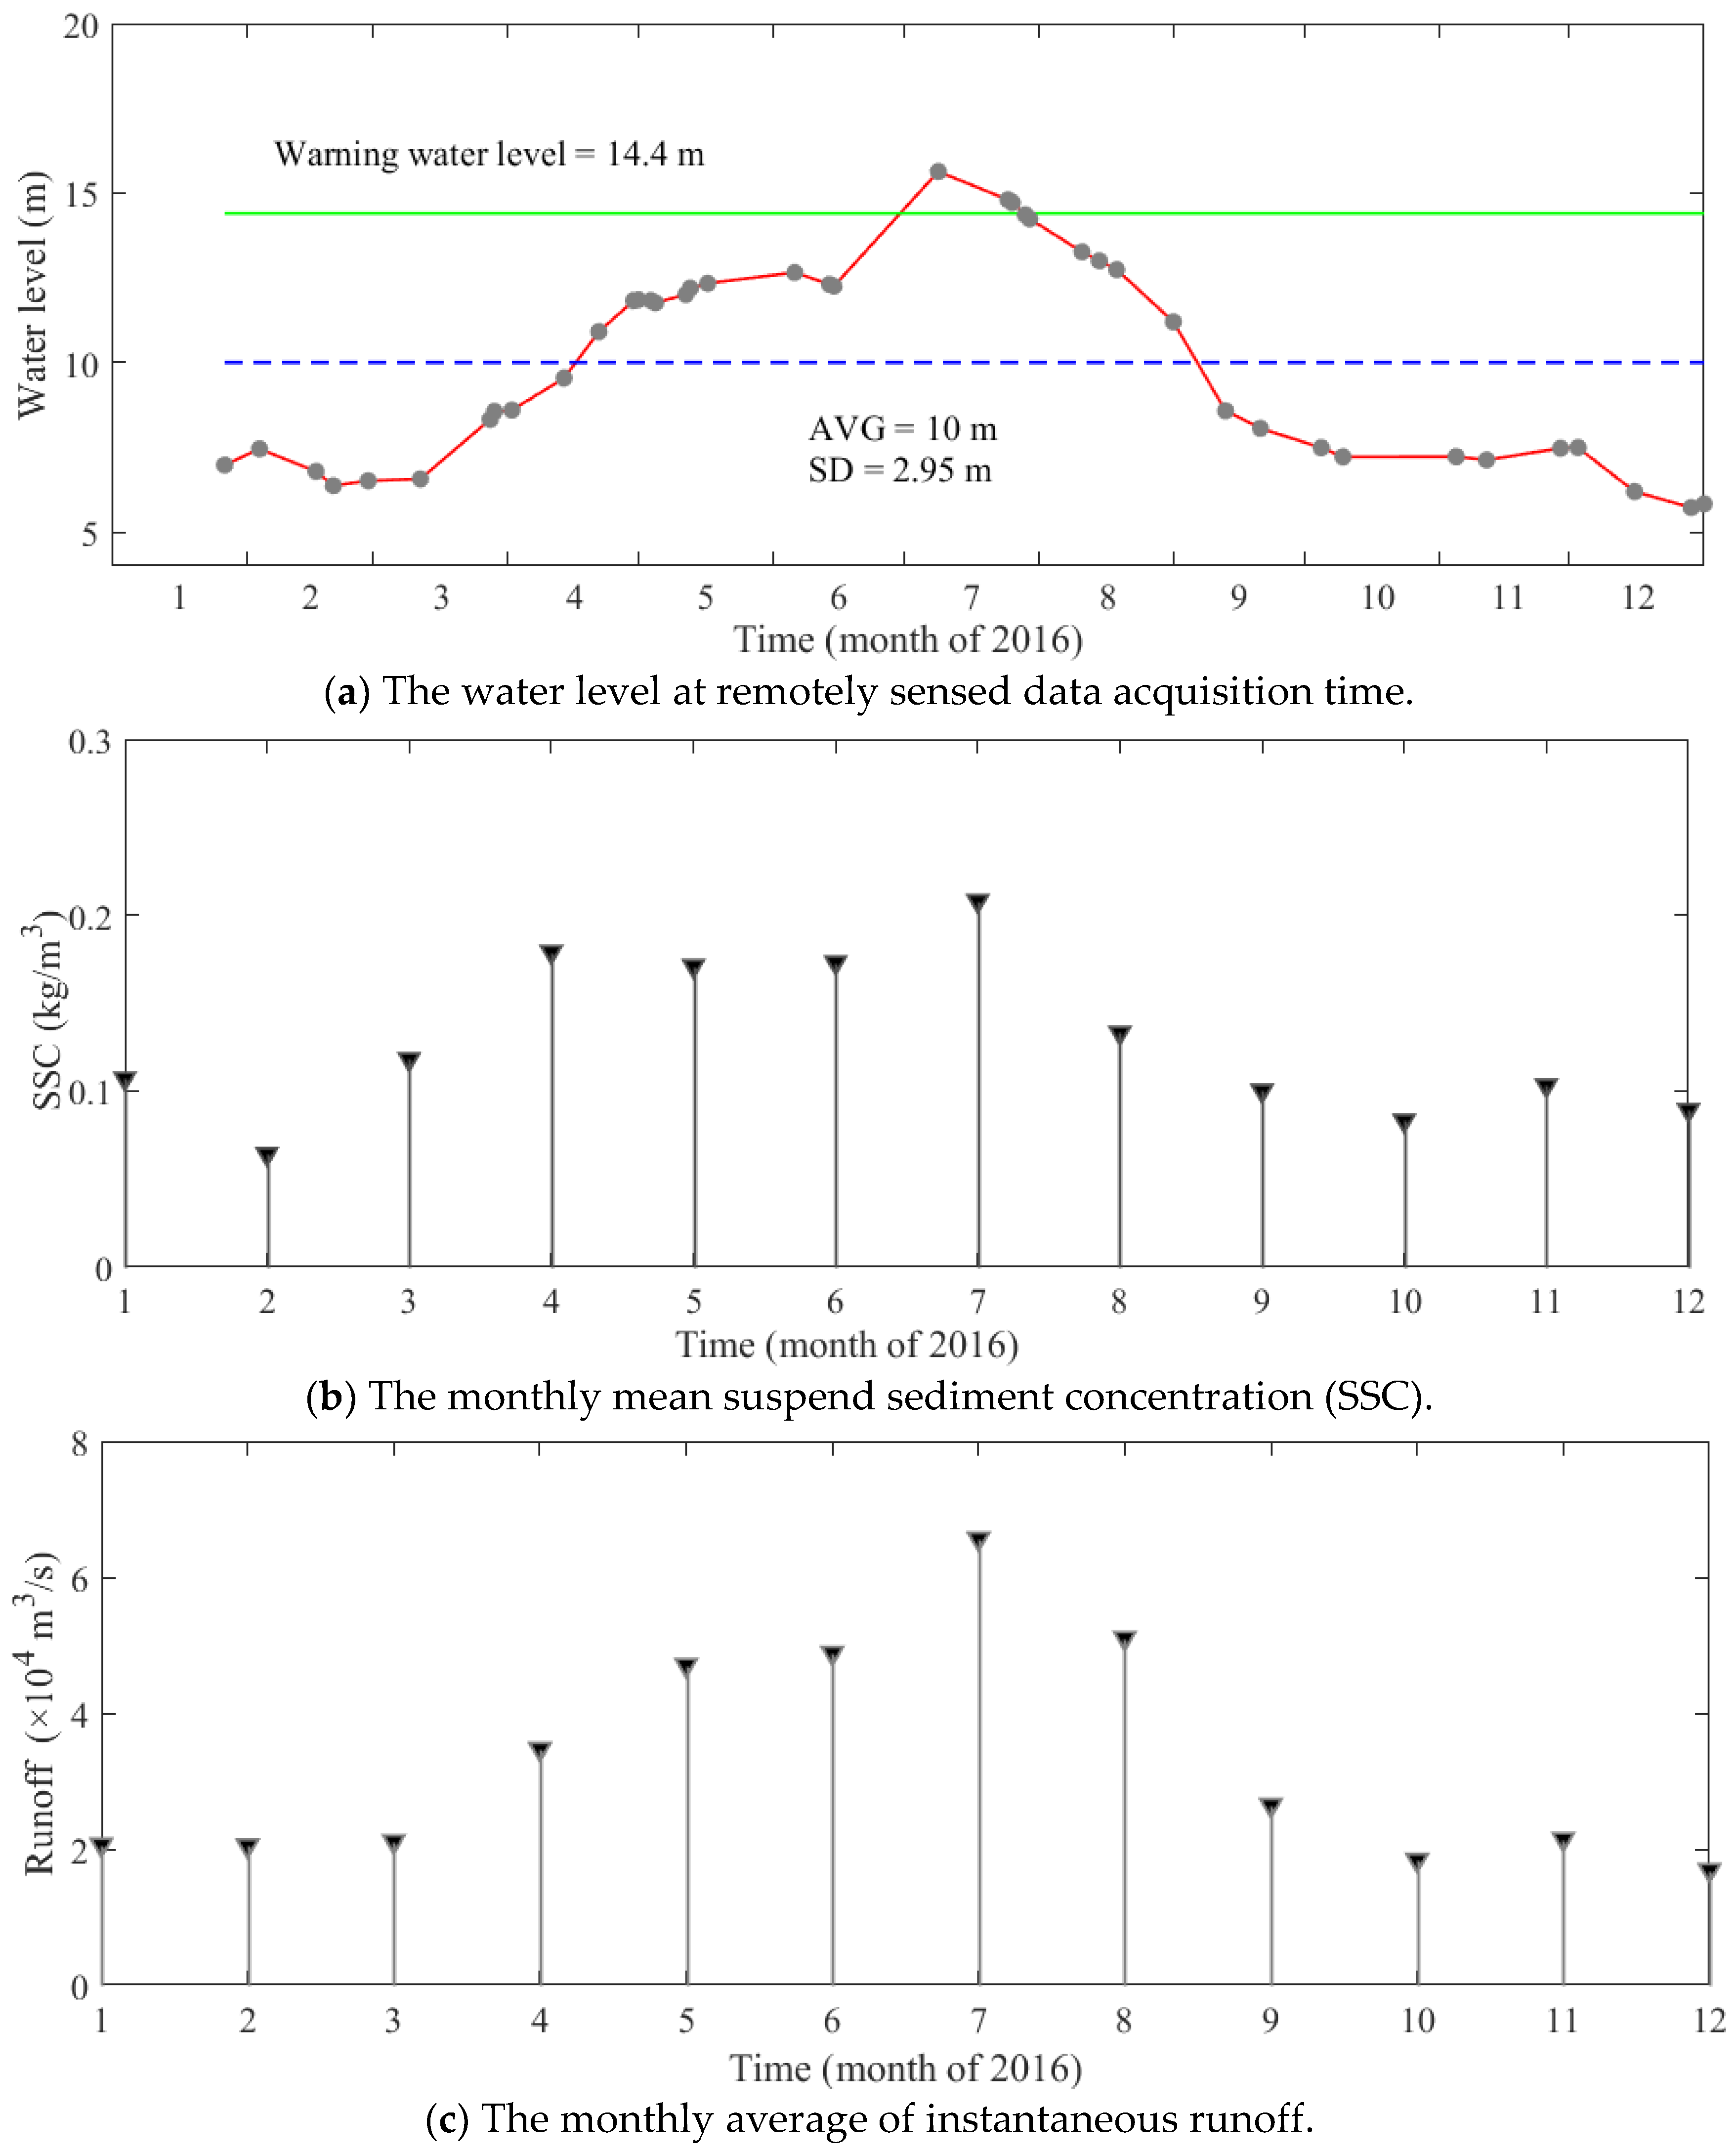
2.3. Hydrological Data
3. Methods
3.1. Image Processing
3.2. Water Extraction
3.3. Estimation Risk in the River Island
3.4. Evaluation of Mapping Accuracy
4. Results and Discussion
4.1. Accuracy Evaluation
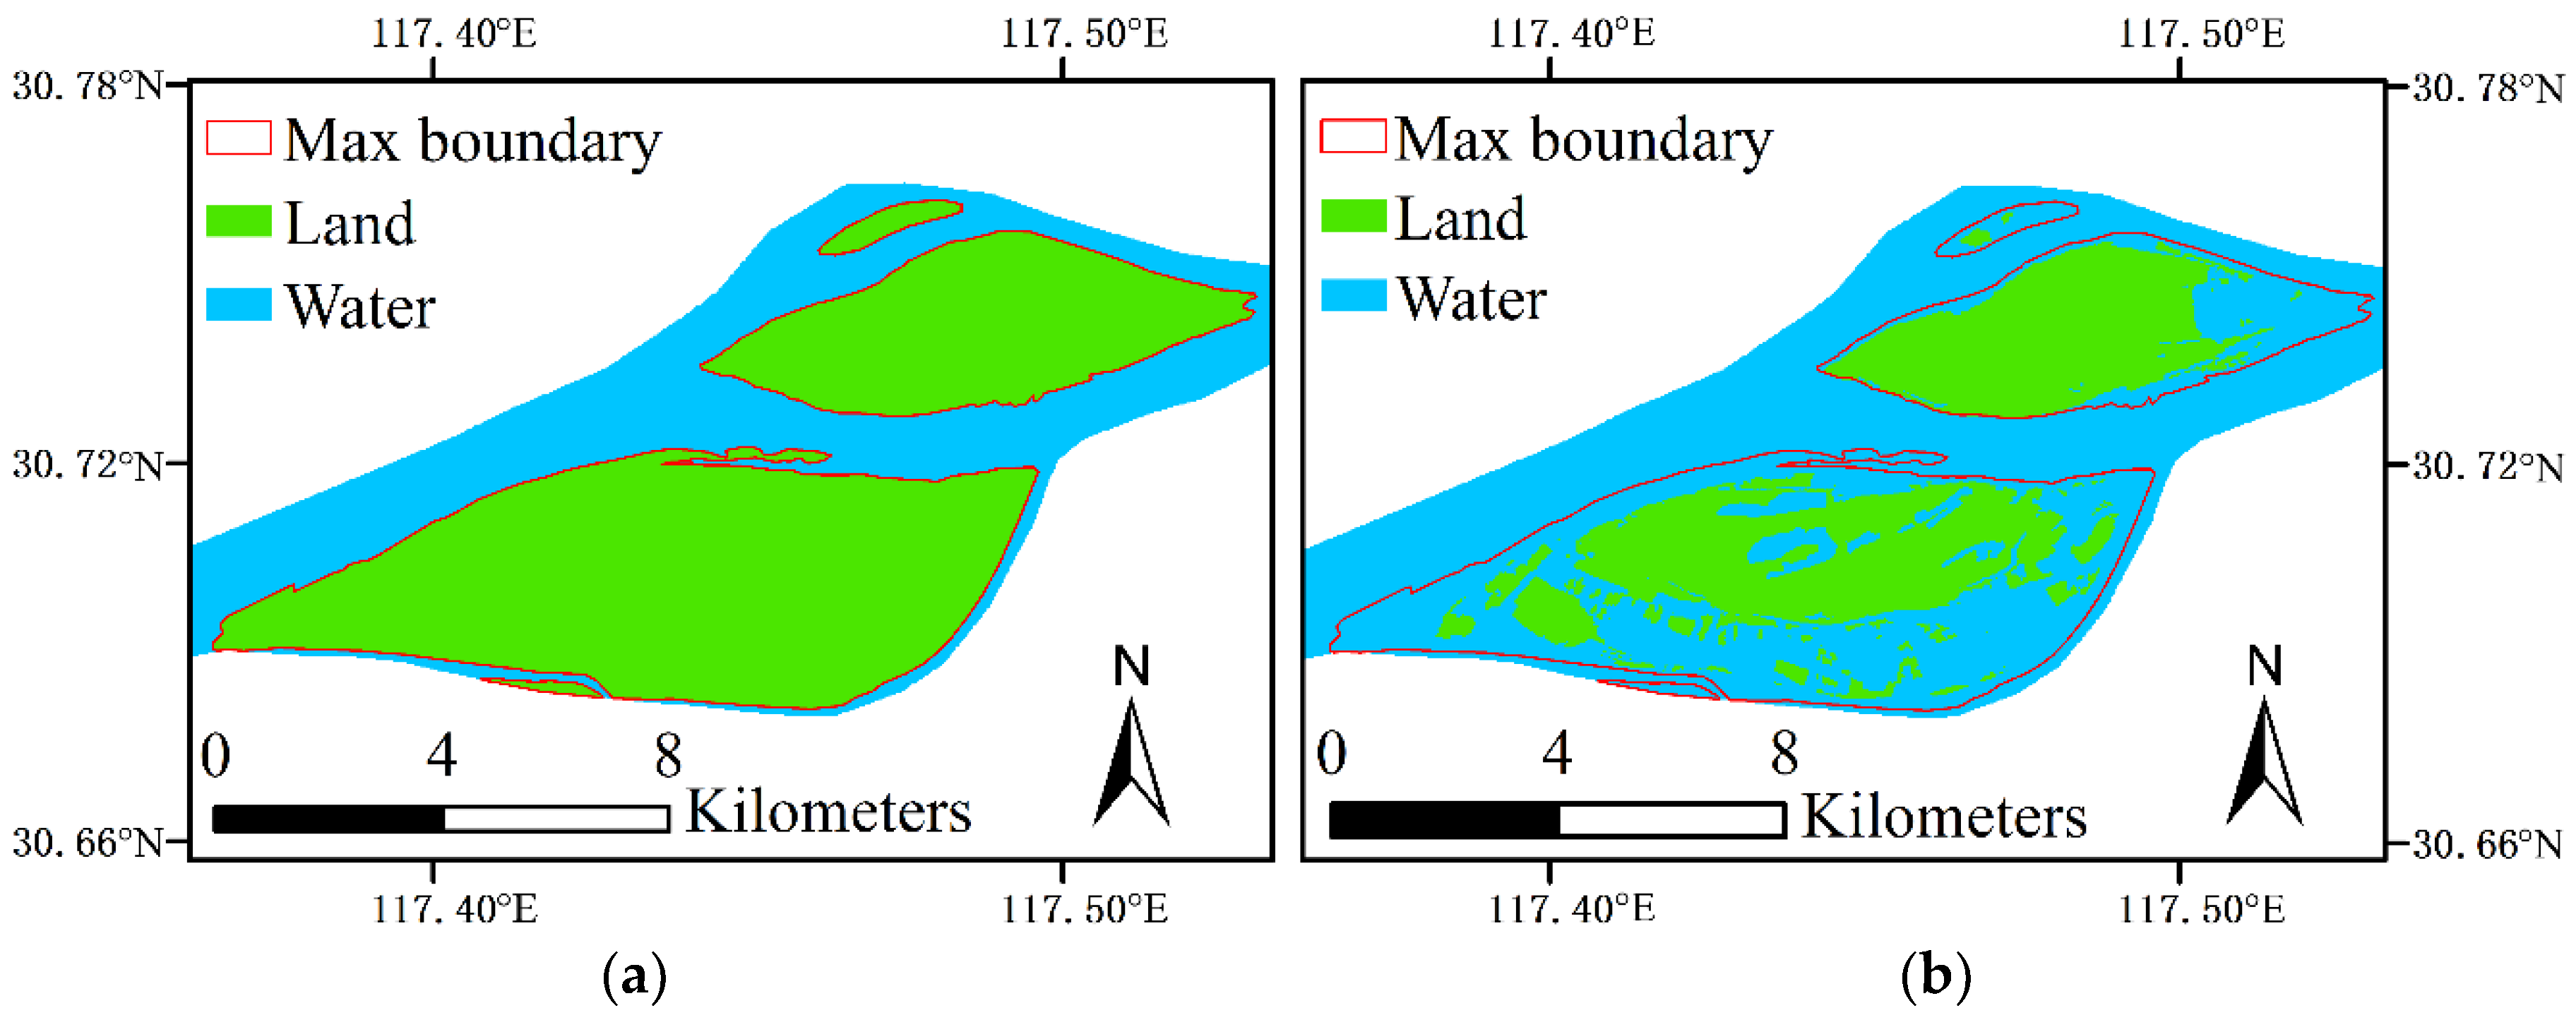
4.2. Temporal Change of River Island Area and Water Level
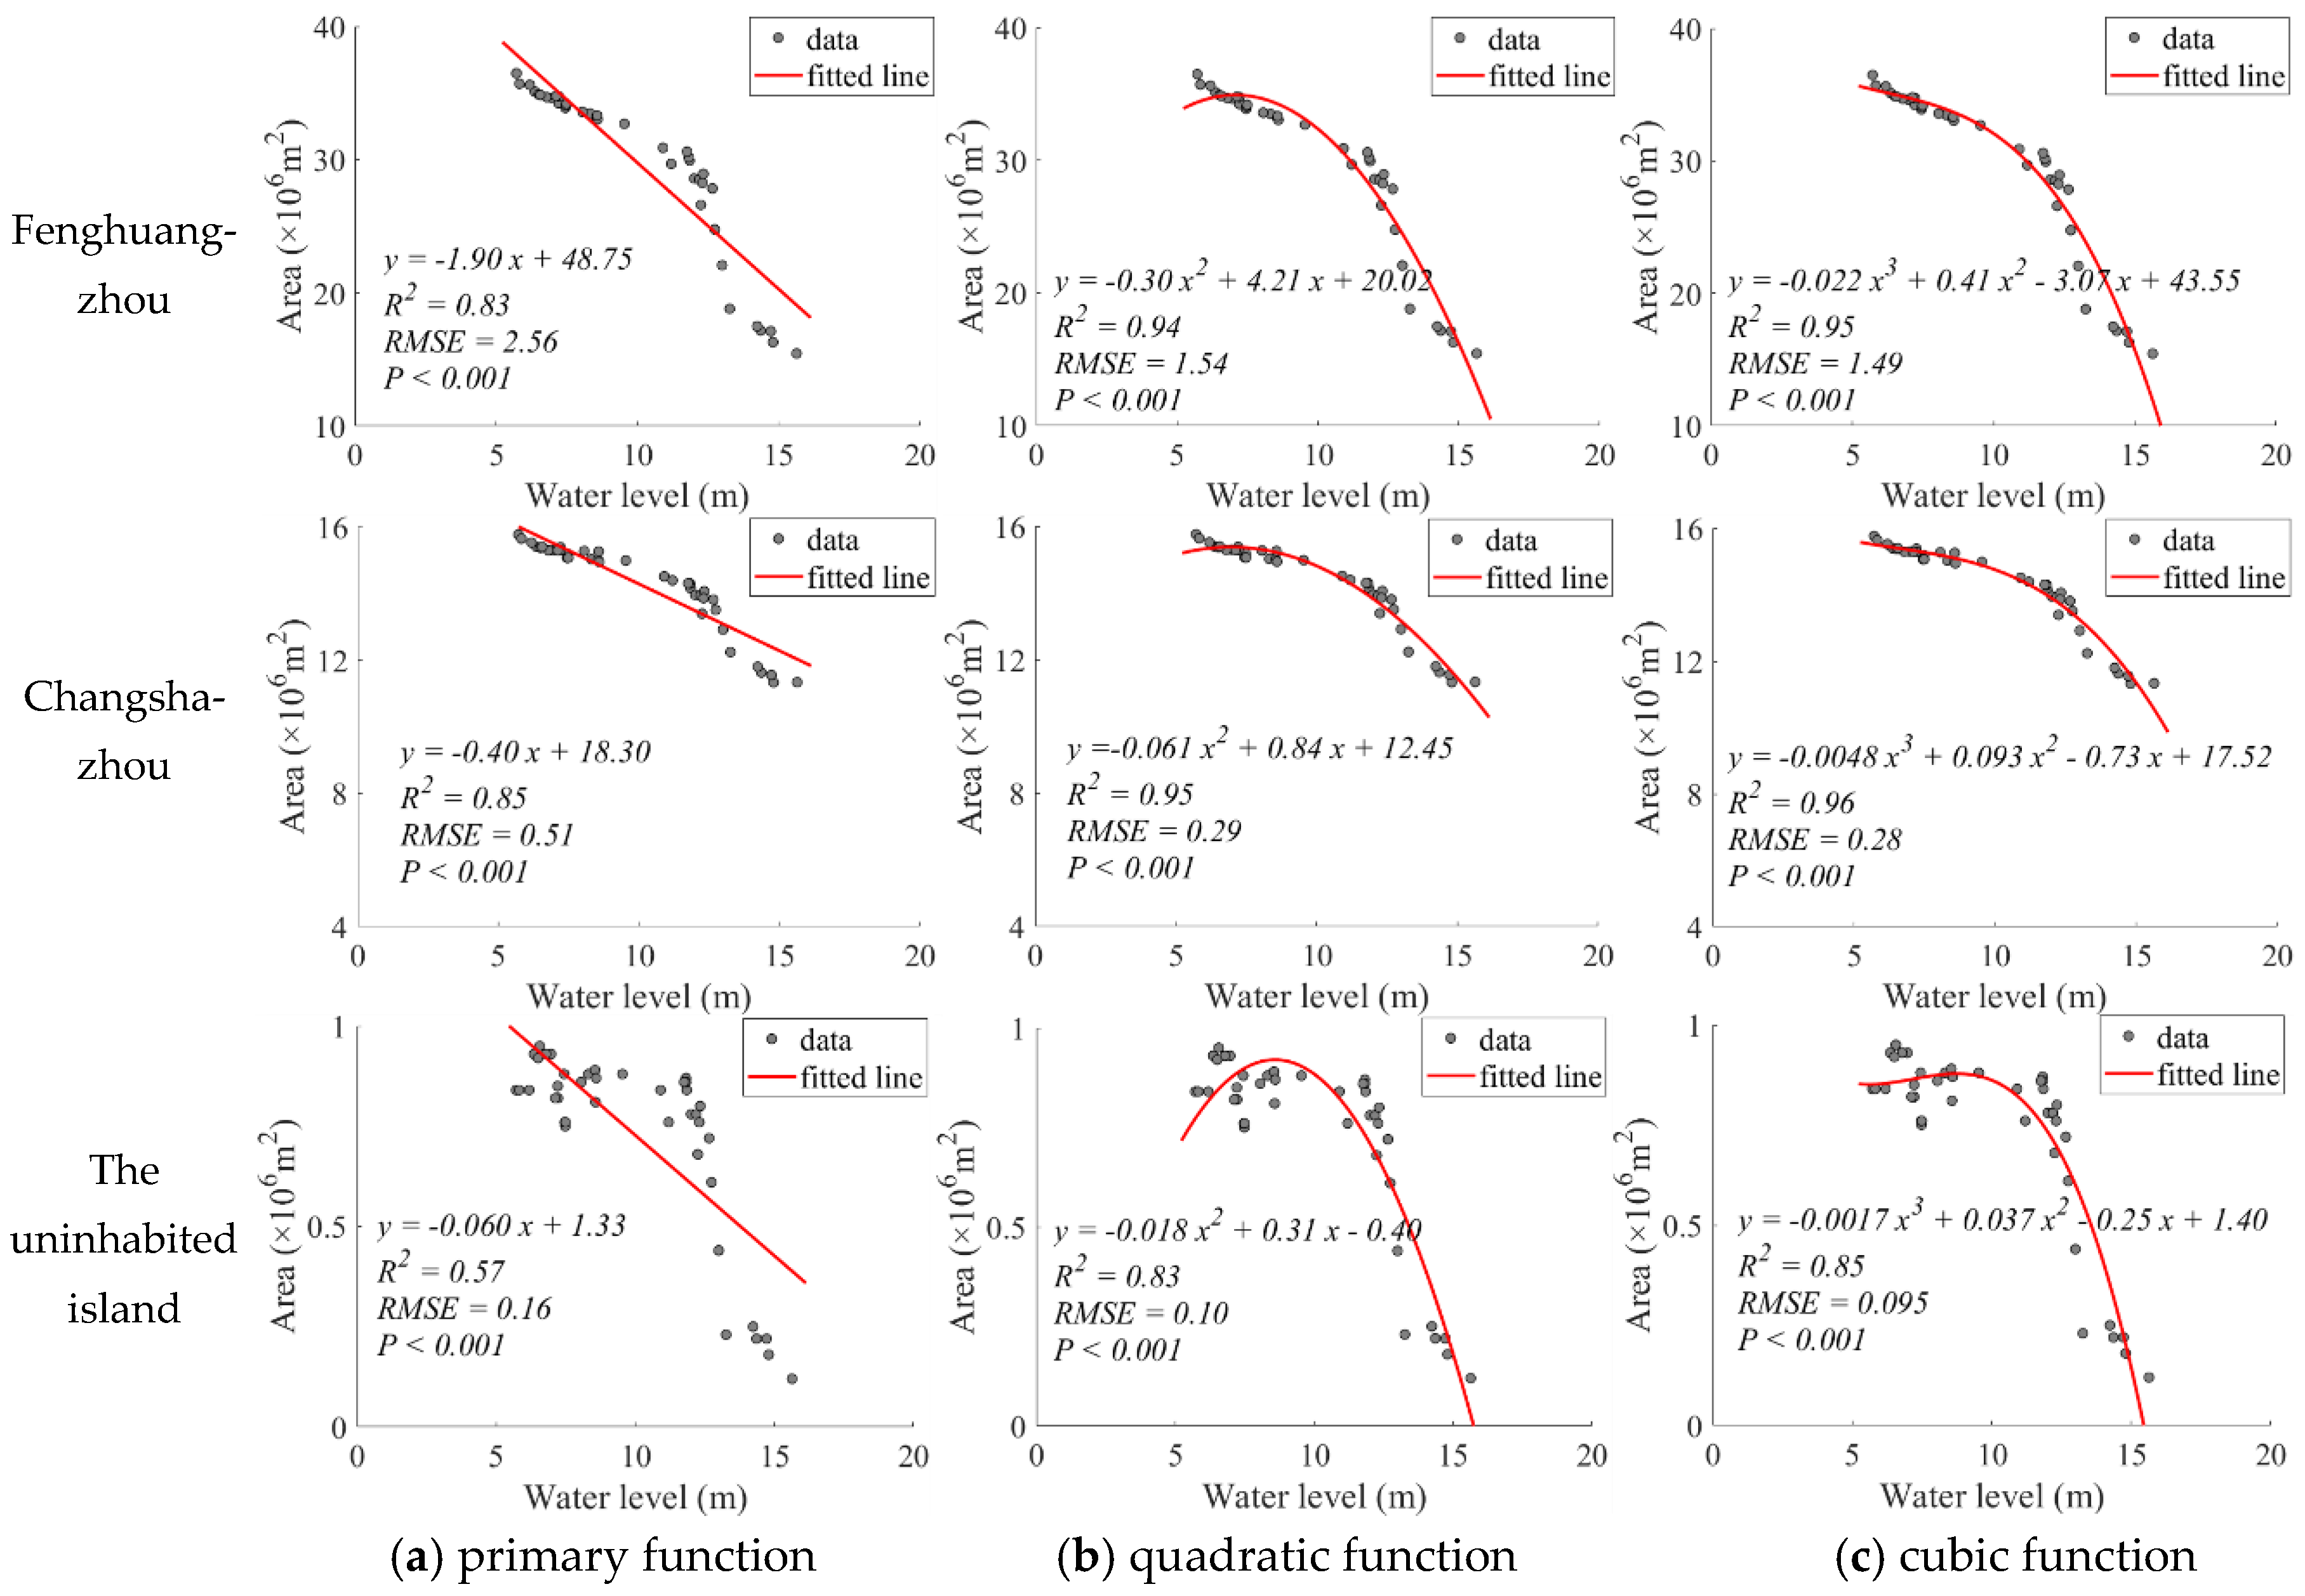
4.3. Relationship between River Island Area and Water Level
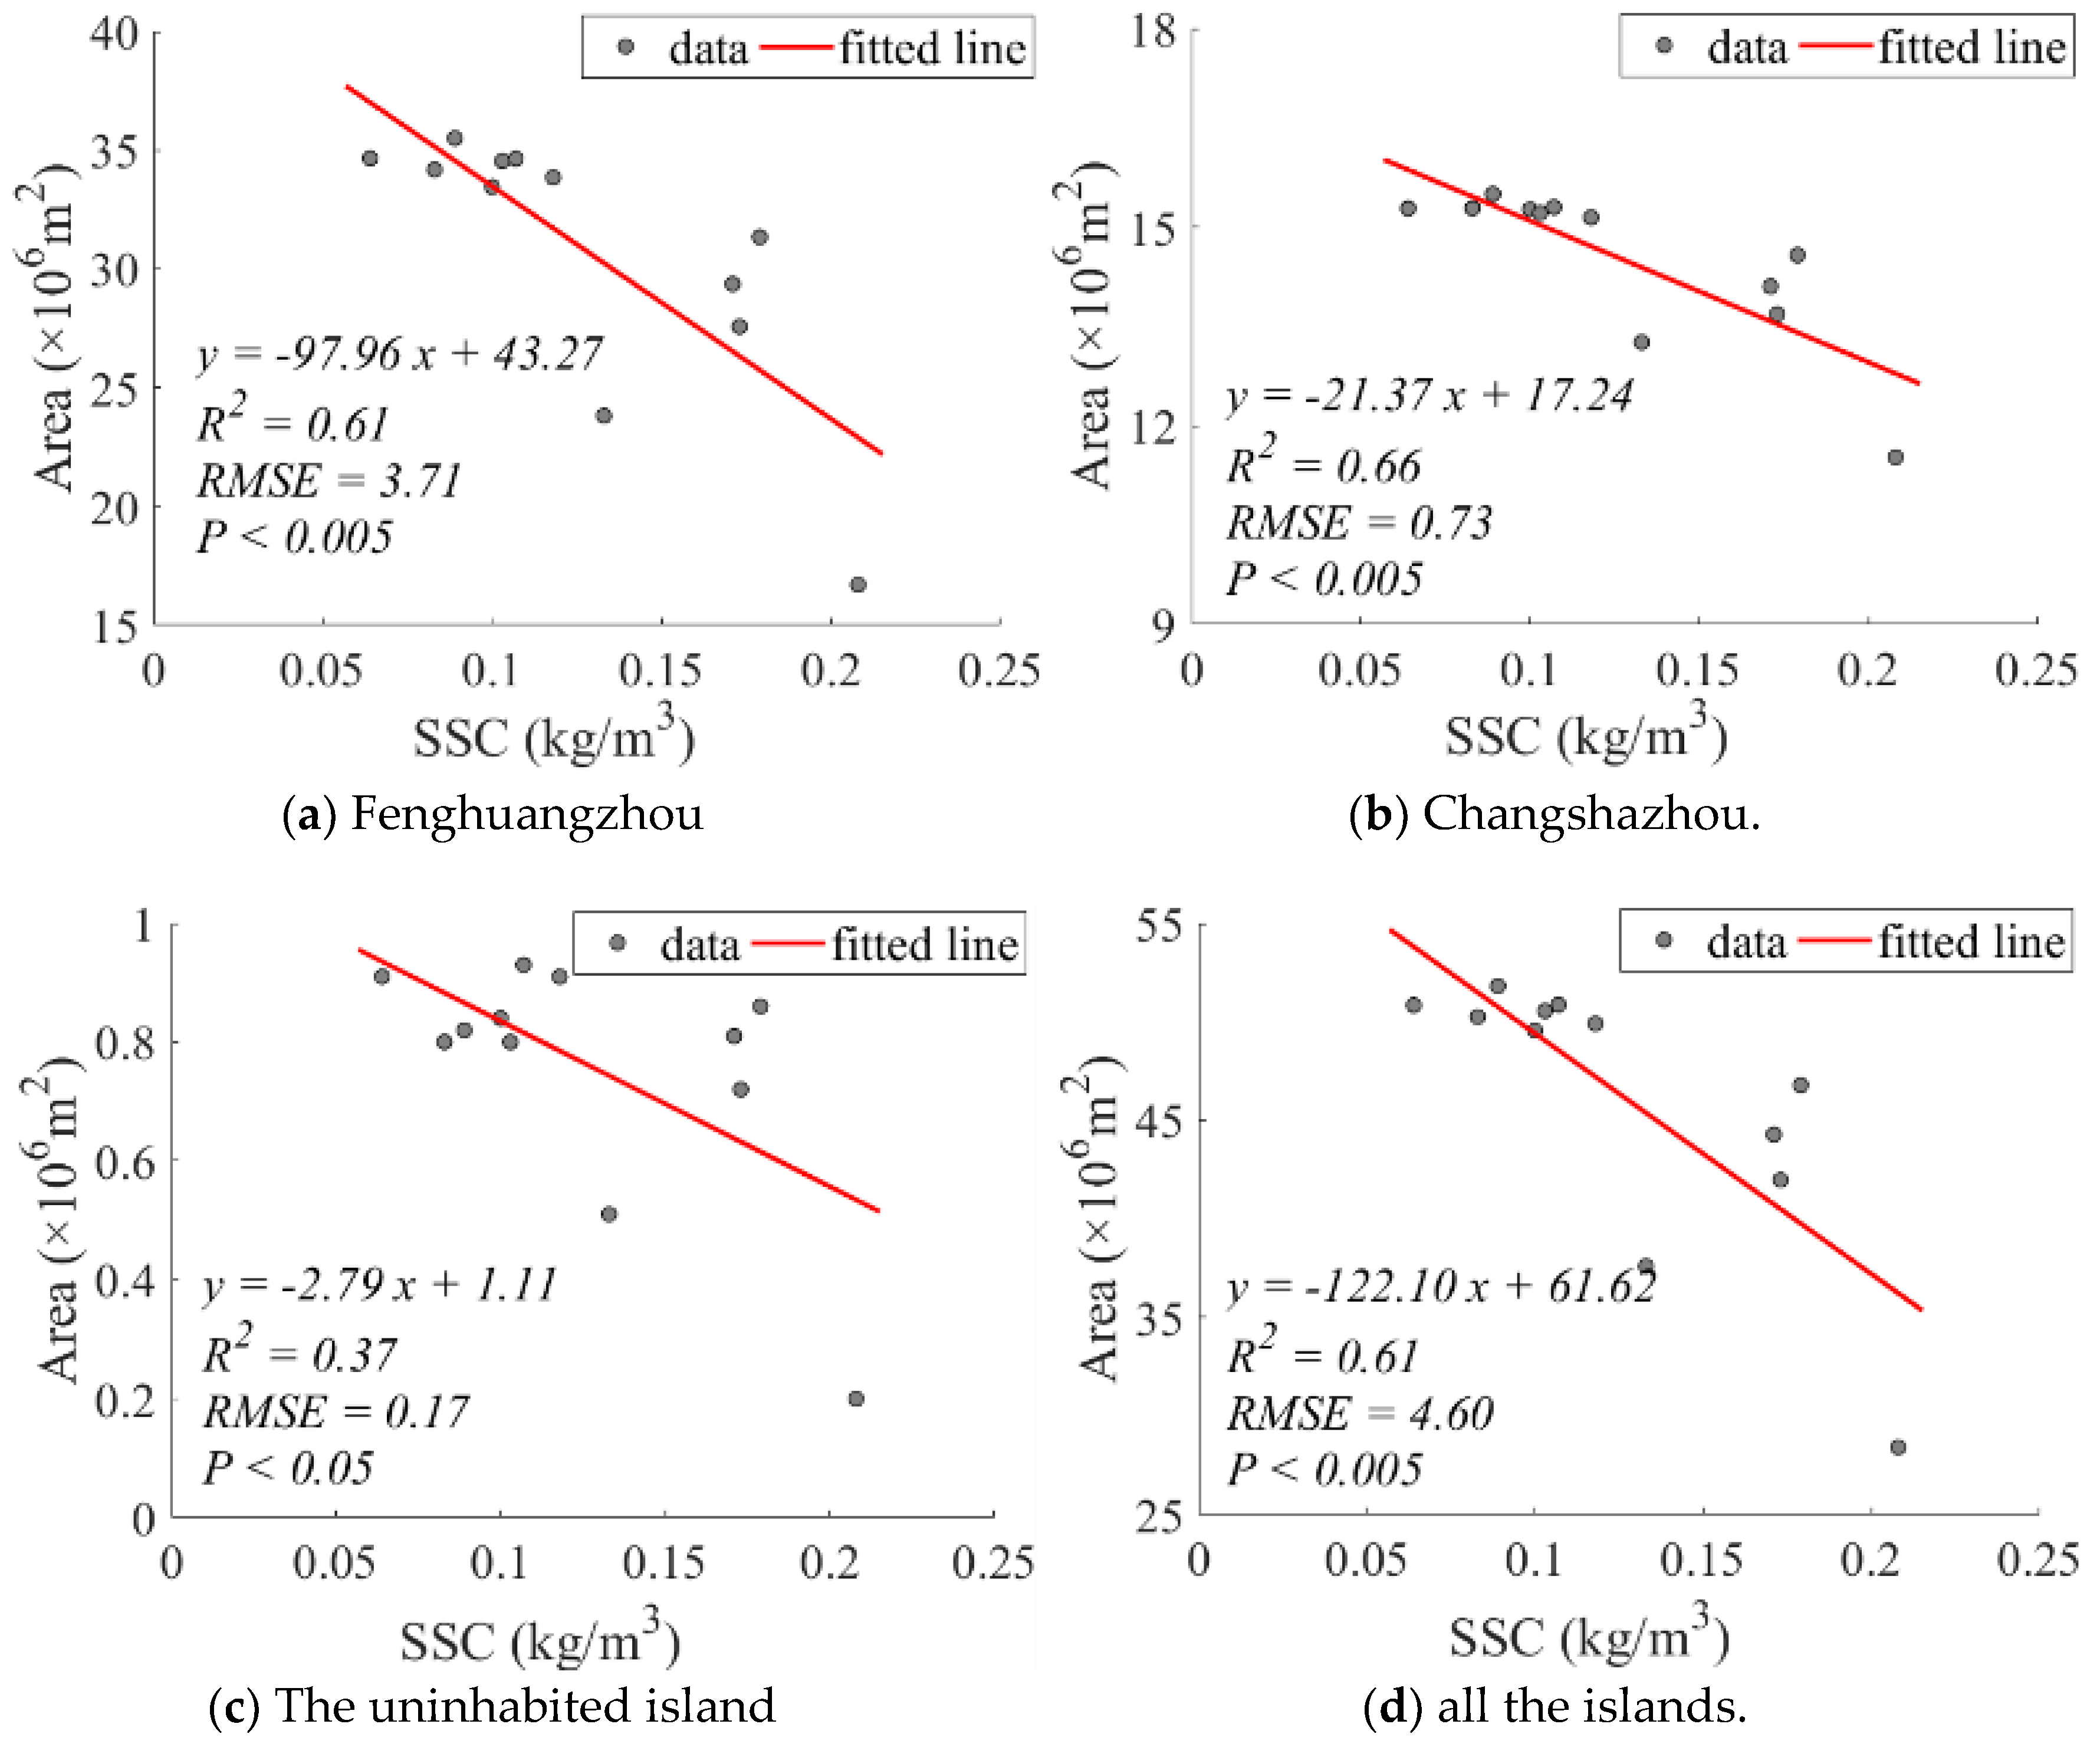
4.4. Relationship between River Island Area and SSC
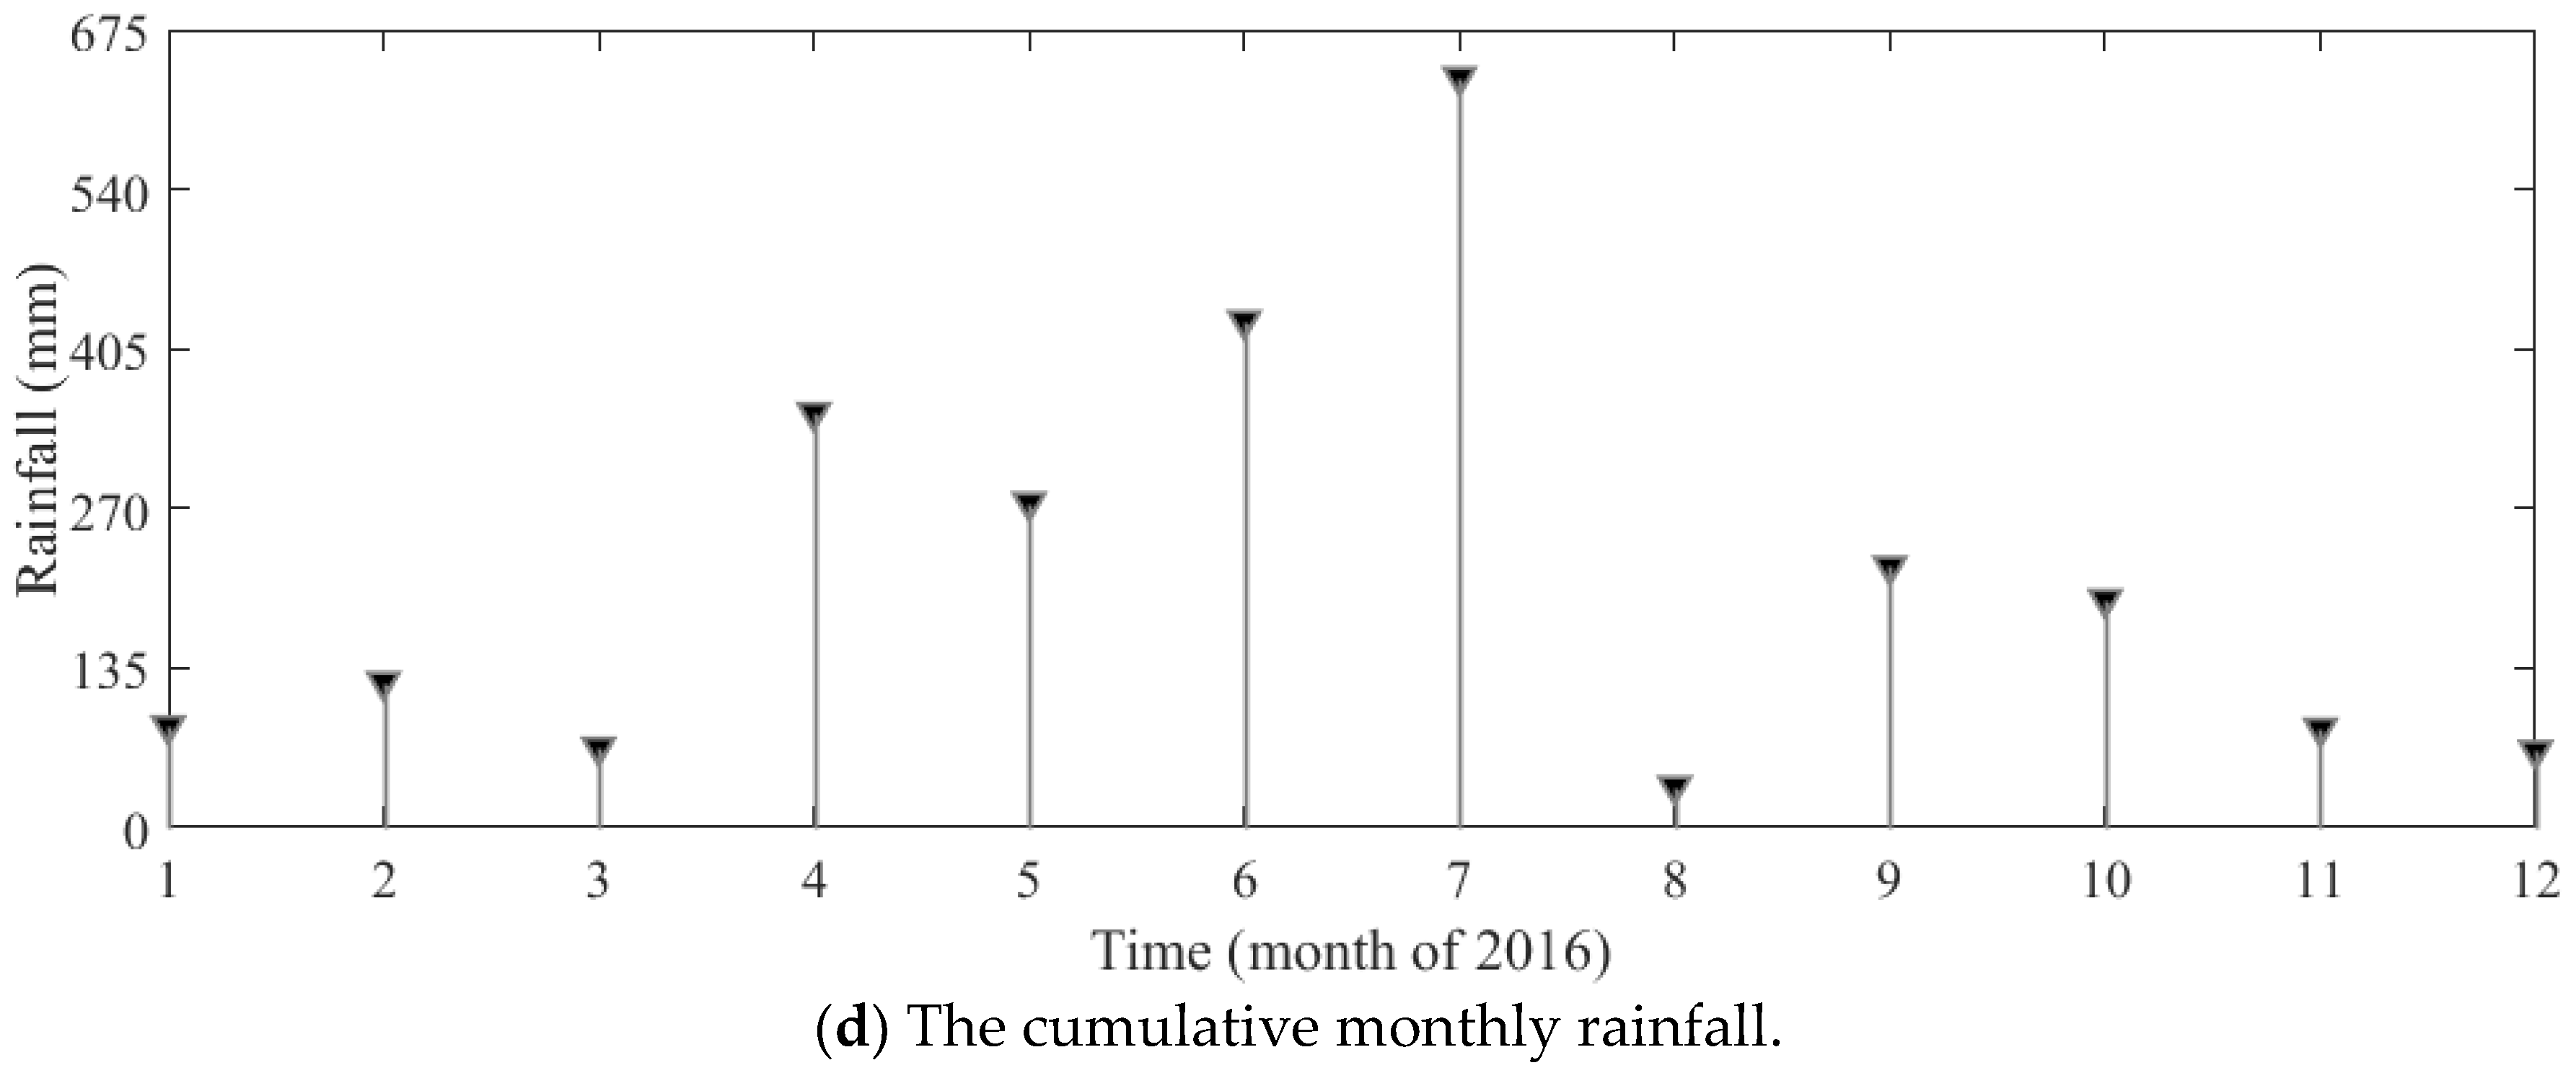
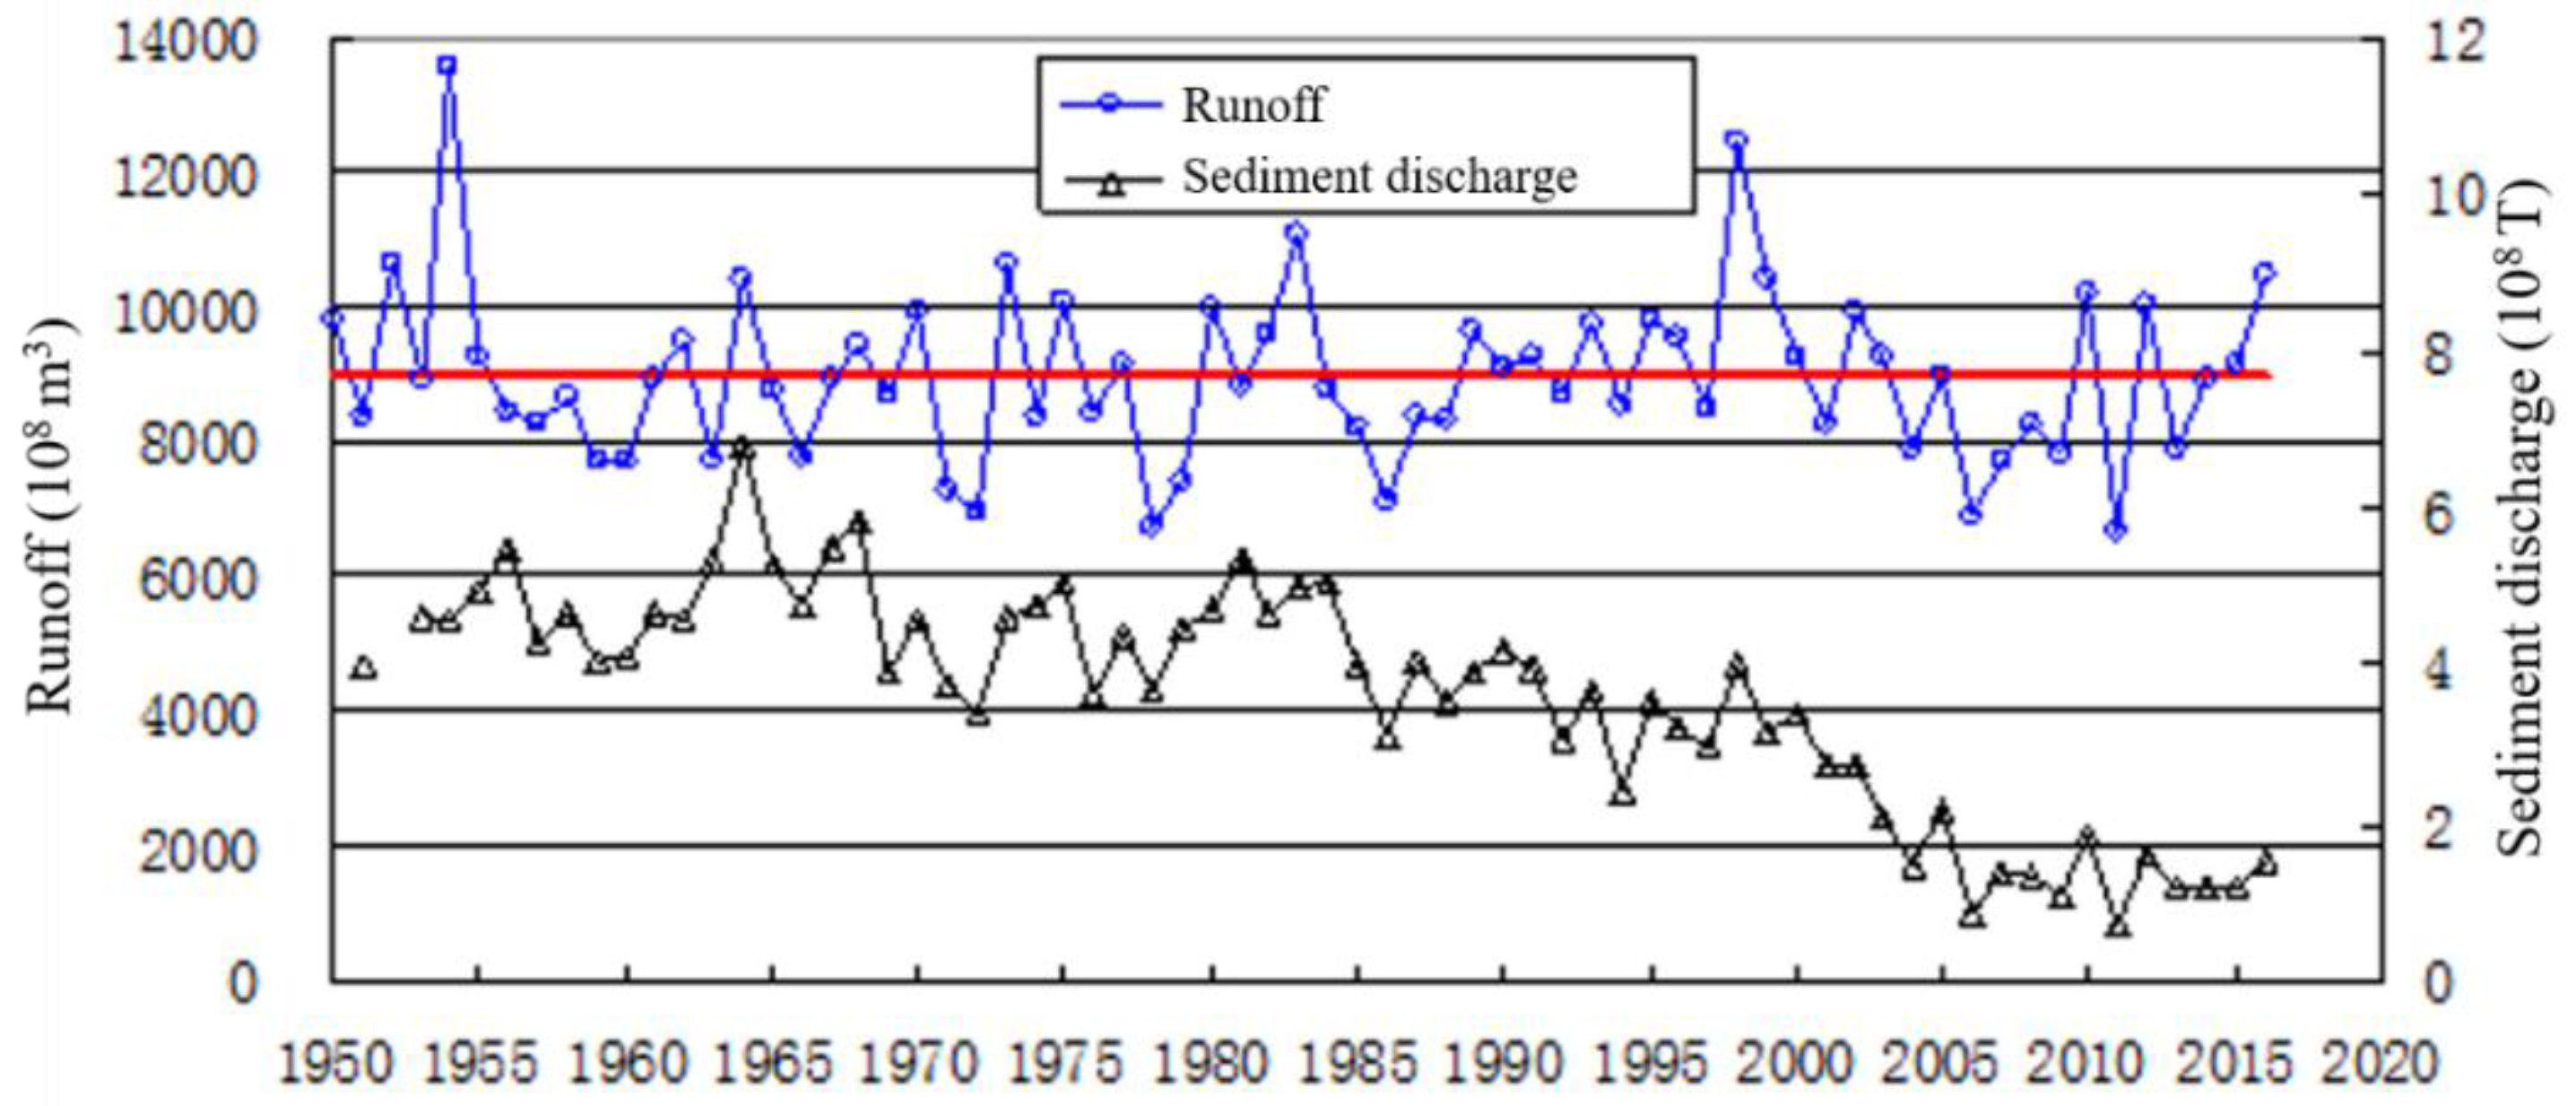
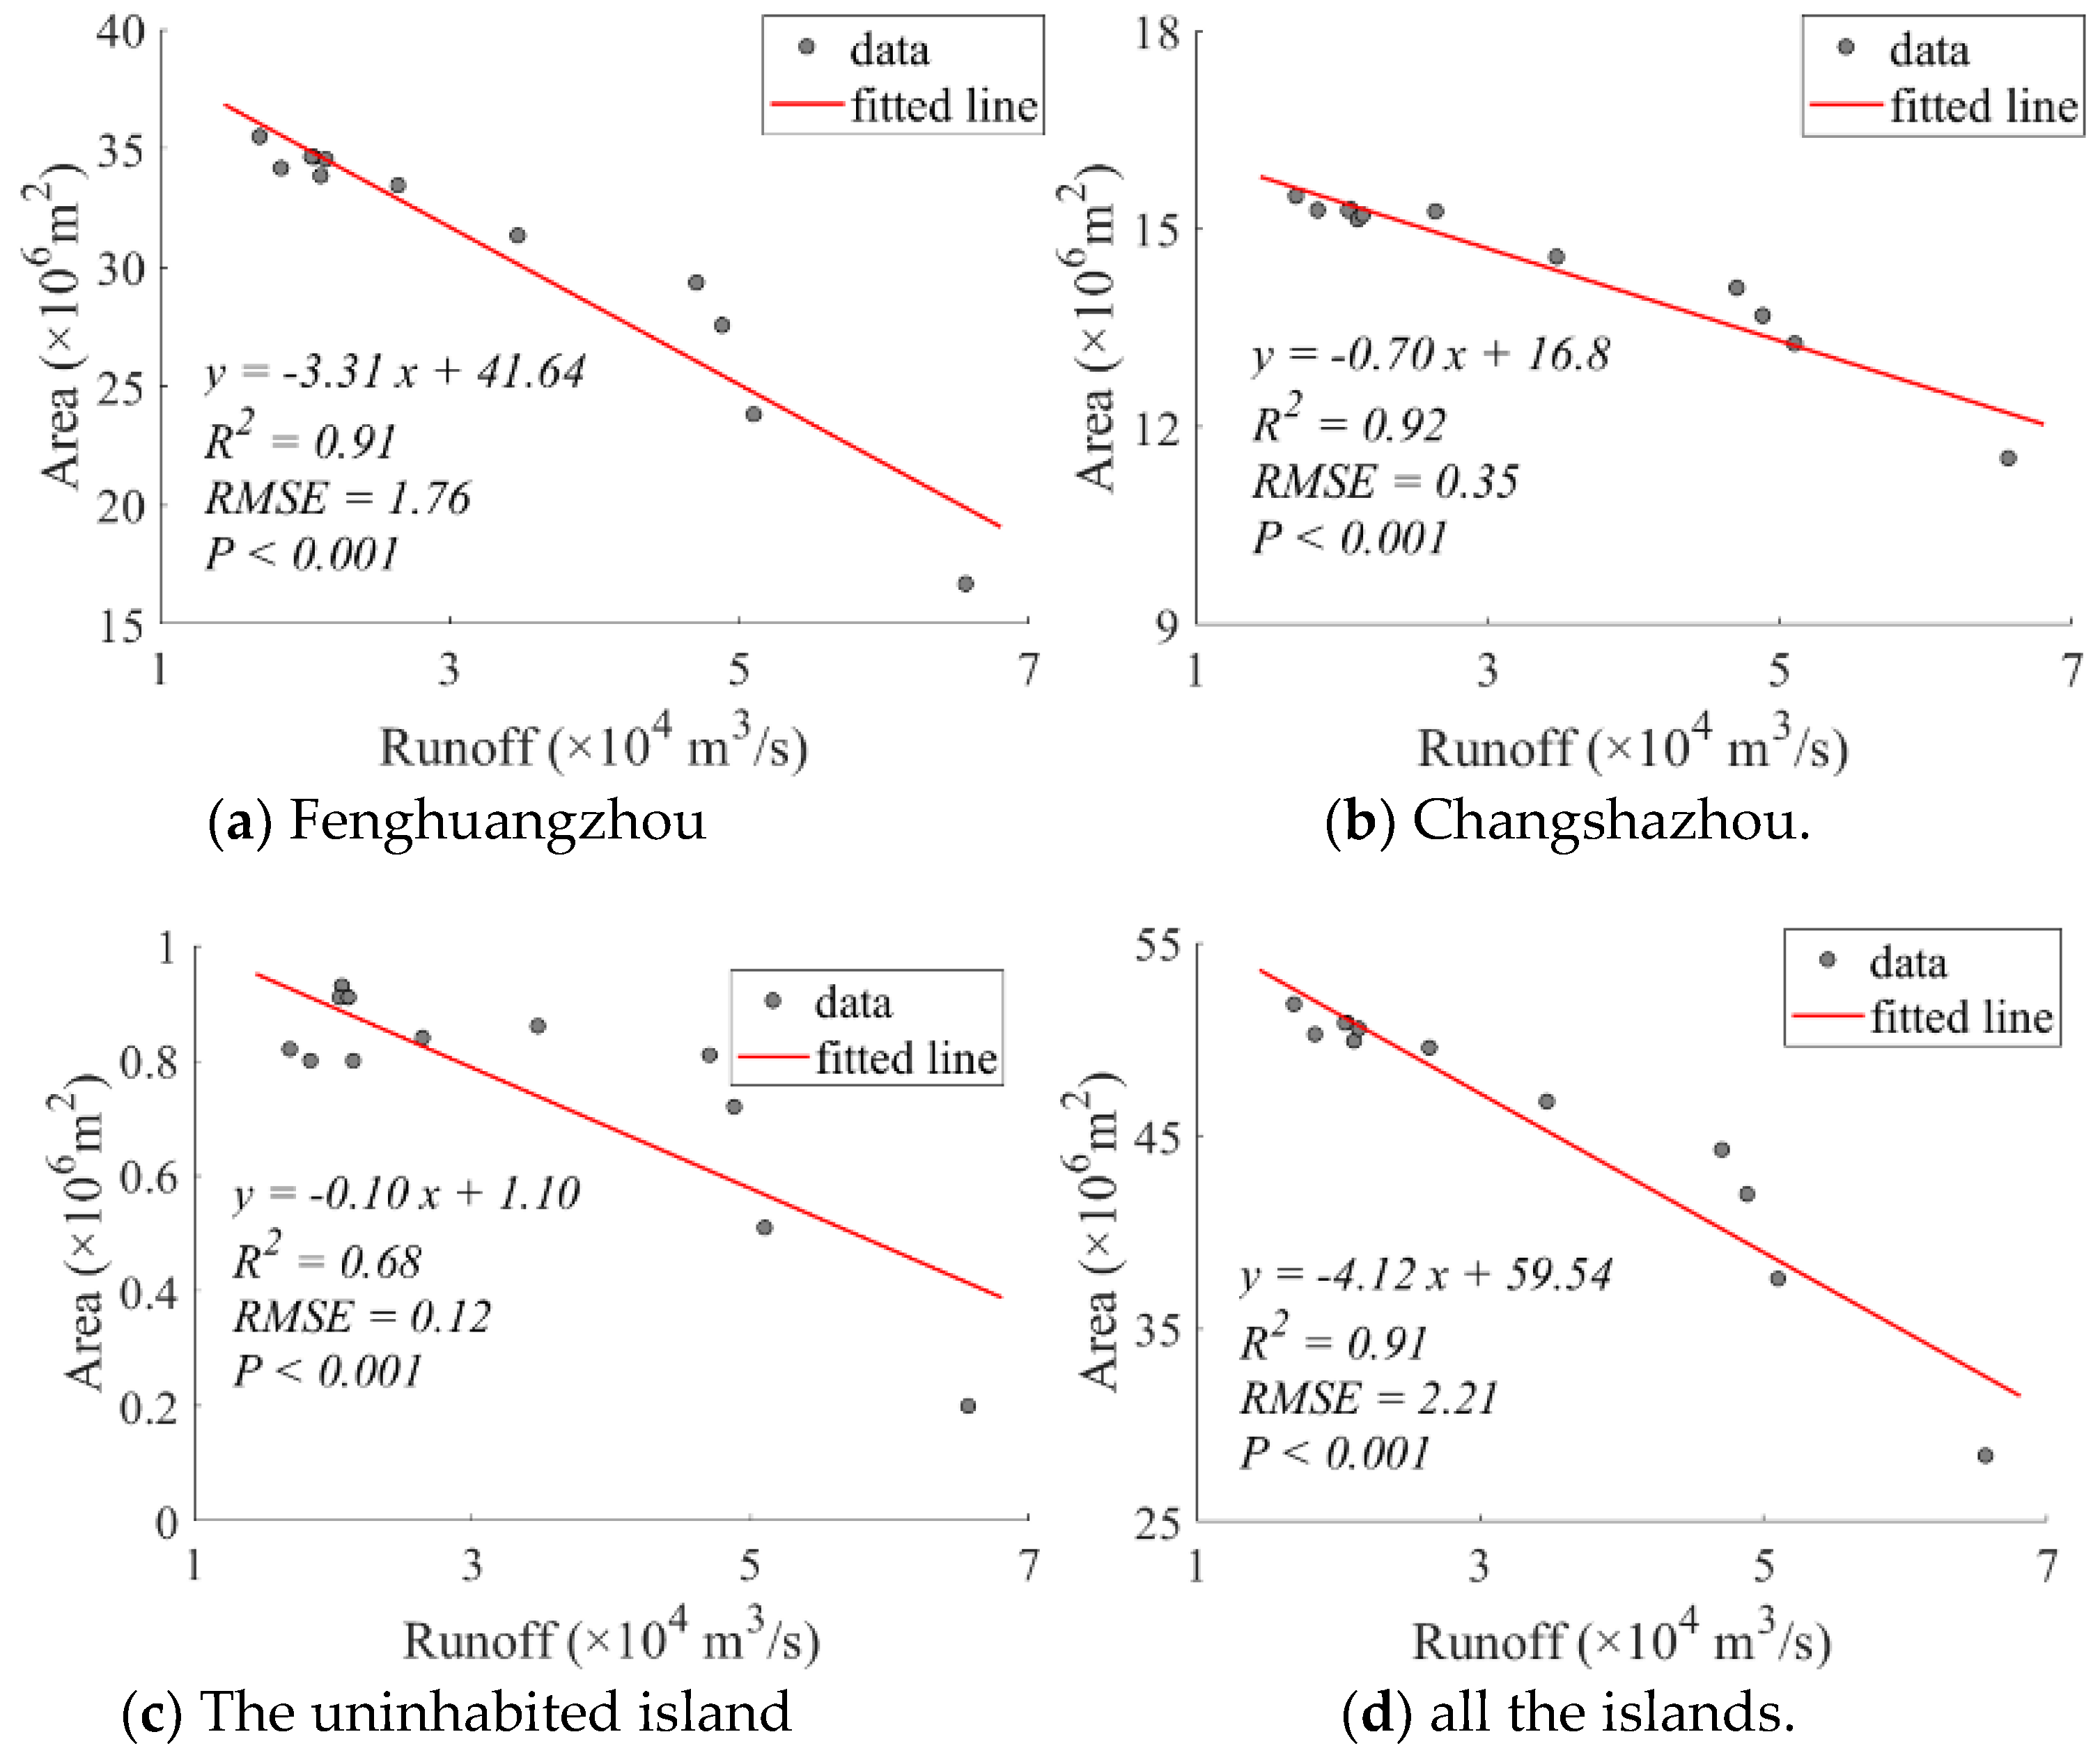
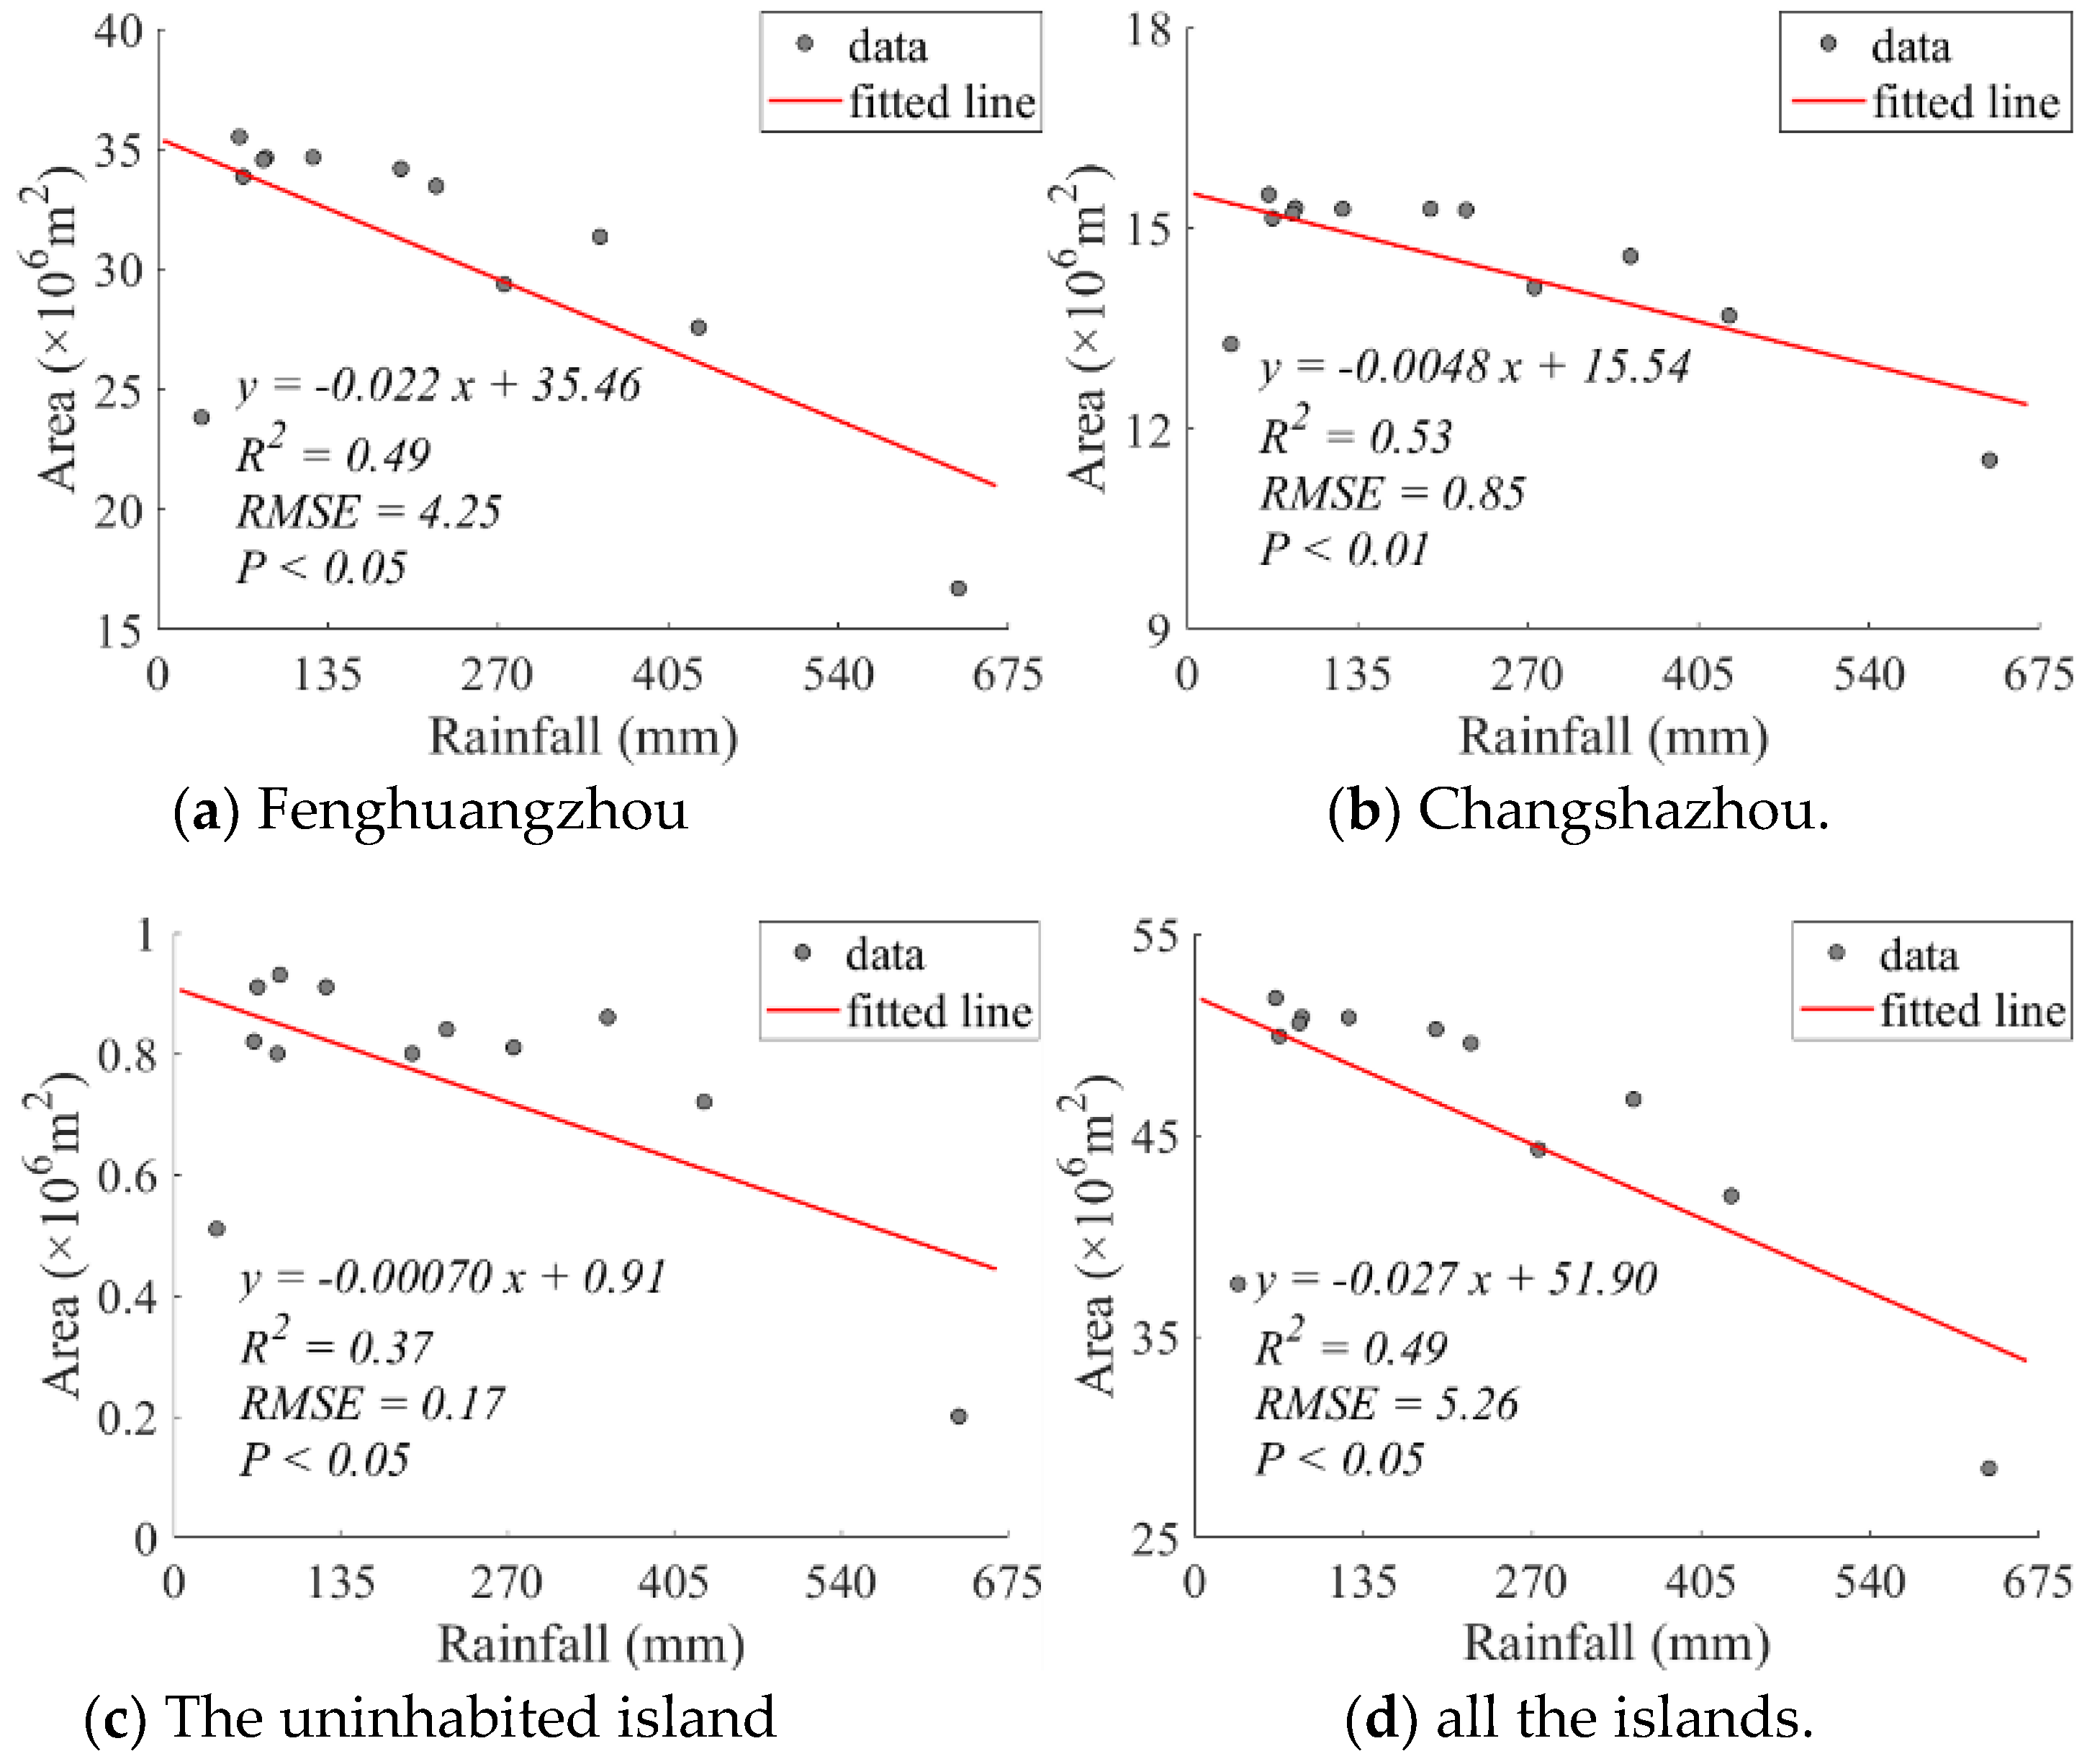
4.5. Relationship between River Island, Runoff and Rainfall
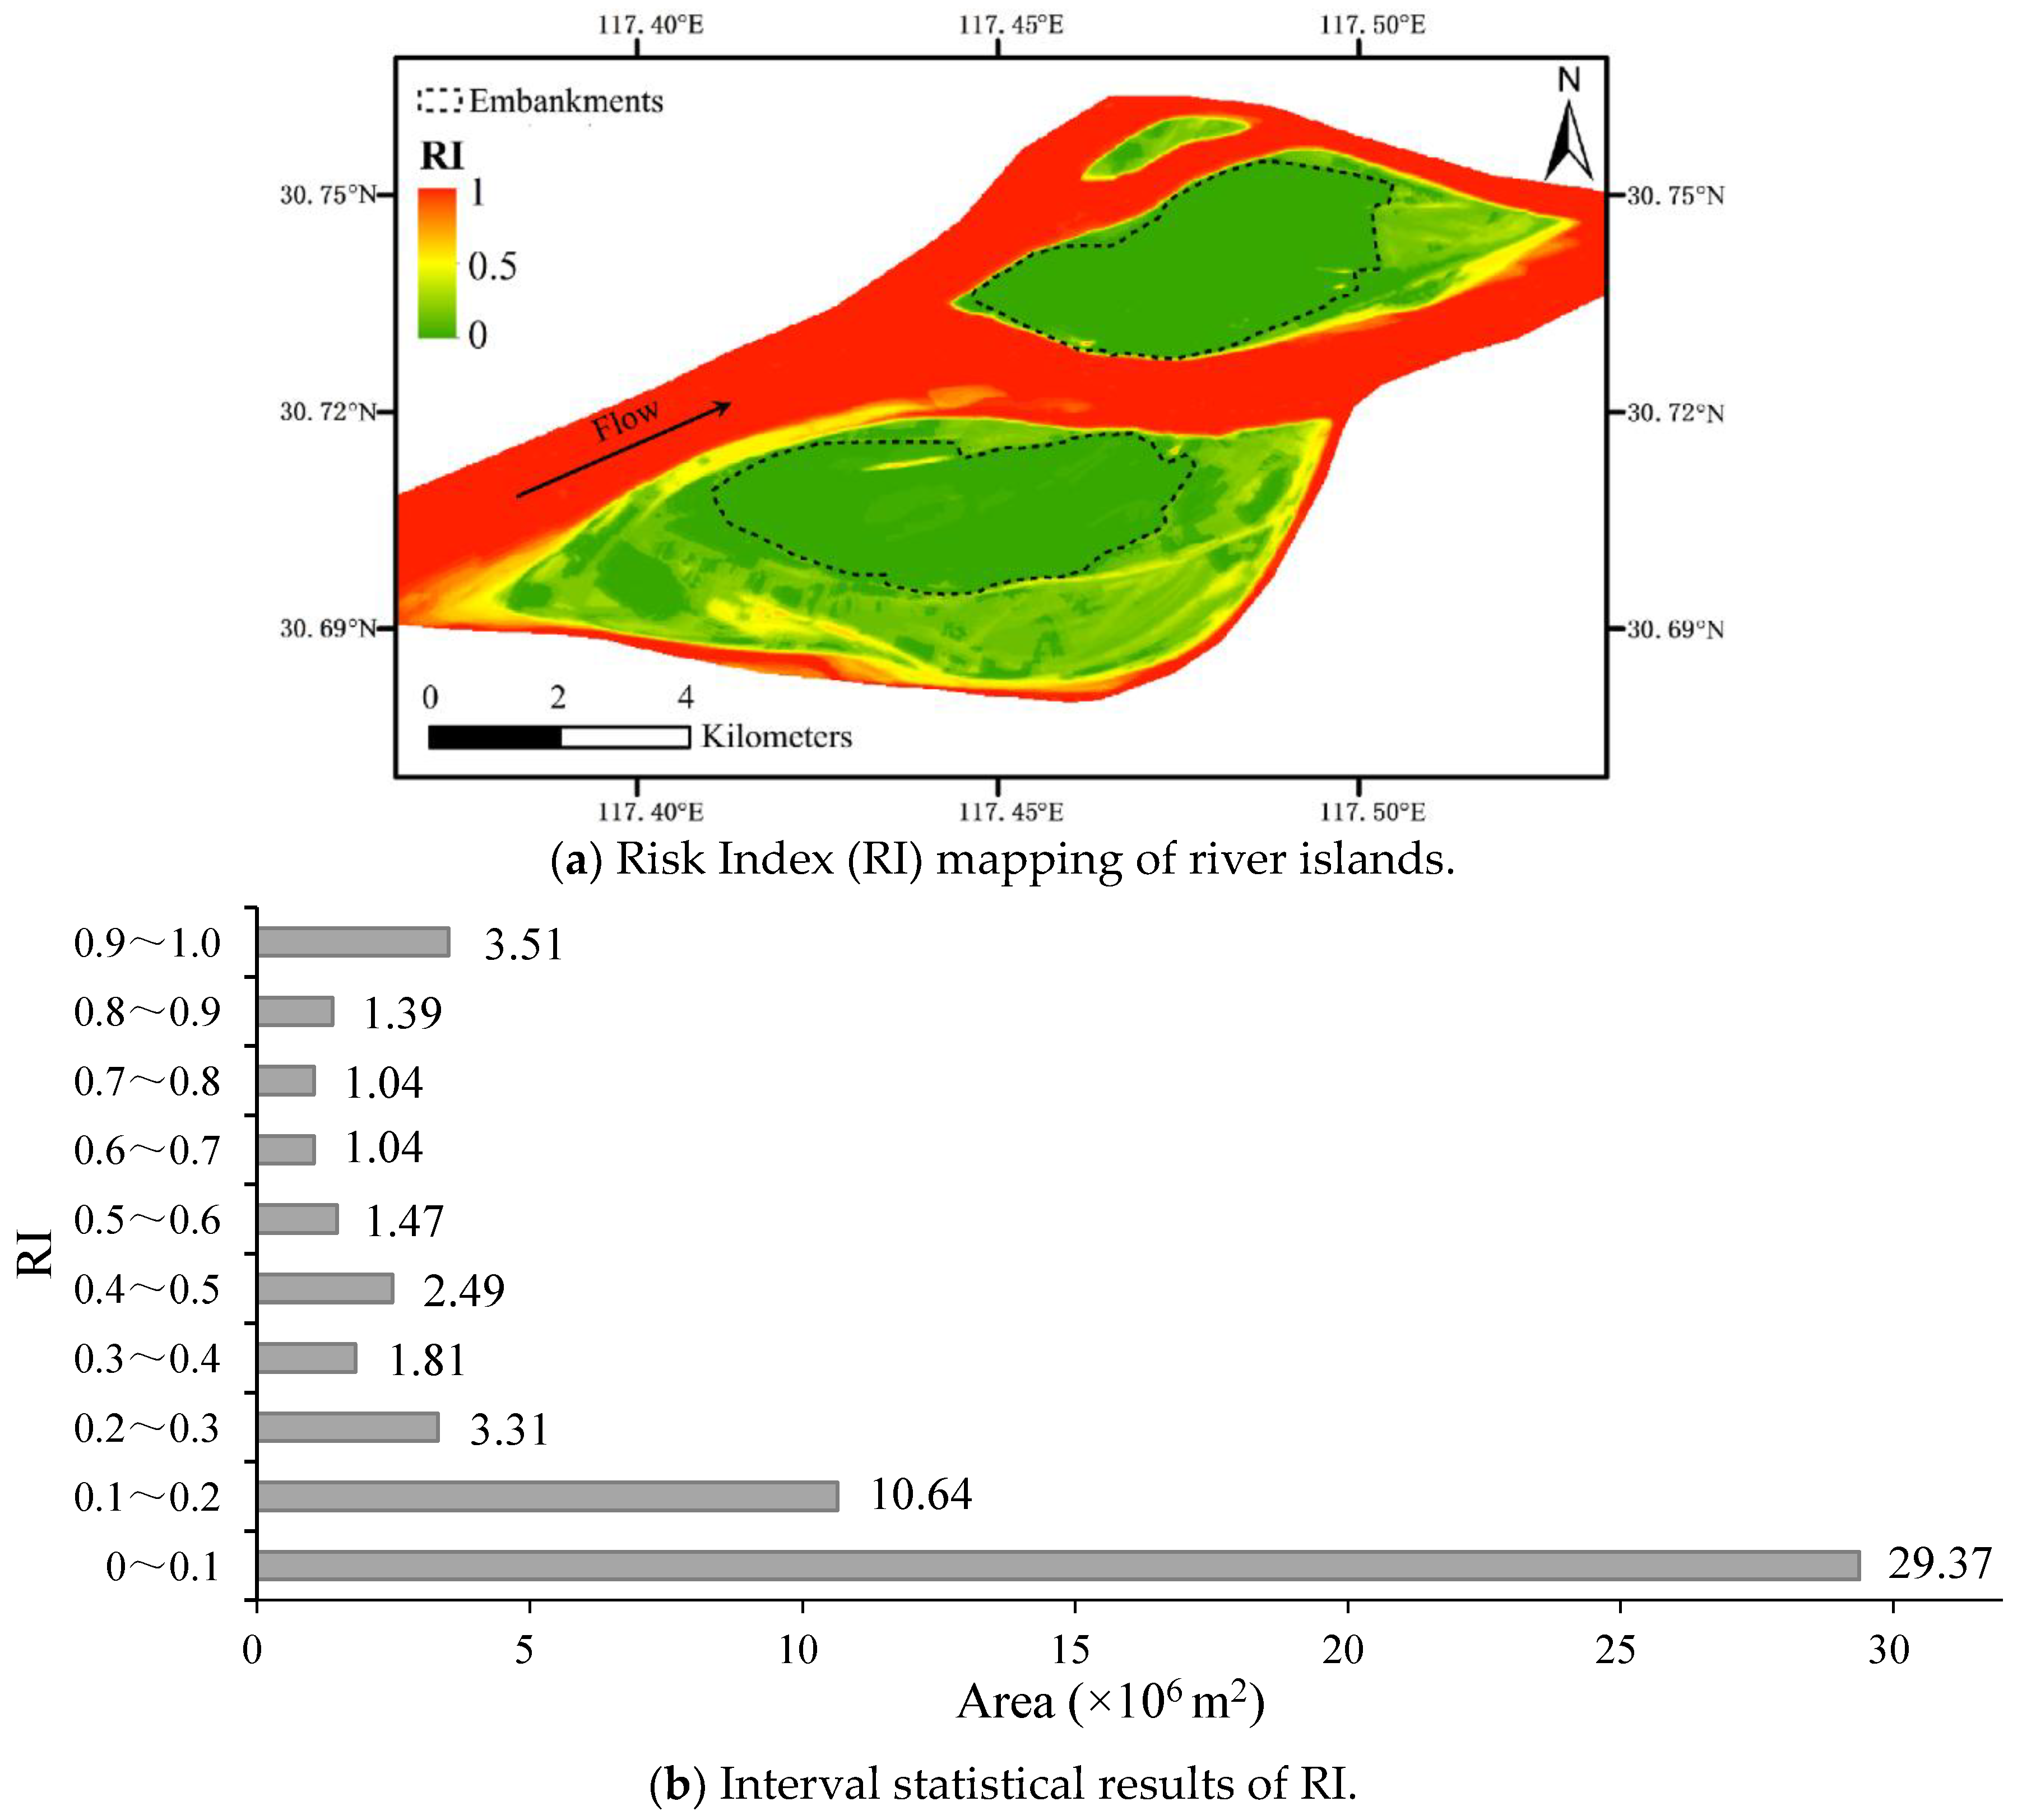
4.6. Flooding Risk of River Islands
5. Conclusions
Author Contributions
Funding
Acknowledgments
Conflicts of Interest
References
- Gao, C.; Chen, S.; Yu, J. River islands’ change and impacting in the lower reaches of the Yangtze River based on remote sensing. Quat. Int. 2013, 304, 13–21. [Google Scholar] [CrossRef]
- Bai, J.; Li, Y.B. Analysis of riverbed evolution and trend prediction for Jiangxinzhou waterway of the lower Yangtze River. J. Waterw. Harb. 2009, 30, 347–351. [Google Scholar]
- Carling, P.; Jansen, J.; Meshkova, L. Multichannel rivers: Their definition and classification. Earth Surf. Proc. Land. 2014, 39, 26–37. [Google Scholar] [CrossRef]
- Huang, H.Q.; Nanson, G.C. Why some alluvial rivers develop an anabranching pattern. Water Resour. Res. 2007, 43, W07441. [Google Scholar] [CrossRef]
- Gilvear, D.; Willby, N. Channel dynamics and geomorphic variability as controls on gravel bar vegetation: River Tummel, Scotland. River Res. Appl. 2006, 22, 457–474. [Google Scholar] [CrossRef]
- Mani, P.; Kumar, R.; Chatterjee, C. Erosion study of a part of Majuli River-Island using remote sensing data. J. Indian Soc. Remote Sens. 2003, 31, 12–18. [Google Scholar] [CrossRef]
- Joeckel, R.M.; Henebry, G.M. Channel and island change in the lower Platte River, Eastern Nebraska, USA: 1855–2005. Geomorphology 2008, 102, 407–418. [Google Scholar] [CrossRef]
- Liu, X.; Huang, H.; Deng, C. A theoretical investigation of the hydrodynamic conditions for equilibrium island morphology in an abranching rivers. Adv. Water Sci. 2014, 25, 477–483. [Google Scholar]
- Chuurman, F.; Kleinhans, M.G. Bar dynamics and bifurcation evolution in a modelled braided sand-bed river. Earth Surf. Proc. Land. 2015, 40, 1318–1333. [Google Scholar] [CrossRef]
- Wang, Z.; Huang, W.; Li, Y. Sediment budget of the Yangtze River. J. Sediment Res. 2007, 2, 1–10. [Google Scholar] [CrossRef]
- Wella-Hewage, C.S.; Hewa, G.A.; Pezzaniti, D. Can water sensitive urban design systems help to preserve natural channel-forming flow regimes in an urbanised catchment? Water Sci. Technol. 2016, 73, 78–87. [Google Scholar] [CrossRef] [PubMed]
- Park, E.; Latrubesse, E.M. Modeling suspended sediment distribution patterns of the Amazon River using MODIS data. Remote Sens. Environ. 2014, 147, 232–242. [Google Scholar] [CrossRef]
- Grove, J.R.; Croke, J.; Thompson, C. Quantifying different riverbank erosion processes during an extreme flood event. Earth Surf. Proc. Land. 2013, 38, 1393–1406. [Google Scholar] [CrossRef]
- Zhang, L.J.; Qian, Y.F. A Study on the Feature of Precipitation Concentration and Its Relation to Flood-Producing in the Yangtze River Valley of China. Chin. J. Geophys. 2004, 47, 709–718. [Google Scholar] [CrossRef]
- Yang, S.L.; Milliman, J.D.; Xu, K.H.; Deng, B.; Zhang, X.Y.; Luo, X.X. Downstream sedimentary and geomorphic impacts of the Three Gorges Dam on the Yangtze River. Earth-Sci. Rev. 2014, 138, 469–486. [Google Scholar] [CrossRef]
- Li, L.; Lu, X.; Chen, Z. River channel change during the last 50 years in the middle Yangtze River, the Jianli reach. Geomorphology 2007, 85, 185–196. [Google Scholar] [CrossRef]
- Yin, H.; Li, C. Human impact on floods and flood disasters on the Yangtze River. Geomorphology 2001, 41, 105–109. [Google Scholar] [CrossRef]
- Sun, Z.H.; Li, Y.T.; Huang, Y.; Gao, K.C. Fluvial process of sandbars and shoals in branching channels of the middle Yangtze River. J. Hydraul. Eng. 2001, 42, 1398–1406. (In Chinese) [Google Scholar]
- Yu, F.; Chen, Z.; Ren, X.; Yang, G. Analysis of historical floods on the Yangtze River, China: Characteristics and explanations. Geomorphology 2009, 113, 210–216. [Google Scholar] [CrossRef]
- Zong, Y.; Chen, X. The 1998 flood on the Yangtze, China. Nat. Hazards 2000, 22, 165–184. [Google Scholar] [CrossRef]
- Ya, L.; Fei, W.; Yitian, L. Objective river pattern of waterway regulation of goose-head-shaped a nabranching channel in the Middle and Lower Yangtze River. J. Hydraul. Eng. 2015, 46, 443–451. (In Chinese) [Google Scholar]
- Li, Z.; Wang, Z.; Jia, Y.; Li, W. Evolution analysis of channel bars in the middle and lower Yangtze River before and after impoundment of three gorges reservoir. Res. Environ. Yangtza Basin 2015, 24, 65–73. (In Chinese) [Google Scholar]
- Lv, L.; Li, Z.; Liu, X. Analysis on River Channel Evolution and Regulation of Ma’anshan Reach of Yangtze River. J. Yangtze River Sci. Res. Inst. 2009, 26, 13–16. (In Chinese) [Google Scholar]
- Zhang, J.; Li, J.; Fang, H.; Gu, L.; Shi, J.; Zhu, Q.; Wu, Z. Analysis of flood characteristics of Changjiang River basin in Anhui Province of 2016. Yangtze River 2017, 4, 66–69. (In Chinese) [Google Scholar]
- The Ministry of Water Resources of the People’s Republic of China Promulgated “2016 China Flood and Drought Disaster Bulletin”. Available online: http://www.mwr.gov.cn/sj/tjgb/zgshzhgb/201707/t20170720_966705.html (accessed on 1 July 2018).
- From Wikipedia. Available online: https://en.wikipedia.org/wiki/1954_Yangtze_River_floods (accessed on 22 September 2018).
- Xu, N. Detecting Coastline Change with All Available Landsat Data over 1986–2015: A Case Study for the State of Texas, USA. Atmosphere 2018, 9, 107. [Google Scholar] [CrossRef]
- Mueller, N.; Lewis, A.; Roberts, D.; Ring, S.; Melrose, R.; Sixsmith, J.; Lymburner, L.; McIntyre, A.; Tan, P.; Curnow, S.; et al. Water observations from space: Mapping surface water from 25 years of Landsat imagery across Australia. Remote Sens. Environ. 2015, 174, 341–352. [Google Scholar] [CrossRef]
- Wang, B.; Xu, Y. Sediment trapping by emerged channel bars in the lowermost Mississippi River during a major flood. Water 2015, 7, 6079–6096. [Google Scholar] [CrossRef]
- Shi, H.; Gao, C.; Dong, C.; Xia, C.; Xu, G. Variation of river islands around a large city along the Yangtze River from satellite remote sensing images. Sensors 2017, 17, 2213. [Google Scholar] [CrossRef] [PubMed]
- Yang, G.; Xiang, H.; Yu, M.; Duan, W.; Tan, L. Variations of low water level and river bed in middle and lower reaches of Yangtze River. Eng. J. Wuhan Univ. 2009, 42, 64–69. (In Chinese) [Google Scholar]
- Wang, Z.; Li, H.; Cai, X. Remotely Sensed Analysis of Channel Bar Morphodynamics in the Middle Yangtze River in Response to a Major Monsoon Flood in 2002. Remote Sens. 2018, 10, 1165. [Google Scholar] [CrossRef]
- Lou, Y.; Mei, X.; Dai, Z.; Wang, J.; Wei, W. Evolution of the mid-channel bars in the middle and lower reaches of the Changjiang (Yangtze) River from 1989 to 2014 based on the Landsat satellite images: Impact of the Three Gorges Dam. Environ. Earth Sci. 2018, 77, 1–18. [Google Scholar] [CrossRef]
- Chen, H.; Wang, J.; Chen, Z.; Yang, L.; Xi, W. Comparison of water extraction methods in mountainous plateau region from TM image. Remote Sens. Technol. Appl. 2004, 19, 479–484. (In Chinese) [Google Scholar]
- Bates, P.D.; Horritt, M.S.; Smith, C.N.; Mason, D. Integrating remote sensing observations of flood hydrology and hydraulic modelling. Hydrol. Process. 1997, 11, 1777–1795. [Google Scholar] [CrossRef]
- Godoy, M.D.P.; de Lacerda, L.D. River-island morphological response to basin land-use change within the Jaguaribe River estuary, NE Brazil. J. Coast. Res. 2013, 30, 399–410. [Google Scholar] [CrossRef]
- Introduction of Fenghuangzhou. Available online: https://baike.so.com/doc/10040802-10542809.html (accessed on 1 July 2018).
- Introduction of Changshazhou. Available online: https://baike.so.com/doc/7591563-24826976.html#refff_7591563-24826976-1 (accessed on 1 July 2018).
- Characteristics of the Yangtze River Flood in Anhui Province. Available online: http://www.ahcjj.cn/contents/169/2835.html (accessed on 1 July 2018).
- Characteristics and Implications of the Yangtze River flood in 2016. Available online: http://www.cjh.com.cn/pages/2016-10-08/564_189040.html (accessed on 1 July 2018).
- China Centre for Resources Satellite Data and Application. GF-1. Available online: http://www.cresda.com/ (accessed on 1 July 2018).
- Terrestrial Observing Satellite Data Service Platform. Available online: http://www.cresda.com/CN/ (accessed on 1 July 2018).
- Anhui Hydrological Telemetry Information Network. Available online: http://yc.wswj.net/ahyc/ (accessed on 1 July 2018).
- Lyons, E.A.; Sheng, Y.; Smith, L.C.; Li, J.; Hinkel, K.M.; Lenters, J.D.; Wang, J. Quantifying sources of error in multitemporal multisensor lake mapping. Int. J. Remote Sens. 2013, 34, 7887–7905. [Google Scholar] [CrossRef]
- McFeeters, S.K. The use of the Normalized Difference Water Index (NDWI) in the delineation of open water features. Int. J. Remote Sens. 1996, 17, 1425–1432. [Google Scholar] [CrossRef]
- Ji, L.; Zhang, L.; Wylie, B. Analysis of dynamic thresholds for the normalized difference water index. Photogramm. Eng. Remote Sens. 2009, 75, 1307–1317. [Google Scholar] [CrossRef]
- Foody, G.M. Status of land cover classification accuracy assessment. Remote Sens. Environ. 2002, 80, 185–201. [Google Scholar] [CrossRef]
- Zhang, Q.; Xu, C.Y.; Becker, S.; Jiang, T. Sediment and runoff changes in the Yangtze River basin during past 50 years. J. Hydrol. 2006, 331, 511–523. [Google Scholar] [CrossRef]


| Data | Acquisition Time (Beijing Time) | |||||
|---|---|---|---|---|---|---|
| GF-1 | 2016.01.26 | 2016.02.03 | 2016.02.16 | 2016.02.20 | 2016.02.28 | 2016.03.11 |
| 2016.03.27 | 2016.03.28 | 2016.04.01 | 2016.04.13 | 2016.04.21 | 2016.04.29 | |
| 2016.04.30 | 2016.05.03 | 2016.05.04 | 2016.05.11 | 2016.05.12 | 2016.05.16 | |
| 2016.06.05 | 2016.06.13 | 2016.06.14 | 2016.07.08 | 2016.07.24 | 2016.07.25 | |
| 2016.07.28 | 2016.07.29 | 2016.08.10 | 2016.08.14 | 2016.08.18 | 2016.08.31 | |
| 2016.09.12 | 2016.09.20 | 2016.11.04 | 2016.11.11 | 2016.11.28 | 2016.12.02 | |
| 2016.12.15{2} | 2016.12.28 | 2016.12.31 | (11:00:00~11:54:28) | |||
| GF-4 | 2016.10.09 (09:35:12) | |||||
| Sentinel-2 | 2016.10.04 (10:59:05) | |||||
| GF-2 | 2016.08.11{2} (11:09:22,11:09:25) | |||||
| Category | GF-2 | Total | User Accuracy | ||
|---|---|---|---|---|---|
| Island | Water | ||||
| GF-1 | Island | 116,592 | 4962 | 121,554 | 95.92% |
| water | 11,901 | 187,217 | 199,118 | 94.02% | |
| total | 128,493 | 192,179 | 320,672 | ||
| Producer accuracy | 90.74% | 97.42% | |||
| Overall Accuracy = 94.74% | Kappa Coefficient = 0.8895 | ||||
| Characteristics | Annual Runoff (108 m3) | Annual Sediment Discharge (108 T) | Annual Average Sediment Concentration (kg/m3) |
|---|---|---|---|
| Multi-year average | 8712 (2007–2016) | 1.3 (2007–2016) | 0.414 (1951–2015) |
| 2015 | 9139 | 1.16 | 0.127 |
| 2016 | 10,450 | 1.52 | 0.145 |
© 2018 by the authors. Licensee MDPI, Basel, Switzerland. This article is an open access article distributed under the terms and conditions of the Creative Commons Attribution (CC BY) license (http://creativecommons.org/licenses/by/4.0/).
Share and Cite
Sun, J.; Ding, L.; Li, J.; Qian, H.; Huang, M.; Xu, N. Monitoring Temporal Change of River Islands in the Yangtze River by Remotely Sensed Data. Water 2018, 10, 1484. https://doi.org/10.3390/w10101484
Sun J, Ding L, Li J, Qian H, Huang M, Xu N. Monitoring Temporal Change of River Islands in the Yangtze River by Remotely Sensed Data. Water. 2018; 10(10):1484. https://doi.org/10.3390/w10101484
Chicago/Turabian StyleSun, Jinyan, Lei Ding, Jiaze Li, Haiming Qian, Mengting Huang, and Nan Xu. 2018. "Monitoring Temporal Change of River Islands in the Yangtze River by Remotely Sensed Data" Water 10, no. 10: 1484. https://doi.org/10.3390/w10101484
APA StyleSun, J., Ding, L., Li, J., Qian, H., Huang, M., & Xu, N. (2018). Monitoring Temporal Change of River Islands in the Yangtze River by Remotely Sensed Data. Water, 10(10), 1484. https://doi.org/10.3390/w10101484