5.1. Comparison of Different Predictors
In
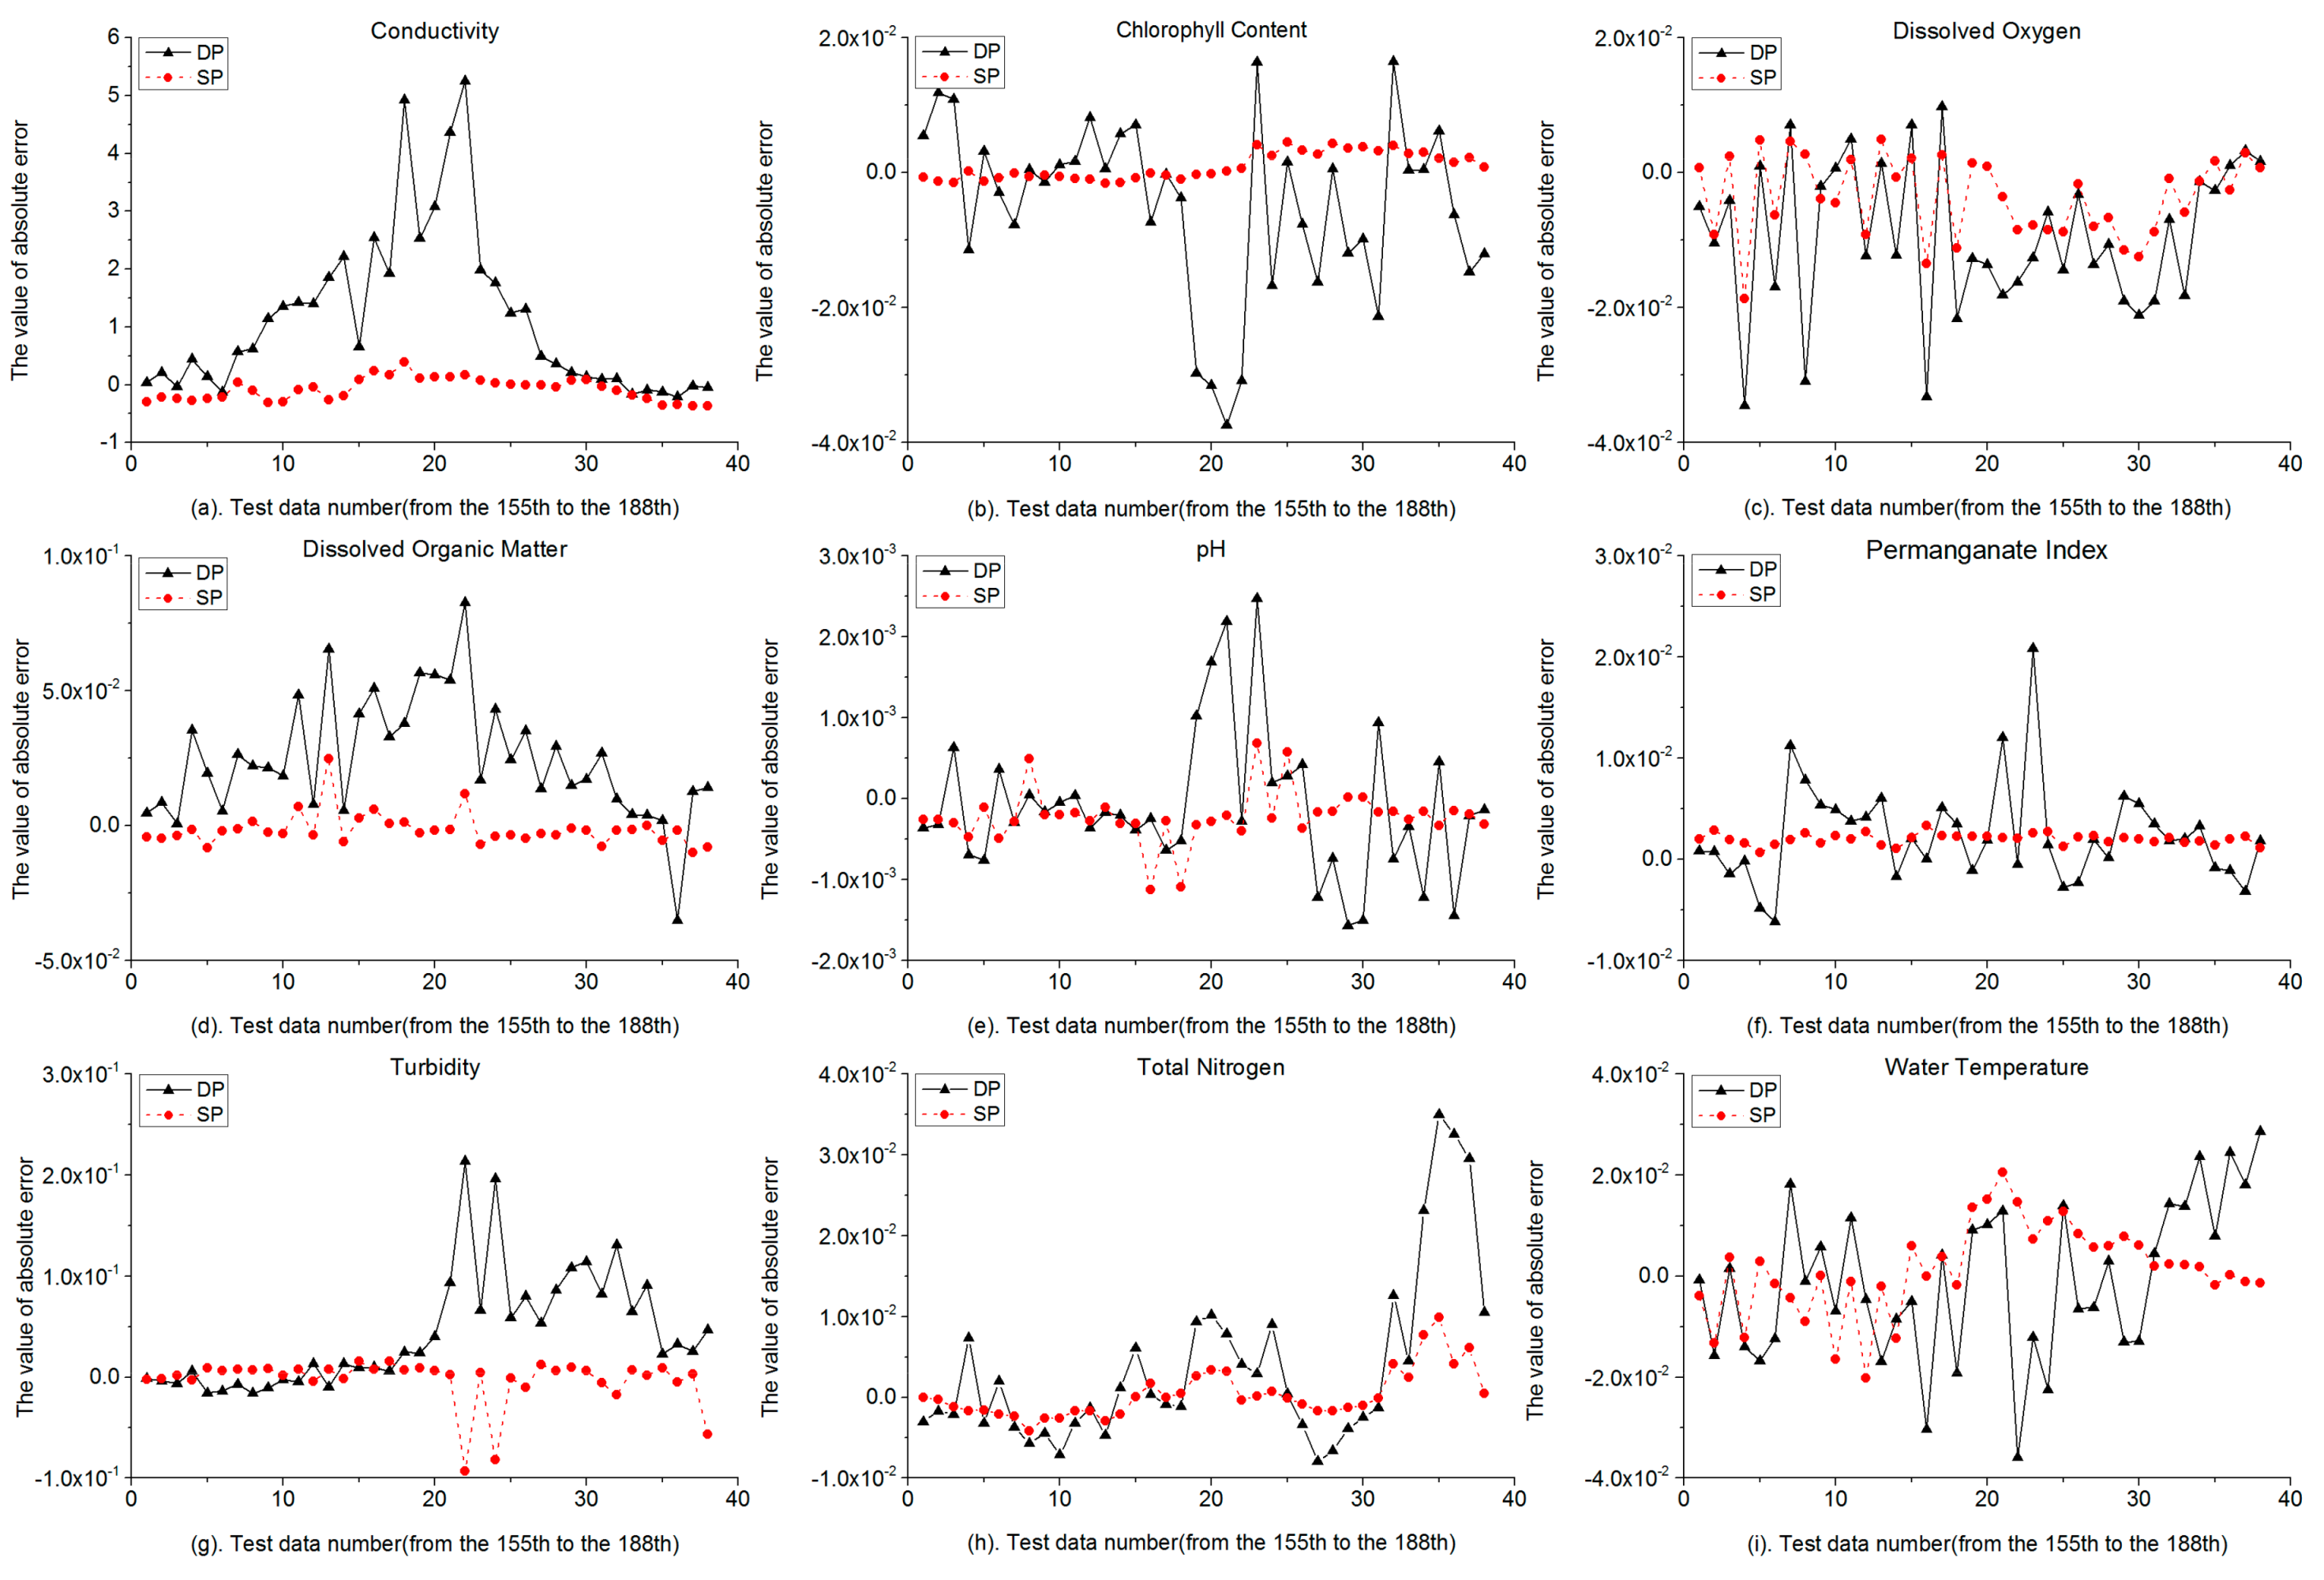
Table 5, the RMSE and MAPE values of 9 water quality indicators used as the selected predictors were all less than the default predictors. Those forecast results are also shown in
Figure 4 that 9 water quality indicators of the SP have smaller data variation ranges of the absolute errors that the curves were more stable than the DP. In DP, the maximum MAPE was 1.222% (TB), 2 were less than 0.1%, 6 were between 0.1% and 1%, 1 was over 1%. In SP, the maximum MAPE was 0.33% (TB), 8 were less than 0.1%, 1 was over 0.3%. The maximum RMSE of DP and SP was conductivity, the values were 1.8106 and 0.2087, respectively. According to previous research, turbidity can be influenced by various external and internal factors such as the dustfall, the temperature, and the water sample collection process may lead to lower forecast accuracy than other indicators. The data ranges of conductivity were from 450 to 781, which would cause the RMSE value of conductivity larger than other indicators. The fluctuating data change process would also lead to lower forecast accuracy in conductivity. However, when we select the pertinent predictors for conductivity, the MAPE value reduced significantly from 0.243% to 0.032%. Similar improvements also occurred on the dissolved organic matter and total nitrogen, the MAPEs reduced from 0.438% to 0.070% and 0.324% to 0.093%, respectively. When the inputs were the selected predictors, the forecast accuracy was higher than the default inputs.
Since the water quality indicators can be affected by various external and internal factors, if we used all the seven external environmental factors together as the predictors, the model would be not effective enough to forecast the water quality by the CS-BP model in this case study. Therefore, using the data pre-processing methods to select the new predictors was useful and effective, and we set the selected predictors as inputs in the next simulation.
5.2. Comparison of Different Models
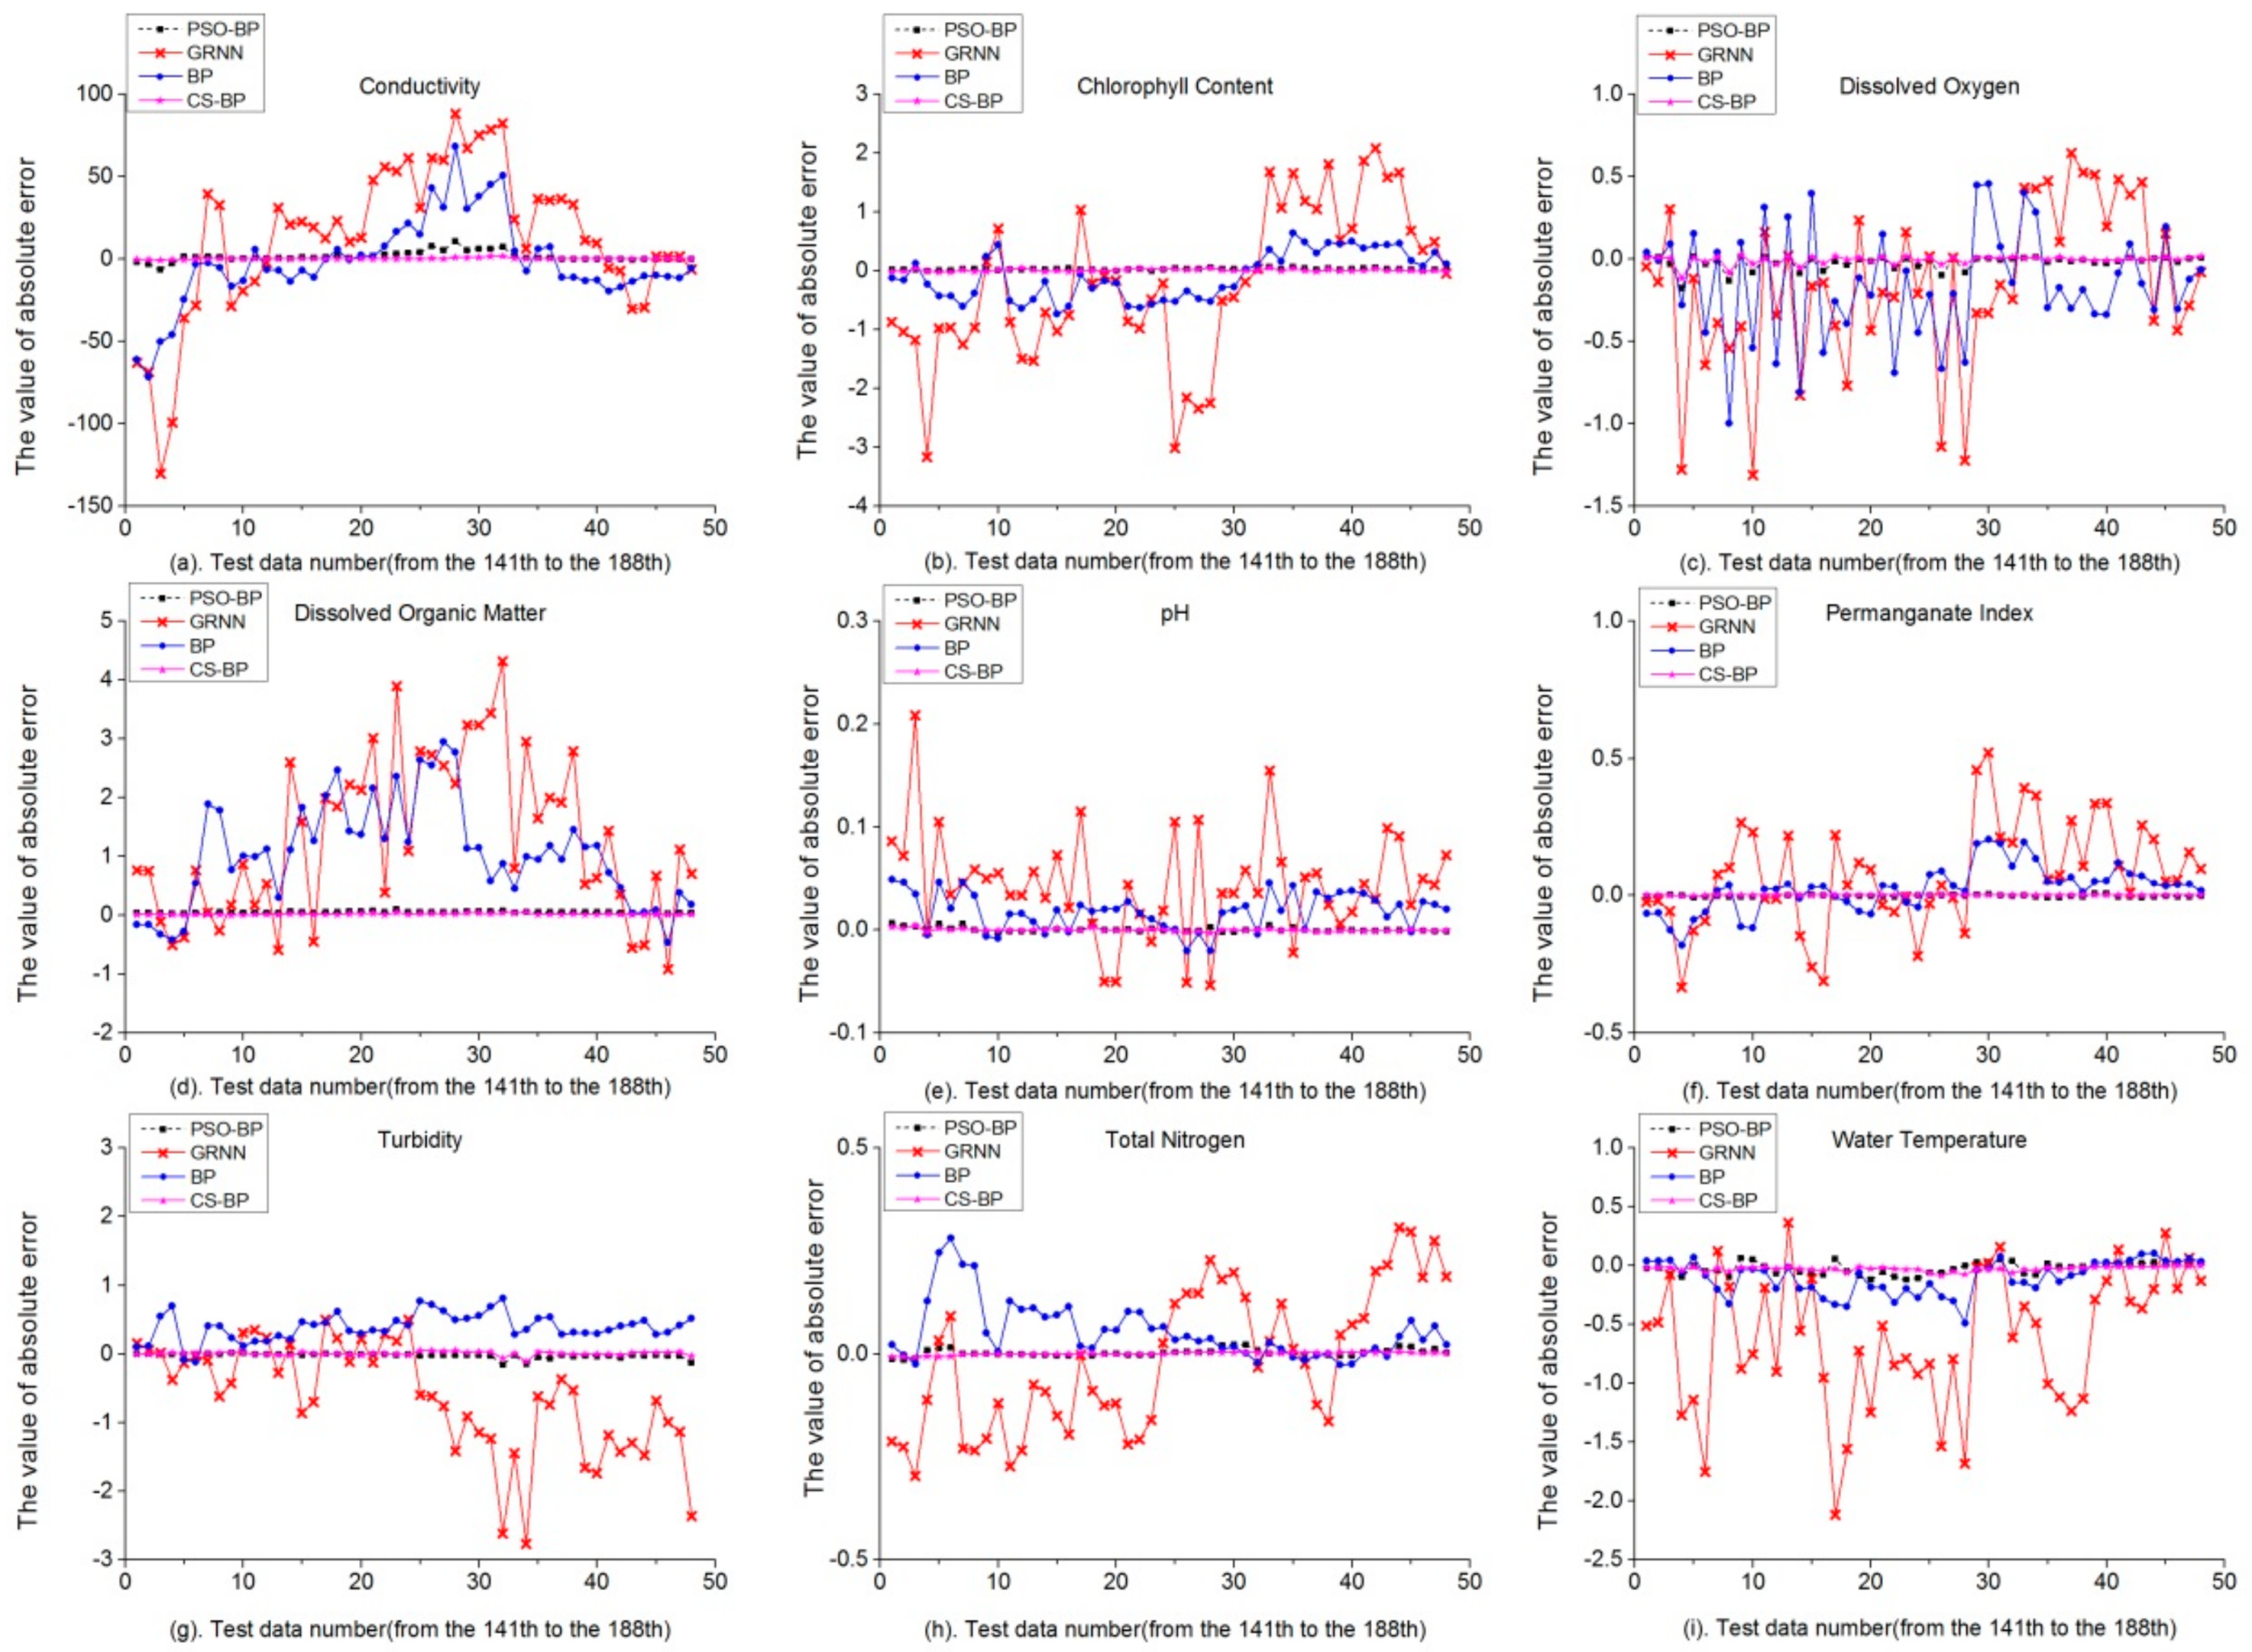
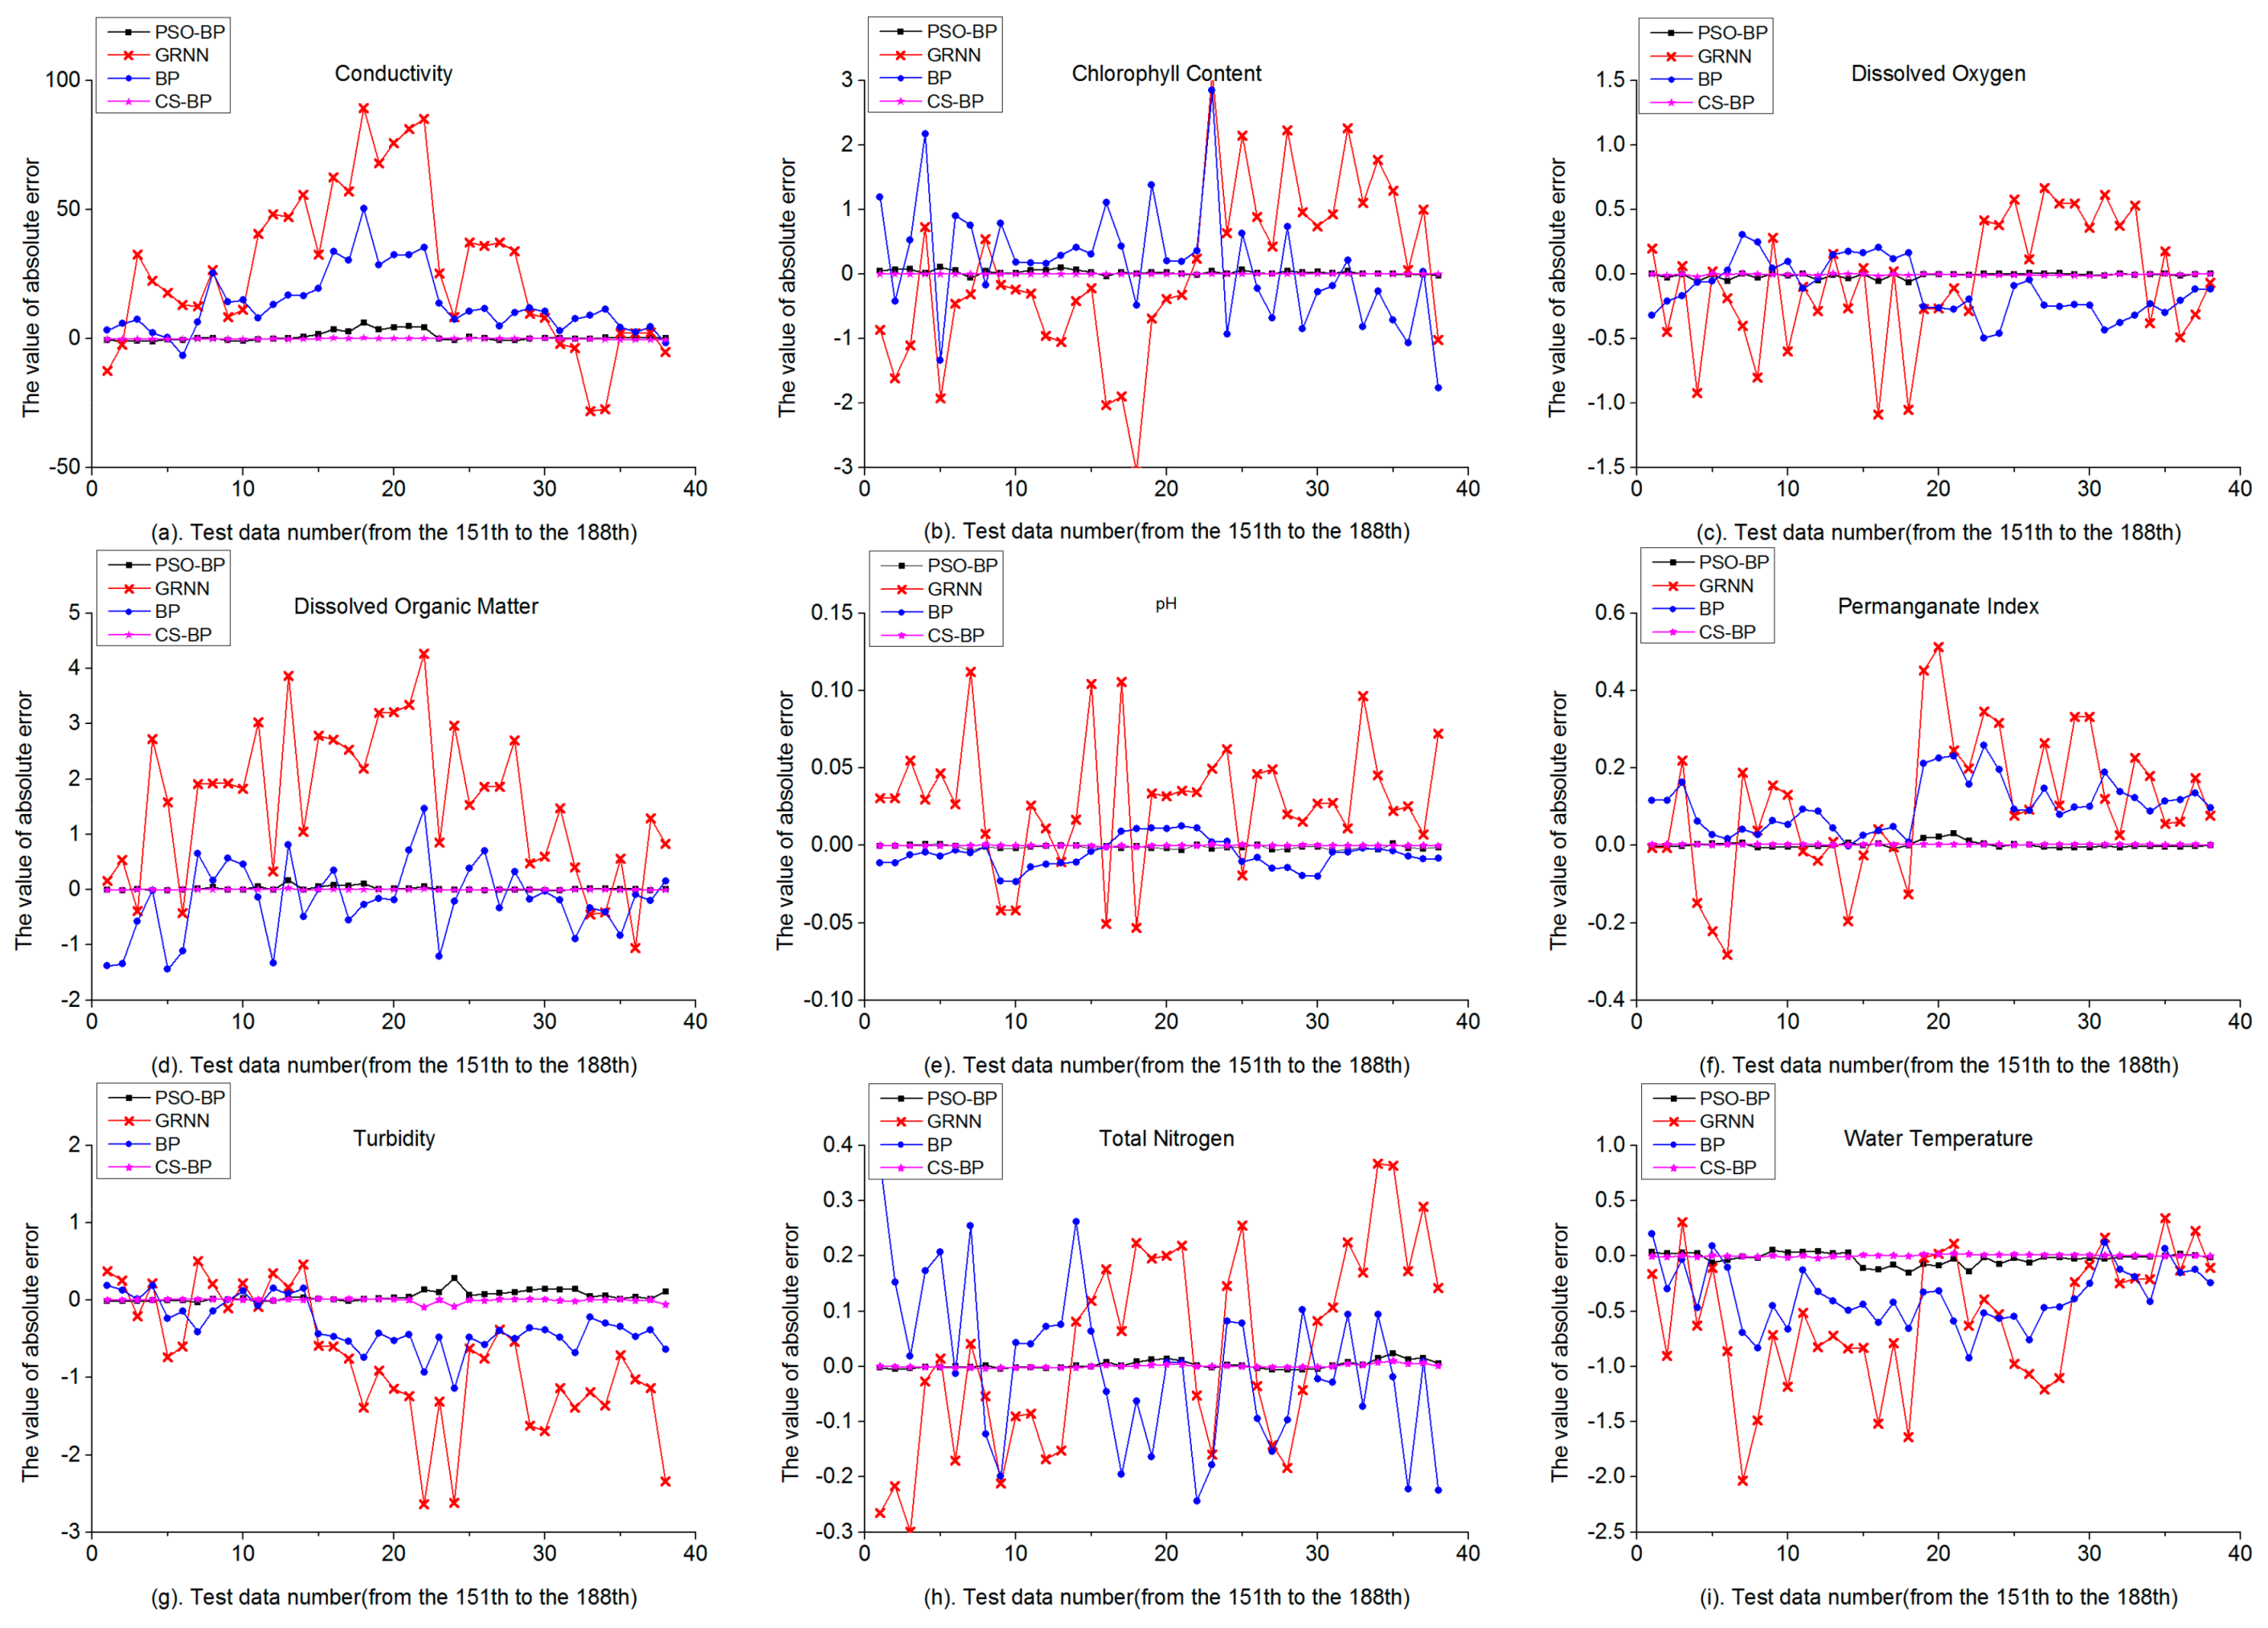
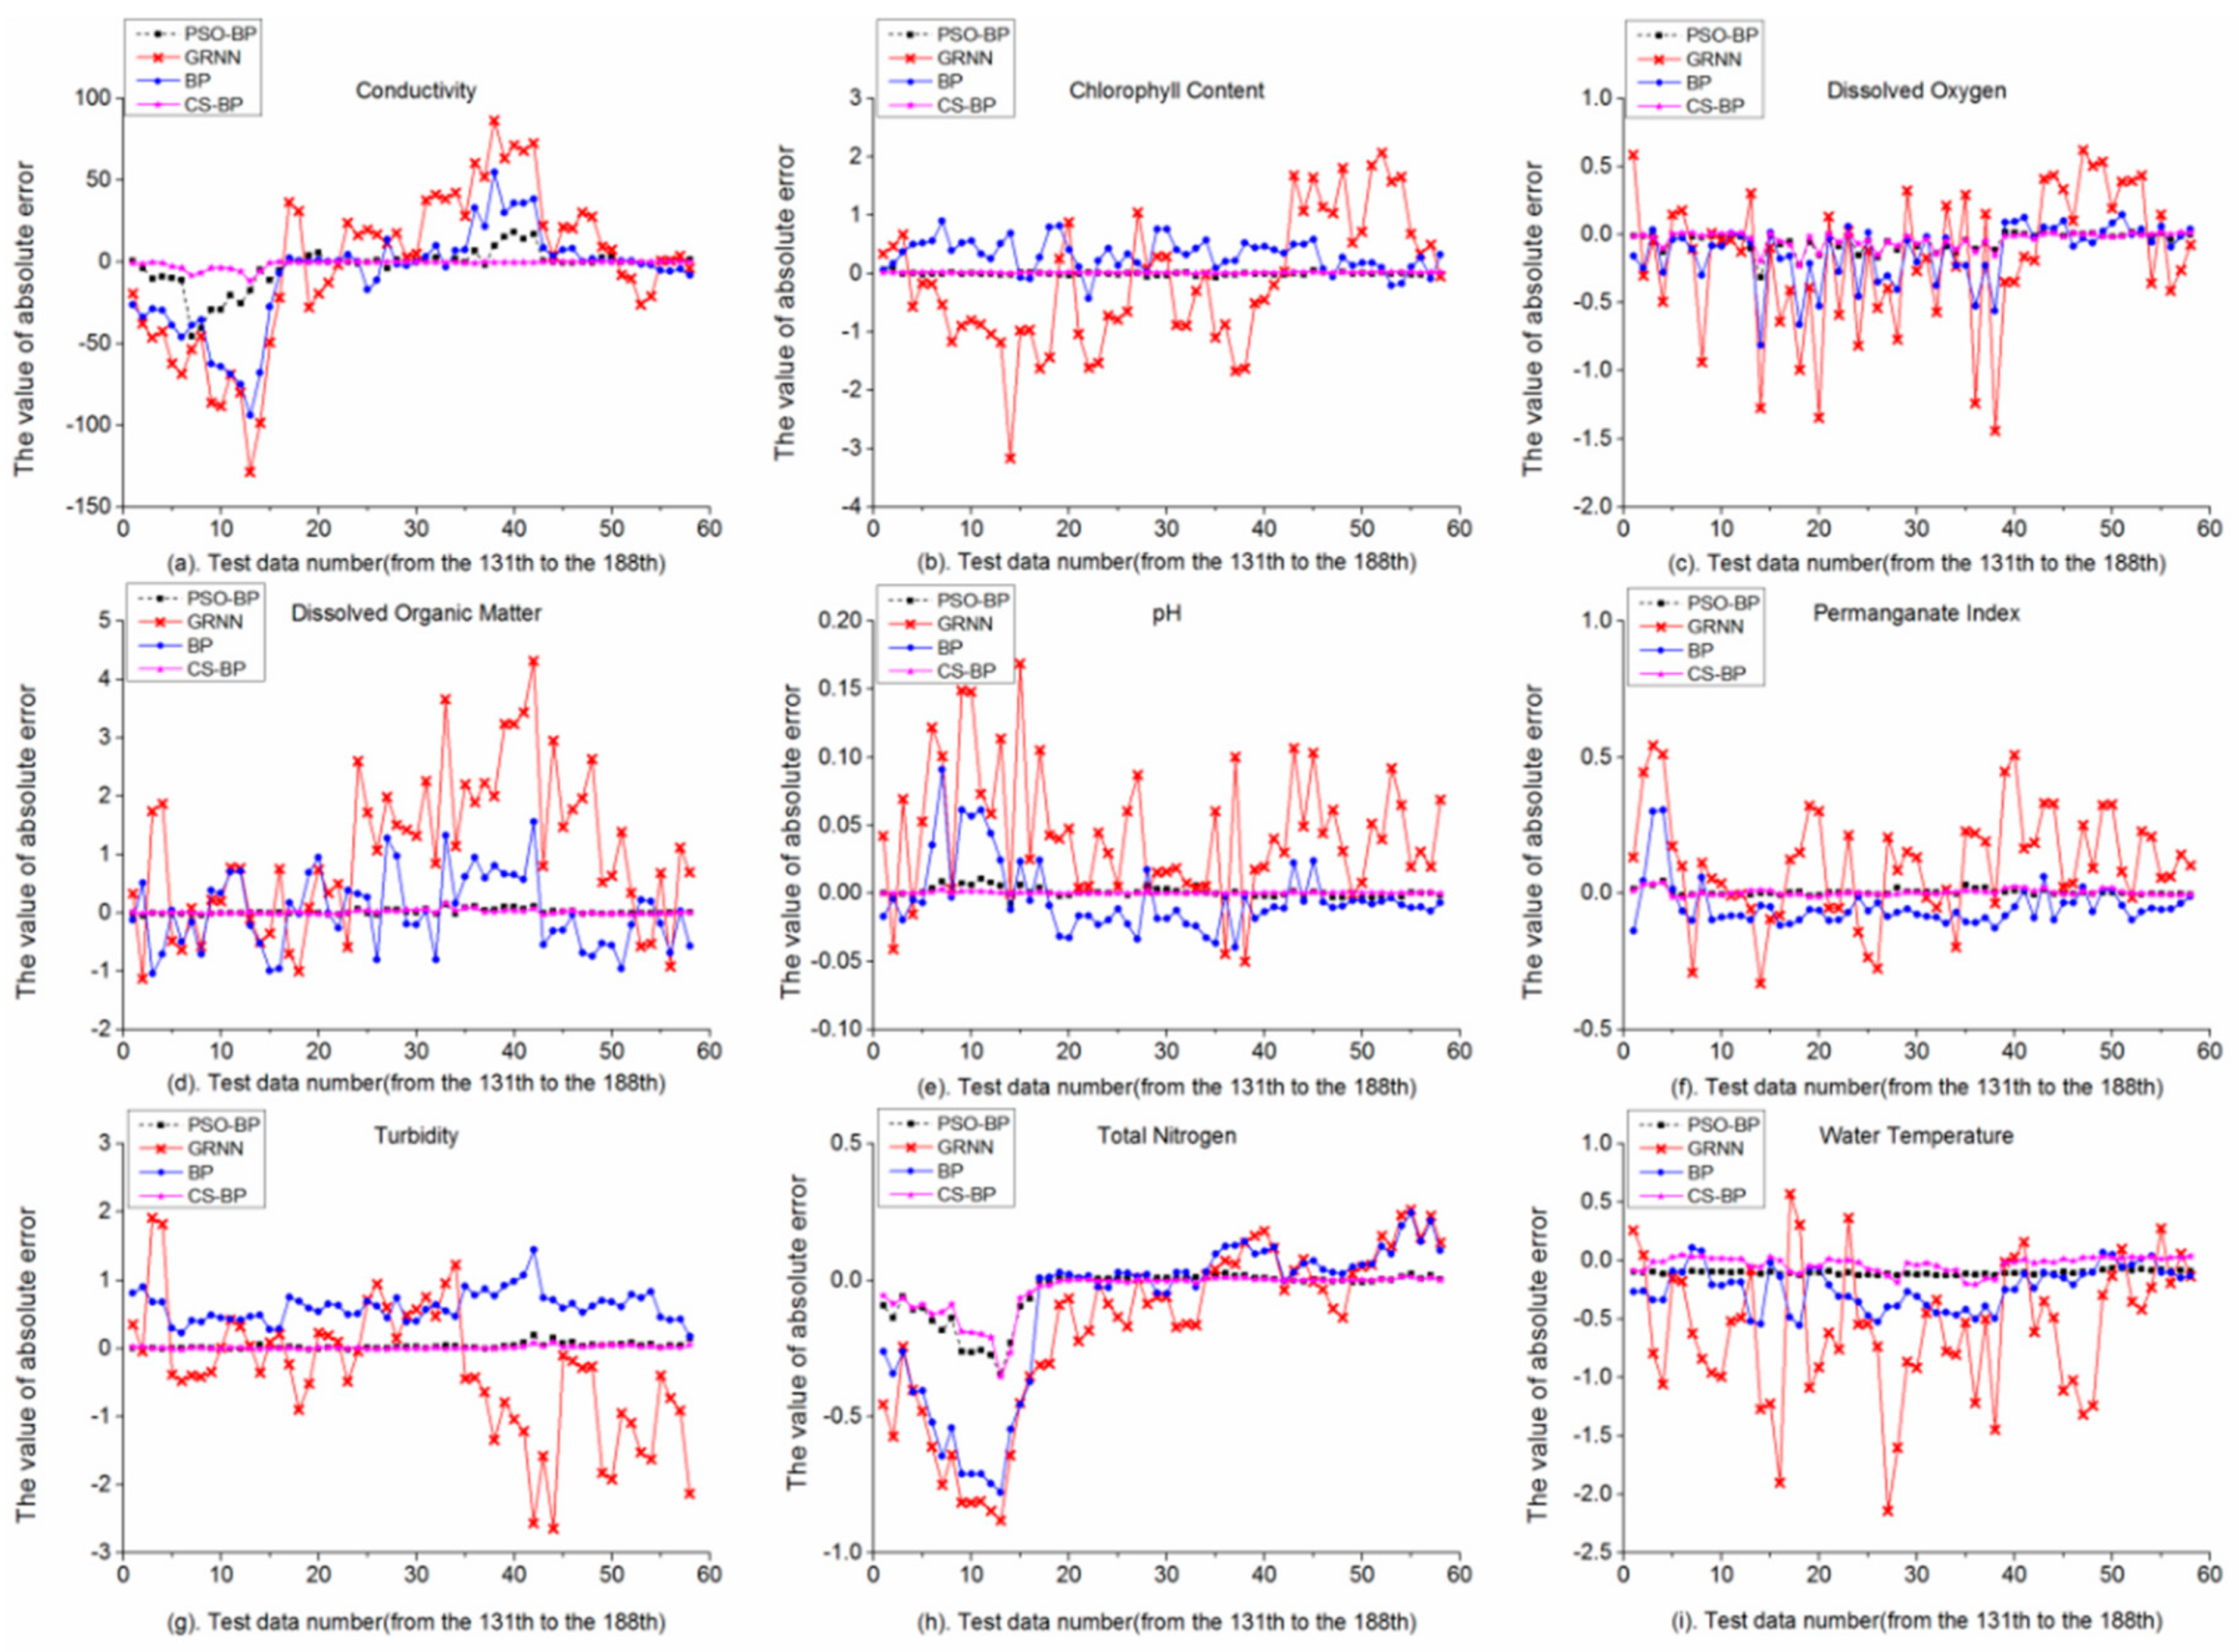
Compare the BP model and the GRNN model in
Table 6, the RMSEs of 9 water quality indicators of the BP model were all less than those of the GRNN model, the maximum RMSE was 18.0959 (CD) of the BP model, while the maximum RMSE was 40.0048 (CD) of the GRNN model. The maximum MAPE of the GRNN model was 28.154% (DOM), 1 was less than 1%, 5 were between 1% and 10%, 1 was between 10% and 20%, 2 were over 20%. The maximum MAPE of the BP model was 11.248% (TB), 1 was less than 1%, 7 were between 1% and 10%, 1 was over 10%. All the MAPEs of 9 water quality indicators of the BP model were still less than those of the GRNN model. The absolute error curves of the GRNN model were much more unstable than the BP model in
Figure 5, the most violent absolute error curve was shown in
Figure 5d, corresponding to the maximum MAPE of DOM in
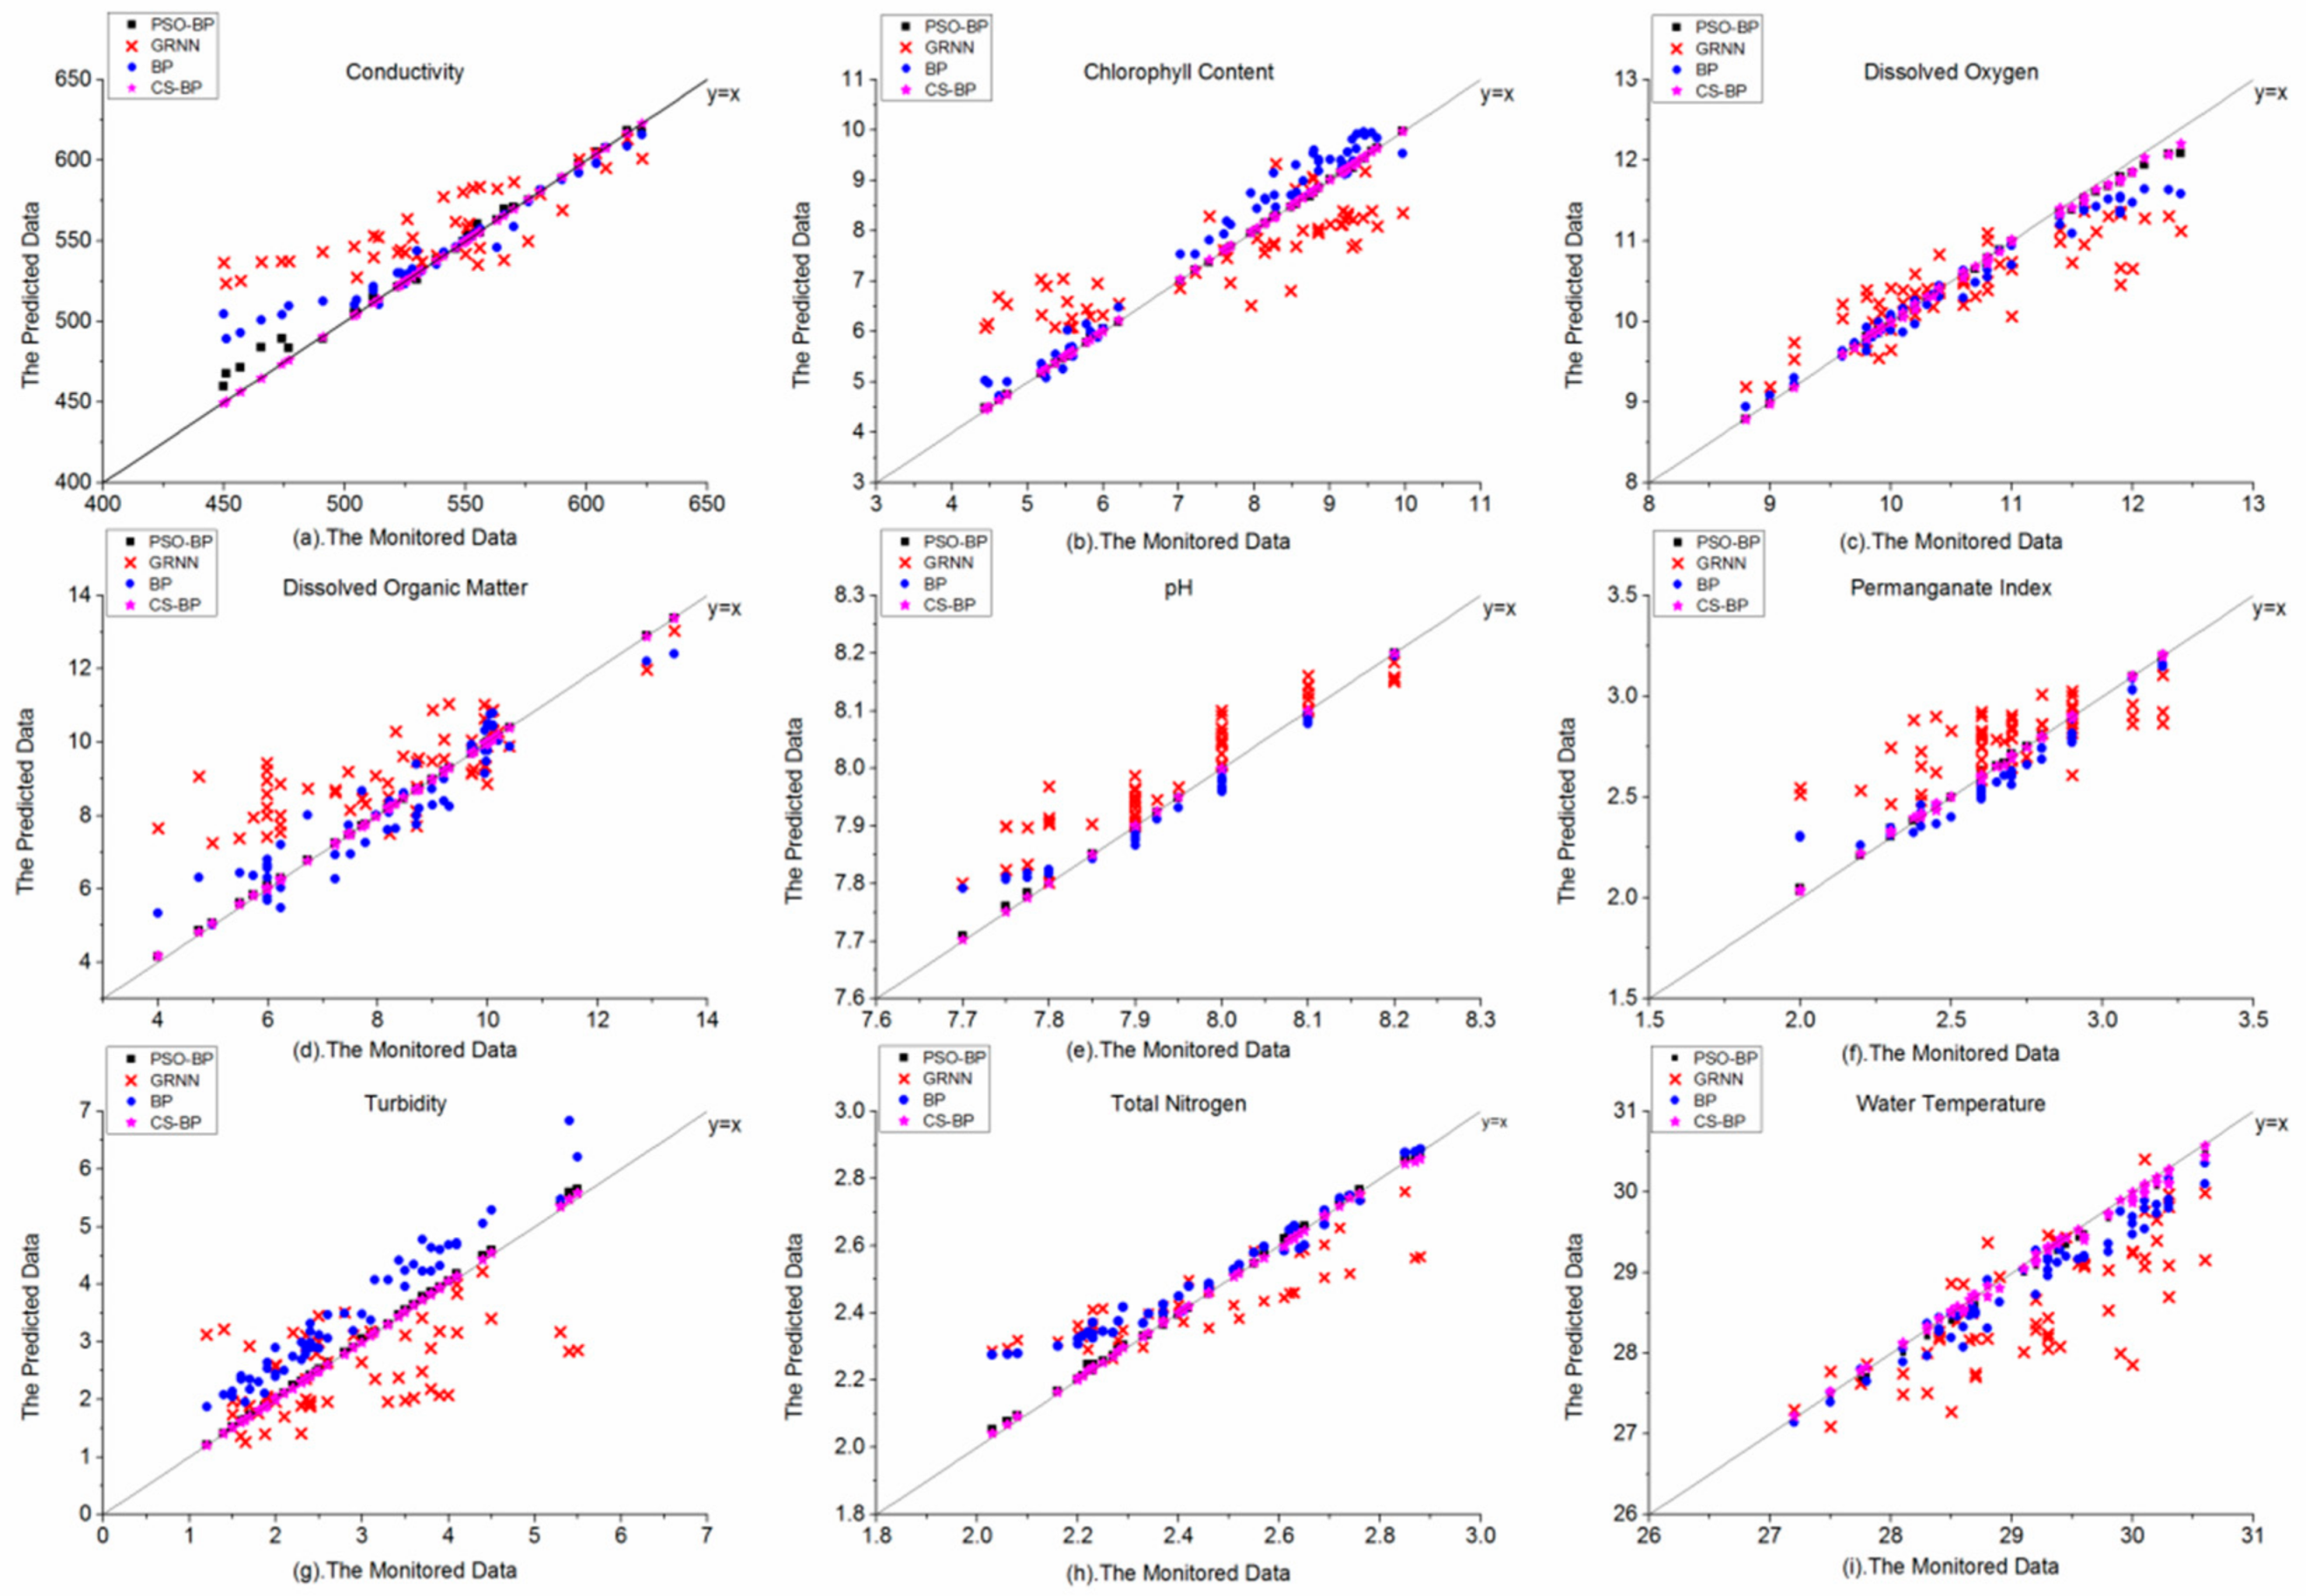
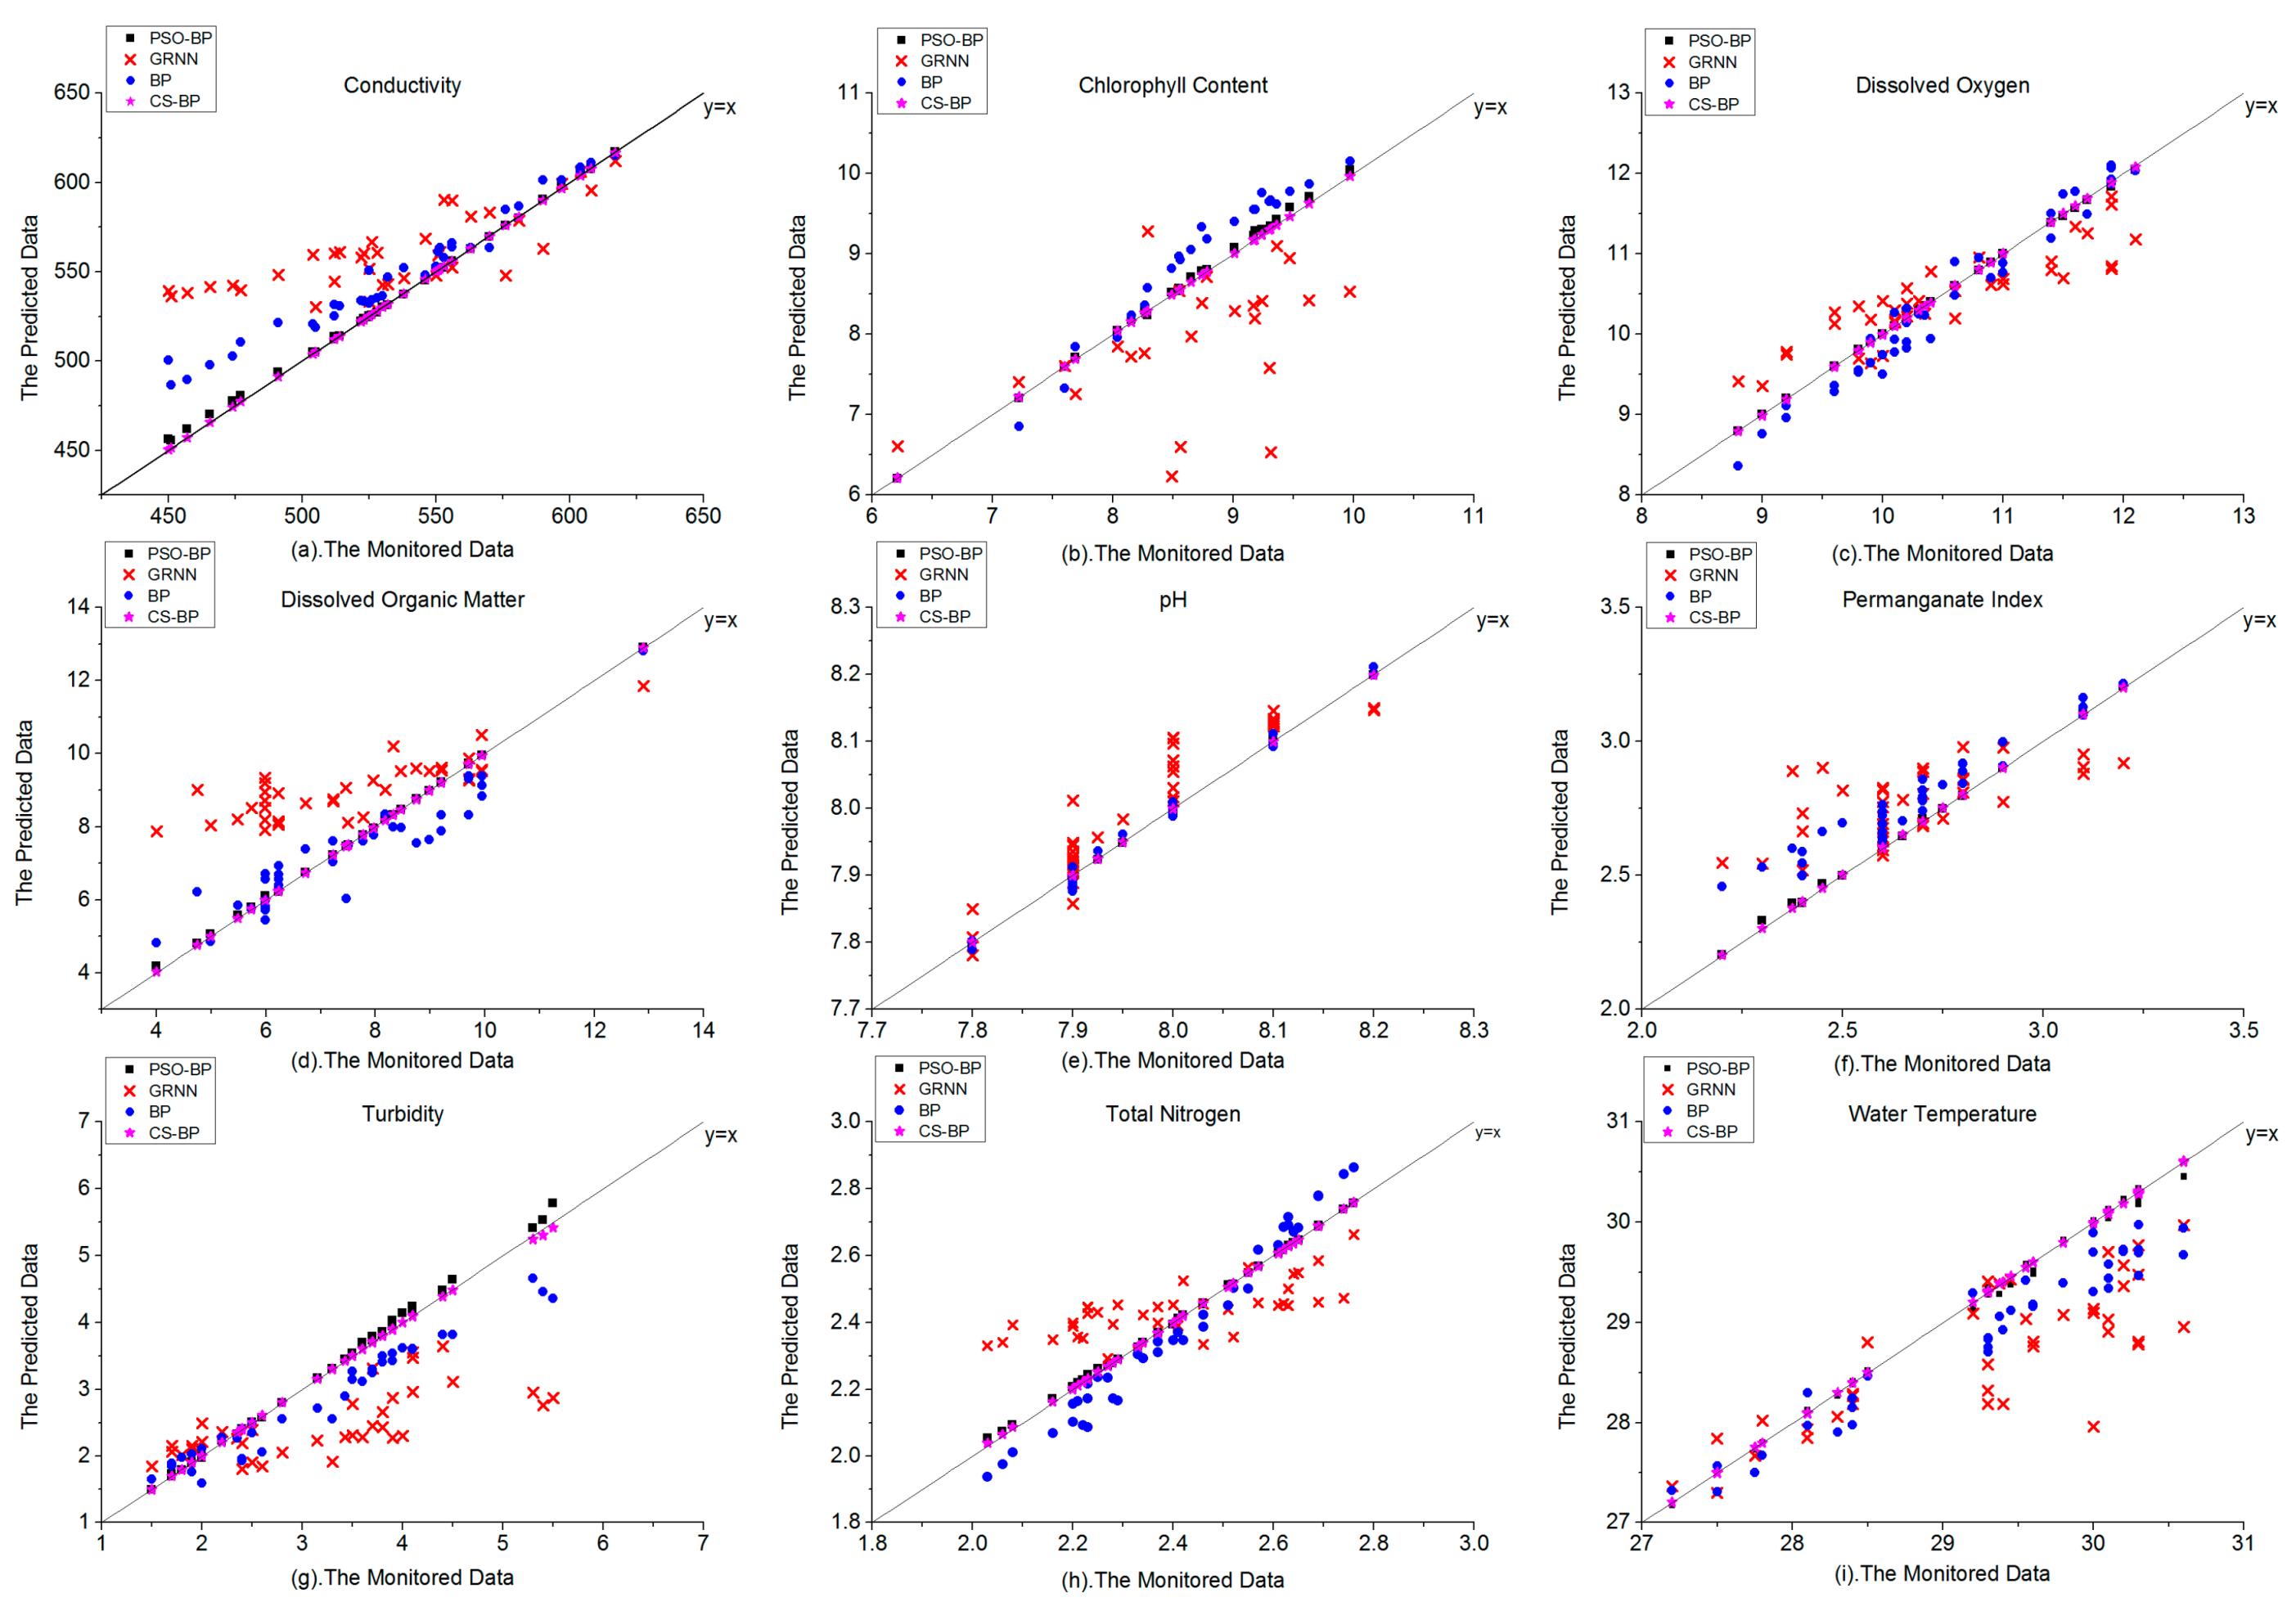
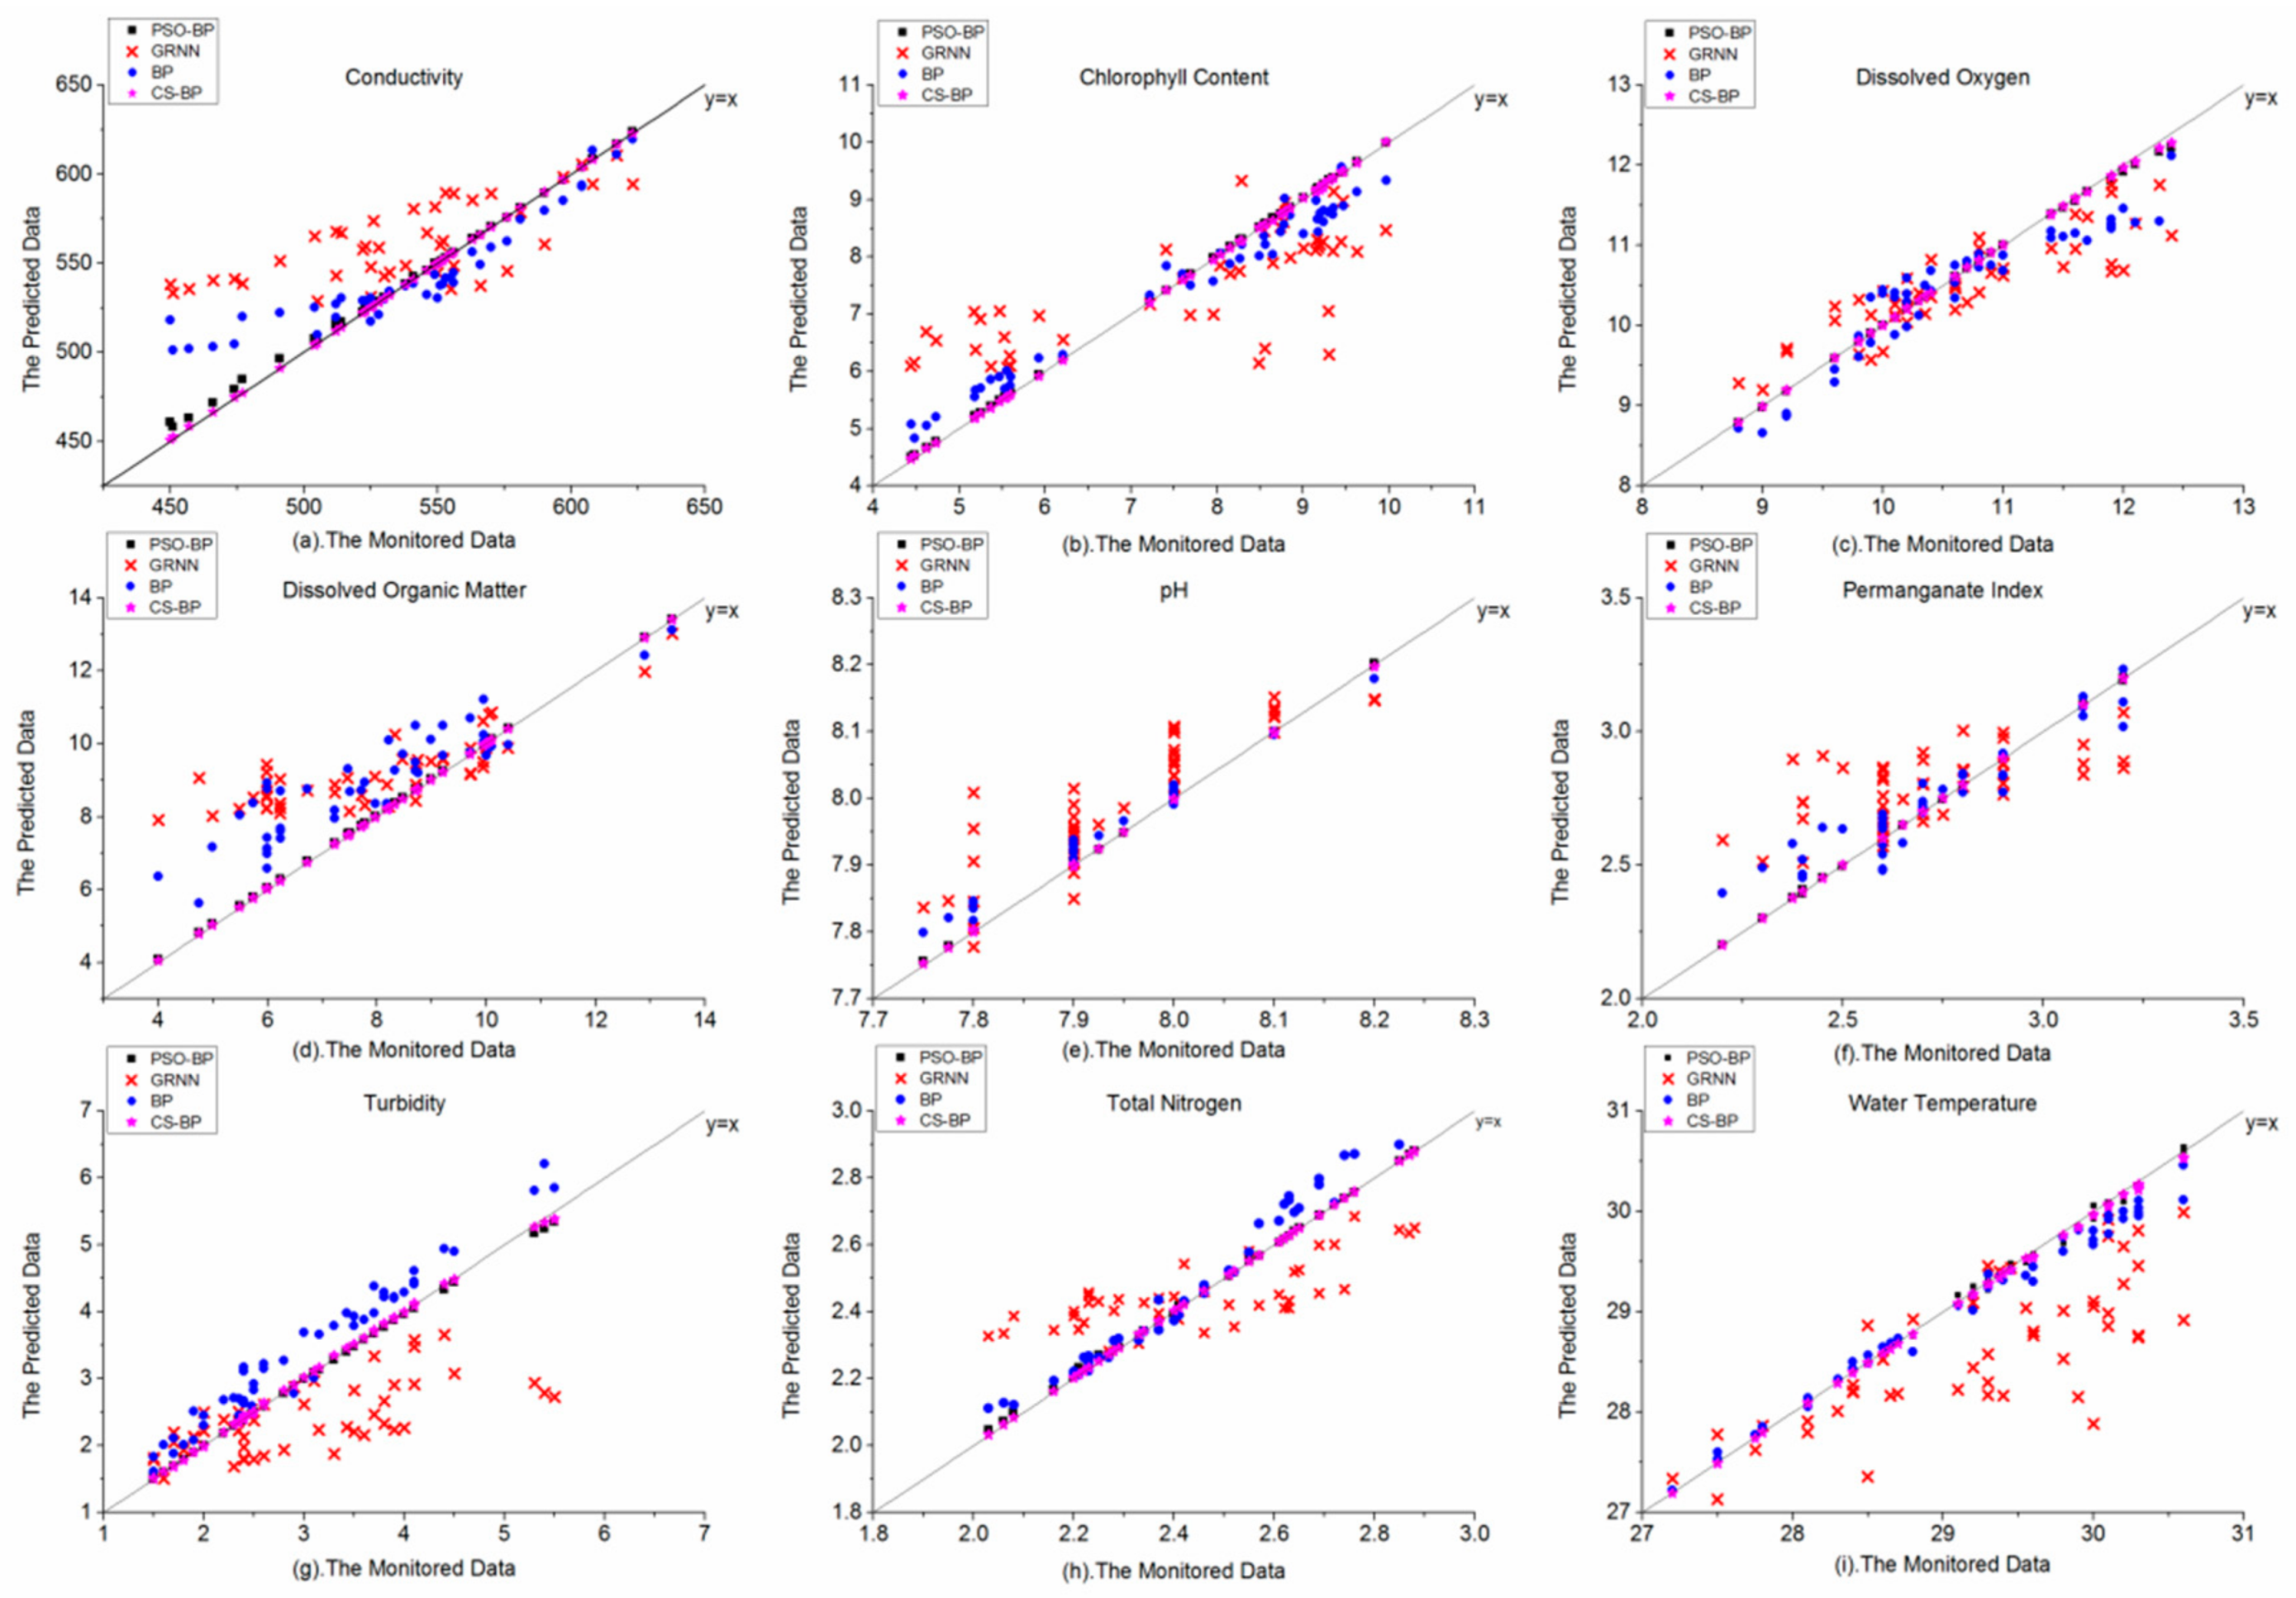
Table 6, 28.154%. Compared with the predicted data and the monitored data in
Figure 6, the points of pH of the GRNN model in
Figure 6e were concentrated on the
Y =
X line relatively well, corresponding to the lowest MAPE value of the other 8 indicators in
Table 6. The points of the GRNN model and the BP model were more scattered in
Figure 6b,d,g, corresponding to higher MAPE values than the other 6 indicators in
Table 6. It showed that the GRNN model has larger absolute error at some data points and the forecast performance of the traditional BP model was better than the GRNN model in this case study.
The CS-BP model has the lowest RMSE and MAPE values of 9 water quality indicators in
Table 6. The RMSEs of CD and CC of CS-BP model were significantly lower than those of the PSO-BP model, where the values were 0.2087:1.9634 and 0.0022:0.0456, respectively. The rest of the RMSEs of 7 indicators of CS-BP model were also lower than those of the PSO-BP model. The maximum RMSE of CS-BP model was 0.2087 (CD), while the PSO-BP model was 1.9634 (CD). The maximum MAPE of CS-BP model was 0.33% (TB), 8 were less than 0.1%, 1 was over 0.3%, while the maximum MAPE of PSO-BP model was 1.456% (TB), 1 was lower than 0.1%, 7 were between 0.1% and 1%, 1 was over 1%.
Figure 6 showed that the distribution of the predicted data and monitored data of four models, the CS-BP model still maintained the highest forecast accuracy that the points were concentrated on the
Y =
X line relatively well. In
Figure 6a,b,d,g, the PSO–BP model showed some certain errors compared with the forecast performance of the CS–BP model. The results indicated that compared with the PSO-BP model and the traditional BP model, the forecast accuracy of the CS-BP model in this case study was effectively improved.
5.3. Comparison of Different Data Proportion
In
Table 7, all the RMSE in both Part A and Part B of the BP model were still lower than the GRNN model when the training data was reduced from 140 to 130. However, the RMSE values of those two models did not increase synchronously. The RMSEs of 3 indicators (DO, PI and TN) increased of the GRNN model from Part B to Part A, while the RMSEs of 6 indicators (CD, pH, PI, TB, TN and WT) increased of the BP model. In both Part A and Part B of
Table 8, the maximum MAPE of the GRNN model was 27.59% (TB), 2 were less than 1%, 10 were between 1% and 10%, 3 were between 10% and 20%, 3 were over 20%, while the maximum MAPE of BP model was 24.087%(TB), 4 were less than 1%, 11 were between 1% and 10%, 2 were between 10% and 20%, only 1 was over 20%. These results indicated that when the training data were reduced, the forecast performances of the BP model and the GRNN model were not satisfactory. The worst forecast result was in the turbidity. The maximum increase of the MAPE of GRNN model and BP model was in turbidity. In the GRNN model, the MAPE of turbidity increased from 22.45% to 27.59%, an increase of 5.14%, and in the BP model, the MAPE of turbidity increased from 14.20% to 24.09%, an increase of 9.89%. In addition, the forecast results of the two models on dissolved organic matter (DO) and chlorophyll content (CC) were also worse than the rest of the 6 indicators. The results showed that the training data reduction has a significant impact on the GRNN model and BP model. When the training data were reduced, the accuracy of the GRNN and the traditional BP were very low and the results become unreliable. The traditional BP model and GRNN mode cannot show the ability to resist the decline of forecast accuracy caused by the reduction of training data. These results indicated that it is meaningful and necessary to improve the traditional BP model. Optimization algorithm can improve the forecast accuracy of the BP model, and can reduce the impact caused by the reduction of training data, to some certain extent.
Compared the RMSEs in Part A and Part B of the CS-BP model in
Table 7, when the training data reduced from 140 to 130, all the RMSEs of the CS-BP model were still the lowest among the four models. The RMSEs of 6 indicators (CD, DO, DOM, PI, TN, and WT) in the CS-BP model increased from Part B to Part A, while the RMSEs of 7 indicators (CD, DO, pH, PI, TB, TN, and WT) of the PSO-BP model increased from Part B to Part A. Compared the RMSEs of CS-BP model in Part A with the PSO-BP model in Part B, the RMSEs of 5 indicators (CD, CC, DOM, pH and TB) were less than those of the PSO-BP model in Part B. In
Table 8, the MAPEs of 6 indicators (CD, DO, DOM, PI, TN, and WT) increased in the CS-BP model from Part B to Part A, while 7 indicators increased in the PSO-BP model (CD, DO, pH, PI, TB, TN, and WT). The maximum MAPE of the CS-BP model in Part A was 1.154% (TN), 1 was lower than 0.1%, 6 were between 0.1% and 0.5%, 1 was between 0.5% and 1%, 1 was over 1%. The maximum MAPE of the PSO-BP model in Part B was 0.669% (DOM), 1 was lower than 0.1%, 6 were between 0.1% and 0.5%, 2 were between 0.5% and 1%. In addition, there were 5 indicators (CD, CC, DOM, pH, and TB) have lower MAPEs of the CS-BP model in Part A than those of the PSO-BP model in Part B. These results have shown that the CS-BP model still shows higher forecast accuracy than the PSO-BP model when the training data were reduced. In this case, when the training data of the CS-BP model was less the PSO-BP model, the forecast accuracy of some indicators are still higher than that of the PSO-BP model, which proved that the CS-BP model has a better ability to resist the impacts of training data reduction than the PSO-BP model.
Figure 7 and
Figure 8 showed that the absolute error curves of the GRNN model were more unstable than the BP model, corresponding to the MAPE values of the GRNN model in both Part A and Part B were larger than those of the BP model. In
Figure 7, we see that the curves of the GRNN model were more volatile than the other 3 models. In
Figure 7a, the maximum absolute errors of the GRNN model and the BP model were closed to 130 μs/cm and 95 μs/cm, respectively, and the MAPE values were almost 17% and 12%, respectively, at that data point. Similar phenomenon appeared in
Figure 7h, the MAPEs of total nitrogen of the GRNN model and the BP model were almost 22% and 19%, respectively, at the maximum absolute errors data point. The maximum increase of the MAPE of the CS-BP model and the PSO-BP model was TN, from 0.091% to 1.154%, from 0.254% to 1.494%, respectively, corresponding to the absolute error curves have obvious inflection points in
Figure 7h. We speculate that the lack of training data was the major problem of significant absolute errors and inflection points in the previous part of the curves. In
Figure 8, the absolute error curves of the GRNN model and the BP model were still unstable than the PSO-BP model and the CS-BP model, some data points have serious forecast errors. These results indicated that neither the GRNN model nor the BP model can have forecast results in Scenario 3. In
Figure 8h, there was no obvious inflection point of the CS-BP model, but it still exists in the PSO-BP model. The result also reflected the ability of the CS-BP model to resist training data shortage. Overall,
Figure 7 and
Figure 8 indicated that the curves of the PSO-BP model and the CS-BP model were stable, representing more accurately forecast results. Meanwhile, the CS-BP model shows better adaptability than the PSO-BP model, when training data were reduced.
Figure 9 and
Figure 10 showed that the distribution of the predicted data and monitored data of the GRNN model and the BP model are more scattered than the CS-BP model and the PSO-BP model. In
Figure 9, the points of the GRNN model of
Figure 9b,d,g were very fragmented, corresponding to higher MAPEs in CC, DOM, and TB than other models in
Table 8. Similar phenomena occurred in
Figure 10, these results indicated that the forecast performance of the GRNN model was poor in this case, using the CS algorithm to improve the GRNN model needs to be studied in the future. In addition, although the traditional BP model performed more accurately than the GRNN model in this case, the accuracy of some indicators such as turbidity and chlorophyll content still unsatisfactory as the
Figure 9b,d and
Figure 10b,d have shown. The training data reduction lead to the reduction of forecast accuracy. When the CS-BP model has less training data than the PSO-BP model, the CS-BP model still has better forecast accuracy than the PSO-BP model in some water quality indicators (CD, CC, DOM, pH, and TB).
In summary, the CS-BP model performed best in forecasting each water quality indicator in this case and the CS-BP model can be used to forecast daily water quality with limited observed data condition, such as the South-to-North Water Diversion Project of China.
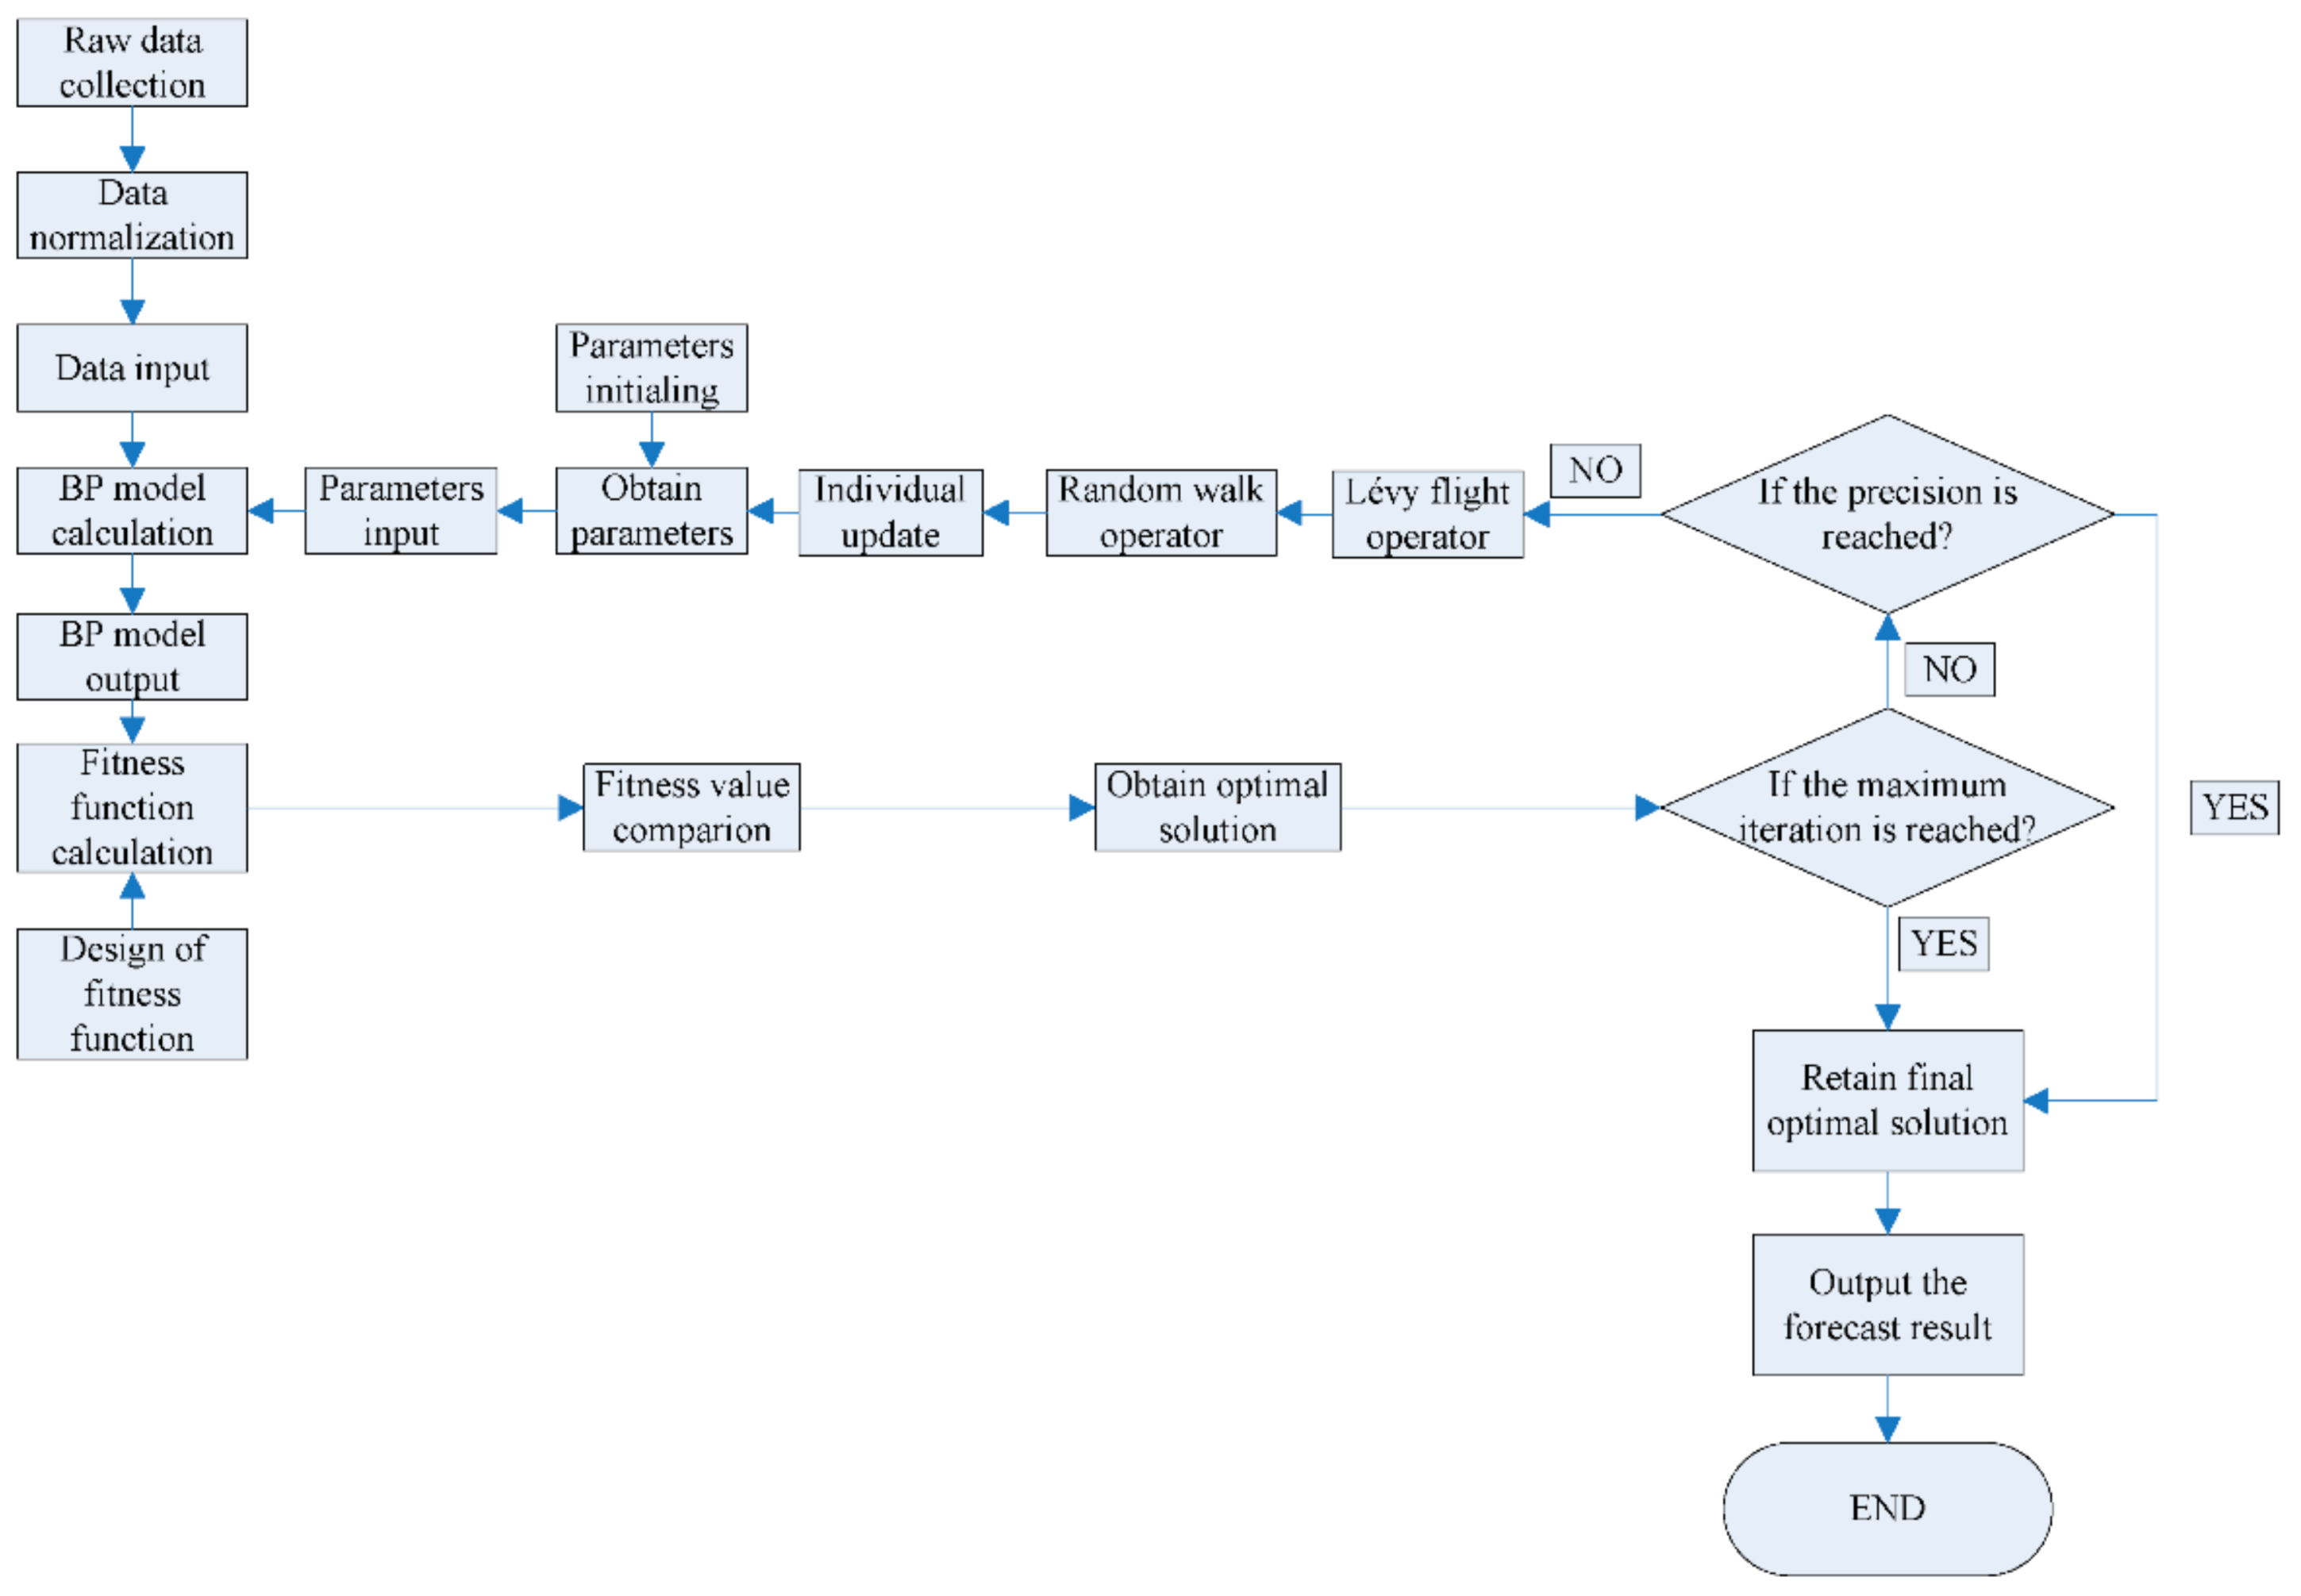
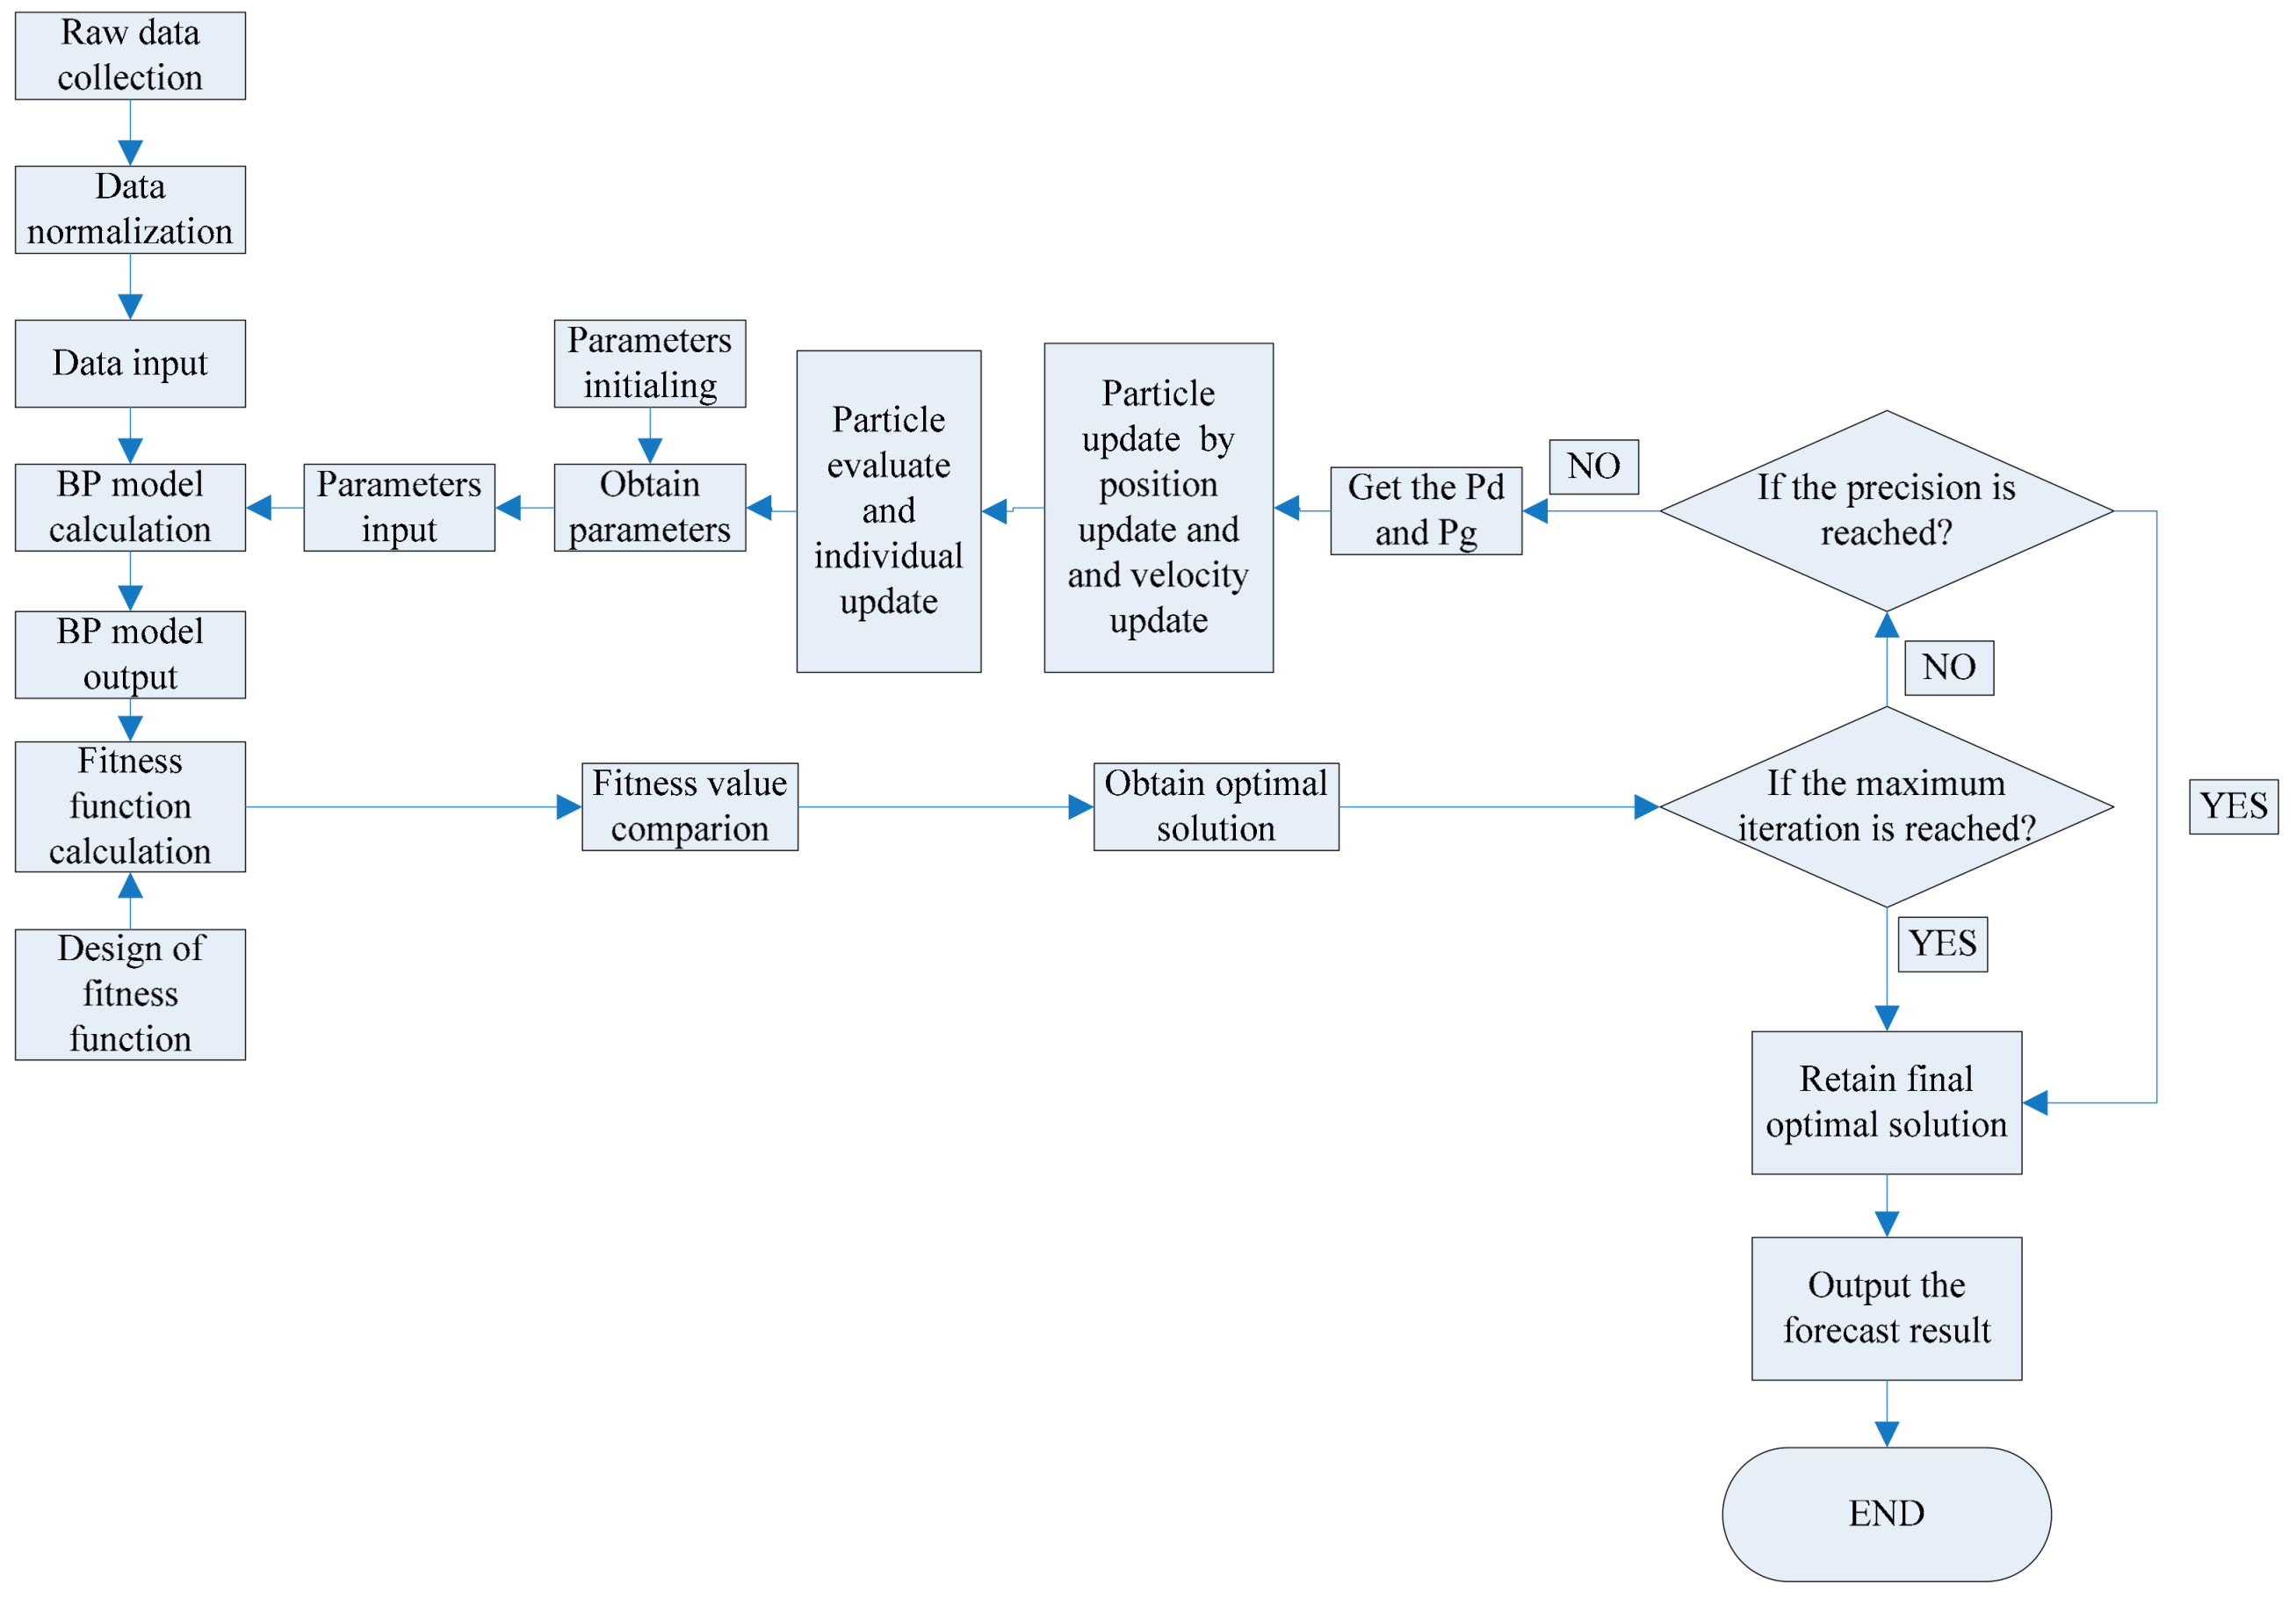
5.4. Discussion of the CS-BP Model
Comparing the forecast performance of the CS-BP model and the BP model, it can be seen that the forecast accuracy of the CS-BP model is much higher than that of traditional BP model. The reason is that the traditional BP models have some intrinsic drawbacks such as calculation instability and low convergence efficiency, which will reduce the forecast accuracy of the models. The application of intelligent optimization algorithm is more efficient than the traditional BP model random calculation, and can quickly obtain the weights and thresholds for a specific problem, which is also the current research hotspot of the BP model. Comparing the CS-BP model with PSO-BP model, it can be seen that the calculation flows of the two models are basically the same, and the methods and principles are also similar. The difference of the accuracy of the forecast results of the two models may be due to the difference of the optimization algorithm themselves. The PSO was invented earlier than the CS, and the traditional PSO also has some computational defects. Over the years, many scholars have studied the improvement of the PSO. The optimization mechanism of the CS algorithm ensures that the algorithm has the advantages of higher search efficiency and faster calculation speed, which is also the reason that the CS-BP model has higher forecast accuracy than the PSO-BP model. In previous research, many scholars have proved that the CS algorithm is more efficient than the PSO. However, the CS algorithm is not an algorithm without defects. Later, more in-depth research on the improvement of the CS algorithm is needed.
There are also some drawbacks in this study, such as the lack of in-depth study on the impact of land management on the water quality of the MR SNWDPC, as well as an in-depth study on the regularity of water quality periodic changes; these are the research directions for further study. Some other research directions are also to improve CS algorithm and its coupling with some mechanism models, and to study the impact of various environmental factors on the South-to-North Water Diversion Project. According to this study, the CS-BP model can not only be applied to water quality forecast, but also be worth popularizing to other forecast problems, such as food production prediction, population prediction, and other issues when input factors are selected appropriately.


