Article

Groundwater Augmentation through the Site Selection of Floodwater Spreading Using a Data Mining Approach (Case study: Mashhad Plain, Iran)

1
Department of Watershed Management Engineering, Faculty of Natural Resources, Tarbiat Modares University, Noor 46414-356, Iran
2
Department of Water Resources Engineering & Center for Middle Eastern Studies, Lund University, Box 201, 221 00 Lund, Sweden
3
The Centre for Advanced Modeling and Geospatial Information Systems (CAMGIS), Faculty of Engineering and IT, University of Technology Sydney, Sydney, NSW 2007, Australia
4
Department of Energy and Mineral Resources Engineering, Choongmu-gwan, Sejong University, 209 Neungdong ro Gwangjin-gu, Seoul 05006, Korea
5
Department of Forestry, College of Natural Resources, Tarbiat Modares University, Noor 46414-356, Iran
*
Author to whom correspondence should be addressed.
Water 2018, 10(10), 1405; https://doi.org/10.3390/w10101405
Submission received: 22 August 2018 / Revised: 2 October 2018 / Accepted: 2 October 2018 / Published: 10 October 2018
(This article belongs to the Special Issue Flood Modelling: Regional Flood Estimation and GIS Based Techniques)

Abstract

:
It is a well-known fact that sustainable development goals are difficult to achieve without a proper water resources management strategy. This study tries to implement some state-of-the-art statistical and data mining models i.e., weights-of-evidence (WoE), boosted regression trees (BRT), and classification and regression tree (CART) to identify suitable areas for artificial recharge through floodwater spreading (FWS). At first, suitable areas for the FWS project were identified in a basin in north-eastern Iran based on the national guidelines and a literature survey. Using the same methodology, an identical number of FWS unsuitable areas were also determined. Afterward, a set of different FWS conditioning factors were selected for modeling FWS suitability. The models were applied using 70% of the suitable and unsuitable locations and validated with the rest of the input data (i.e., 30%). Finally, a receiver operating characteristics (ROC) curve was plotted to compare the produced FWS suitability maps. The findings depicted acceptable performance of the BRT, CART, and WoE for FWS suitability mapping with an area under the ROC curves of 92, 87.5, and 81.6%, respectively. Among the considered variables, transmissivity, distance from rivers, aquifer thickness, and electrical conductivity were determined as the most important contributors in the modeling. FWS suitability maps produced by the proposed method in this study could be used as a guideline for water resource managers to control flood damage and obtain new sources of groundwater. This methodology could be easily replicated to produce FWS suitability maps in other regions with similar hydrogeological conditions.

1. Introduction

A major part of Iran falls under arid and semi-arid climates with a low amount of precipitation, high temperature, and high evapotranspiration rates [1]. Iran receives only one-third of the average annual rainfall in the world [2]. Spatial and temporal variations of rainfall in Iran do not have a good temporal harmony with the farming season. Annually, thirty out of forty natural disasters in the world occur in this country [1]. Among those, flooding has been proved to be the most frequent and damaging one [3]. Floods are regarded as the most frequent natural disaster in the past years and have resulted in a huge amount of social, environmental, and economic losses [4,5]. Regarding the undesirable situation of water resources in Iran and many other countries in the Middle East, achieving sustainable development is becoming more difficult and immediate action is needed to change the situation. A good solution for this would be an implementation of floodwater spreading (FWS) system, which has two main goals: (i) controlling floods and reducing the damage they cause, and (ii) recharging groundwater (GW) by infiltrating surface water into the ground. Water managers need to consider several factors and guidelines in order to select the best locations for FWS construction. The FWS system is an economical method for artificial recharge, especially in developing countries, for sustainable GW management [6]. FWS systems secure the water demand for different needs, such as agriculture, by raising the water table [7].
Over the years, researchers have used different methods to determine FWS suitable areas. To do this, many data mining and statistical techniques including decision support systems [8,9], Boolean logic [10,11,12,13,14], Fuzzy logic [10,11,12,13], the index overlay method [11], the analytic hierarchy process [15,16,17,18], the multi influencing factor [19], the weighted index overlay [20,21], PROMETHEEII (Preference Ranking Organization METHod for Enrichment Evaluation) [16], and multi-criteria decision-making [18] have been used to select the best locations for artificial recharge through the FWS systems and other recharge techniques. Among those models, the analytic hierarchy process and fuzzy logic have repeatedly been reported as the best models in determining FWS suitability [9,11,13,15]. Generally, researchers have implemented a number of conditioning factors to select the best locations for artificial recharge methods. Those factors include slope, land use, soil infiltration, aquifer thickness, geology, soil, geomorphology, electrical conductivity (EC), aquifer transmissivity, and drainage density.
The aforementioned models are considered expert judgment-based. There are certain issues in the application of expert judgment-based models in spatial modeling. For instance, all the aforementioned models are on the basis of expert judgment, and at least at one stage of the modeling process can be affected by human-related errors. These models work with strict rules (i.e., weights of the factors classes), and do not have the flexibility to detect non-linear relationships between input and output variables. Moreover, there are some uncertainties related to the experts’ knowledge on the issue, which increase the error of these models in the hydrogeological system. One important disadvantage of multi-criteria evaluation is the risk of their implementation as a “scientific sauce” for decisions that have already been made [22]. Hence, modeling and validation procedures do not extract any further information from datasets and only validate the suggested methodology. Another problem is that developing questionnaires and interviewing stakeholders is a time-consuming process [23]. Expert judgment-based models deal with only a limited number of FWS conditioning factors in selecting suitable areas for FWS construction and are hardly able to work with the complex hydrogeological system of a watershed.
On the other hand, data mining techniques are used for a variety of purposes such as regression, classification, and survival assessment. An increasing trend of the application of data mining models exists in various studies on environmental protection, hazard assessment, and management strategies. Data mining models are able to recognize nonlinear patterns [24]. Decision trees are a new branch of data mining models that have been implemented in different fields of study. As a part of data mining models, decision tree-based models try to extract information from different input variables, both numerical and categorical. Boosted regression trees (BRT), and classification and regression tree (CART) are two tree-based algorithms that have been successfully applied for many classification issues such as landslide susceptibility mapping [25], and GW potential mapping [24,26,27]. All the mentioned publications have reported an acceptable performance of BRT and CART algorithms in their studies. Weights-of-evidence (WoE) on the other hand is on the basis of Bayesian theory and has been successfully used in flood susceptibility modeling [28], landslide susceptibility mapping [29,30,31,32,33,34], and land use modeling [35,36].
In the above literature, it can be seen that the previous studies on FWS suitability mapping have mainly concentrated on using models which are totally based on expert judgment or at least to some extent are affected by them. By reviewing the published papers in different spatial issues, it can be observed that there is a shift from simple statistical procedures that suffer from expert judgment-related errors to more complex data mining approaches that are able to extract information from different input variables. However, these models have not yet been used in FWS suitability mapping. To fill the research gap, the current study tries to reduce the related errors of expert judgment through the application of data mining models. Thus, the main novelty of this research is the application of three state-of-the-art models in FWS suitability mapping: the BRT, CART, and WoE methods. Consequently, the objectives of this research are: (i) selecting suitable areas for FWS systems by the BRT, CART, and WoE algorithms, (ii) ranking the importance of FWS conditioning factors by the BRT and CART algorithms, and (iii) extracting the relationships between FWS suitability and its conditioning factors by the WoE model.

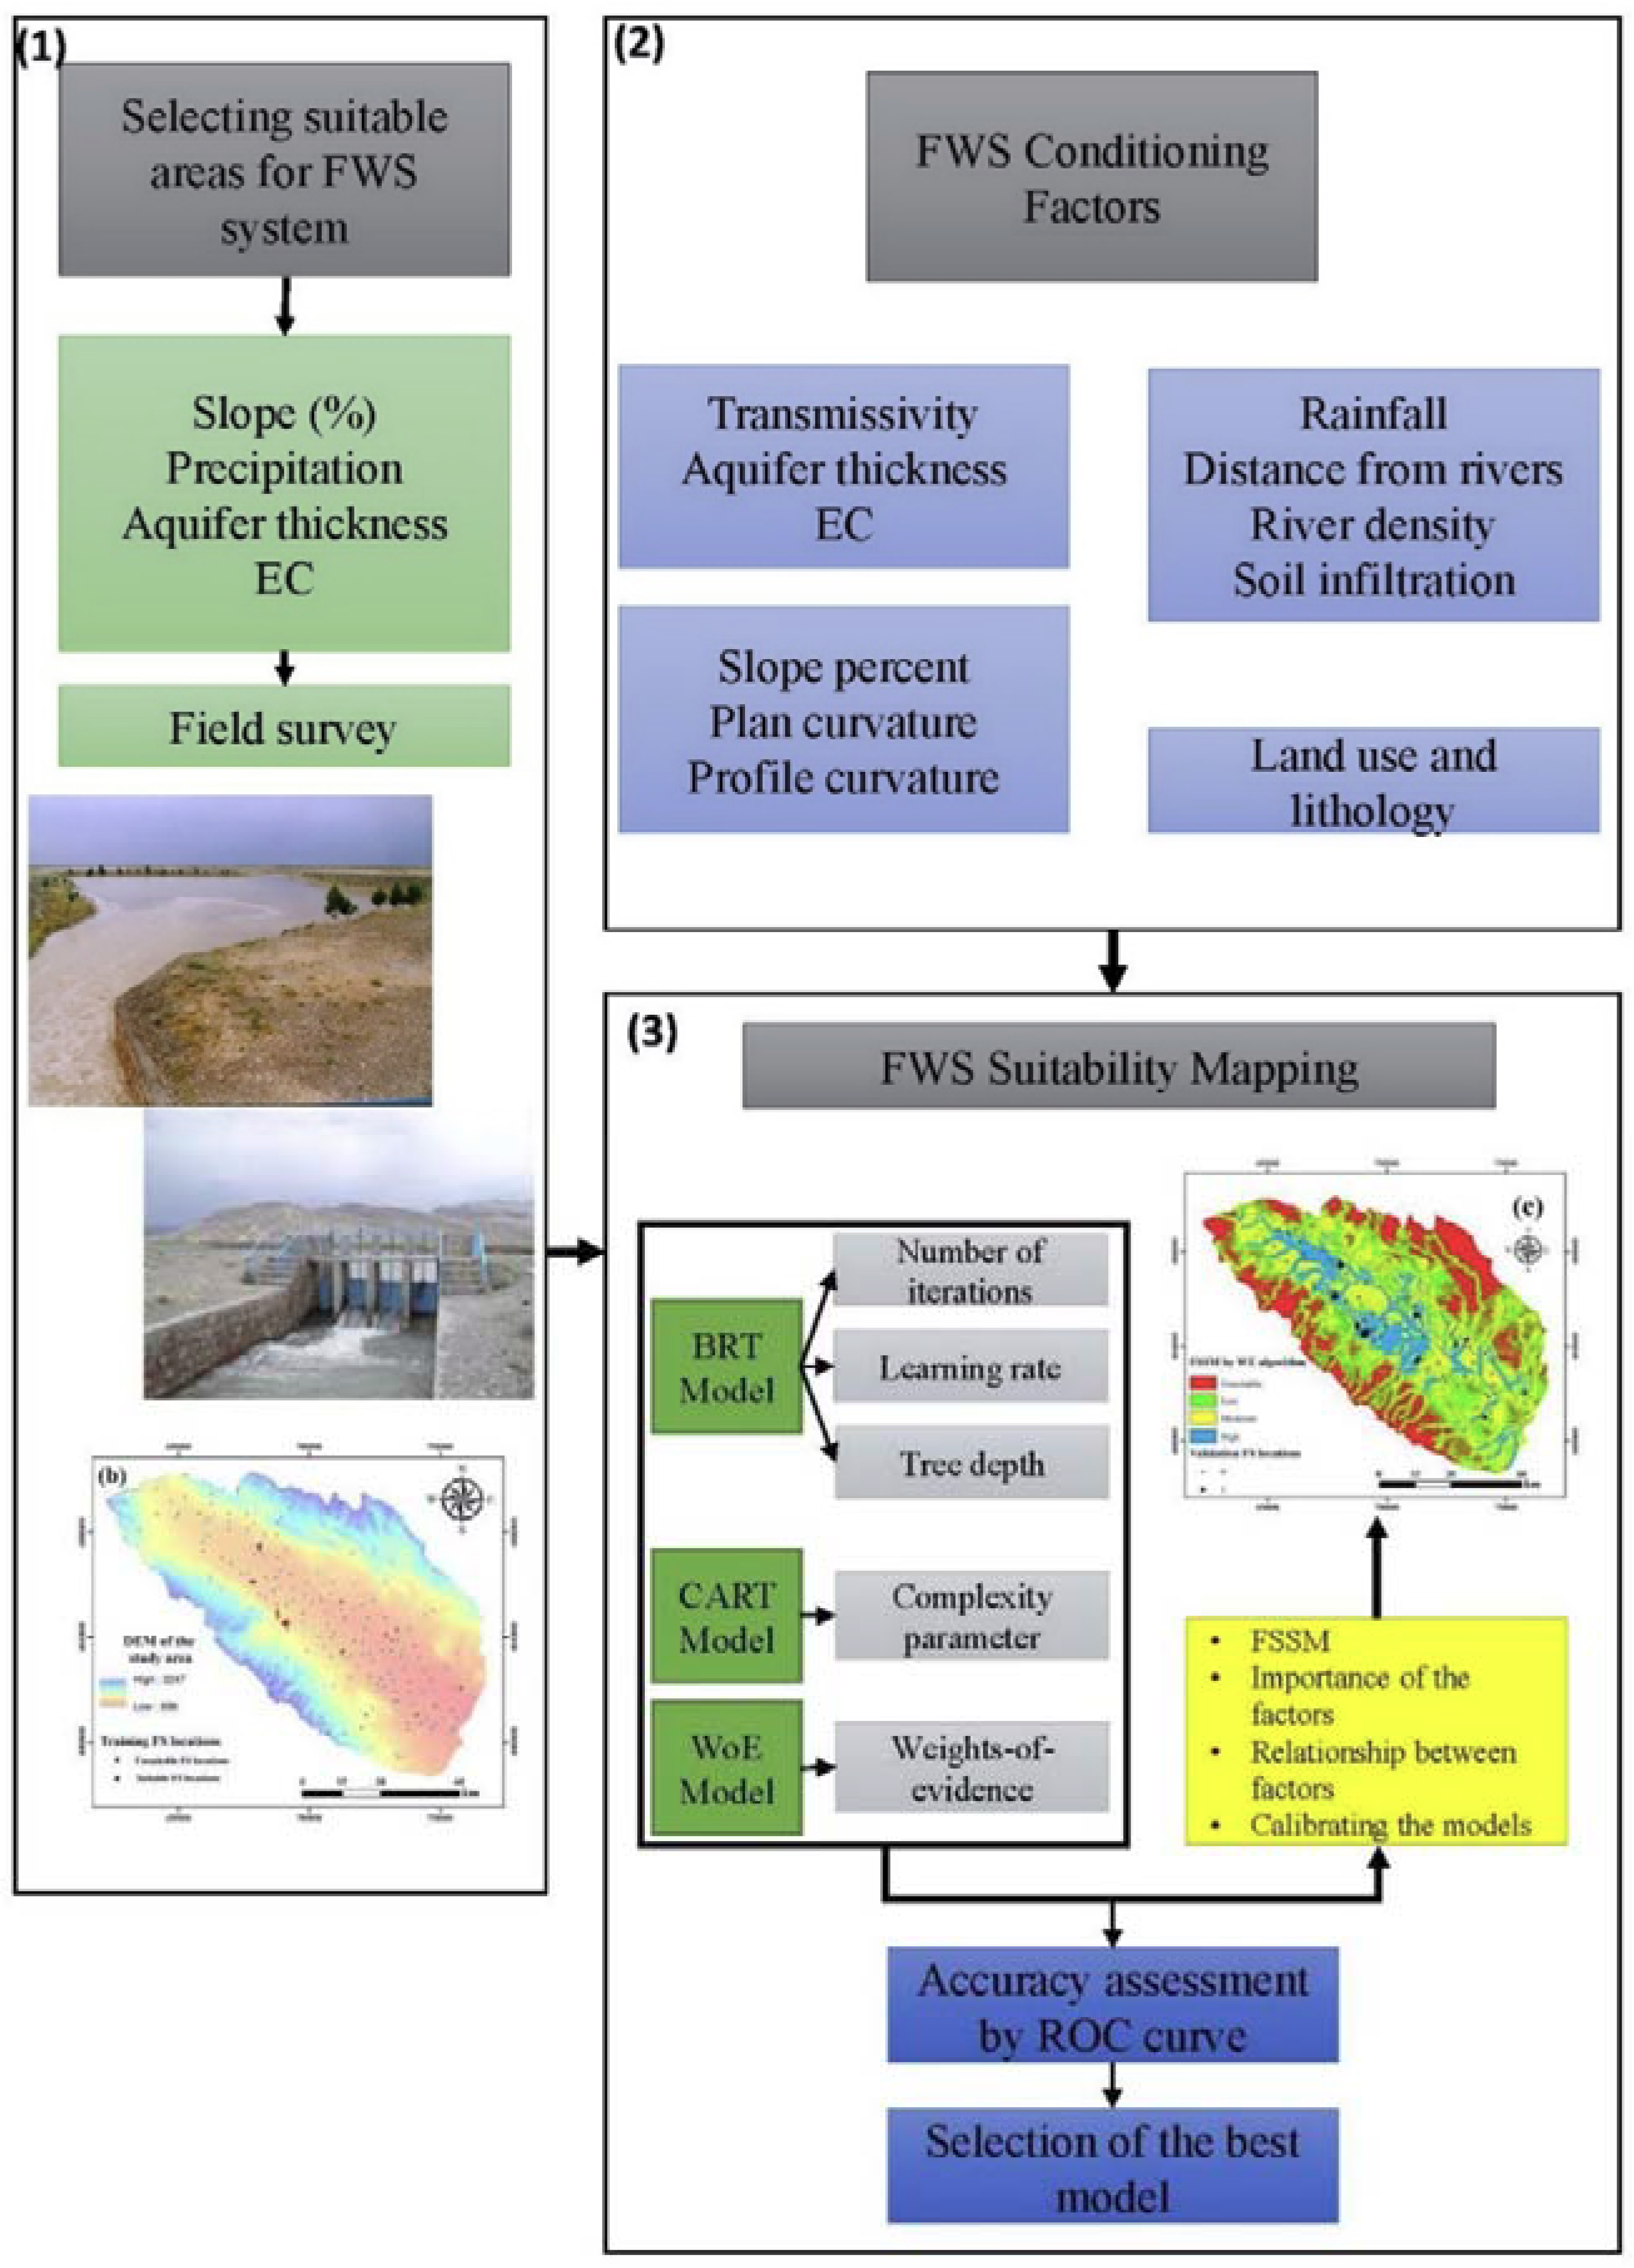
2. Materials and Methods
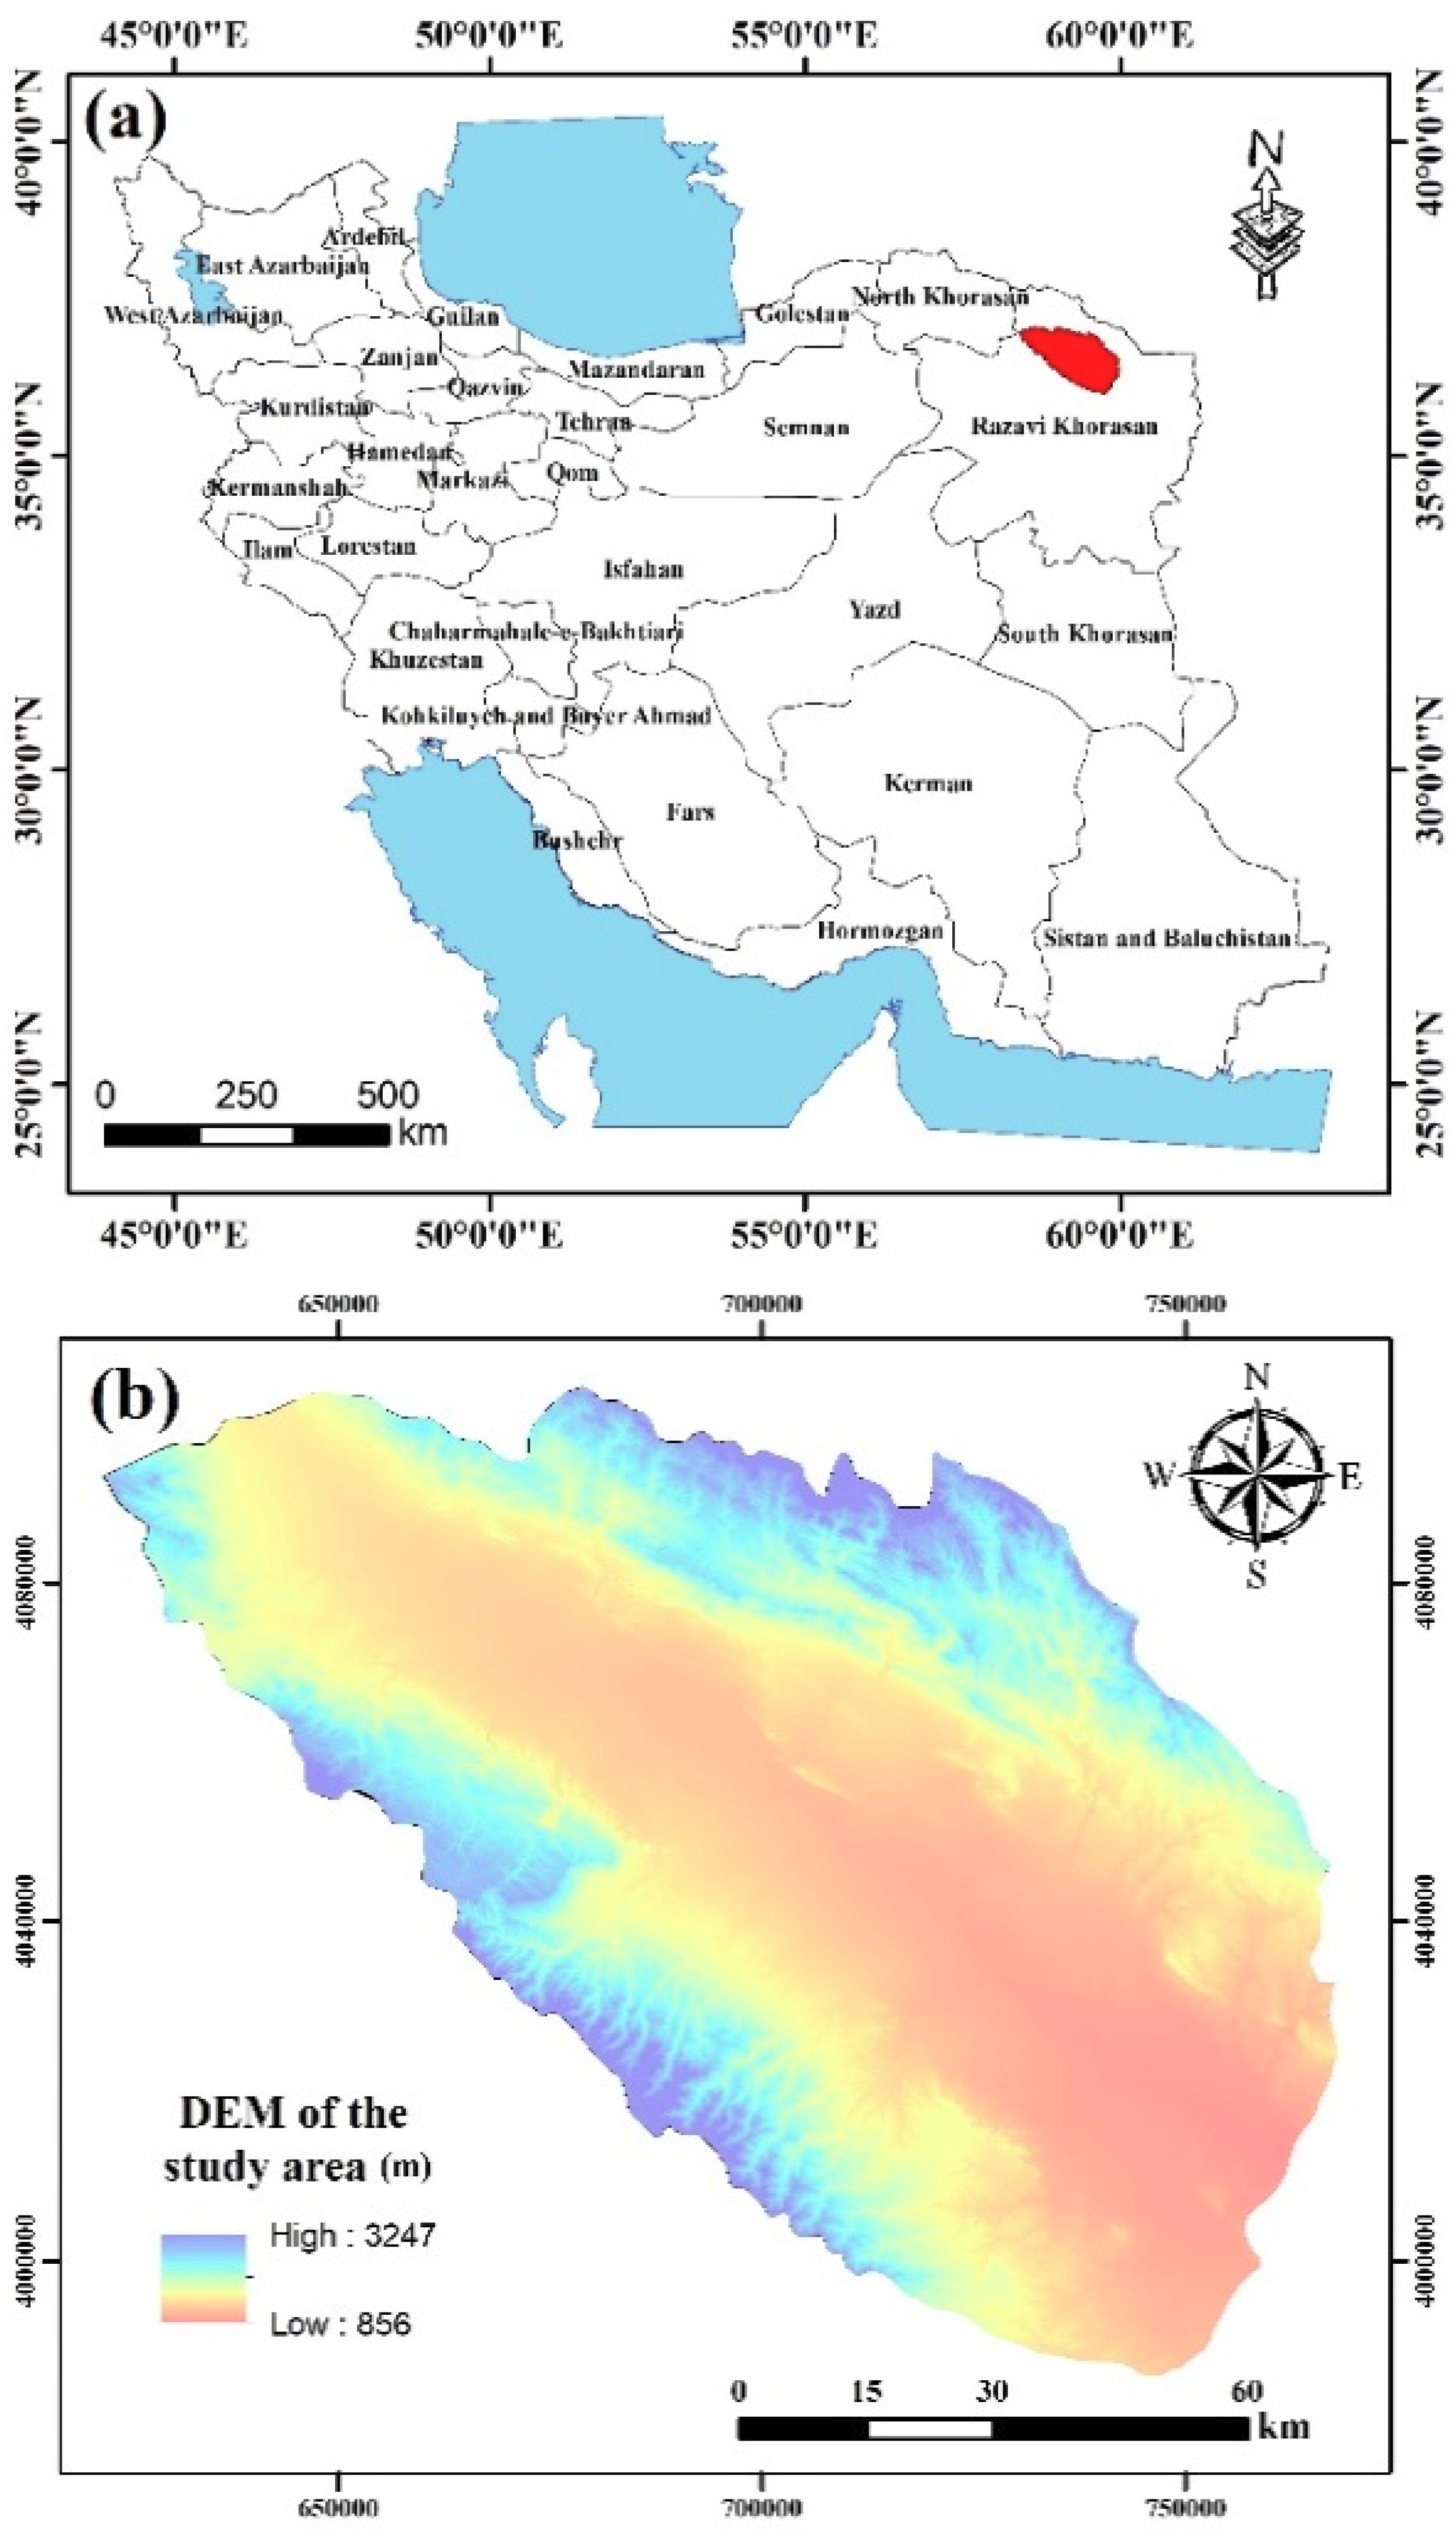
Figure 1 represents the methodology used to detect FWS suitable and unsuitable locations, as well as preparing FWS conditioning factors and modeling procedures, in this research.

2.1. Study Area

The Mashhad plain was considered in this study to investigate the efficacy of the BRT, CART, and WoE algorithms in determining FWS suitable areas. The Mashhad plain is located between 35°59′18″ and 37°03′53″ N and 58°21′33″ and 60°00′38″ E, with an area of 9600 km2 (Figure 2). The study area has a mean annual precipitation of around 240 mm according to the Khorasan Razavi Regional Water Authority [37]. The elevation in this basin ranges between 850 and 3250 m. A total of about 3,000,000 people live in the study basin who are primarily dependent on GW resources for drinking and crop-cultivation purposes. The inappropriate management of the water resources in this area has led to a 12-meter water table depletion in a 20-year period [38].

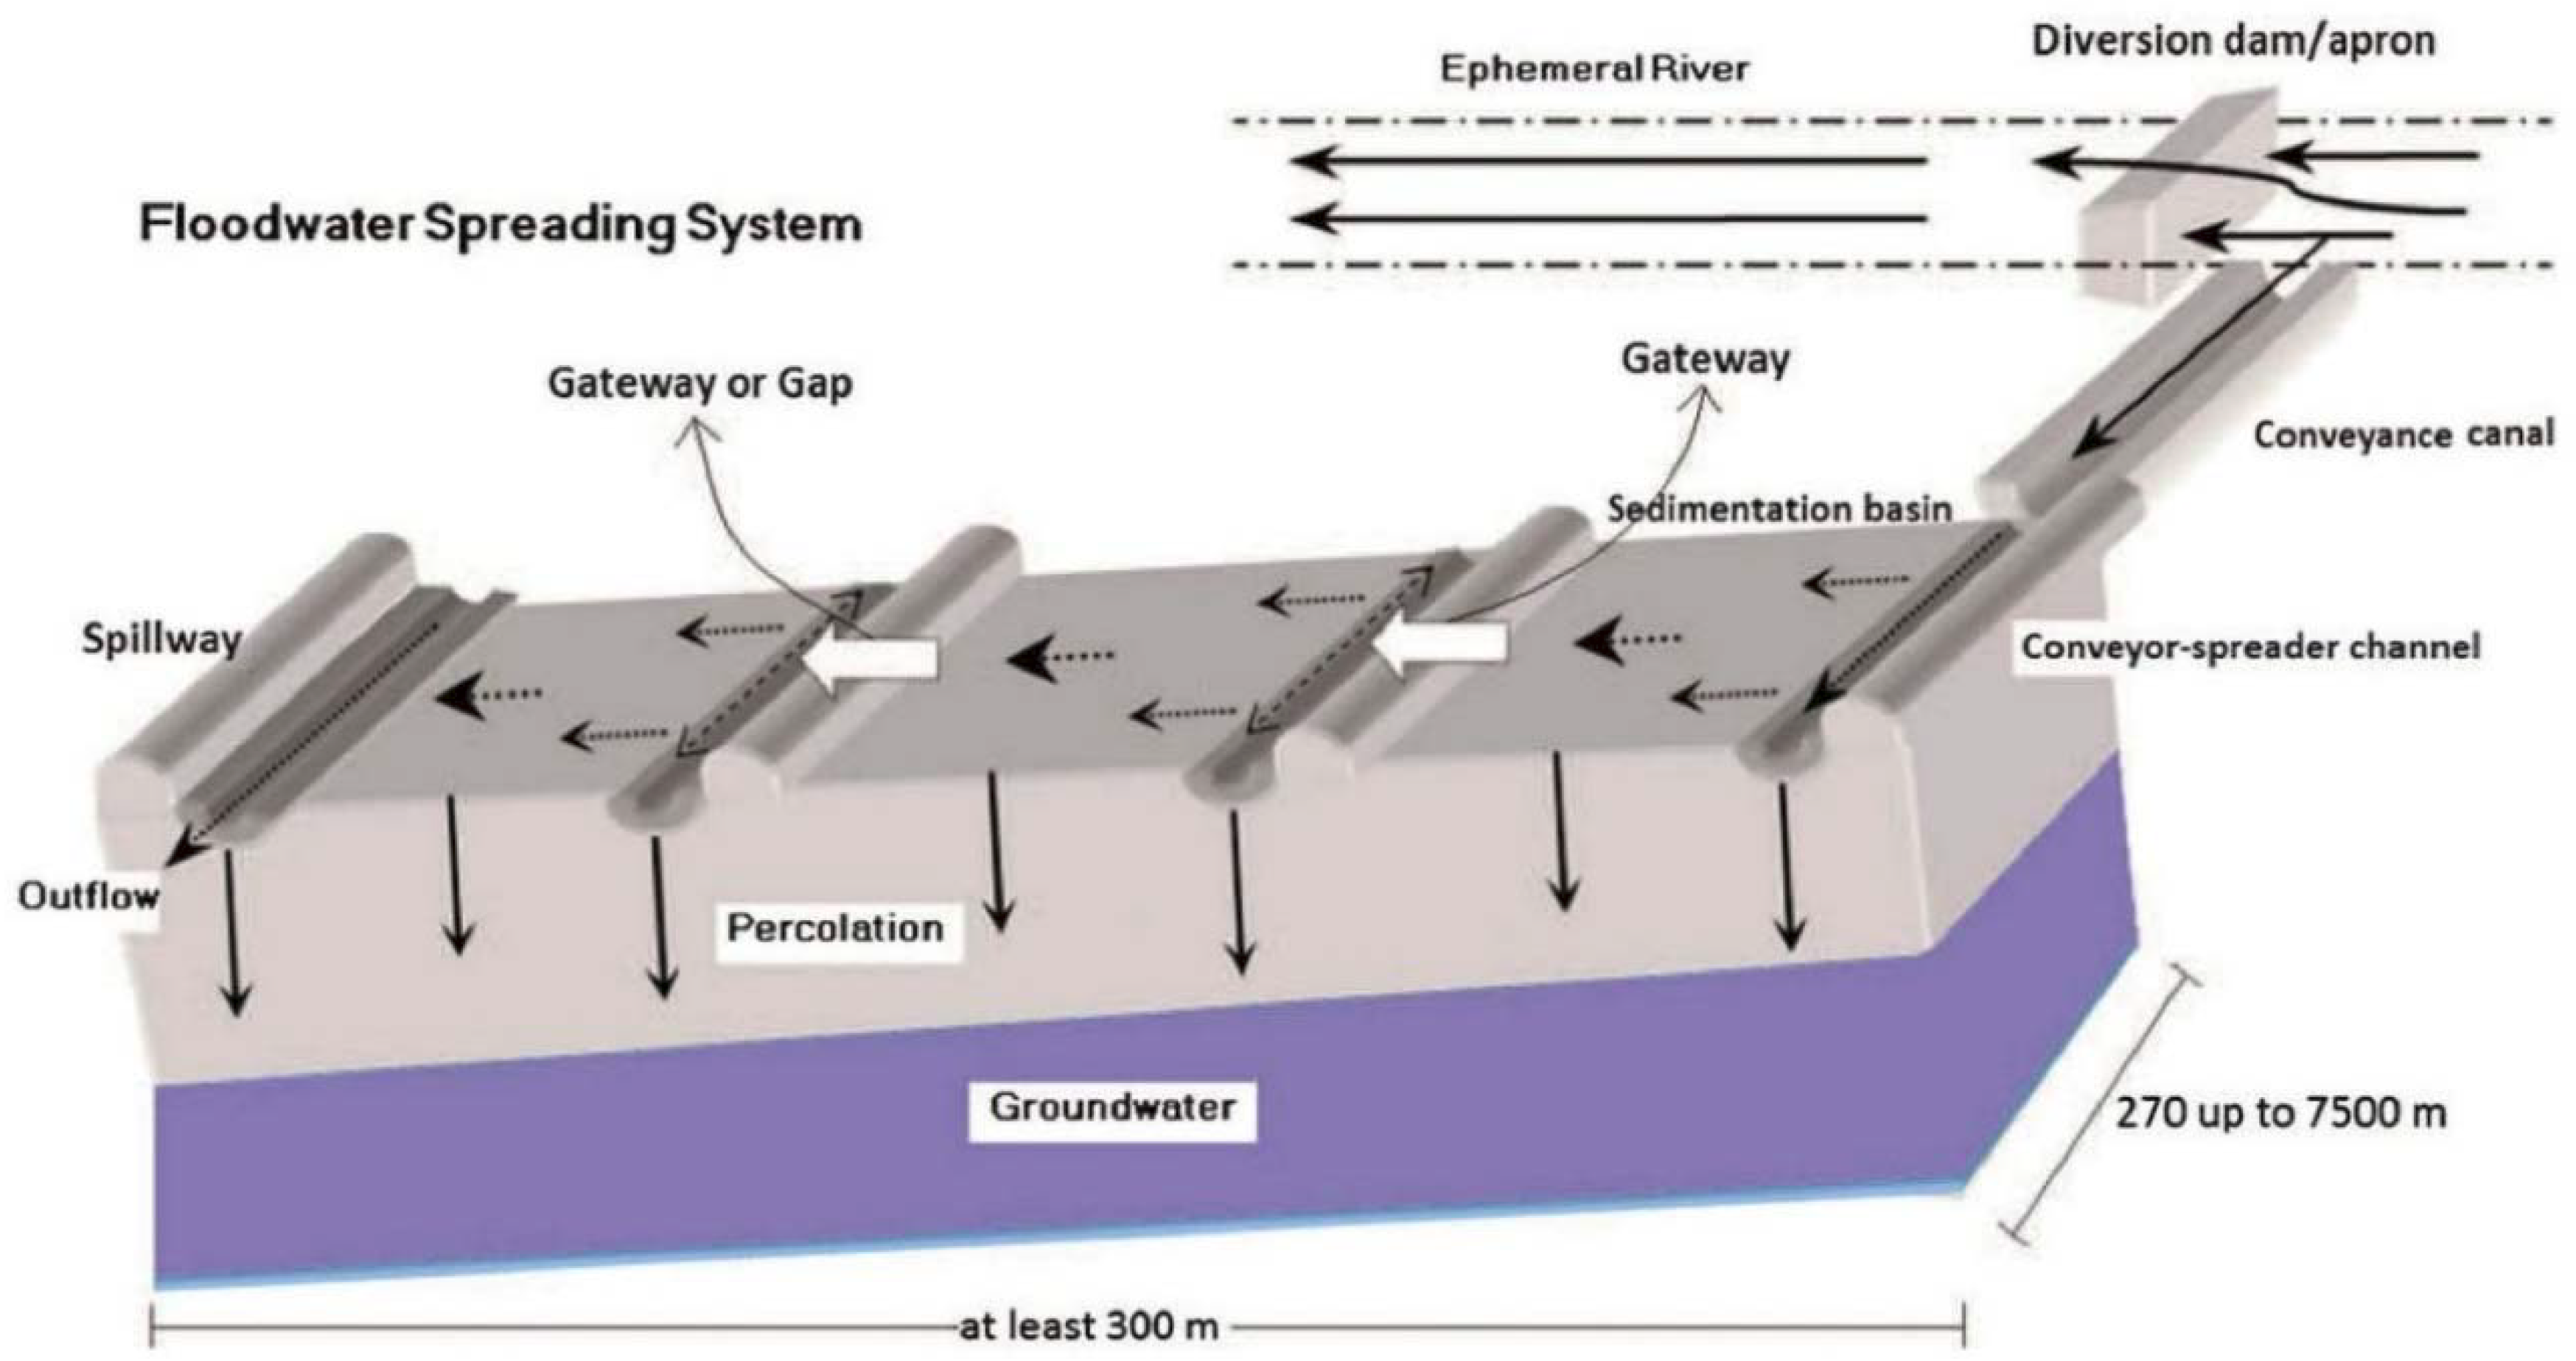
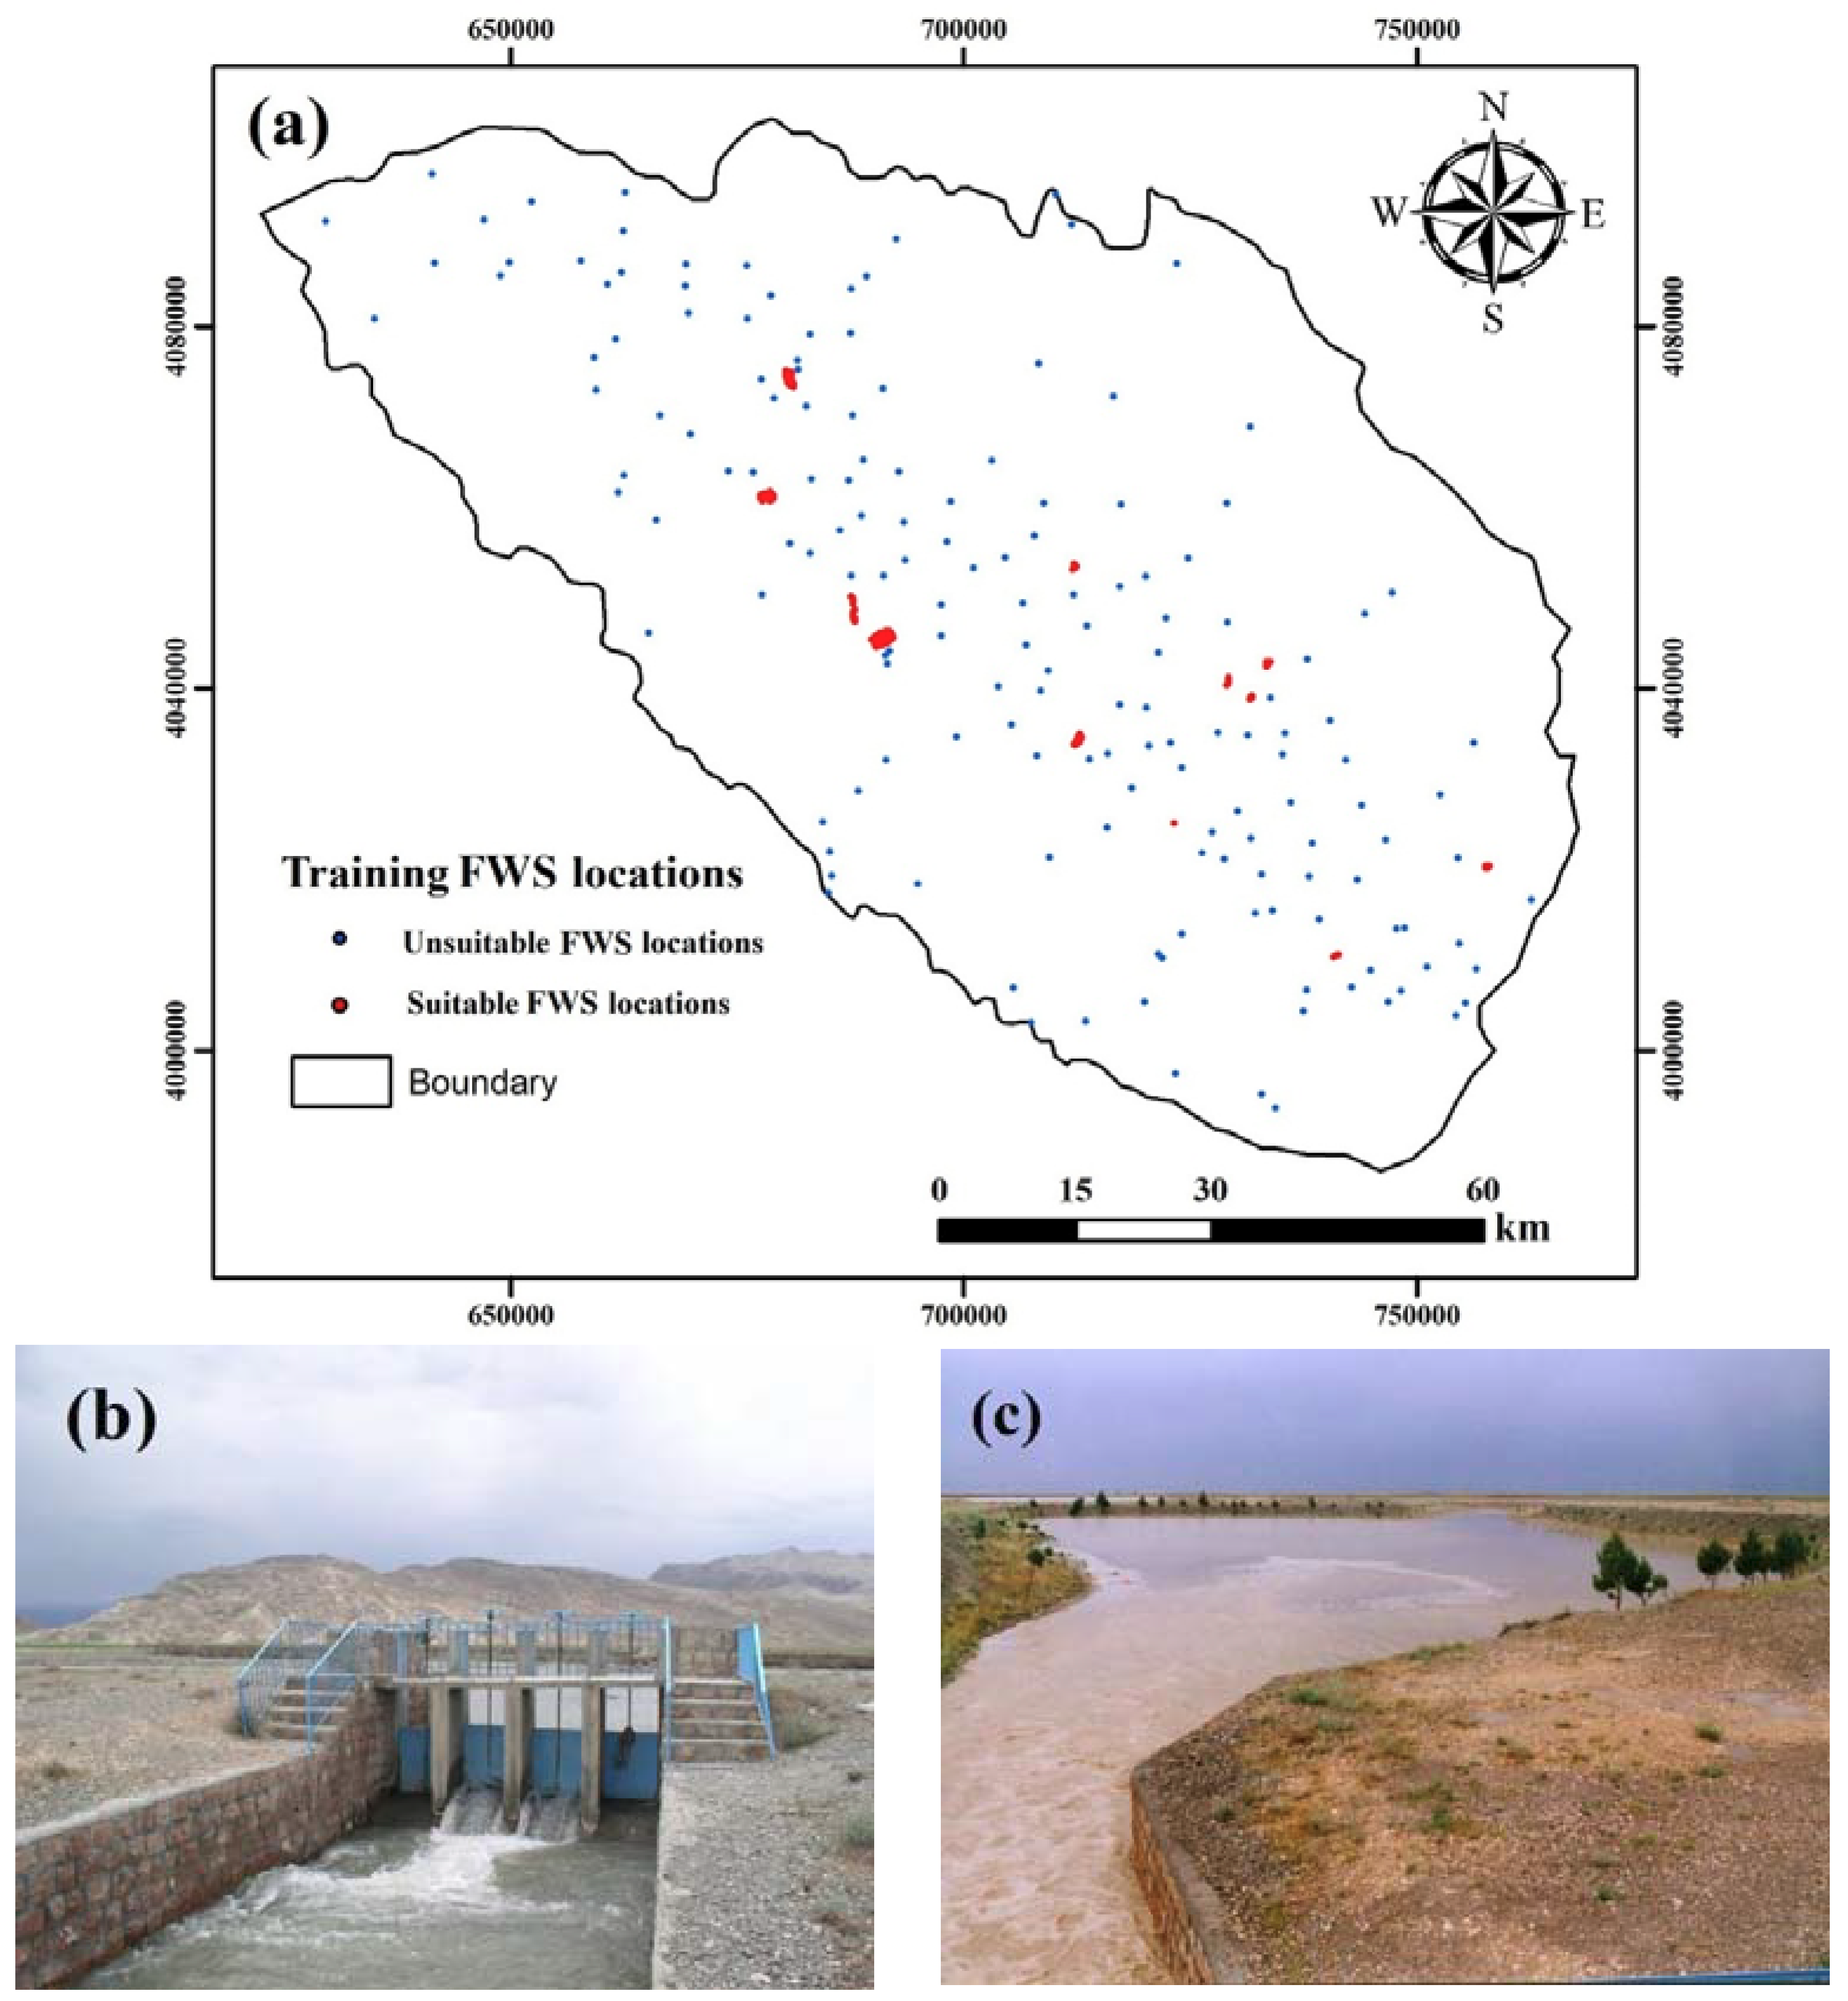
2.2. Floodwater Spreading Dataset

FWS systems are comprised of different parts including a diversion dam, a conveyance canal, a sedimentation basin, water gateways, several percolation surfaces, and a spillway at the end of its structure [39,40]. Diversion dams have the role of diverting the floodwater from the ephemeral river into the conveyance canal [41], where it is delivered to the first sedimentation basin (Figure 3). In the sedimentation basin, the floodwater deposits its sediment load. The first and second ponds in the system are constructed for sedimentation. Floodwater in the sedimentation basin can reach up to a 20–25 cm height. The sedimentation basins are designed similar to infiltration ponds with respect to width, slope, and area. As the water height reaches a certain amount, it enters the first percolation surface through the gateways at the end of the sedimentation basin [42]. In this part of the FWS system, water infiltrates and recharges GW. There are several infiltration ponds in an FWS system. The number and size of these infiltration ponds depend on the flood discharge, the volume of diverted floodwater, slope, and soil texture. The FWS system is designed to divert 30 to 40% of a 100-year flood of the basin. The width of FWS systems varies between 100–1500 m depending on the land availability and land surface characteristics. The floodwater height can reach up to 20–25 cm in the infiltration ponds. The conveyance canal normally has a slope of about 0.0003. Depending on the floodwater discharge rate, the width of the conveyance canal changes. There is also a spillway, which returns the flood into the river in order to prevent damaging the FWS system.
For modeling FWS suitability in this research, first, data on the current established FWS system, the Jamab system, were gathered [37]. Then, we defined the best locations for FWS establishment in the study area by considering the national guidelines and published documents [9,10,13,43]. To model FWS suitability, the main conditioning factors were used. Those factors include slope percent, rainfall, aquifer thickness, and EC. Slopes of less than 5% are recommended for FWS systems by different authors [11,16,17]. However, slopes up to 8% could be conservatively regarded as moderately suitable for surface recharge [10,12,14]. Previous research has confirmed that slopes of more than 8% are unsuitable for artificial recharge through FWS system. Thus, this study selected the suitable areas for FWS systems with slopes of less than 8%. In the case of aquifer thickness that has a limiting role in these artificial recharge methods, this study did not consider values of less than 10 m. In the case of rainfall, there was no limiting effect by this factor as it is higher than 200 mm in the whole area. FWS systems not only improve GW conditions, but also decrease salinity in the aquifers. FWS systems are more efficient for the aquifers with lower EC values than 6000 μmhos/cm [9]. Therefore, this research regarded areas with <6000 μmhos/cm EC for FWS establishment. According to the stated criteria, the initial possible locations were selected for FWS construction. To check whether it is possible to divert floodwater from the main rivers over the surface, some field surveys were conducted. At last, thirteen FWS suitable areas with a surface area of 1500 ha were selected for this purpose (Figure 4a). The Jamab FWS system has been used since 1995 [37,44] (Figure 4b,c). This area has an aquifer thickness of about 50 m, an average slope of 4.03%, and 16 infiltration ponds [37]. Since the establishment of the Jamab FWS system, the area has been flooded frequently [45]. The Jamab system has the capability of infiltrating a floodwater volume of about 1.96 million m3 at each event. It should be noted that 80–90% of the diverted floodwater can be infiltrated in the system, the rest will be lost through evaporation and/or will return to the river via a spillway/outflow channel. The diversion dam is designed based on a 100-year return period peak discharge of the study area (calculated as 138 m3 s−1) and it can transfer a discharge amount of about 8 m3 s−1. In the case of a major flood, a discharge up to the 8 m3 s−1 is diverted and the rest flows through the main river channel. Investigation of the two water wells around this system shows a 10-m water table increase between 1995 and 2011 as a result of the FWS system. Infiltration ponds have an average infiltration rate of about 1.8 cm min−1.

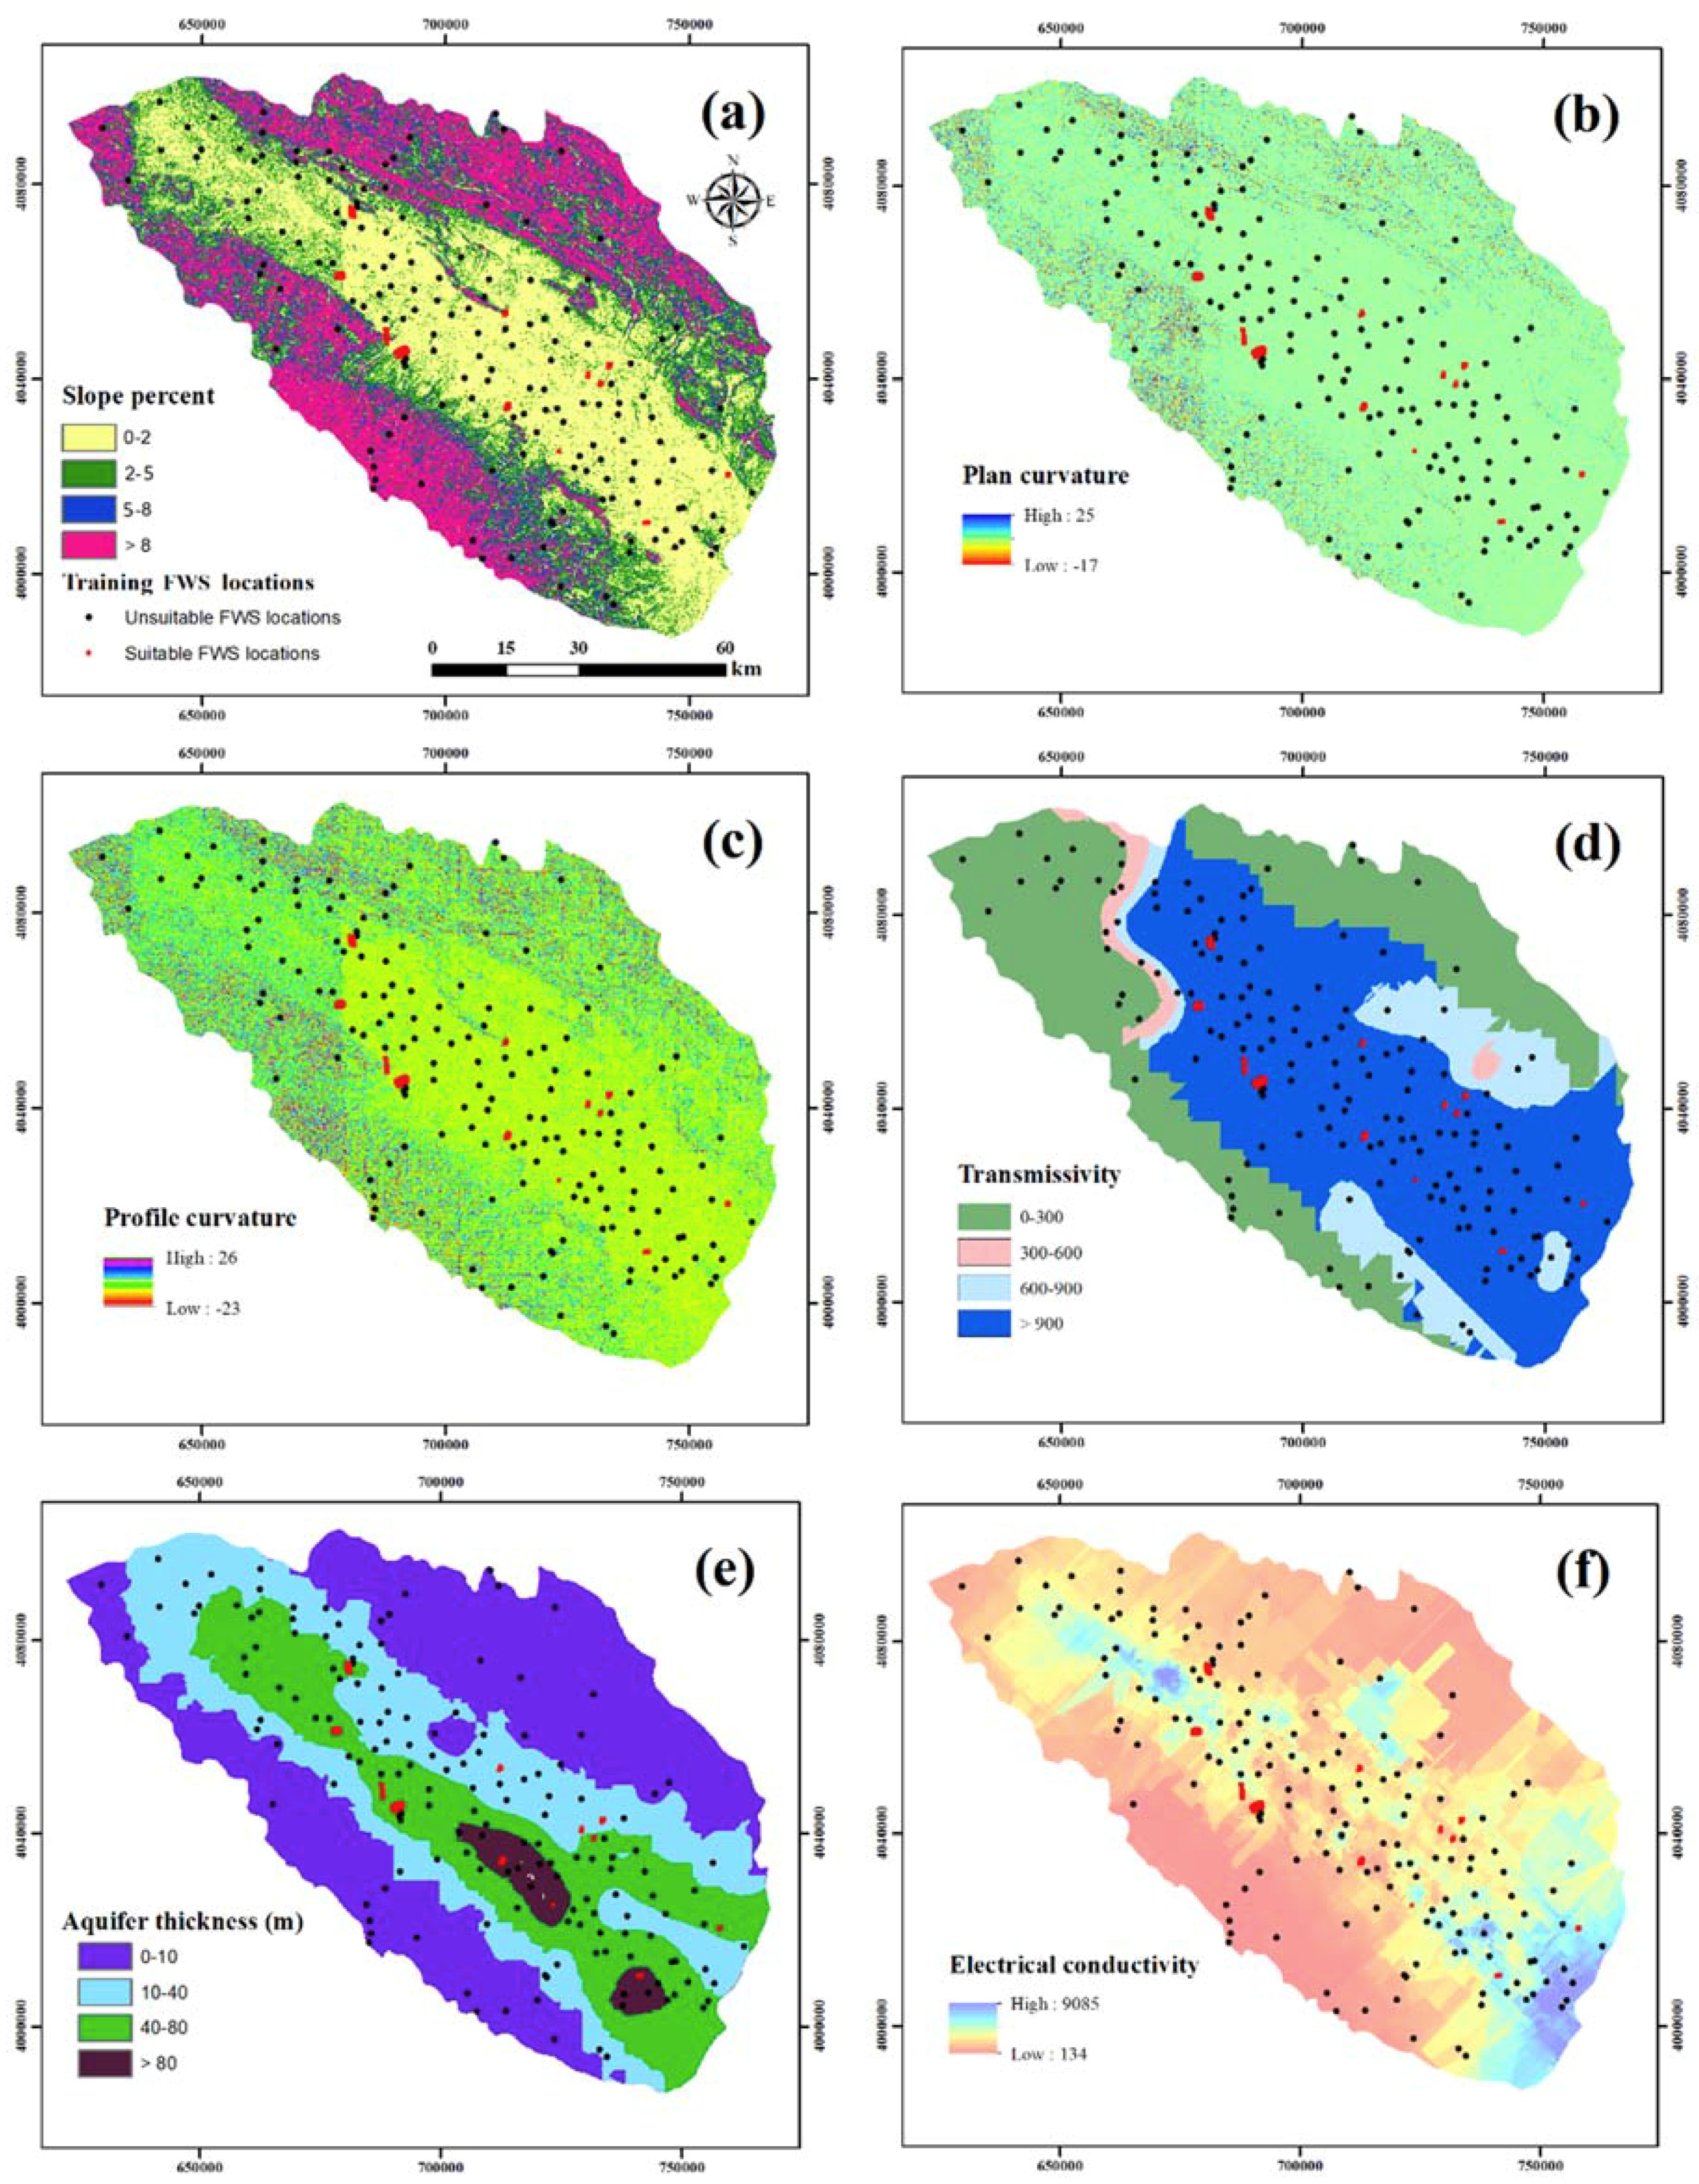
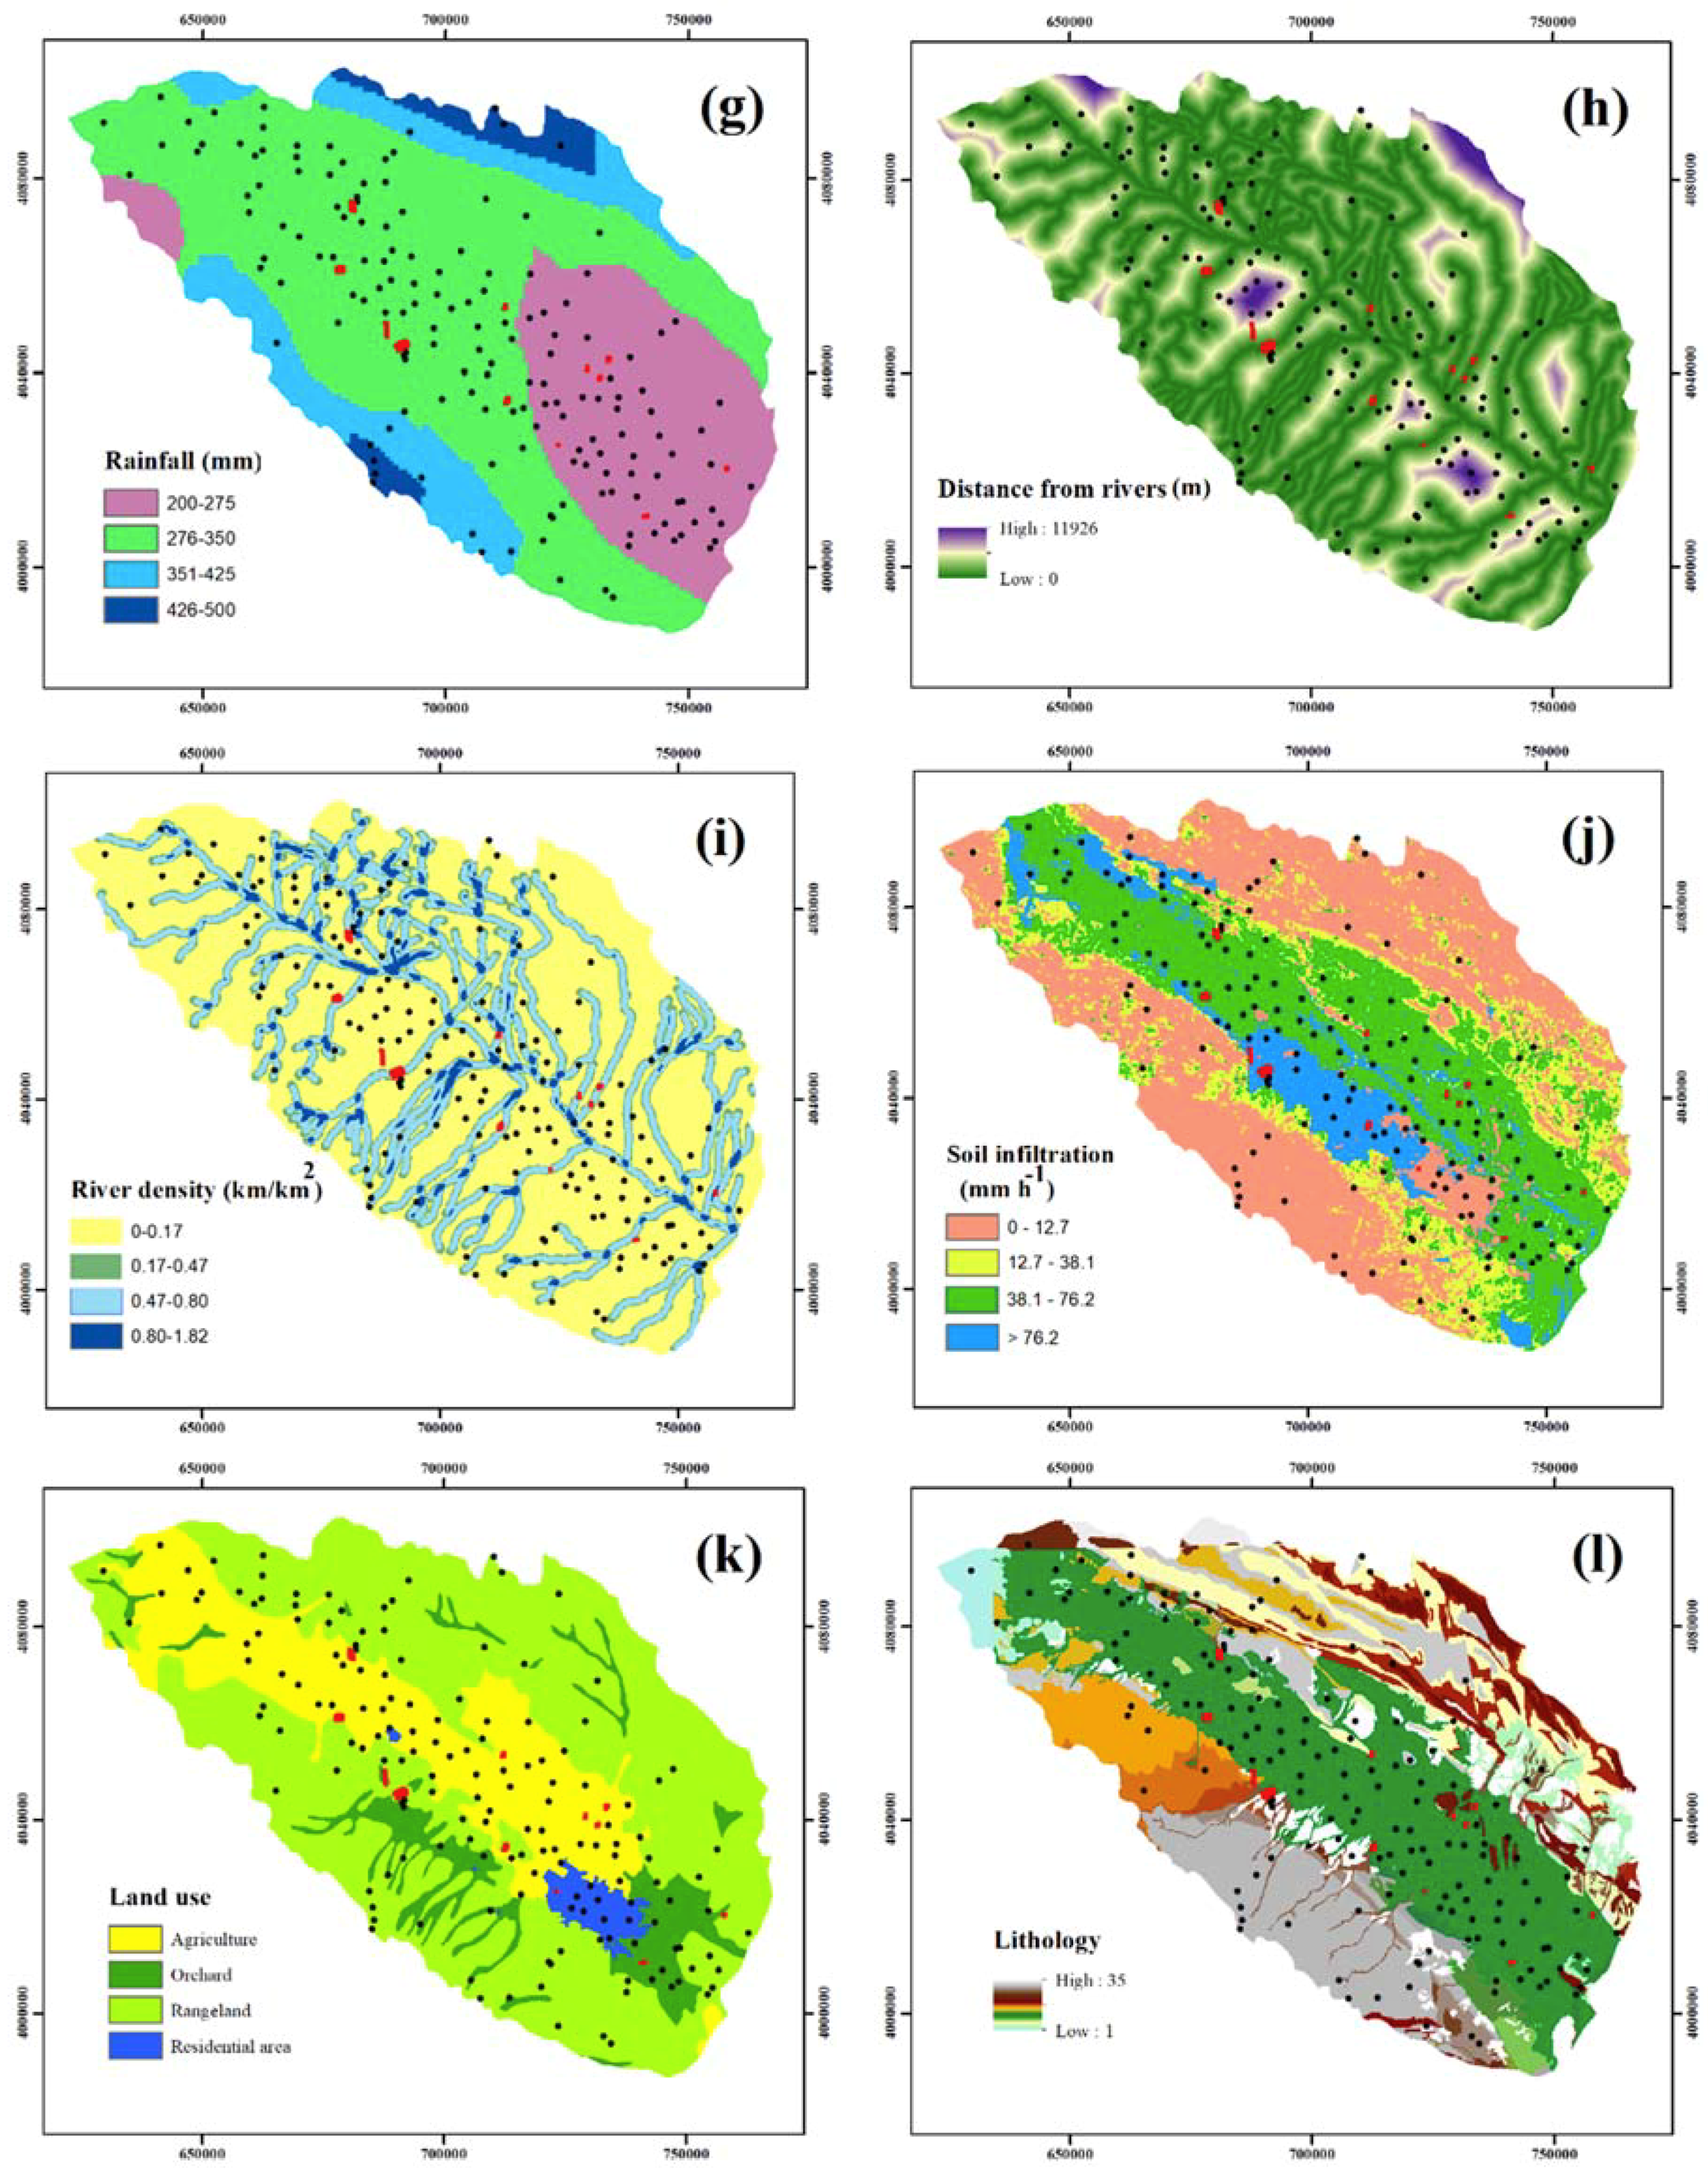
2.3. Floodwater Spreading Conditioning Factors

In this section, FWS conditioning factors, as well as their classes, are explained. FWS conditioning factors include both categorical and continuous variables. Geological units in addition to land use classes were considered as categorical variables in all the models. It must be noted that the WoE algorithm needs only categorical inputs; hence, the other layers were classified into different classes to be used in this model. In contrast, BRT and CART deal with both categorical and continuous factors. Thus, these two models were applied to the raw dataset.
Slope percent 
Slope percent affects flow speed over the surface while it is being flooded. In steeper slopes, the flow speed is higher and results in different kinds of erosion. This factor was produced using a 30 m DEM of the Mashhad Plain. The slope percent of the study region was classified into 0–2, 2–5, 5–8, and >8% categories (Figure 5a).
Plan and profile curvature 
Plan curvature defines how concave or convex the surface is [46]. Flow distribution on the surface depends on the topography, which can be represented by profile curvature. The profile curvature ranges from negative to positive values [47]. The plan and profile curvatures maps were generated from the DEM of the study area by SAGA software (Figure 5b,c).
Transmissivity 
In order to prepare the transmissivity map of this study, hydraulic conductivity data, which have been defined through well-pumping investigations by KRRWA in 2017 [37], were used. The transmissivity was then calculated through the hydraulic conductivity multiplied by the saturated aquifer thickness of the study region. This FWS conditioning factor represents the horizontal movement of water through the saturated parts of the aquifer [17]. This factor was categorized into 4 classes (Figure 5d).
Aquifer thickness 
Aquifer thickness has an important role in defining the suitable places for FWS as low values cause saturation and are not ideal choices for this purpose [9]. This factor was obtained from the KRRWA project report [37] as a result of well-logging and geophysical studies. This FWS conditioning factor was categorized into 4 classes (Figure 5e).
Electrical conductivity 
EC defines the ability of the material to pass electricity through itself. This ability depends on the total dissolved solids in the aquifer [17]. EC values of the exploration wells measured by KRRWA [37] were used for preparing the EC layer map. The EC layer ranges from 0 to 9085 µmhos cm−1 (Figure 5f).
Rainfall 
A rainfall map of the study region was also obtained from KRRWA [37] by interpolating the average annual rainfall of multiple stations in and around the Mashhad Plain. This map includes four rainfall classes of 200–275, 275–350, 350–425, and 425–500 mm year−1 (Figure 5g).
Distance from rivers and river density 
To prepare the distance from rivers, the Euclidean distance was implemented in ArcGIS software. River density was produced by the line density function. This factor ranges from 0 to 11,926 m (Figure 5h). The latter one was categorized into four classes using the natural break method (Figure 5i). This method of classification was selected because there are jumps in the river density layer [48].
Soil infiltration 
The soil infiltration layer was prepared based on the hydrologic soil groups and soil conservation service method [37,49]. Four categories of soil infiltration in the Mashhad Plain are 0–12.7, 12.7–38.1, 38.1–76.2, and >76.2 mm h−1 (Figure 5j).
Land use map 
The study region is covered by four classes of land use i.e., orchard, rangeland, residential areas, and agriculture (Figure 5k). Rangeland and agriculture are the main land use classes covering 64 and 24.1% of the study area, respectively. It is noted that the demand for agricultural activities has exceeded the natural GW recharge in the Mashhad Plain and led to different problems such as water table decreases and land subsidence.
Geological units 
There are 35 different lithological units in the Mashhad Plain. These units cover a variety of lithological units from sedimentary to igneous rocks (Table 1; Figure 5l). The main units are gravel fan, shale, dolomite, and terraces.

2.4. Modeling Approaches

In order to apply the binary classification models, i.e., BRT and CART, both presence and absence data are needed. Presence data were produced by converting the polygons of the FWS suitable areas to points (i.e., 223 points). Absence or FWS unsuitable areas were created using a random algorithm with the same number of the presence data (i.e., 223 points). Among these points, the training dataset contains 70% of both the FWS suitable and unsuitable points (i.e., 312 points). On the other hand, the validation dataset receives 30% of both the FWS suitable and unsuitable points (i.e., 134 points).

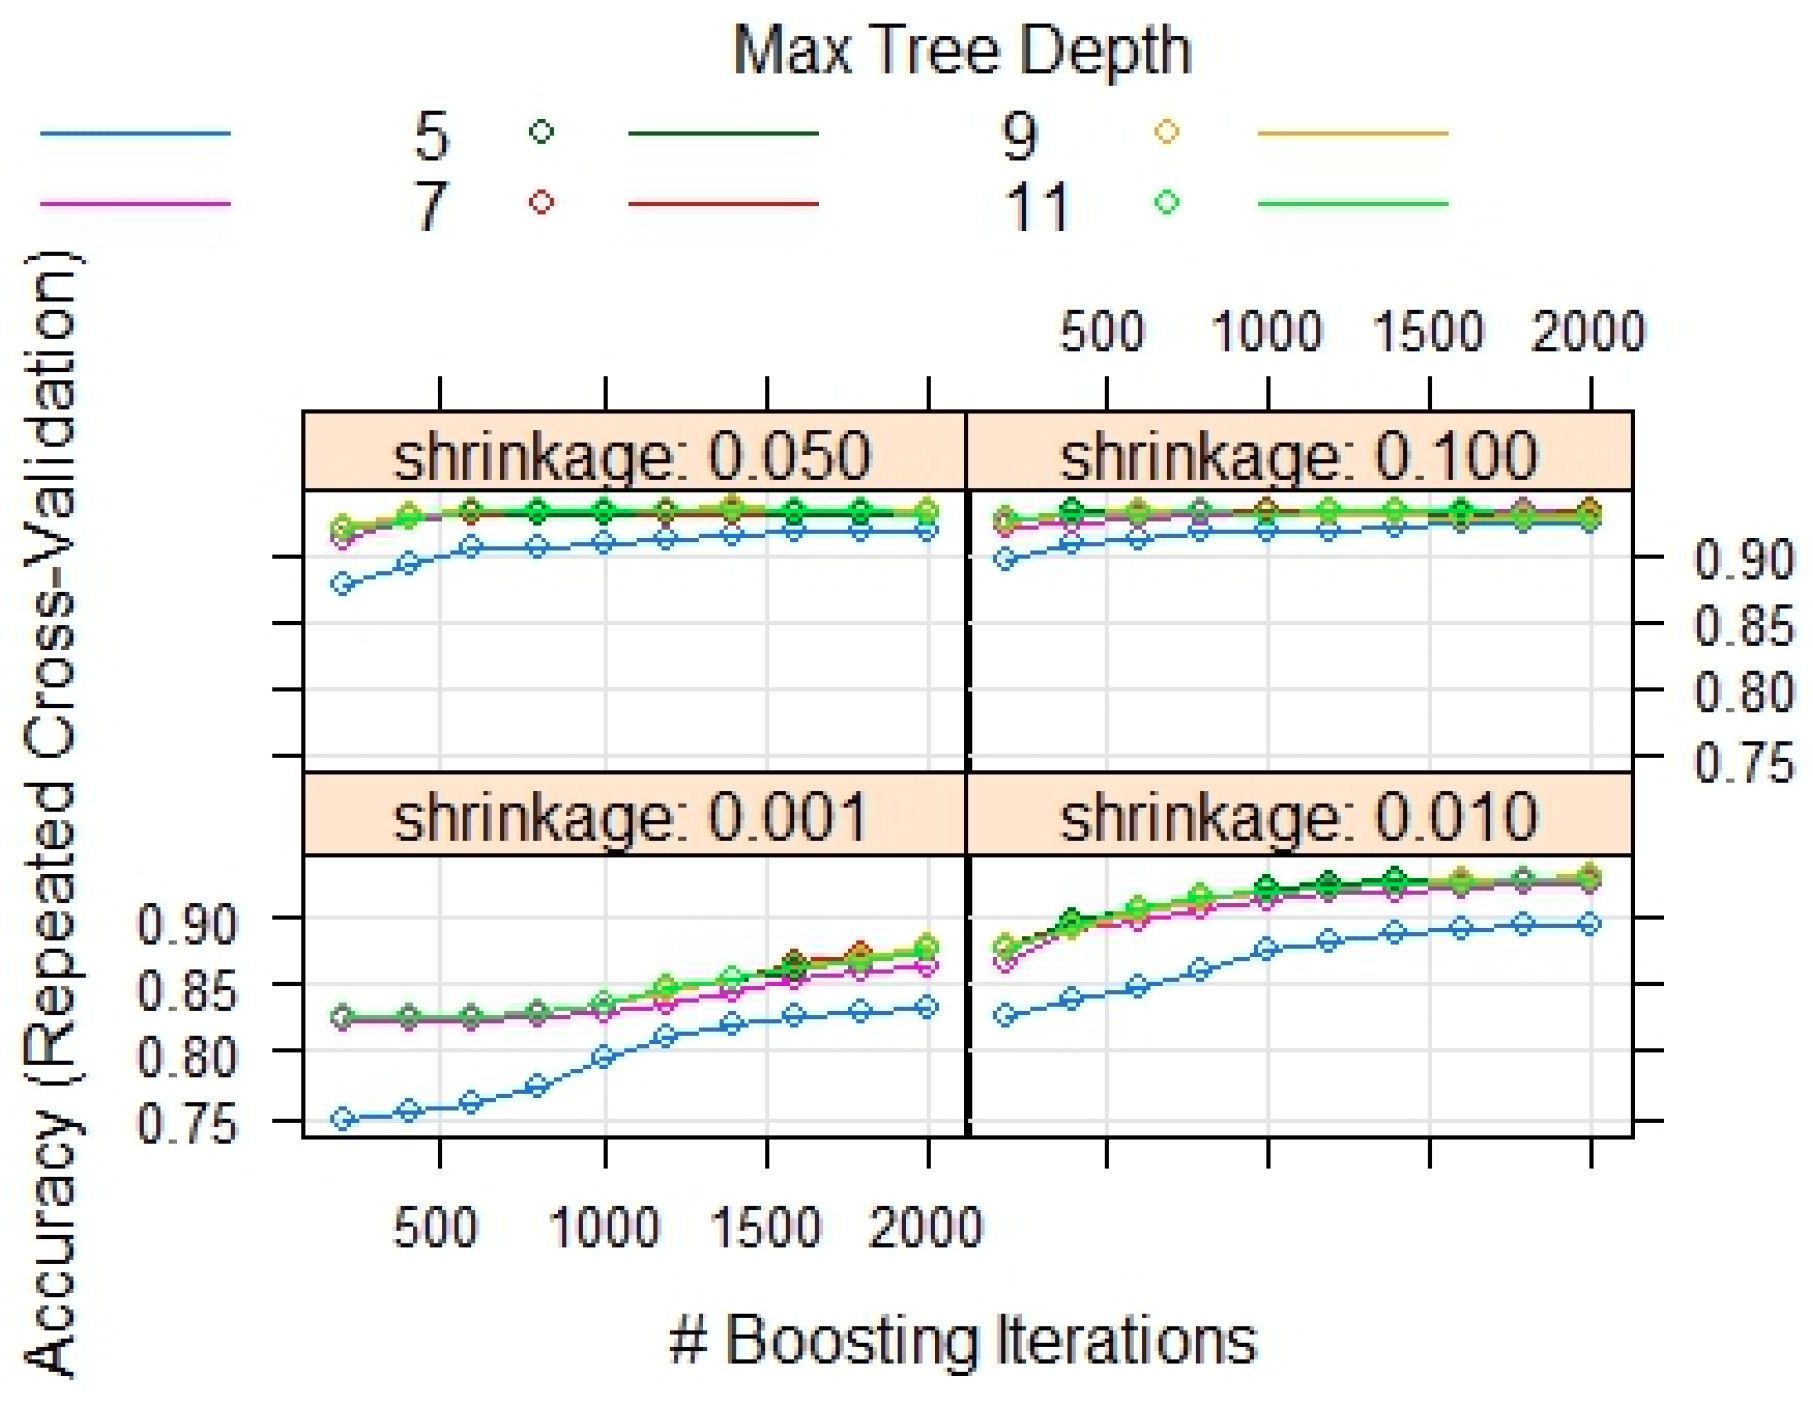
2.4.1. FWS Suitability Modeling by BRT

BRT can be regarded as a mixture of two strong statistical methods, the boosting method, and regression trees. The boosting method is similar to model averaging (with the difference), implementing a forward stage-wise process in which the trees are fitted to a part of the training set [50]. The mentioned sub-dataset in each iteration is chosen without replacement [50]. This process is known as stochastic gradient boosting which increases the model accuracy and diminishes overfitting problem [51].
Decision trees are created on the basis of recursive binary partitioning of training subsets. Recursive binary partitioning is a technique for multivariate analysis which categorizes different cases in the population dividing them into sub-groups according to different binary input factors [52]. In BRT, several trees are created iteratively till minimizing the loss function [50]. The final value can be calculated as below:
Final   value = i = 1 n T r e e   V a l u e i × L e a r n i n g   r a t e
where, i = 1, 2, 3, …, n shows the different fitted trees, n shows the total number of trees, and the learning rate depicts the contribution of each tree in the final value.
For running the BRT model in R program, there are three main parameters that must be defined or calibrated. Those parameters are the number of trees or iterations, learning rate, and max tree depth or interaction depth. Interaction depth defines the size of single trees. For applying BRT, the caret and gbm scripts were implemented in the current work [53].

2.4.2. FWS Suitability Modeling by CART

Tree-based models such as CART are alternative techniques for classification and regression which are not based on normality presumption [54]. Further, unlike discriminant analysis models, CART is very simple to interpret. CART is able to deal with a large number of cases and variables in addition to its capability to be resistant to outliers [55]. CART is a good choice when the user is dealing with a large number of input variables as it can recognize the main contributors and their interactions [54]. CART implements a regression technique that divides the data until classes become homogeneous or include fewer observations than a specific threshold determined by the modeler [56]. To avoid an overfitting issue in this algorithm, a process called pruning is applied. Pruning selects the best trade-off between the decrease of deviance and the number of terminal nodes [24,57]. This model was implemented using the rpart script in the R program.

2.4.3. FWS Suitability Modeling by WoE

WoE as a data-driven algorithm is on the basis of Bayesian probability [58]. The main idea of the WoE model is that several binary patterns can be considered together to define a new binary pattern [59]. This model computes the weights of the FWS conditioning factors on the basis of the existing FWS suitable areas in the study area [60]. First, the positive and negative weights of each FWS conditioning factor are calculated as follows:
W + = log e ( ( P { B | D } ) / ( P { B | D ¯ ) } )
W = log e ( ( P { B ¯ | D } ) / ( P { B ¯ | D ¯ } ) )
where P denotes the probability; B and B ¯ show the presence and absence of the dichotomous pattern, respectively; and D and D ¯ denote the presence and absence of FWS suitable areas, respectively. W + and W represent the WoE for FWS suitable and unsuitable cases, respectively [61,62].
The contrast value could be obtained by W + W . A contrast value of 0 depicts that the variable is insignificant in modeling FWS suitability. Positive values are representative of positive correlation, while negative values depict the reverse correlation between the variables and FWS suitability [59].

3. Results

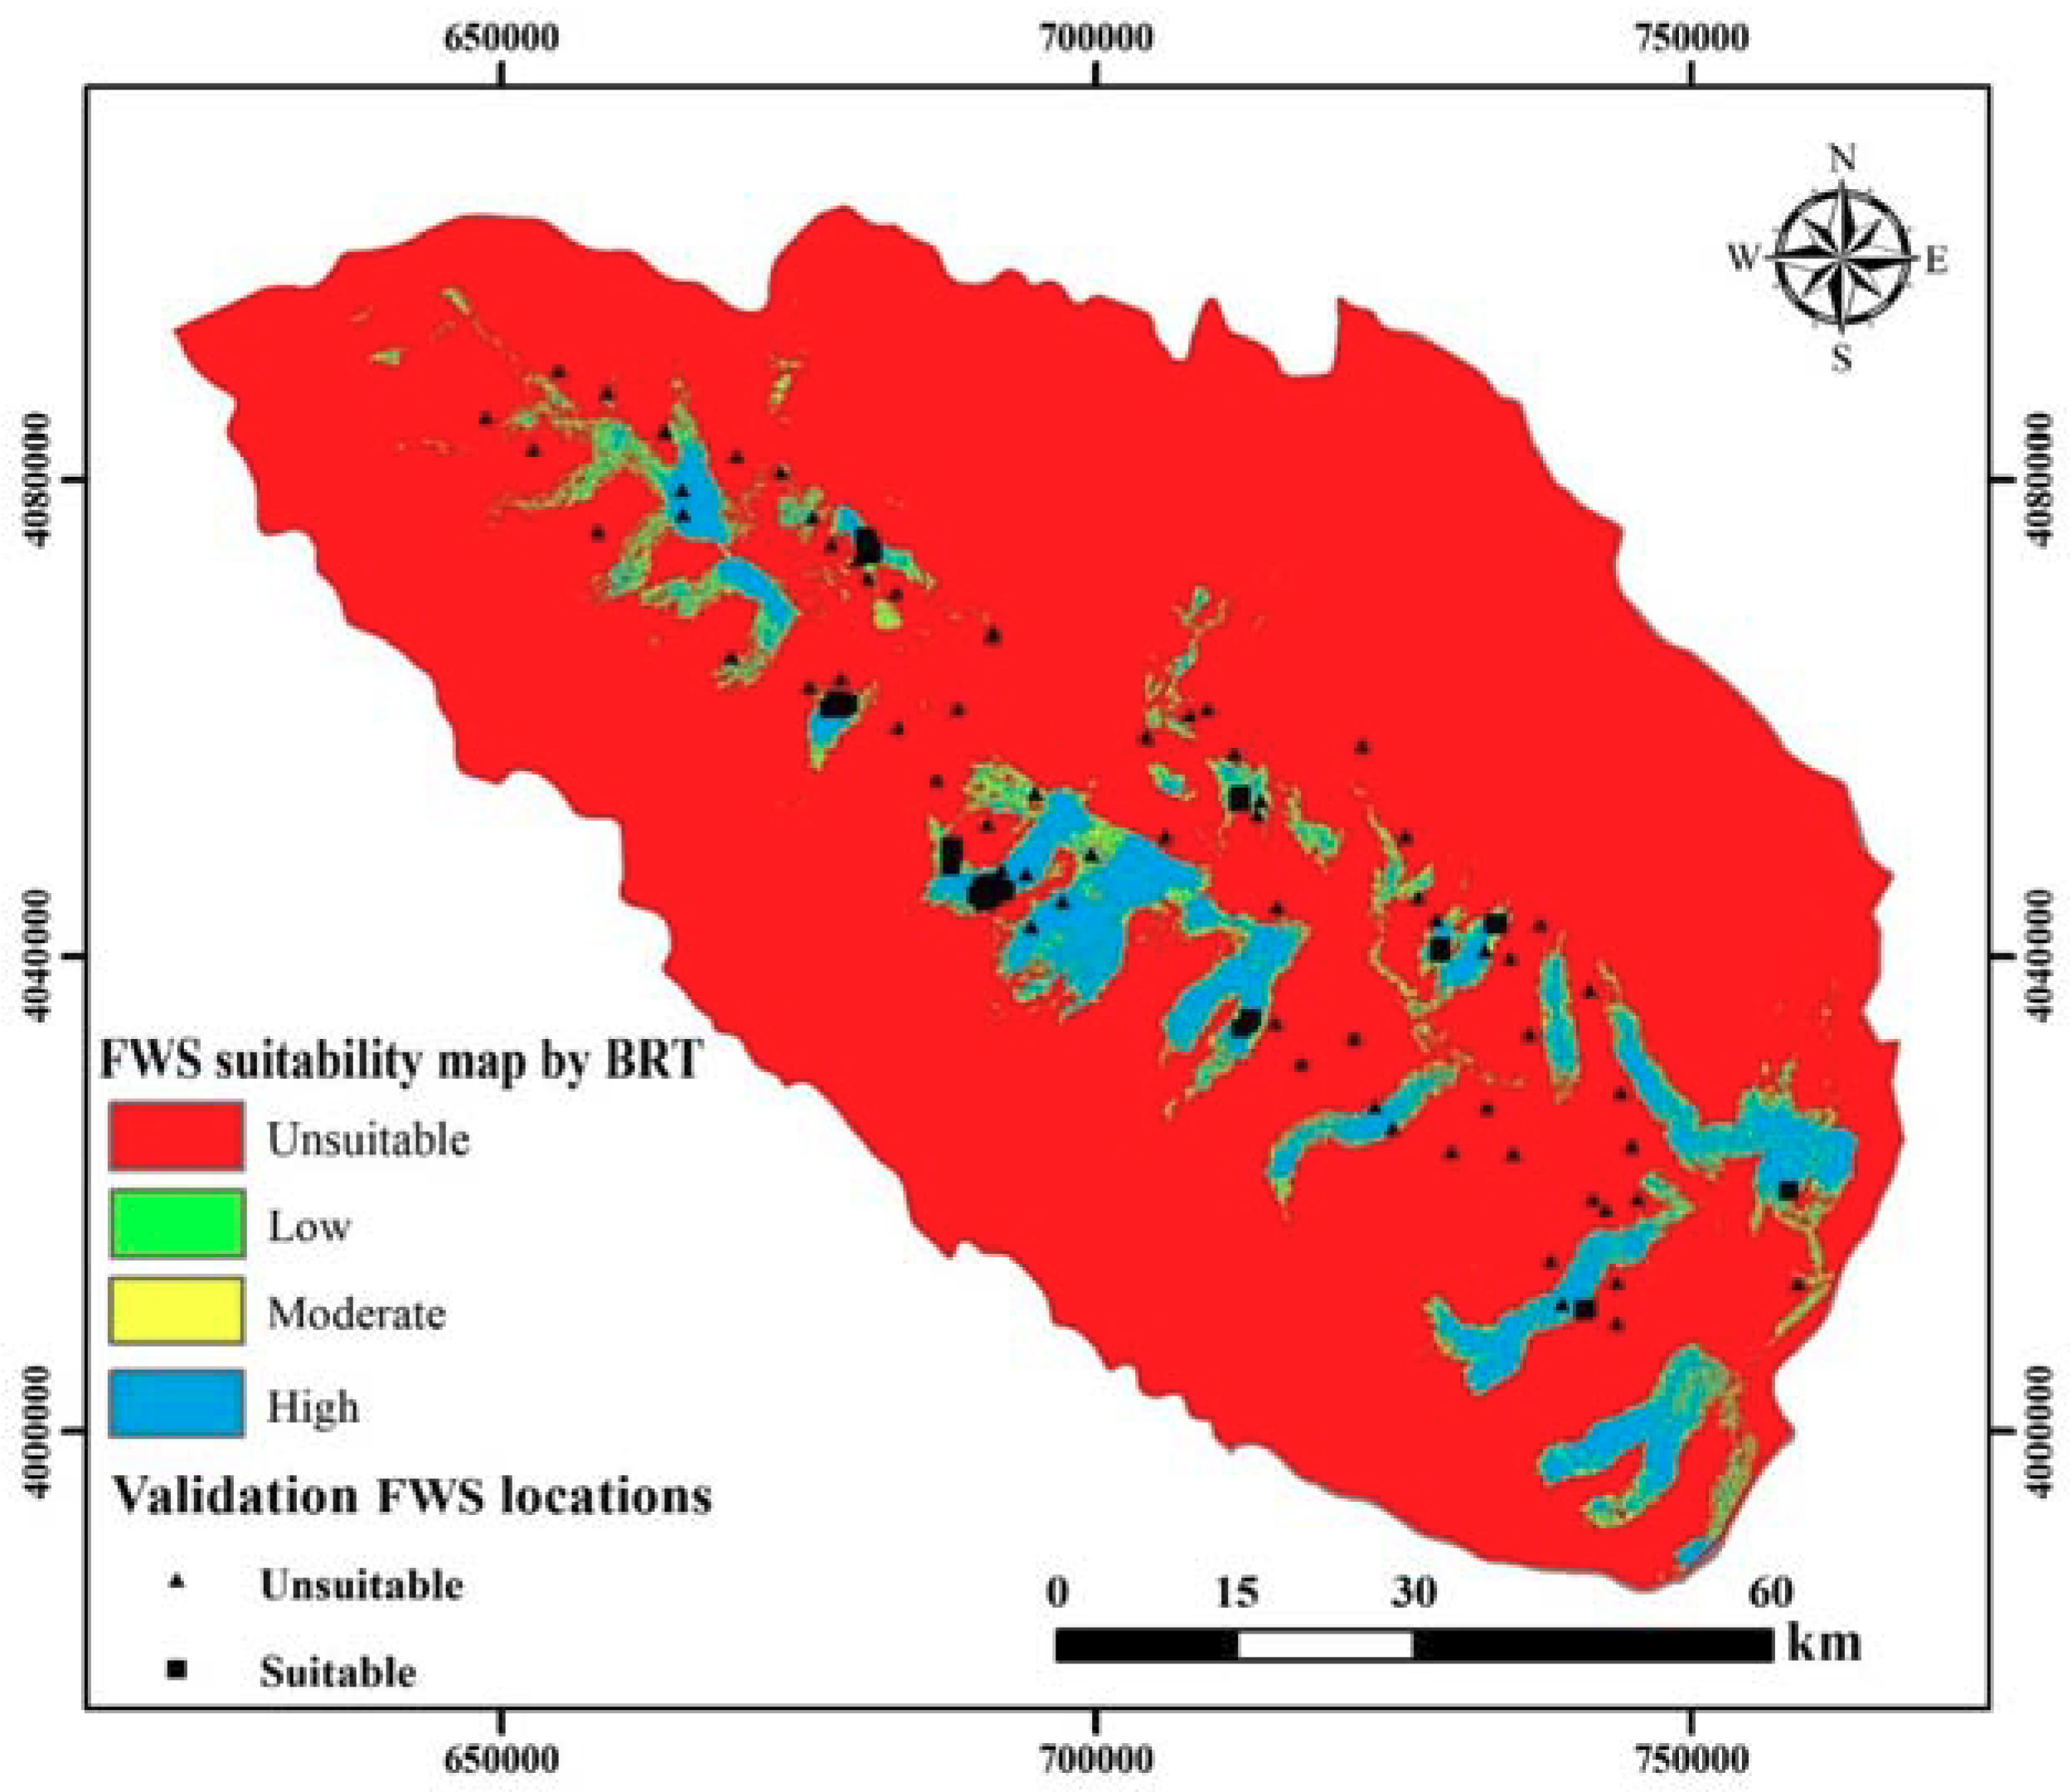
3.1. Application of BRT

Based on the calibration results, the final BRT model has 1400 trees, an interaction depth of 9, 20 minimum number of observations in the trees terminal nodes (or n.minobsinnode), and 0.05 shrinkage (Figure 6). The initial parameters, i.e., the number of trees, varies between 500 and 1200, the max tree depth changes from 5 to 11, and the shrinkage includes 0.001, 0.010, 0.050, and 0.100. Figure 7 shows the FWS suitability map produced by the BRT model. As seen in the figure, most of the study region (89.3%) has been categorized as unsuitable for FWS construction. On the other hand, the high FWS suitable zone includes a very small portion of the watershed (6.7%).
Further, the importance of the FWS conditioning factors was determined by the BRT algorithm. Based on Table 2, it can be seen that transmissivity, distance from rivers, and EC are the most important FWS conditioning factors in the modeling procedure. On the contrary, soil infiltration, lithology, plan curvature, and land use was defined as the least important FWS conditioning factors for the implemented dataset.

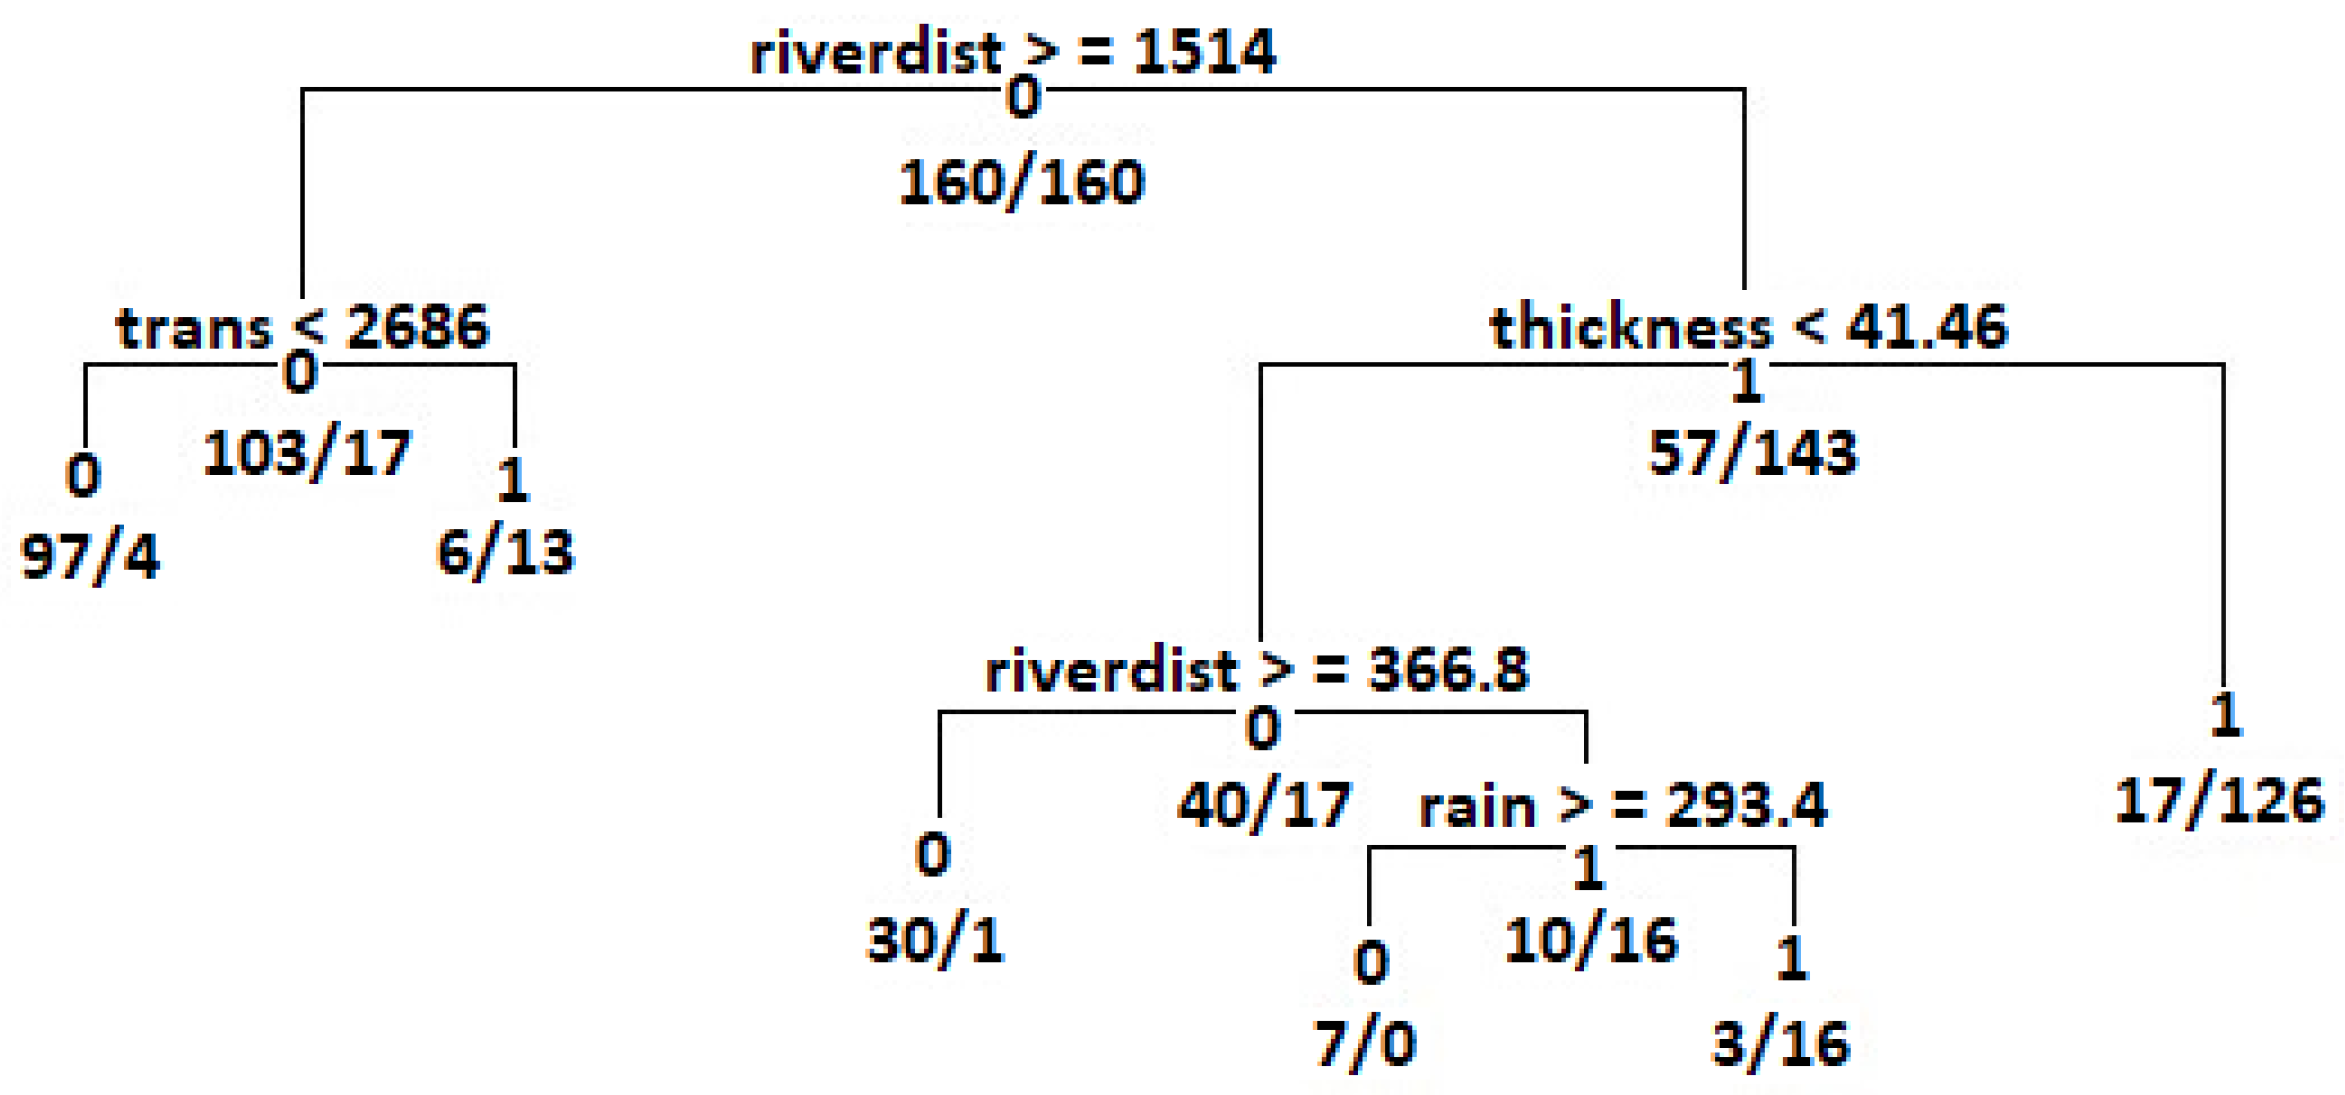
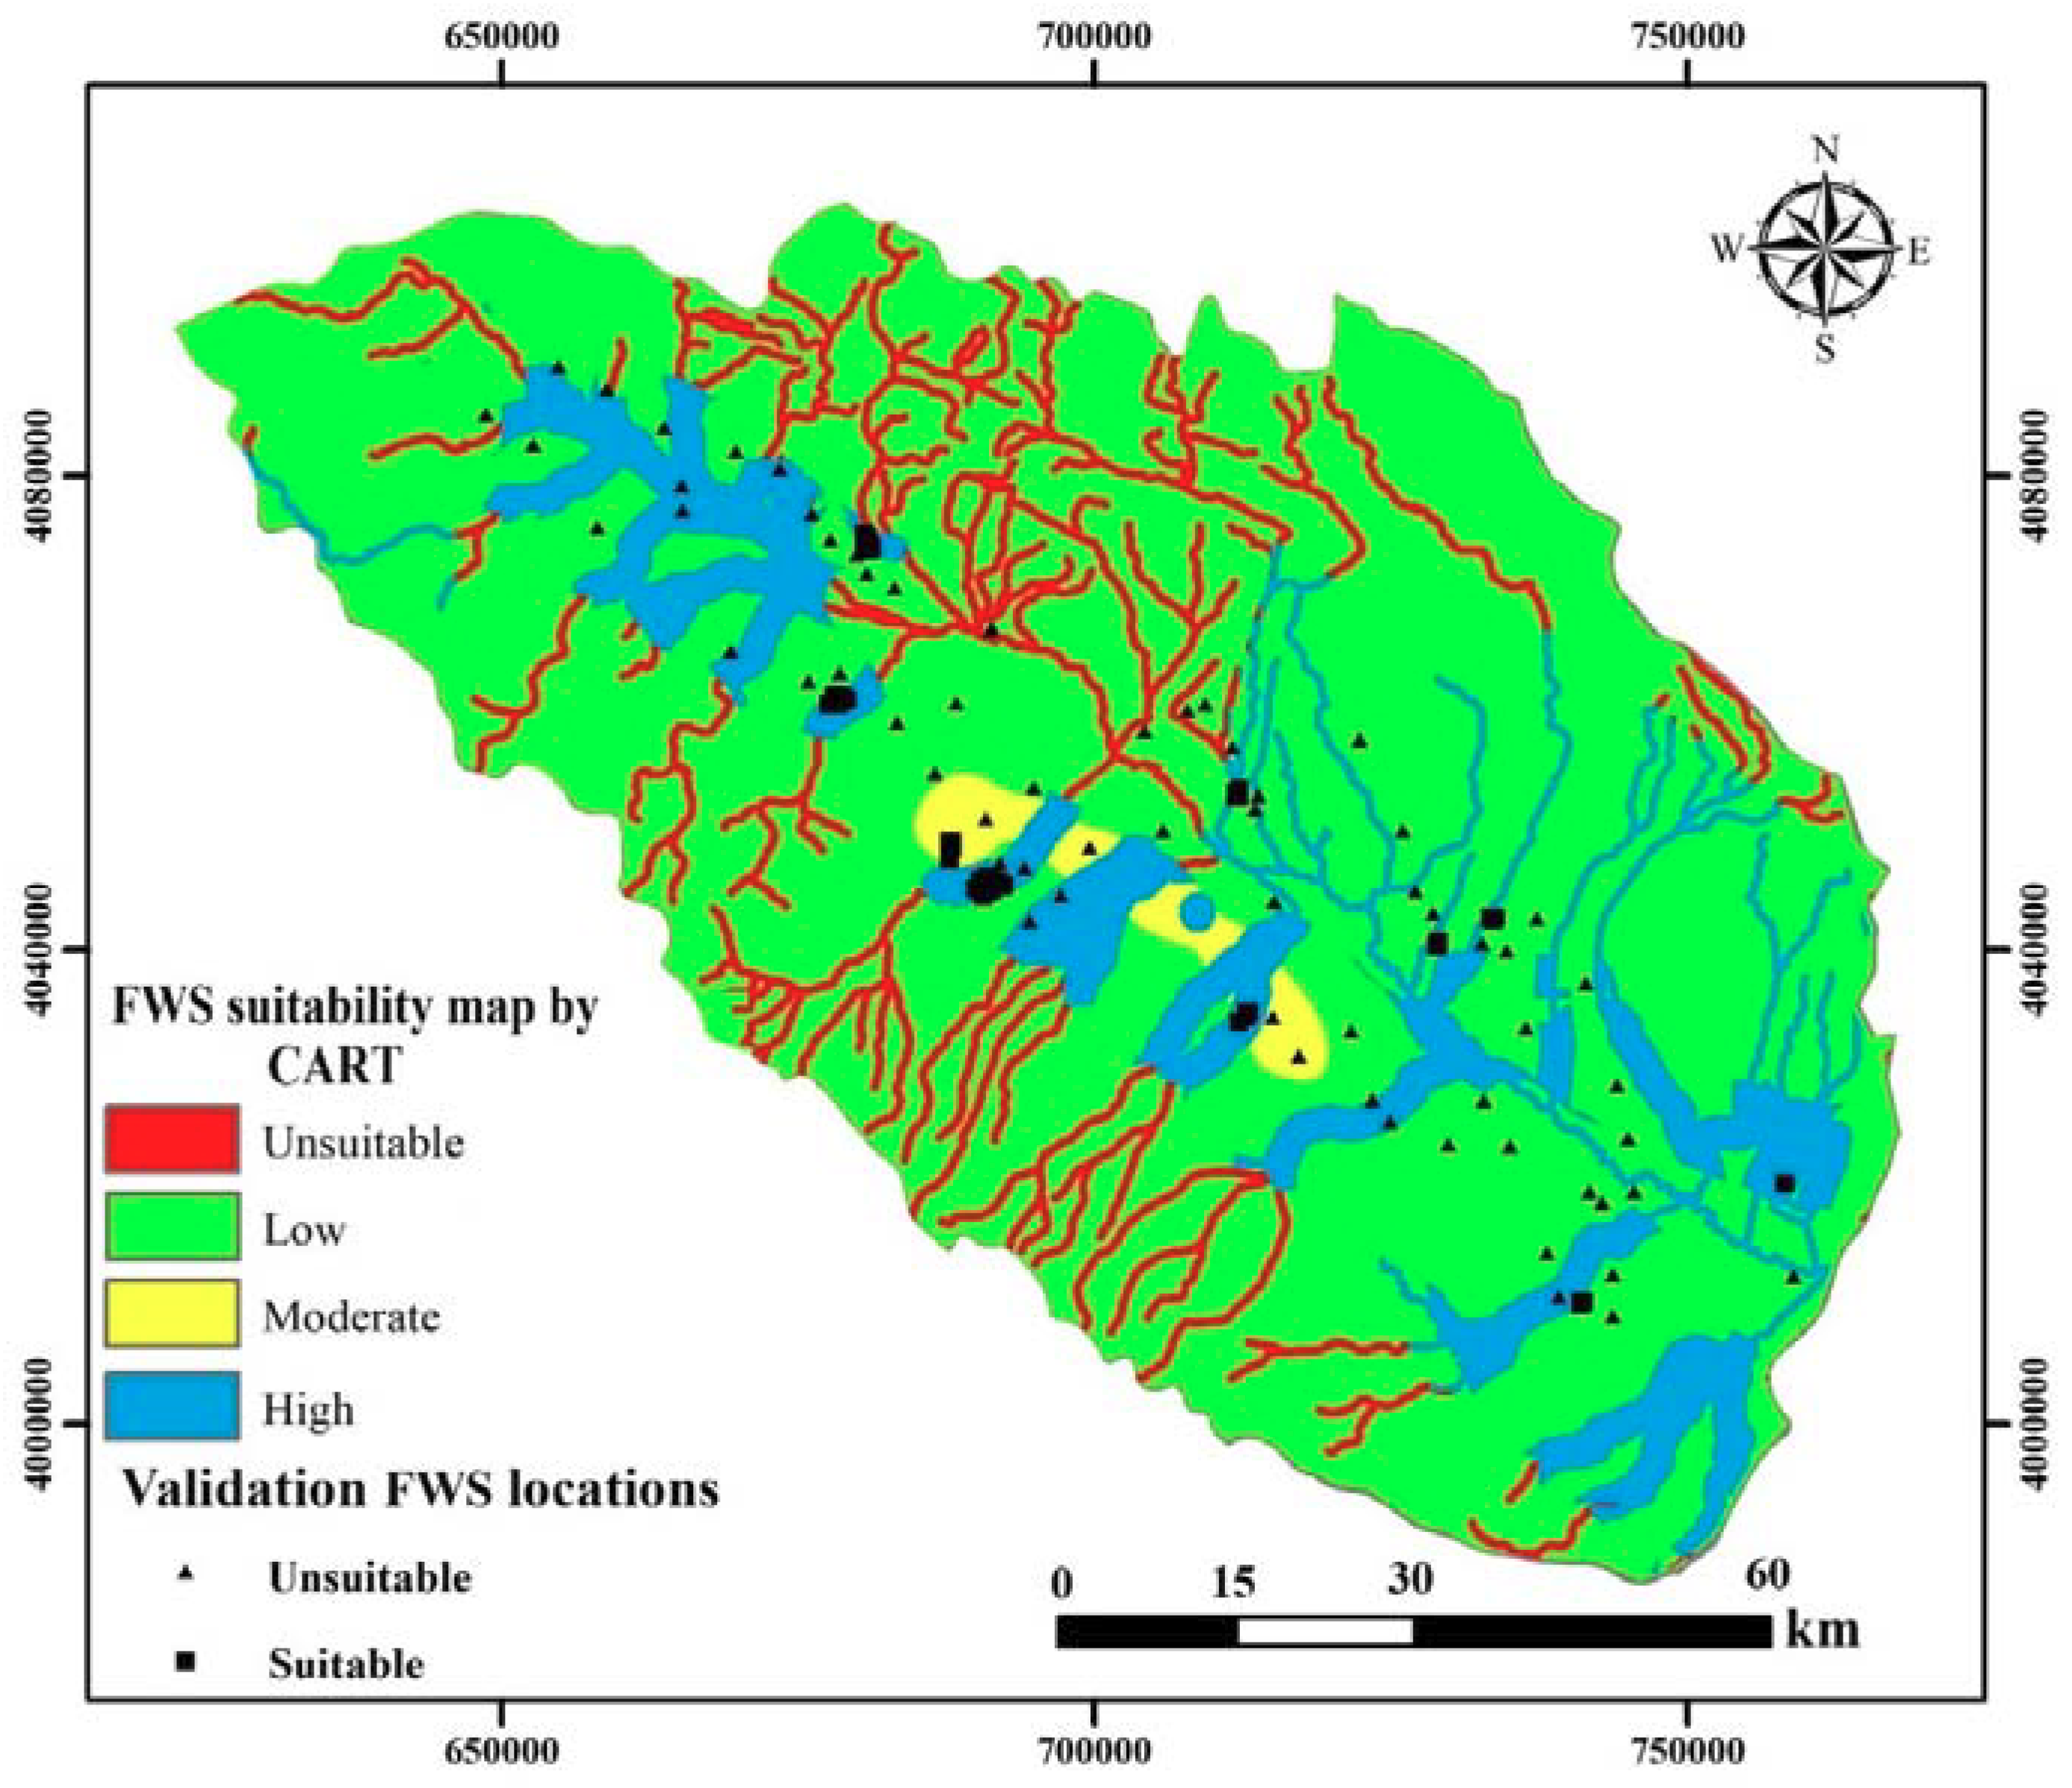
3.2. Application of CART

The CART algorithm was calibrated using the training dataset. Based on the results, the CART model was pruned by a complexity parameter (cp) of 0.03. The final classification tree obtained by the CART is presented in Figure 8. As seen, the CART has used only four factors in its final pruned classification tree. Distance from rivers was selected as the root of the CART that shows its high impact on the modeling procedure. The CART assigned 0 (i.e., FWS unsuitable location) to the distance from rivers with values >1514. Then, aquifer thickness and transmissivity were used to split the dataset into FWS unsuitable and suitable locations. Finally, distance from rivers and rainfall factors were taken into account. Figure 9 shows the FWS suitability map obtained using the CART algorithm. As seen, the low class of suitability occupied the largest area (73.7%). The high FWS suitable zone, on the other hand, includes only 15.7% of the watershed.

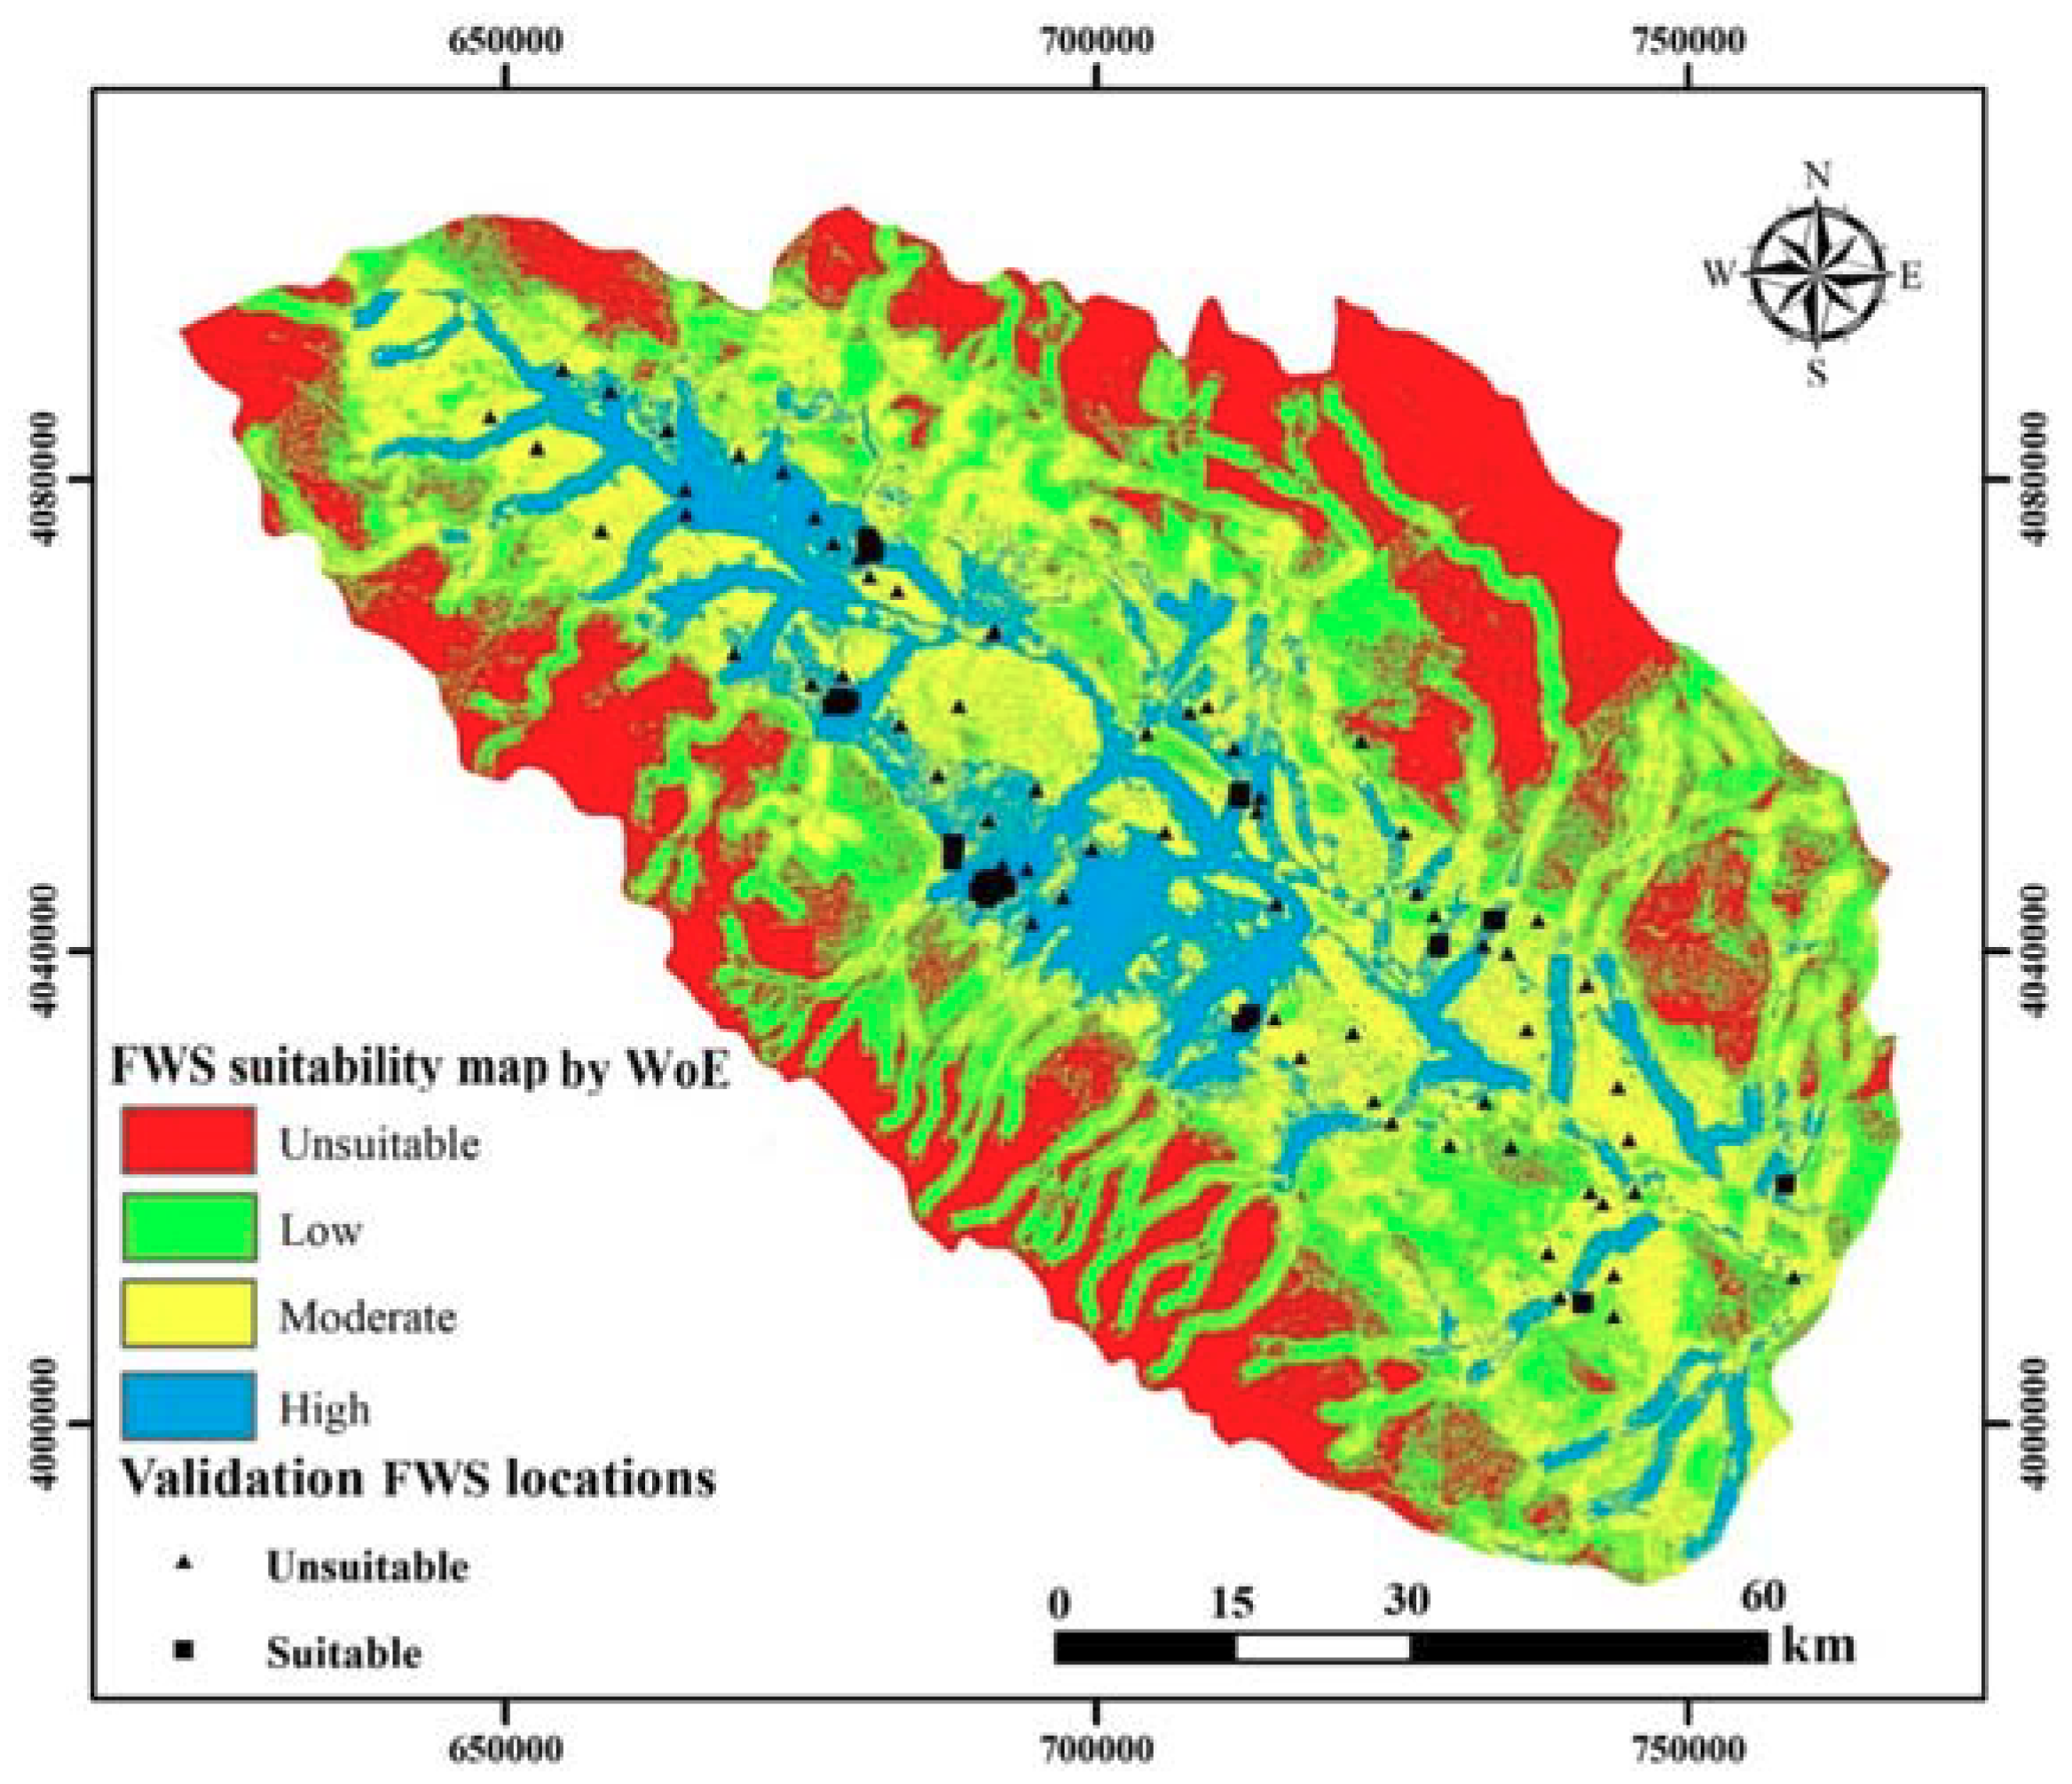
3.3. Application of WoE

Table 3 shows the results of WoE for the training dataset. In the case of the slope percent, it was seen that the classes of 0–2 and 2–5% have the highest positive final weights. The convex class of plan curvature and the (−0.001)–(0.001) class of profile curvature showed the positive final weights. In the case of transmissivity, only values more than 900 m2 day−1 had a positive final weight as all the FWS locations were found in this class. Aquifer thickness classes of 40–80 and >80 m had positive final weights of 12.88 and 4.64, respectively. The EC class of 1000–3000 µmhos cm−1 had a positive final weight of 7.31. The rainfall class of 275–350 mm had the highest positive final weight of 6.87. Distances from rivers less than 1000 m had a positive final weight of 7.60, while higher distances showed negative final weights. In the case of river density, it can be seen that 0.47–0.80 and 0.14–0.47 km km−2 have the highest final weights of 9.38 and 1.43, respectively. In the light of soil infiltration, classes of >7.62 and 3.81–7.62 mm h−1 had the highest positive final weights. In the respect of land use, agriculture and orchard types had the highest positive weights of 2.98 and 0.2, respectively. Two lithological classes of recent alluvium and gravel fan have positive final weights of 15.40 and 8.79, respectively. Figure 10 presents the FWS suitability zones obtained from the WoE algorithm. It can be observed that there is not a dominant suitability zone in this map. Each zone occupies an area of around 20%. The unsuitable and high classes of suitability cover 25.2, and 16.2% of the watershed, respectively.

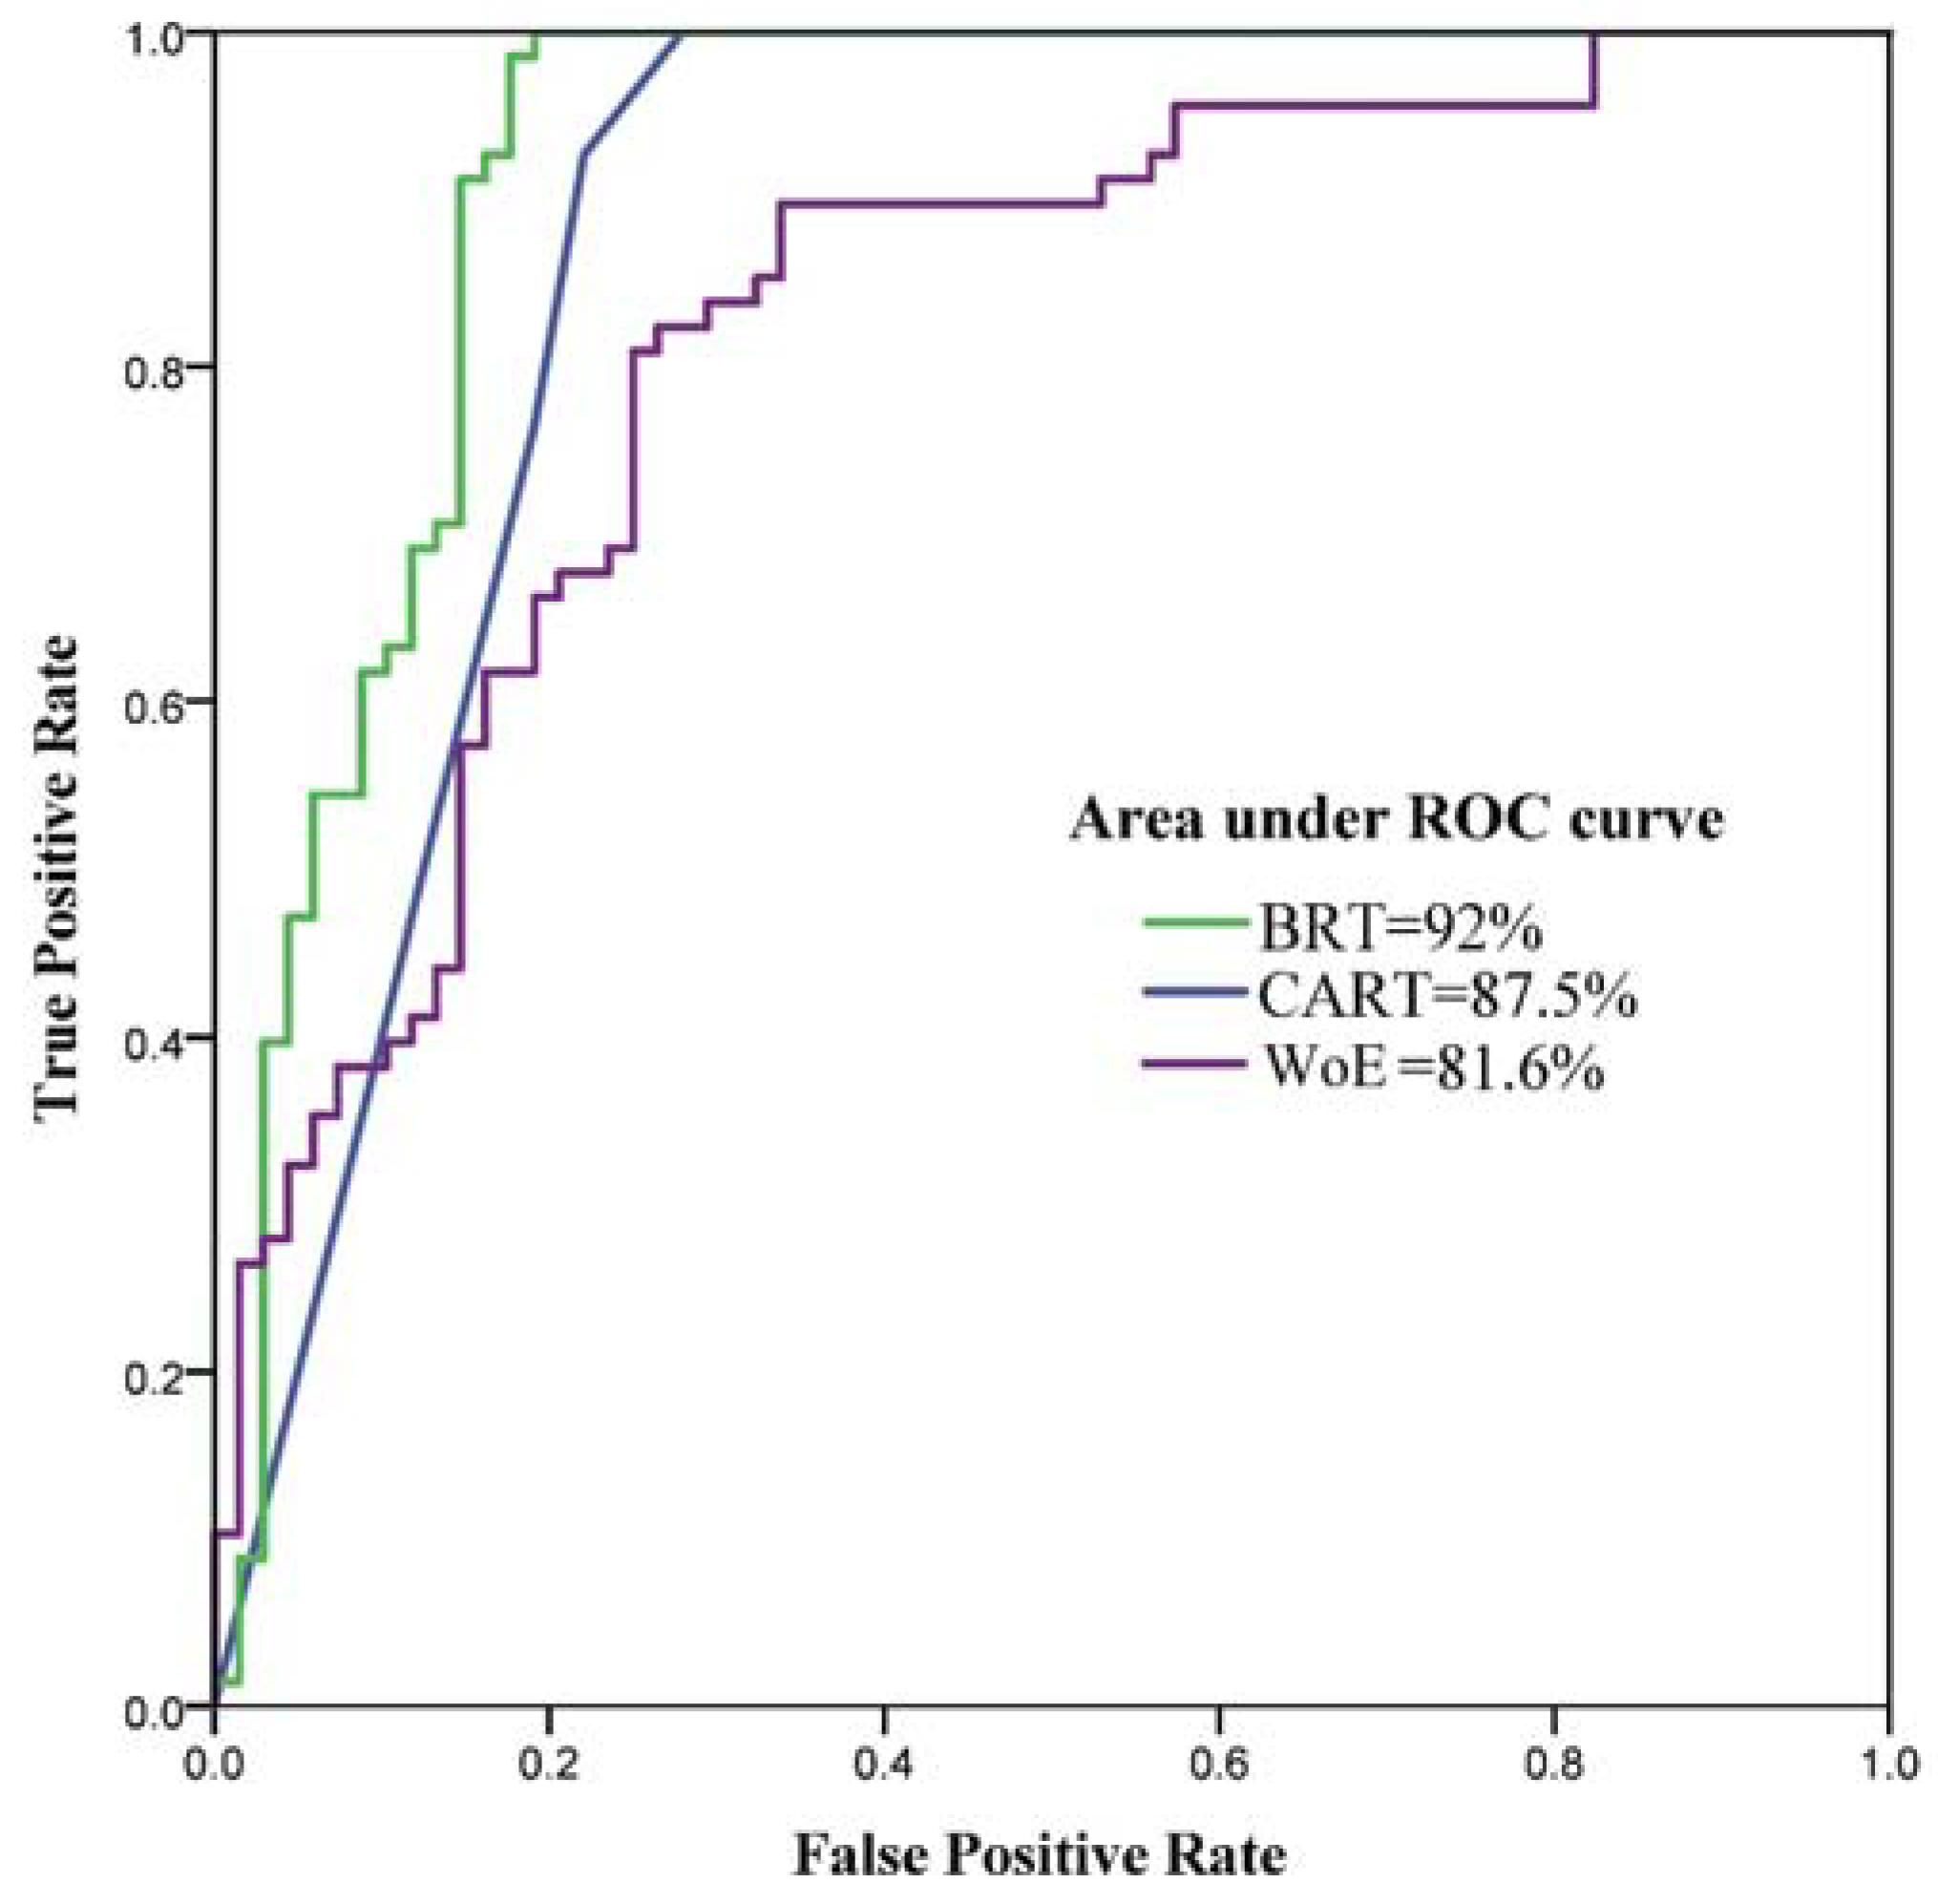
3.4. Validation of the FWS Suitability Maps by a ROC Curve

The validation of the methods is a critical step in modeling, which shows whether they are applicable. This study implemented a receiver operating characteristics (ROC) curve to validate FWS suitability maps obtained by the BRT, CART, and WoE algorithms. ROC is a well-known method for validating binary models, which have been employed by many scholars for landslide, gully, flood, and GW studies [63,64,65]. This curve plots the true and false positive rates against each other [66,67]. The area under the ROC curve ranges between 0 and 1, where a value of 1 represents an ideal model [68,69,70,71]. In contrast, an area of 0.5 depicts a weaker model [72,73,74]. The results of the ROC curve are shown in Figure 11. As seen, the BRT, CART, and WoE methods have an area under the ROC curve with values of 92, 87.5, and 81.6%, respectively.

4. Discussion

Middle Eastern countries including Iran are known to be the most water-scarce areas worldwide [75]. The over-exploitation of groundwater in the Mashhad Plain has led to a decline in the water table. This has caused problems for the sustainable development of the region that has resulted in the migration of the residents to other areas during the last decade. This study investigated the efficacy of the BRT, CART, and WoE algorithms for spatial modeling of FWS suitable areas. The findings depicted that BRT had the best performance, followed by the CART, and WoE algorithms. All the implemented algorithms had an area under the ROC curves of higher than 80%, which represents the acceptable efficiency in diagnostic algorithms. In the case of the contribution of the FWS conditioning factors in the modeling procedure, the CART used only four out of twelve factors in its final tree. Those conditioning factors are the distance from rivers, transmissivity, aquifer thickness, and rainfall. It shows that this algorithm employed the least number of factors. A simpler algorithm is believed to have more stability and be able to be generalized [27,76]. These models are appropriate when they are applied to a wider area. The simpler decision tree obtained by the CART leads the model to be more applicable as it is not over-fitted to many variables. Further, a fewer number of variables is needed for running the CART, and this causes the model to be able to be applied in different areas simply.
The BRT, on the other hand, used all the twelve FWS conditioning factors for creating trees in its process. This algorithm had similar results to the CART as it defined transmissivity, distance from rivers, and aquifer thickness as the most important factors in its procedure. These factors are three out of the four factors that were used in the final CART. The superior efficacy of the BRT algorithm in modeling FWS suitability in this study can be related to some of its strong features. BRT combines different simple trees like CART outputs to predict the final response [51]. This feature is called boosting and it is similar in nature to model averaging, which can reduce overfitting problem in this model [24]. BRT produces better outputs than single trees such as CART as it grows many trees [51] and extracts information from any possible relationship between the response and input variables. Further, the suitability map by the WoE model showed acceptable performance. The weights-of-evidence of each class of the FWS conditioning factors show whether there is a direct correlation (for positive values) or reverse correlation (for negative values) with FWS suitability. The WoE produced more interpretable outputs that are more understandable for the managers as well as the stakeholders. The importance of the FWS conditioning factors could be regarded as a guideline for the modelers and water resources managers as it shows the variables that have a higher contribution to the modeling process. In other words, importance values represent the sensitivity of the model to each one of its input variables. For obtaining more accurate FWS suitability maps in the Mashhad Plain, modelers as well as water resources managers ought to focus on the most important factors in determining the suitable areas. For the case of the Mashhad Plain, these factors encompass the transmissivity, distance from rivers, and aquifer thickness. An applicable guideline of this study is to encourage water managers to ensure the quality and accuracy of the above-mentioned factors. According to the results, the application of the BRT model for FWS suitability mapping can be suggested for the Mashhad Plain due to its higher accuracy relative to the other models.
Artificial recharge is an efficient technique to augment GW resources, which is related to both flood-related and GW-related factors. Hydrogeological phenomena are complex and the relationship between response and input variables has a non-linear nature. Additionally, flood-related factors are complex to model. These uncertainties obliged us to implement three more sophisticated algorithms to get more reliable outputs. The interpretation of the FWS suitability maps showed that there is a strong pattern in the vicinity of the rivers in the study area. This pattern exists in all the maps produced by BRT, CART, and WoE. The BRT model defined a large part of the study area as unsuitable. The moderate and high suitable classes for FWS construction by the BRT cover a very small part of the studied region. In the FWS suitability maps by the CART and WoE algorithms, most of the watershed has been assigned to low suitability. Despite these differences between the outputs of the models, it can be seen that all the models have defined similar areas as the high FWS suitable zone. This fact diminishes the existing uncertainties in the results as the three model outputs are quite similar in the case of defining the high suitability zone for FWS establishment.
With the outputs of this study, suitable areas can be selected with less time and cost. The managers can double-check the suggested locations for FWS construction produced by the suitability maps through field surveys. Accordingly, highly suitable areas for FWS projects produced by the models are suggested for the artificial recharge of groundwater. Construction of several FWS systems in suitable spots based on the FWS suitability maps in the Mashhad Plain can improve groundwater conditions and reduce flood damage in this populated area. Further, the application of the BRT, CART, and WoE can also be used for defining suitable locations for other types of artificial recharge techniques, i.e., injection wells, in the Mashhad Plain considering the proper conditioning factors. The methodology is also suggested to be used as a guideline for water sector managers and stakeholders. The construction of FWS systems, as well as other artificial recharge methods, could change the critical situation of water resources in different countries.

Author Contributions

All authors listed in the co-authorship team have contributed in different parts of the manuscript. “Conceptualization, S.A.N., M.V. and H.H., B.P.; Methodology, S.A.N., M.V., S.J.A.; Software, S.A.N. and S.J.A.; Validation, S.A.N.; Writing-Original Draft Preparation, S.A.N.; Writing-Review & Editing, M.V.; H.H. and B.P.

Acknowledgments

The authors would like to appreciate Khorasan Razavi Rangeland and Watershed Management Organization and Khorasan Razavi Regional Water Authority for providing sufficient data for this study.

Conflicts of Interest

The authors declare no conflict of interest.

References

  1. Mahdavi, M. Applied Hydrology, 5th ed.; University of Tehran Press: Tehran, Iran, 2004; Volume 2. [Google Scholar]
  2. Chezgi, J.; Pourghasemi, H.R.; Naghibi, S.A.; Moradi, H.R.; Kheirkhah Zarkesh, M. Assessment of a spatial multi-criteria evaluation to site selection underground dams in the Alborz Province, Iran. Geocarto Int. 2015, 31, 628–646. [Google Scholar] [CrossRef]
  3. Shaker, M.; Hosseini, H. Aid and save learning and reduction of disaster impacts. In Proceedings of the International Conference of Crisis Management, Tehran, Iran, 24 September 2006. [Google Scholar]
  4. Pradhan, B.; Youssef, A.M. A 100-year maximum flood susceptibility mapping using integrated hydrological and hydrodynamic models: Kelantan River Corridor, Malaysia. J. Flood Risk Manag. 2011, 4, 189–202. [Google Scholar] [CrossRef]
  5. Rahmati, O.; Pourghasemi, H.R.; Melesse, A.M. Application of GIS-based data driven random forest and maximum entropy models for groundwater potential mapping: A case study at Mehran Region, Iran. Catena 2016, 137, 360–372. [Google Scholar] [CrossRef]
  6. Hashemi, H.; Berndtsson, R.; Kompani-Zare, M.; Persson, M. Natural vs. artificial groundwater recharge, quantification through inverse modeling. Hydrol. Earth Syst. Sci. 2013, 17, 637–650. [Google Scholar] [CrossRef]
  7. Jafari, M.; Tavili, A.; Panahi, F.; Zandi Esfahan, E.; Ghorbani, M. Reclamation of Arid Lands; Springer International Publishing: Basel, Switzerland, 2018; ISBN 978-3-319-54827-2. [Google Scholar]
  8. Zarkesh, M.K. Decision Support System for Floodwater Spreading Site Selection in Iran; ITC Publication: Cannon Hill, Australia, 2005; ISBN 9085042569. [Google Scholar]
  9. Ghayoumian, J.; Ghermezcheshme, B.; Feiznia, S.; Noroozi, A.A. Integrating GIS and DSS for identification of suitable areas for artificial recharge, case study Meimeh Basin, Isfahan, Iran. Environ. Geol. 2005, 47, 493–500. [Google Scholar] [CrossRef]
  10. Ghayoumian, J.; Mohseni Saravi, M.; Feiznia, S.; Nouri, B.; Malekian, A. Application of GIS techniques to determine areas most suitable for artificial groundwater recharge in a coastal aquifer in southern Iran. J. Asian Earth Sci. 2007, 30, 364–374. [Google Scholar] [CrossRef]
  11. Alesheikh, A.A.; Soltani, M.J.; Nouri, N.; Khalilzadeh, M. Land assessment for flood spreading site selection using geospatial information system. Int. J. Environ. Sci. Technol. 2008, 5, 455–462. [Google Scholar] [CrossRef] [Green Version]
  12. Mahdavi, A.; Tabatabaei, S.H.; Mahdavi, R.; Nouri Emamzadei, M.R. Application of digital techniques to identify aquifer artificial recharge sites in GIS environment. Int. J. Digit. Earth 2013, 6, 589–609. [Google Scholar] [CrossRef] [Green Version]
  13. Moradi Dashtpagerdi, M.; Nohegar, A.; Vagharfard, H.; Honarbakhsh, A.; Mahmoodinejad, V.; Noroozi, A.; Ghonchehpoor, D. Application of Spatial Analysis Techniques to Select the Most Suitable Areas for Flood Spreading. Water Resour. Manag. 2013, 27, 3071–3084. [Google Scholar] [CrossRef]
  14. Zaidi, F.K.; Nazzal, Y.; Ahmed, I.; Naeem, M.; Jafri, M.K. Identification of potential artificial groundwater recharge zones in Northwestern Saudi Arabia using GIS and Boolean logic. J. Afr. Earth Sci. 2015, 111, 156–169. [Google Scholar] [CrossRef]
  15. Sargaonkar, A.P.; Rathi, B.; Baile, A. Identifying potential sites for artificial groundwater recharge in sub-watershed of River Kanhan, India. Environ. Earth Sci. 2011, 62, 1099–1108. [Google Scholar] [CrossRef]
  16. Nasiri, H.; Boloorani, A.D.; Sabokbar, H.A.F.; Jafari, H.R.; Hamzeh, M.; Rafii, Y. Determining the most suitable areas for artificial groundwater recharge via an integrated PROMETHEE II-AHP method in GIS environment (case study: Garabaygan Basin, Iran). Environ. Monit. Assess. 2013, 185, 707–718. [Google Scholar] [CrossRef] [PubMed]
  17. Rahimi, S.; Shadman Roodposhti, M.; Ali Abbaspour, R. Using combined AHP-genetic algorithm in artificial groundwater recharge site selection of Gareh Bygone Plain, Iran. Environ. Earth Sci. 2014, 72, 1979–1992. [Google Scholar] [CrossRef]
  18. Agarwal, R.; Garg, P.K. Remote Sensing and GIS Based Groundwater Potential & Recharge Zones Mapping Using Multi-Criteria Decision-Making Technique. Water Resour. Manag. 2016, 30, 243–260. [Google Scholar] [CrossRef]
  19. Magesh, N.S.; Chandrasekar, N.; Soundranayagam, J.P. Delineation of groundwater potential zones in Theni district, Tamil Nadu, using remote sensing, GIS and MIF techniques. Geosci. Front. 2012, 3, 189–196. [Google Scholar] [CrossRef]
  20. Senanayake, I.P.; Dissanayake, D.M.D.O.K.; Mayadunna, B.B.; Weerasekera, W.L. An approach to delineate groundwater recharge potential sites in Ambalantota, Sri Lanka using GIS techniques. Geosci. Front. 2016, 7, 115–124. [Google Scholar] [CrossRef]
  21. Prabhu, M.V.; Venkateswaran, S. Delineation of Artificial Recharge Zones Using Geospatial Techniques in Sarabanga Sub Basin Cauvery River, Tamil Nadu. Aquat. Procedia 2015, 4, 1265–1274. [Google Scholar] [CrossRef]
  22. Carver, S.J. Integrating multi-criteria evaluation with geographical information systems. Int. J. Geogr. Inf. Syst. 1991, 5, 321–339. [Google Scholar] [CrossRef] [Green Version]
  23. Thungngern, J.; Wijitkosum, S.; Sriburi, T. A review of the analytical hierarchy process (AHP) an approach to water resource management in Thailand. Appl. Environ. Res. 2015, 37, 13–32. [Google Scholar]
  24. Naghibi, S.A.; Pourghasemi, H.R.; Dixon, B. GIS-based groundwater potential mapping using boosted regression tree, classification and regression tree, and random forest machine learning models in Iran. Environ. Monit. Assess. 2016, 188, 44. [Google Scholar] [CrossRef] [PubMed]
  25. Youssef, A.M.; Pourghasemi, H.R.; Pourtaghi, Z.S.; Al-Katheeri, M.M. Landslide susceptibility mapping using random forest, boosted regression tree, classification and regression tree, and general linear models and comparison of their performance at Wadi Tayyah Basin, Asir Region, Saudi Arabia. Landslides 2015. [Google Scholar] [CrossRef]
  26. Mousavi, S.M.; Golkarian, A.; Amir Naghibi, S.; Kalantar, B.; Pradhan, B. GIS-based Groundwater Spring Potential Mapping Using Data Mining Boosted Regression Tree and Probabilistic Frequency Ratio Models in Iran. AIMS Geosci. 2017, 3, 91–115. [Google Scholar] [CrossRef]
  27. Naghibi, S.A.; Pourghasemi, H.R. A Comparative Assessment Between Three Machine Learning Models and Their Performance Comparison by Bivariate and Multivariate Statistical Methods in Groundwater Potential Mapping. Water Resour. Manag. 2015, 29. [Google Scholar] [CrossRef]
  28. Tehrany, M.S.; Pradhan, B.; Jebur, M.N. Flood susceptibility mapping using a novel ensemble weights-of-evidence and support vector machine models in GIS. J. Hydrol. 2014, 512, 332–343. [Google Scholar] [CrossRef]
  29. Mohammady, M.; Pourghasemi, H.R.; Pradhan, B. Landslide susceptibility mapping at Golestan Province, Iran: A comparison between frequency ratio, Dempster–Shafer, and weights-of-evidence models. J. Asian Earth Sci. 2012, 61, 221–236. [Google Scholar] [CrossRef]
  30. Pourghasemi, H.R.; Pradhan, B.; Gokceoglu, C.; Mohammadi, M.; Moradi, H.R. Application of weights-of-evidence and certainty factor models and their comparison in landslide susceptibility mapping at Haraz watershed, Iran. Arab. J. Geosci. 2013, 6, 2351–2365. [Google Scholar] [CrossRef] [Green Version]
  31. Pourghasemi, H.; Pradhan, B.; Gokceoglu, C.; Moezzi, K.D. A comparative assessment of prediction capabilities of Dempster–Shafer and Weights-of-evidence models in landslide susceptibility mapping using GIS. Geomat. Nat. Hazards Risk 2013, 4, 93–118. [Google Scholar] [CrossRef] [Green Version]
  32. Hong, H.; Naghibi, S.A.; Pourghasemi, H.R.; Pradhan, B. GIS-based landslide spatial modeling in Ganzhou City, China. Arab. J. Geosci. 2016, 9, 112. [Google Scholar] [CrossRef]
  33. Regmi, A.D.; Devkota, K.C.; Yoshida, K.; Pradhan, B.; Pourghasemi, H.R.; Kumamoto, T.; Akgun, A. Application of frequency ratio, statistical index, and weights-of-evidence models and their comparison in landslide susceptibility mapping in Central Nepal Himalaya. Arab. J. Geosci. 2014, 7, 725–742. [Google Scholar] [CrossRef]
  34. Chen, W.; Xie, X.; Wang, J.; Pradhan, B.; Hong, H.; Bui, D.T.; Duan, Z.; Ma, J. A comparative study of logistic model tree, random forest, and classification and regression tree models for spatial prediction of landslide susceptibility. Catena 2017, 151, 147–160. [Google Scholar] [CrossRef]
  35. Abdullahi, S.; Pradhan, B. Sustainable Brownfields Land Use Change Modeling Using GIS-based Weights-of-Evidence Approach. Appl. Spat. Anal. Policy 2016, 9, 21–38. [Google Scholar] [CrossRef]
  36. Abdullahi, S.; Pradhan, B. Land use change modeling and the effect of compact city paradigms: Integration of GIS-based cellular automata and weights-of-evidence techniques. Environ. Earth Sci. 2018, 77, 251. [Google Scholar] [CrossRef]
  37. Khorasan Razavi Regional Water Authority (KRRWA) 2017. Available online: www.khrw.ir (accessed on 20 March 2018).
  38. Akbari, M.; Jorgeh, M.R.; Madani Sadat, H. Investigation of the water table decrease using geographic information system (GIS) (Case study: Mashhad Plan aquifer). Soil Water Conserv. J. 2009, 4, 63–78. (In Persian) [Google Scholar]
  39. Hashemi, H.; Berndtsson, R.; Persson, M. Artificial recharge by floodwater spreading estimated by water balances and groundwater modelling in arid Iran. Hydrol. Sci. J. 2015, 60, 336–350. [Google Scholar] [CrossRef]
  40. Pakparvar, M.; Hashemi, H.; Rezaei, M.; Cornelis, W.M.; Nekooeian, G.; Kowsar, S.A. Artificial recharge efficiency assessment by soil water balance and modelling approaches in a multi-layered vadose zone in a dry region. Hydrol. Sci. J. 2018, 63, 1183–1202. [Google Scholar] [CrossRef]
  41. Hashemi, H.; Kowsar, S.A.; Berndtsson, R.; Wang, X.; Yasuda, H. Using Floodwater for Artificial Recharge and Spate Irrigation. Sustain. Water Resour. Manag. 2017, 697–736. [Google Scholar] [CrossRef]
  42. Hashemi, H.; Uvo, C.B.; Berndtsson, R. Coupled modeling approach to assess climate change impacts on groundwater recharge and adaptation in arid areas. Hydrol. Earth Syst. Sci. 2015, 19, 4165–4181. [Google Scholar] [CrossRef] [Green Version]
  43. Ghahari, G.; Hashemi, H.; Berndtsson, R. Spate irrigation of barley through floodwater harvesting in the gareh-bygone plain, Iran. Irrig. Drain. 2014, 63, 599–611. [Google Scholar] [CrossRef]
  44. Khorasan Razavi Rangeland and Watershed Management (KRRWM). Jamab Chenaran Floodwater Control and Spreading Project; Rangeland and Watershed Management Organization: Mashhad, Iran, 2008. [Google Scholar]
  45. Roostayi, S. Technical and Economic Evaluation of Floodwater Spreading System (Case Study: Jamab and Sobhani Floodwater Spreading Systems). Master’s Thesis, Semnan University, Semnan, Iran, 2014. [Google Scholar]
  46. Wilson, J.P.; Gallant, J.C. (Eds.) Terrain Analysis: Principles and Applications; Wiley: Hoboken, NJ, USA, 2000; ISBN 9780471321880. [Google Scholar]
  47. Shary, P.A.; Sharaya, L.S.; Mitusov, A.V. Fundamental quantitative methods of land surface analysis. Geoderma 2002, 107, 1–32. [Google Scholar] [CrossRef]
  48. Ayalew, L.; Yamagishi, H. The application of GIS-based logistic regression for landslide susceptibility mapping in the Kakuda-Yahiko Mountains, Central Japan. Geomorphology 2005, 65, 15–31. [Google Scholar] [CrossRef]
  49. Te Chow, V.; Maidment, D.R.; Mays, L.W. Applied Hydrology; McGraw-Hill: New York, NY, USA, 1988; ISBN 0070108102. [Google Scholar]
  50. Abeare, S.M. Comparisons of Boosted Regression Tree, GLM and Gam Performance in the Standardization of Yellowfin Tuna Catch-Rate Data from the Gulf of Mexico Lonline Fishery. Master’s Thesis, Louisiana State University, Baton Rouge, LA, USA, 2009. [Google Scholar]
  51. Elith, J.; Leathwick, J.R.; Hastie, T. A working guide to boosted regression trees. J. Anim. Ecol. 2008, 77, 802–813. [Google Scholar] [CrossRef] [PubMed] [Green Version]
  52. Breiman, L. Classification and Regression Trees; Chapman & Hall: London, UK, 1993; ISBN 0412048418. [Google Scholar]
  53. Ridgeway, G. gbm: Generalized Boosted Regression Models. R Package Version. 2006. Available online: https://cran.r-project.org/web/packages/gbm/index.html (accessed on 20 April 2018).
  54. Sutton, C.D. Classification and Regression Trees, Bagging, and Boosting. Handb. Stat. 2004, 24, 303–329. [Google Scholar] [CrossRef]
  55. Steinberg, D.; Colla, P. CART: Tree-Structured Nonparametric Data Analysis; Salford Systems: San Diego, CA, USA, 1995. [Google Scholar]
  56. Aertsen, W.; Kint, V.; De Vos, B.; Deckers, J.; Van Orshoven, J.; Muys, B. Predicting forest site productivity in temperate lowland from forest floor, soil and litterfall characteristics using boosted regression trees. Plant Soil 2012, 354, 157–172. [Google Scholar] [CrossRef]
  57. Thuiller, W.; Lafourcade, B. BIOMOD: Species/Climate Modelling Functions. R Package Version 1.1-3/r118. 2009. Available online: https://rdrr.io/rforge/BIOMOD/man/BIOMOD-package.html (accessed on 25 April 2018).
  58. Carranza, E.J.M. Weights of evidence modeling of mineral potential: A case study using small number of prospects, Abra, Philippines. Nat. Resour. Res. 2004, 13, 173–187. [Google Scholar] [CrossRef]
  59. Hong, H.; Naghibi, S.A.; Moradi Dashtpagerdi, M.; Pourghasemi, H.R.; Chen, W. A comparative assessment between linear and quadratic discriminant analyses (LDA-QDA) with frequency ratio and weights-of-evidence models for forest fire susceptibility mapping in China. Arab. J. Geosci. 2017, 10. [Google Scholar] [CrossRef]
  60. Bonham-Carter, F.G. Geographic Information Systems for Geoscientists-Modeling with GIS-. Comput. Methods Geosci. 1994, 13, 398. [Google Scholar]
  61. Oh, H.J.; Lee, S. Assessment of ground subsidence using GIS and the weights-of-evidence model. Eng. Geol. 2010, 115, 36–48. [Google Scholar] [CrossRef]
  62. Lee, S.; Kim, Y.S.; Oh, H.J. Application of a weights-of-evidence method and GIS to regional groundwater productivity potential mapping. J. Environ. Manag. 2012, 96, 91–105. [Google Scholar] [CrossRef] [PubMed]
  63. Sangchini, E.K.; Emami, S.N.; Tahmasebipour, N.; Pourghasemi, H.R.; Naghibi, S.A.; Arami, S.A.; Pradhan, B. Assessment and comparison of combined bivariate and AHP models with logistic regression for landslide susceptibility mapping in the Chaharmahal-e-Bakhtiari Province, Iran. Arab. J. Geosci. 2016, 9, 201. [Google Scholar] [CrossRef]
  64. Naghibi, S.A.; Moradi Dashtpagerdi, M. Evaluation of four supervised learning methods for groundwater spring potential mapping in Khalkhal region (Iran) using GIS-based features. Hydrogeol. J. 2016. [Google Scholar] [CrossRef]
  65. Naghibi, S.A.; Pourghasemi, H.R.; Abbaspour, K. A comparison between ten advanced and soft computing models for groundwater qanat potential assessment in Iran using R and GIS. Theor. Appl. Climatol. 2018, 131, 967–984. [Google Scholar] [CrossRef]
  66. Chen, W.; Pourghasemi, H.R.; Naghibi, S.A. A comparative study of landslide susceptibility maps produced using support vector machine with different kernel functions and entropy data mining models in China. Bull. Eng. Geol. Environ. 2017, 1–18. [Google Scholar] [CrossRef]
  67. Chen, W.; Pourghasemi, H.R.; Naghibi, S.A. Prioritization of landslide conditioning factors and its spatial modeling in Shangnan County, China using GIS-based data mining algorithms. Bull. Eng. Geol. Environ. 2017, 77, 611–629. [Google Scholar] [CrossRef]
  68. Rahmati, O.; Zeinivand, H.; Geomatics, M.B.; Hazards, N. Flood hazard zoning in Yasooj region, Iran, using GIS and multi-criteria decision analysis. Geomat. Nat. Hazards Risk 2016, 7, 1000–1017. [Google Scholar] [CrossRef]
  69. Golkarian, A.; Naghibi, S.A.; Kalantar, B.; Pradhan, B. Groundwater potential mapping using C5.0, random forest, and multivariate adaptive regression spline models in GIS. Environ. Monit. Assess. 2018, 190. [Google Scholar] [CrossRef] [PubMed]
  70. Sajedi-Hosseini, F.; Malekian, A.; Choubin, B.; Rahmati, O.; Cipullo, S.; Coulon, F.; Pradhan, B. A novel machine learning-based approach for the risk assessment of nitrate groundwater contamination. Sci. Total Environ. 2018, 644, 954–962. [Google Scholar] [CrossRef]
  71. Hong, H.; Liu, J.; Bui, D.T.; Pradhan, B.; Acharya, T.D.; Pham, B.T.; Zhu, A.-X.; Chen, W.; Ahmad, B. Bin Landslide susceptibility mapping using J48 Decision Tree with AdaBoost, Bagging and Rotation Forest ensembles in the Guangchang area (China). Catena 2018, 163, 399–413. [Google Scholar] [CrossRef]
  72. Rahmati, O.; Melesse, A.M. Application of Dempster–Shafer theory, spatial analysis and remote sensing for groundwater potentiality and nitrate pollution analysis in the semi-arid region of Khuzestan, Iran. Sci. Total Environ. 2016, 568, 1110–1123. [Google Scholar] [CrossRef] [PubMed]
  73. Tien Bui, D.; Shahabi, H.; Shirzadi, A.; Chapi, K.; Pradhan, B.; Chen, W.; Khosravi, K.; Panahi, M.; Bin Ahmad, B.; Saro, L. Land Subsidence Susceptibility Mapping in South Korea Using Machine Learning Algorithms. Sensors 2018, 18, E2464. [Google Scholar] [CrossRef] [PubMed]
  74. Kordestani, M.D.; Naghibi, S.A.; Hashemi, H.; Ahmadi, K.; Kalantar, B.; Pradhan, B. Groundwater potential mapping using a novel data-mining ensemble model. Hydrogeol. J. 2018, 1–14. [Google Scholar] [CrossRef]
  75. Berndtsson, R.; Jebari, S.; Hashemi, H.; Wessels, J. Traditional irrigation techniques in MENA with focus on Tunisia. Hydrol. Sci. J. 2016, 61, 1346–1357. [Google Scholar] [CrossRef]
  76. Catry, F.X.; Rego, F.C.; Bação, F.L.; Moreira, F. Modelling and mapping the occurrence of wildfire ignitions in Portugal. Int. J. Wildland Fire 2009, 18, 921–931. [Google Scholar] [CrossRef]
Figure 1. The methodology used to detect the FWS suitable and unsuitable locations, as well as preparing the FWS conditioning factors and modeling procedure, in this research.
Water 10 01405 g001
Figure 2. (a) The location of the study area in Iran, and (b) the DEM of the study region.
Water 10 01405 g002
Figure 3. The schematic presentation of the WFS system (Source: Adapted from Hashemi et al. 2015)
Water 10 01405 g003
Figure 4. (a) The location of the FWS suitable and unsuitable areas, (b) the diversion dam of the Jamab FWS system, and (c) the infiltration pond.
Water 10 01405 g004
Figure 5. The FWS conditioning factors including: (a) slope percent, (b) plan curvature, (c) profile curvature, (d) transmissivity, (e) aquifer thickness, (f) electrical conductivity, (g) rainfall, (h) distance from rivers, (i) river density, (j) soil infiltration, (k) land use, and (l) lithology.
Water 10 01405 g005aWater 10 01405 g005b
Figure 6. The tuning results of the BRT algorithm.
Water 10 01405 g006
Figure 7. The FWS suitability maps produced by the BRT algorithm.
Water 10 01405 g007
Figure 8. The pruned classification tree by the CART, riverdist: distance from rivers, trans: transmissivity, thickness: aquifer thickness, and rain: rainfall.
Water 10 01405 g008
Figure 9. The FWS suitability maps produced by the CART algorithms.
Water 10 01405 g009
Figure 10. The FWS suitability maps produced by the WoE algorithm.
Water 10 01405 g010
Figure 11. The validation results of the FWS suitability maps obtained from the BRT, CART, and WoE algorithms.
Water 10 01405 g011
Table 1. The lithological units in the study area.
Class IDDescription of the Lithological Classes
1Andesitic lava, tuff and tuff breccia
2Andesitic lava
3Claystone, sandstone, Red
4Conglomerate
5Conglomerate, poorly cemented
6Dolomite, limestone, light buff grey
7Floodplain mudflat
8Granite (Porphyry) granodiorite
9Granite-aplite
10Gravel fan
11Interbedded radiolarite slate and ultrabasic rocks
12Leucogranite
13Limestone
14Limestone buff sandy
15Limestone light brown grey, oolitic
16Limestone light buff bedded
17Limestone light buff massive
18Limestone marl light grey
19Limestone micritic and marl
20Limestone recrystallized dolomitic
21Limestone, light buff, grey, and dolomite
22Marl Clay
23Marl, blue-grey. shale dark grey
24Marl, red-brown. gypsiferous
25Neogene Red Beds
26Quartz conglomerate
27Recent alluvium
28Sandstone
29Sandstone, shale, conglomerate
30Sandstone, slate crystalized limestone
31Shale, Phyllitic, dark grey
32Shale, red-brown. Gypsum. Sandstone
33Shale. dark grey to black
34Shale. Dark grey, silty, sandstone
35Terraces
Table 2. The importance of the FWS conditioning factors in the BRT algorithm.
FactorsImportance
Transmissivity100.0
Distance from rivers89.9
Aquifer thickness56.4
EC14.6
Slope percent11.3
River density9.6
Profile curvature3.9
Rainfall3.8
Land use3.5
Plan curvature2.8
Lithology2.2
Soil infiltration0
Table 3. The spatial relationship between the conditioning factors and floodwater spreading suitable locations by WoE model.
FactorClass% of Domain% of FWSFinal Weight
Slope (%)0–212.736.38.27
2–522.146.97.17
5–812.816.91.55
>852.400
Plan curvatureConcave45.243.1−0.53
Flat8.15.6−1.15
Convex46.651.31.17
Profile curvature<(−0.001)20.93.8−4.6
(−0.001)–(0.001)60.392.56.98
>(0.001)18.83.8−4.28
Transmissivity0–30035.800
300–6002.300
600–90011.500
>90050.41006.76
Aquifer thickness (m)0–1042.600
10–4030.310−5.18
40–8023.98012.88
>803.2104.64
Electrical conductivity (EC)0–100031.69.4−5.51
1000–300053.485.67.31
3000–600014.55−3.22
>60000.500
Rainfall (mm)200–27526.715−3.26
275–35055.3856.87
350–42514.300
425–5003.700
Distance from rivers (m)0−10004070.67.6
1000–200024.822.5−0.55
2000–300014.83.1−3.66
3000–400091.9−2.79
4000–12,28011.31.9−3.22
River density (km/km2)0–0.1763.230−8.04
0.17–0.4710.814.41.43
0.47–0.802255.69.38
0.80–1.82400
Soil infiltration (mm h−1)0–12.716.300
12.7–38.142.70.6−4.76
38.1–76.231.144.43.57
>76.29.95511.54
Land useAgriculture24.234.42.98
Orchard9.5100.2
Rangeland6455−2.36
Residential area2.30.6−1.3
LithologyGravel fan33.9708.79
Recent alluvium22515.4
Terraces5.65−0.35
Other classes58.500

