Long-Term River Water Quality Trends and Pollution Source Apportionment in Taiwan


Abstract
1. Introduction
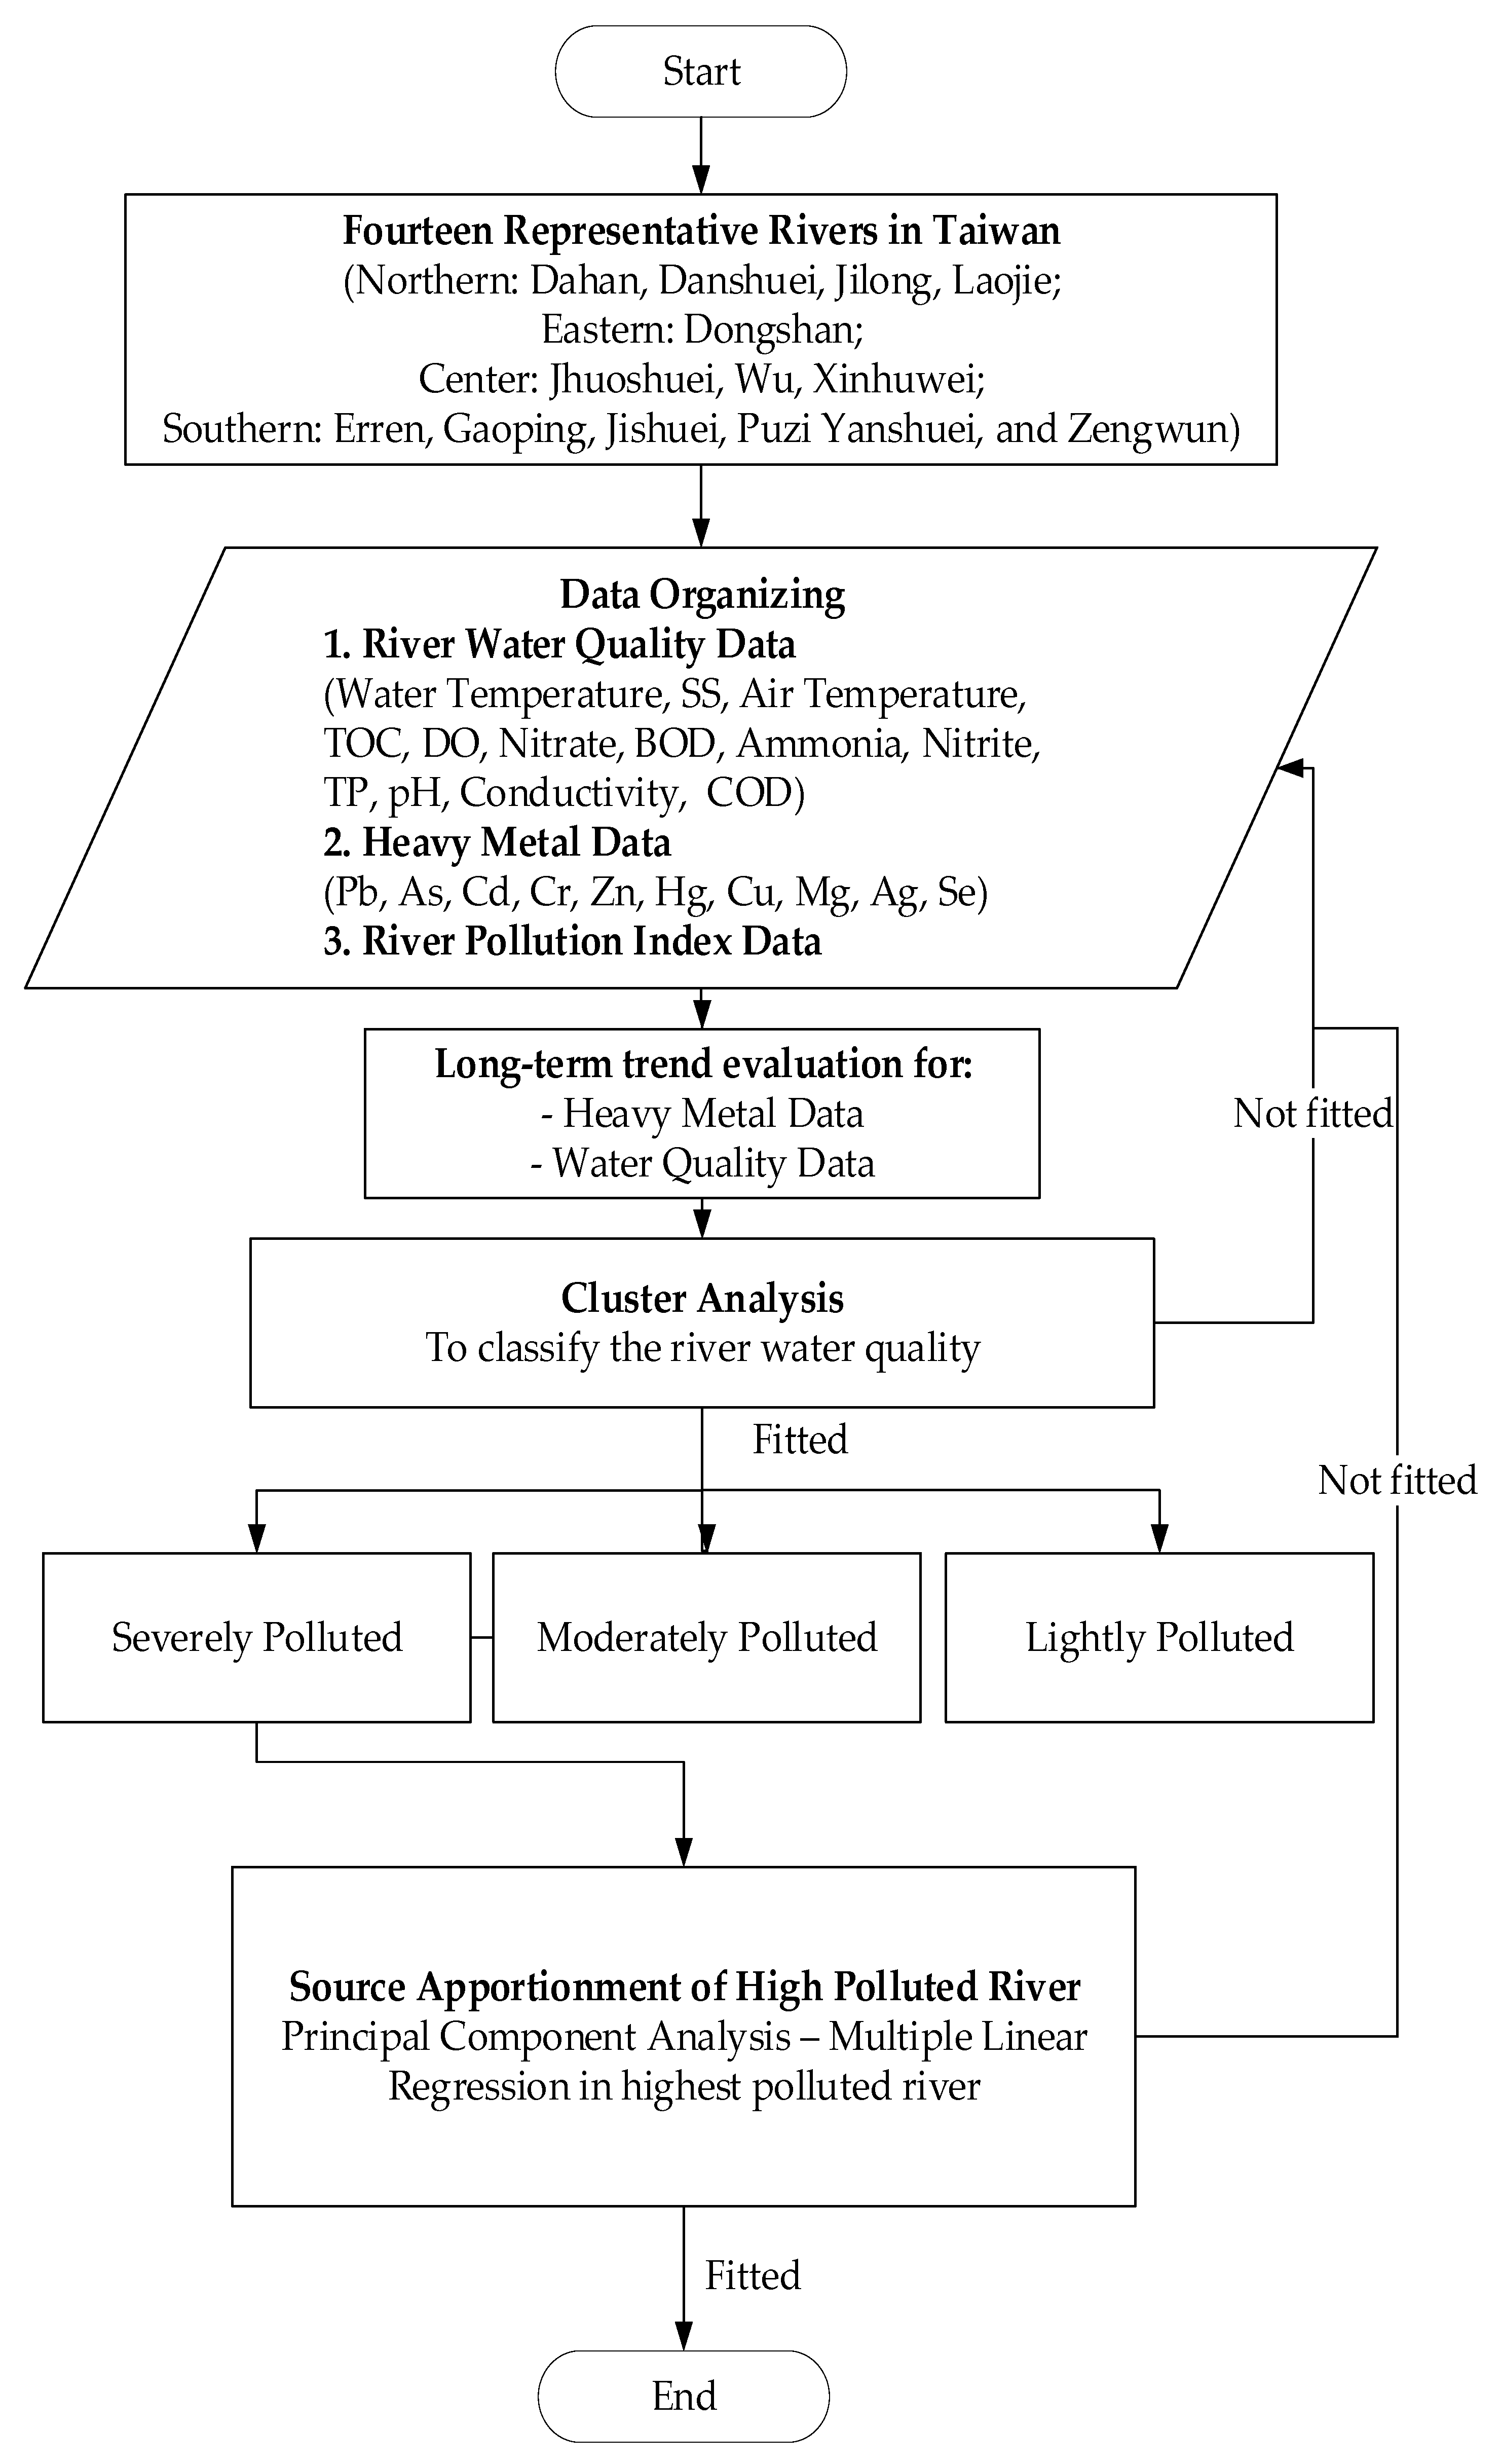
2. Materials and Methods
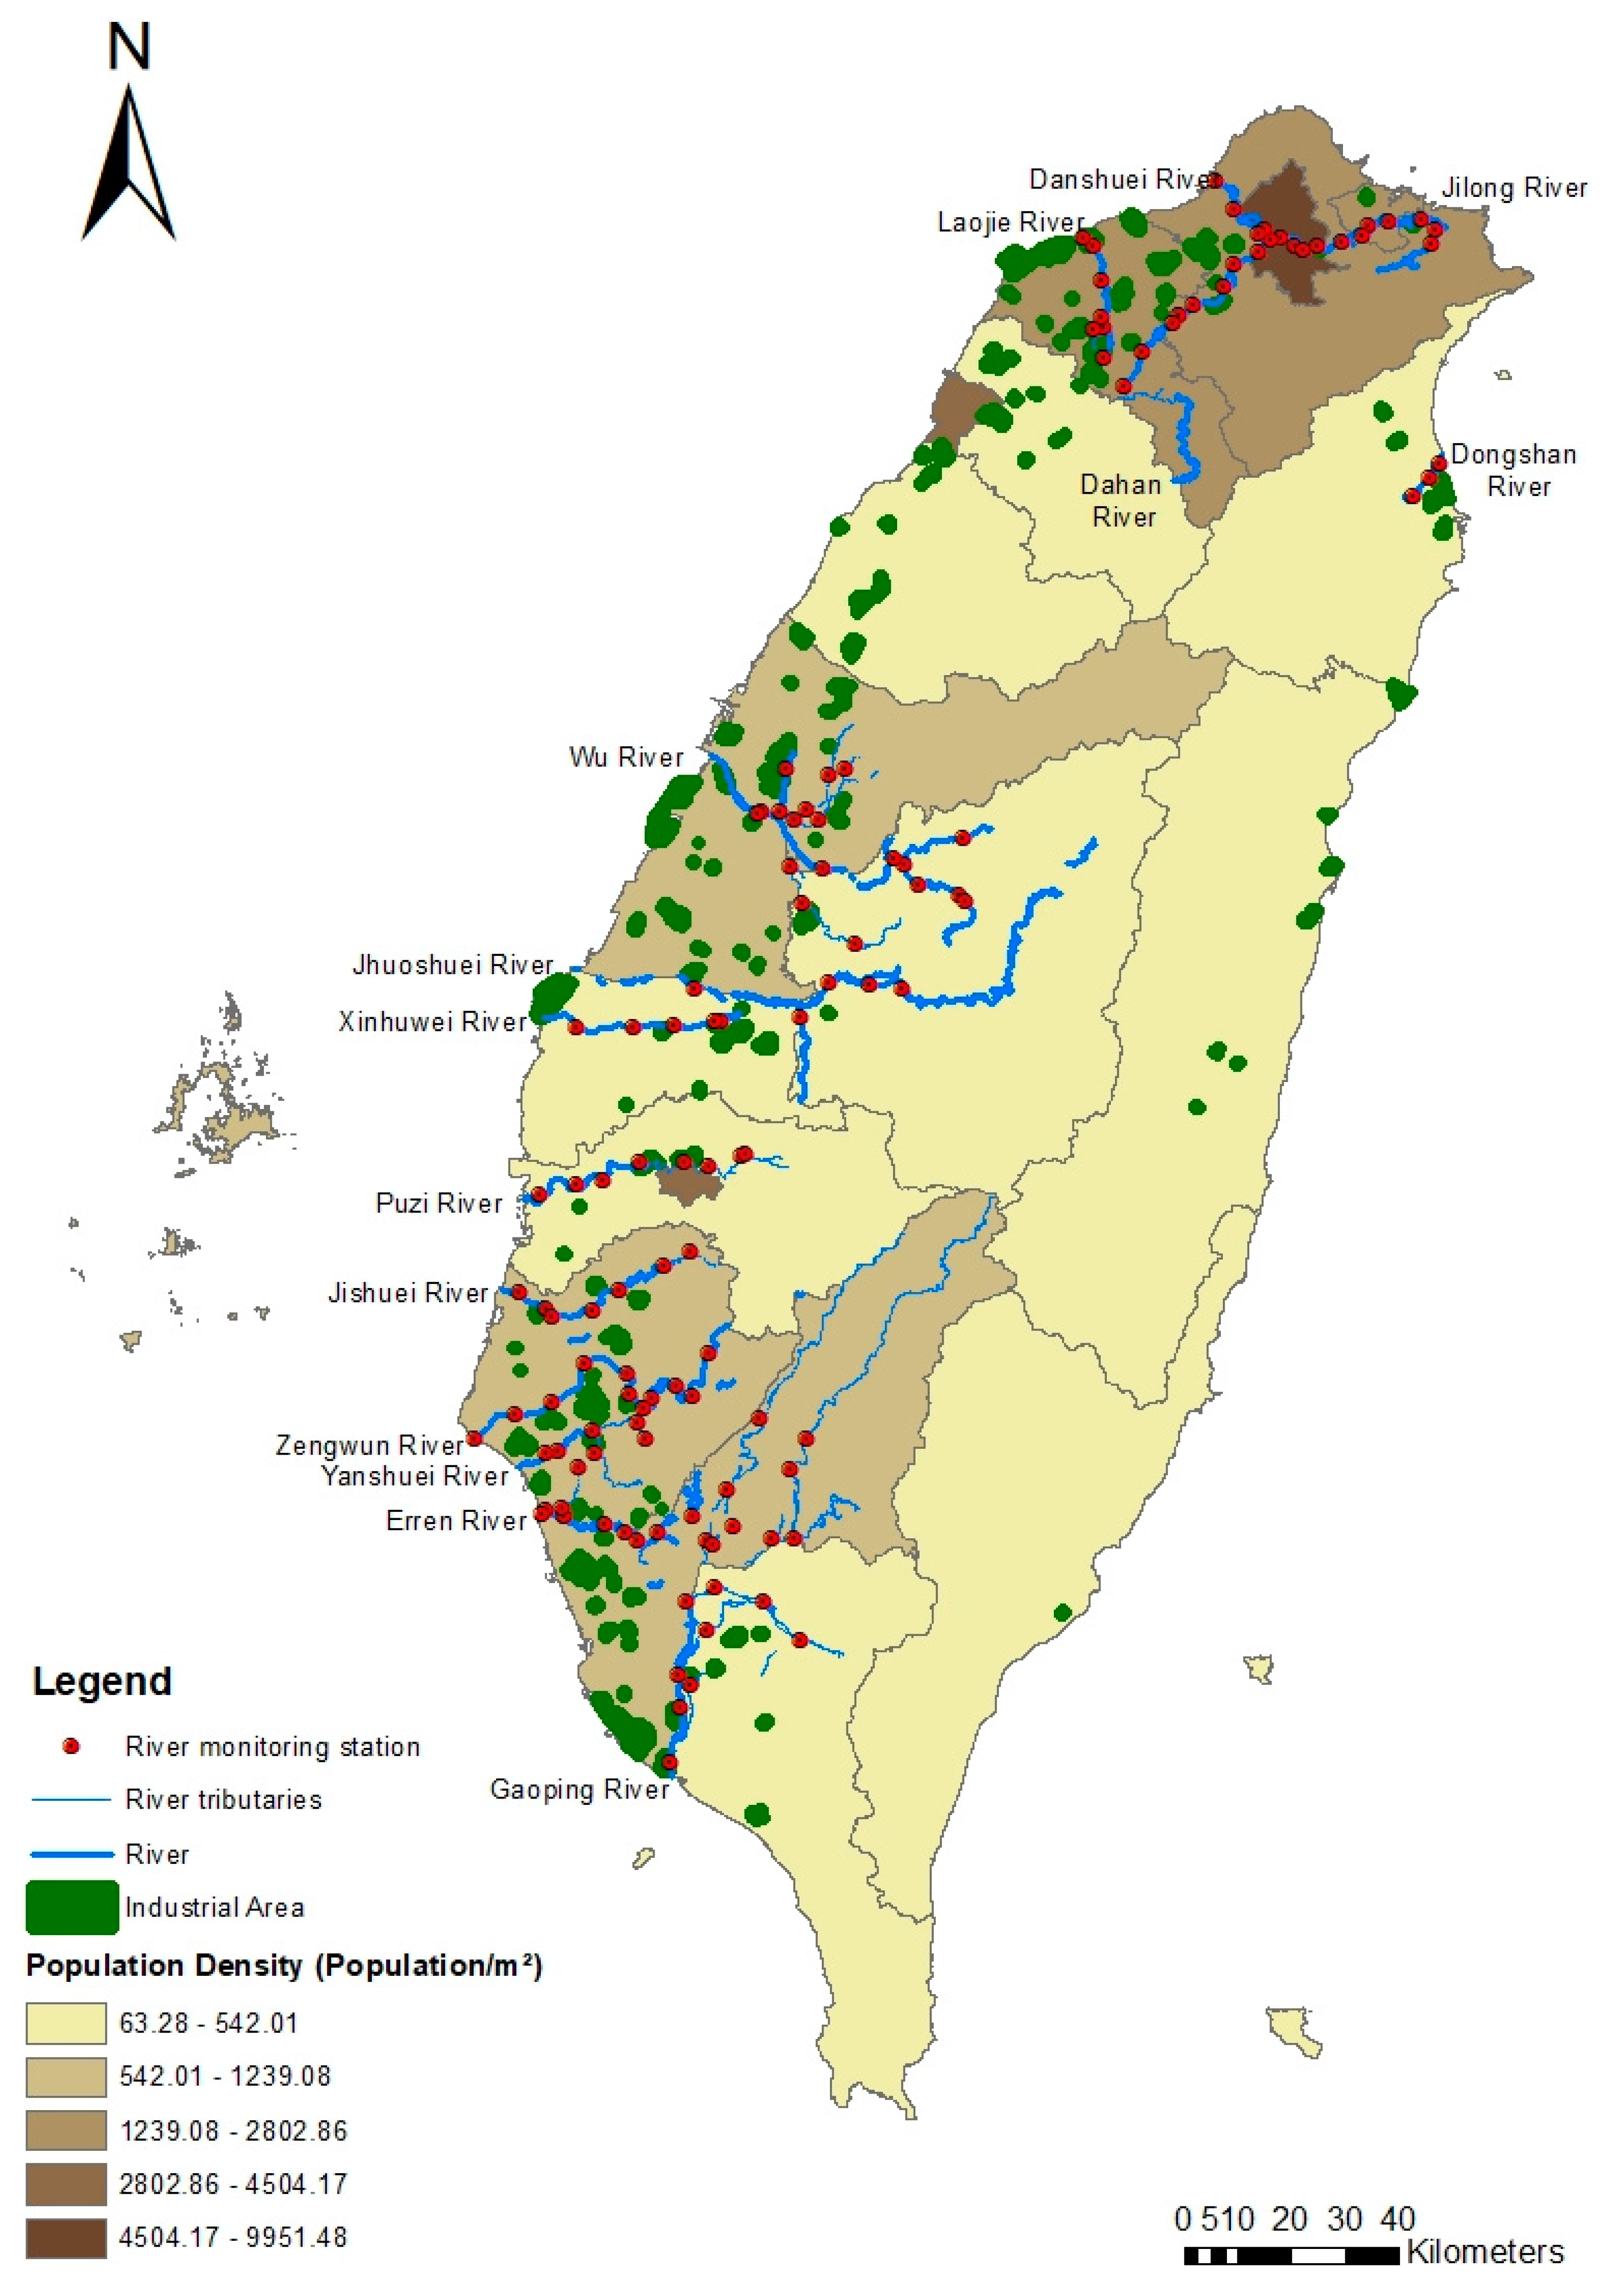
2.1. Study Area and Data Collection
2.2. Statistical Methods
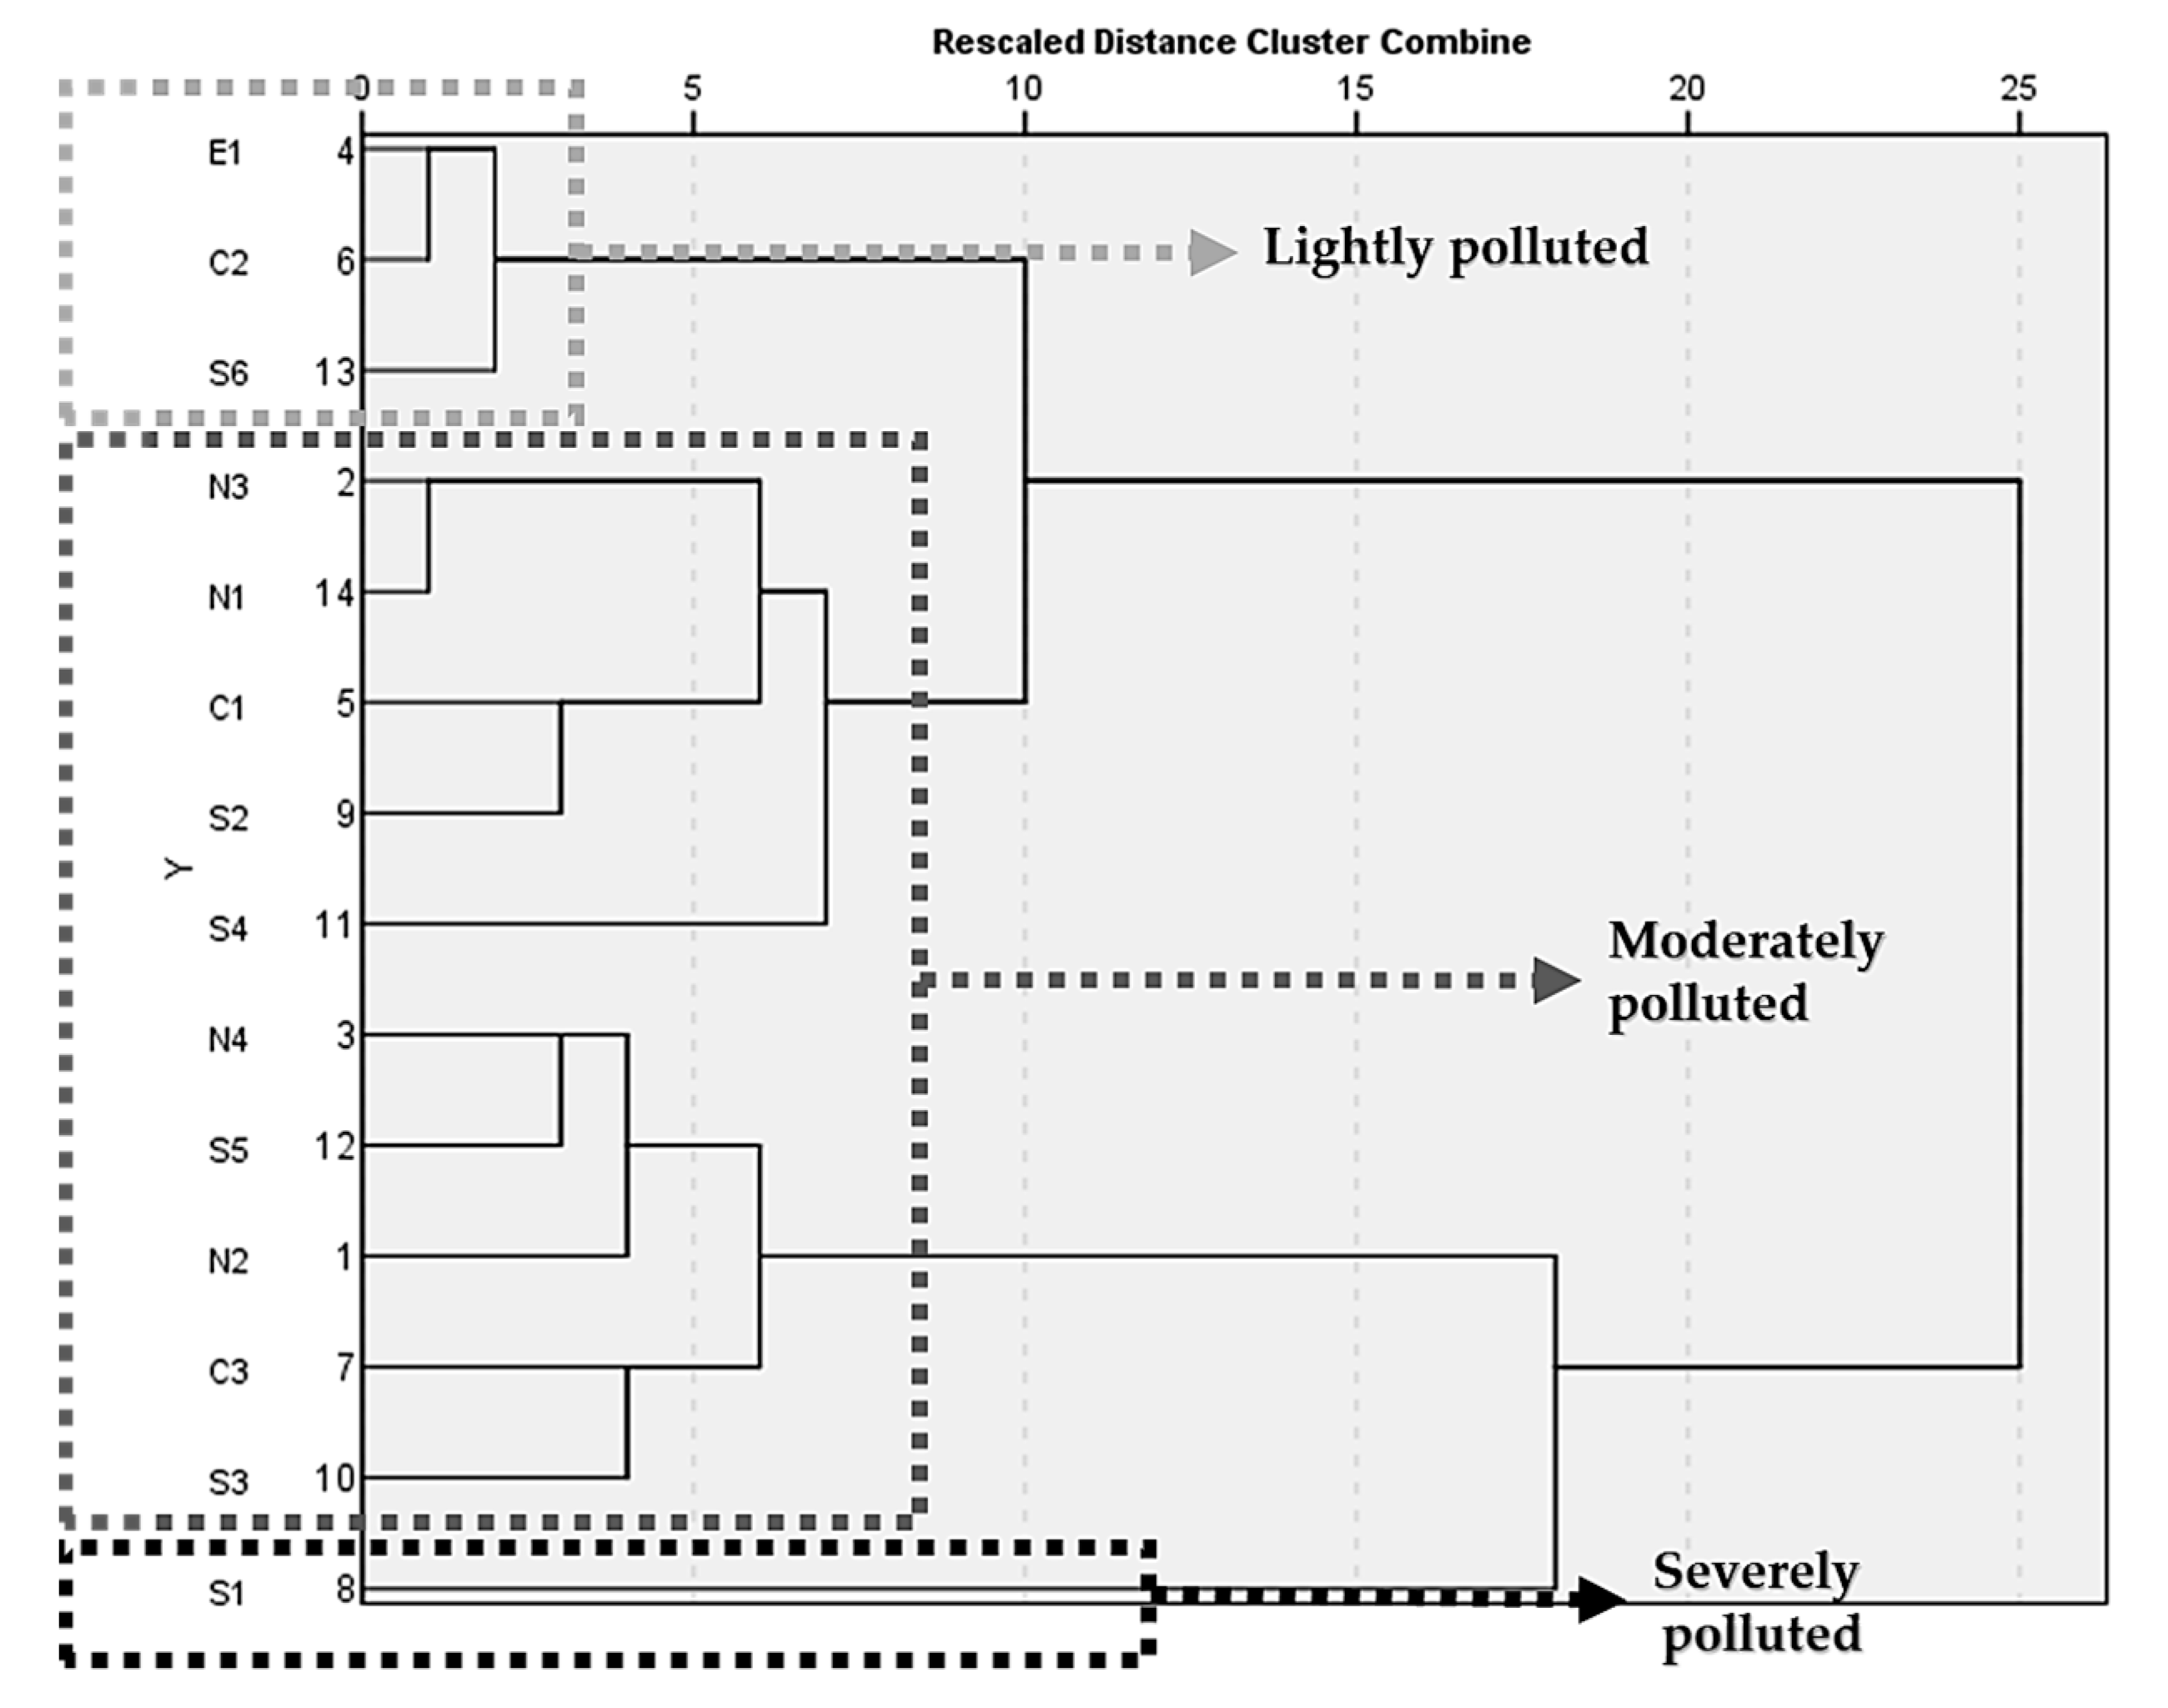
2.2.1. Cluster Analysis
2.2.2. Source Apportionment Analysis
3. Results
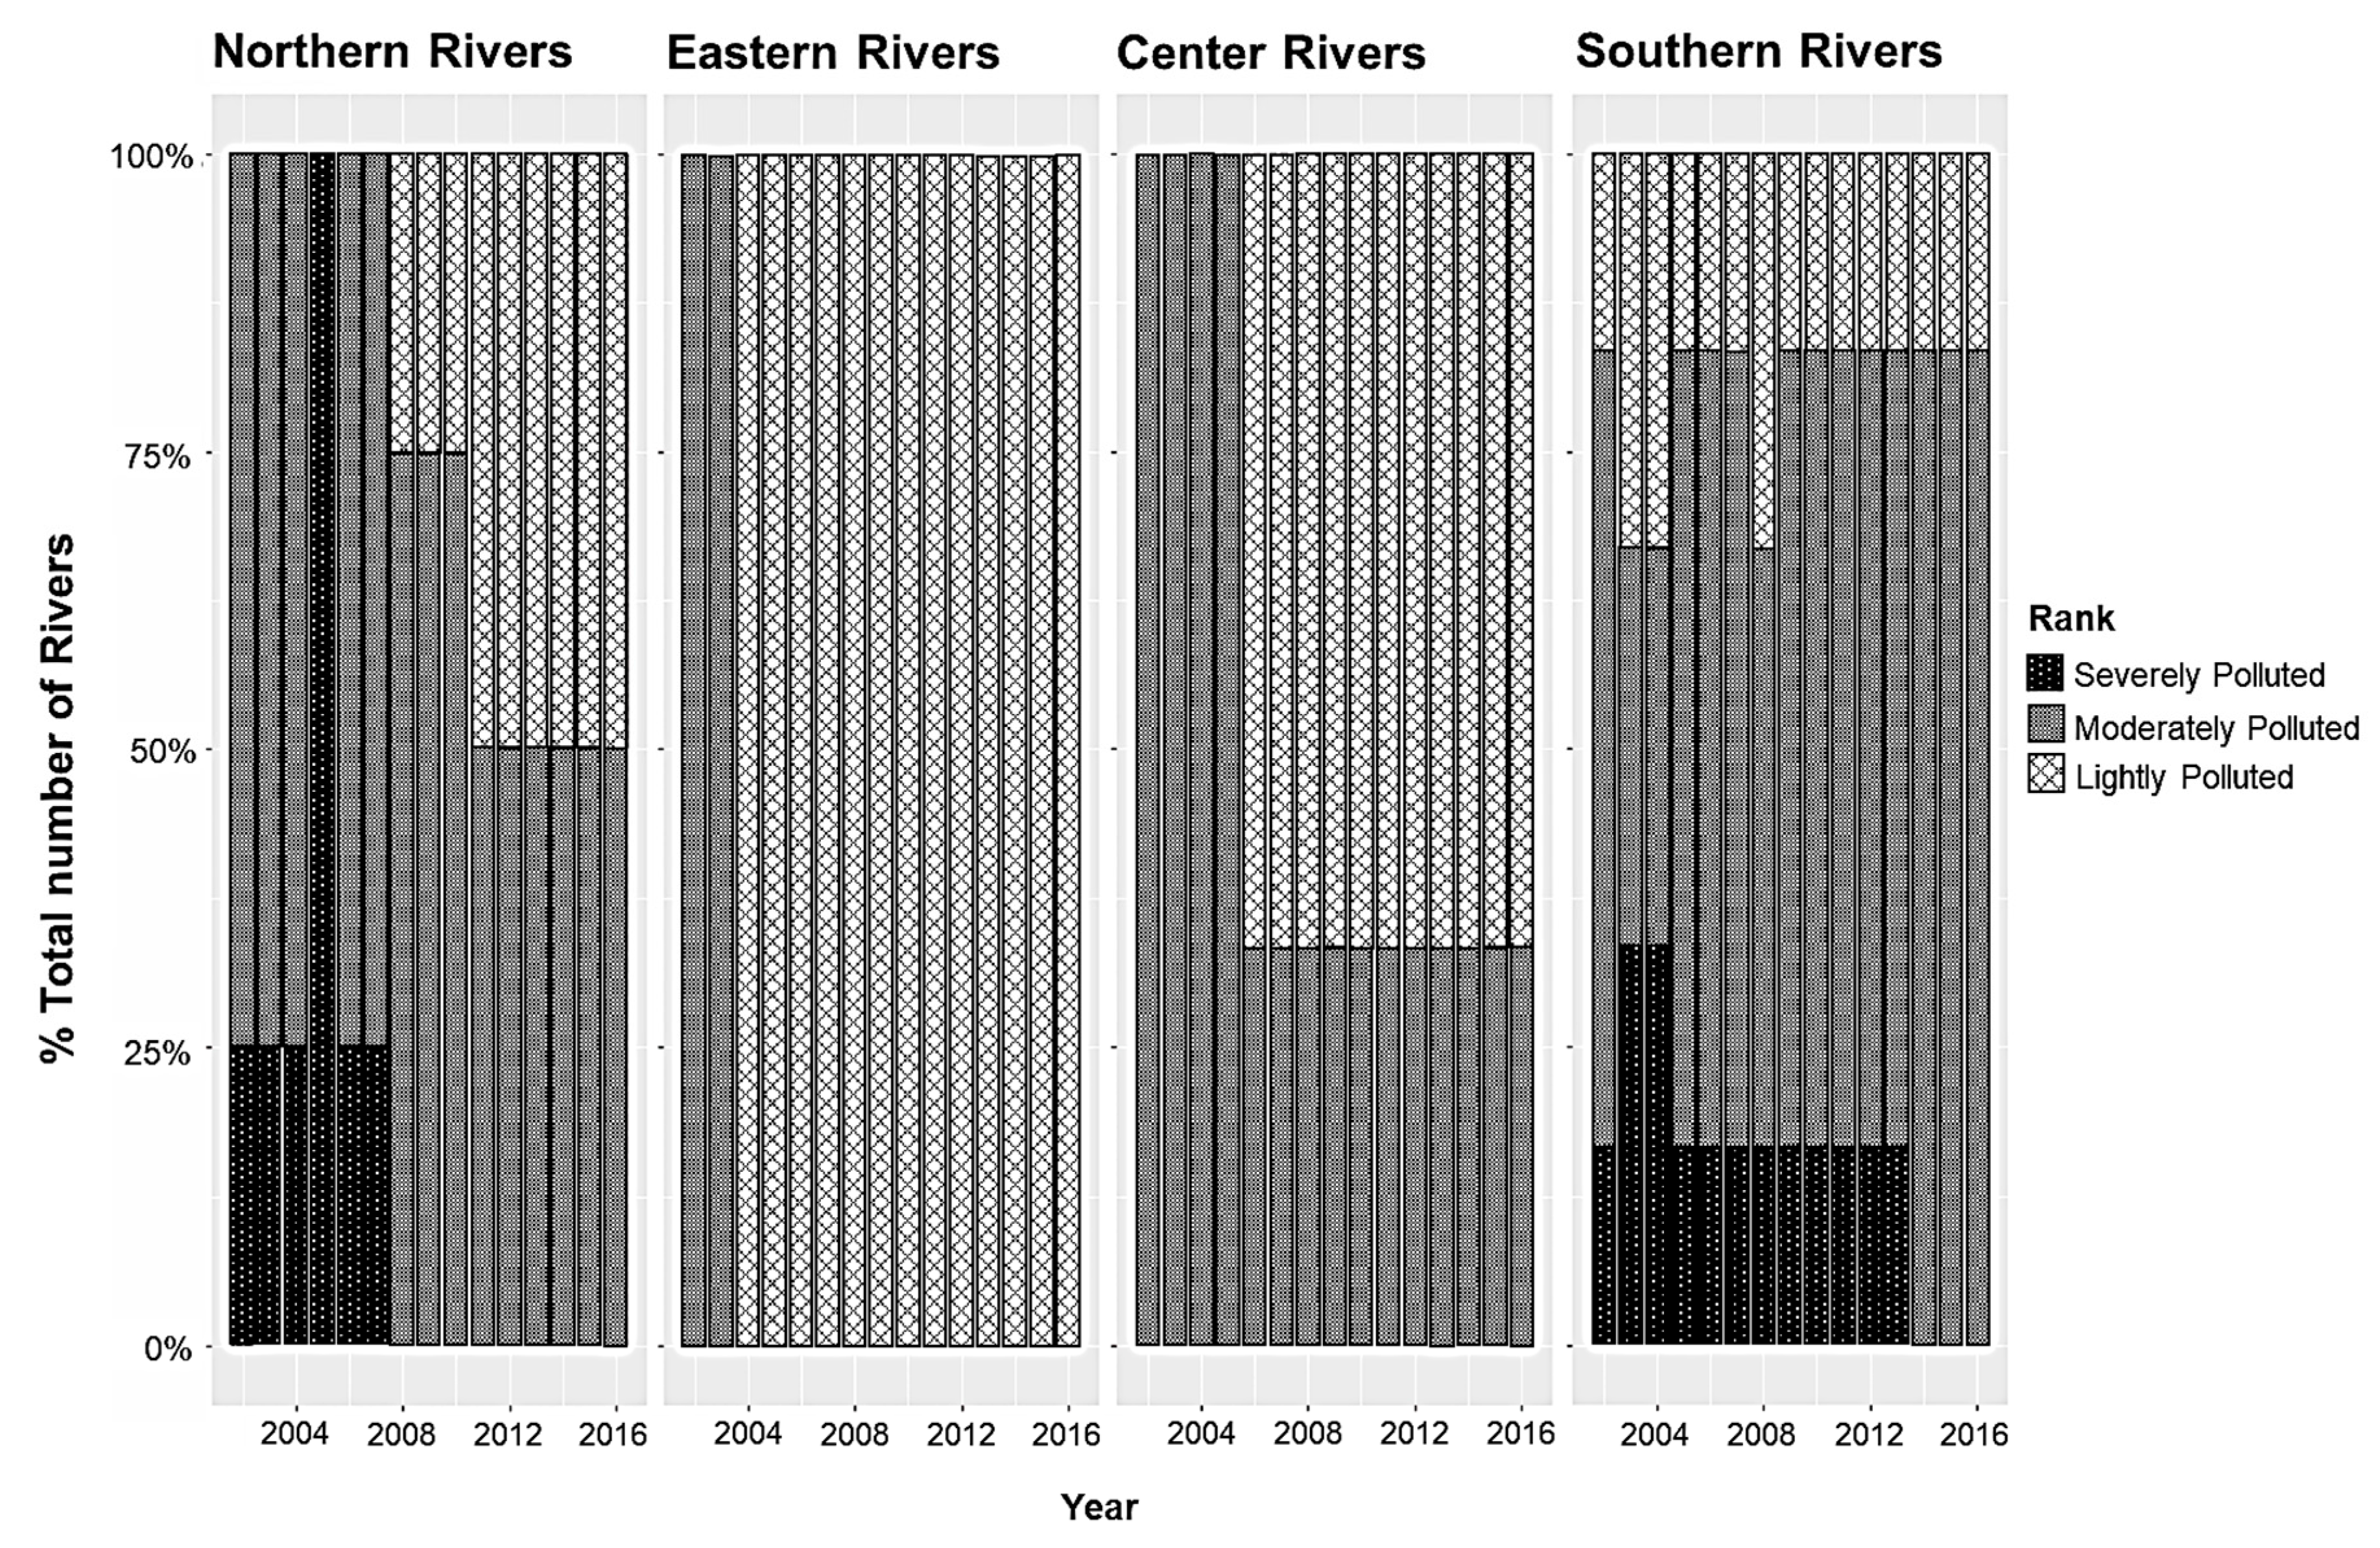
3.1. Evaluation of River Water Quality and Heavy Metal Data
3.2. Cluster Analysis
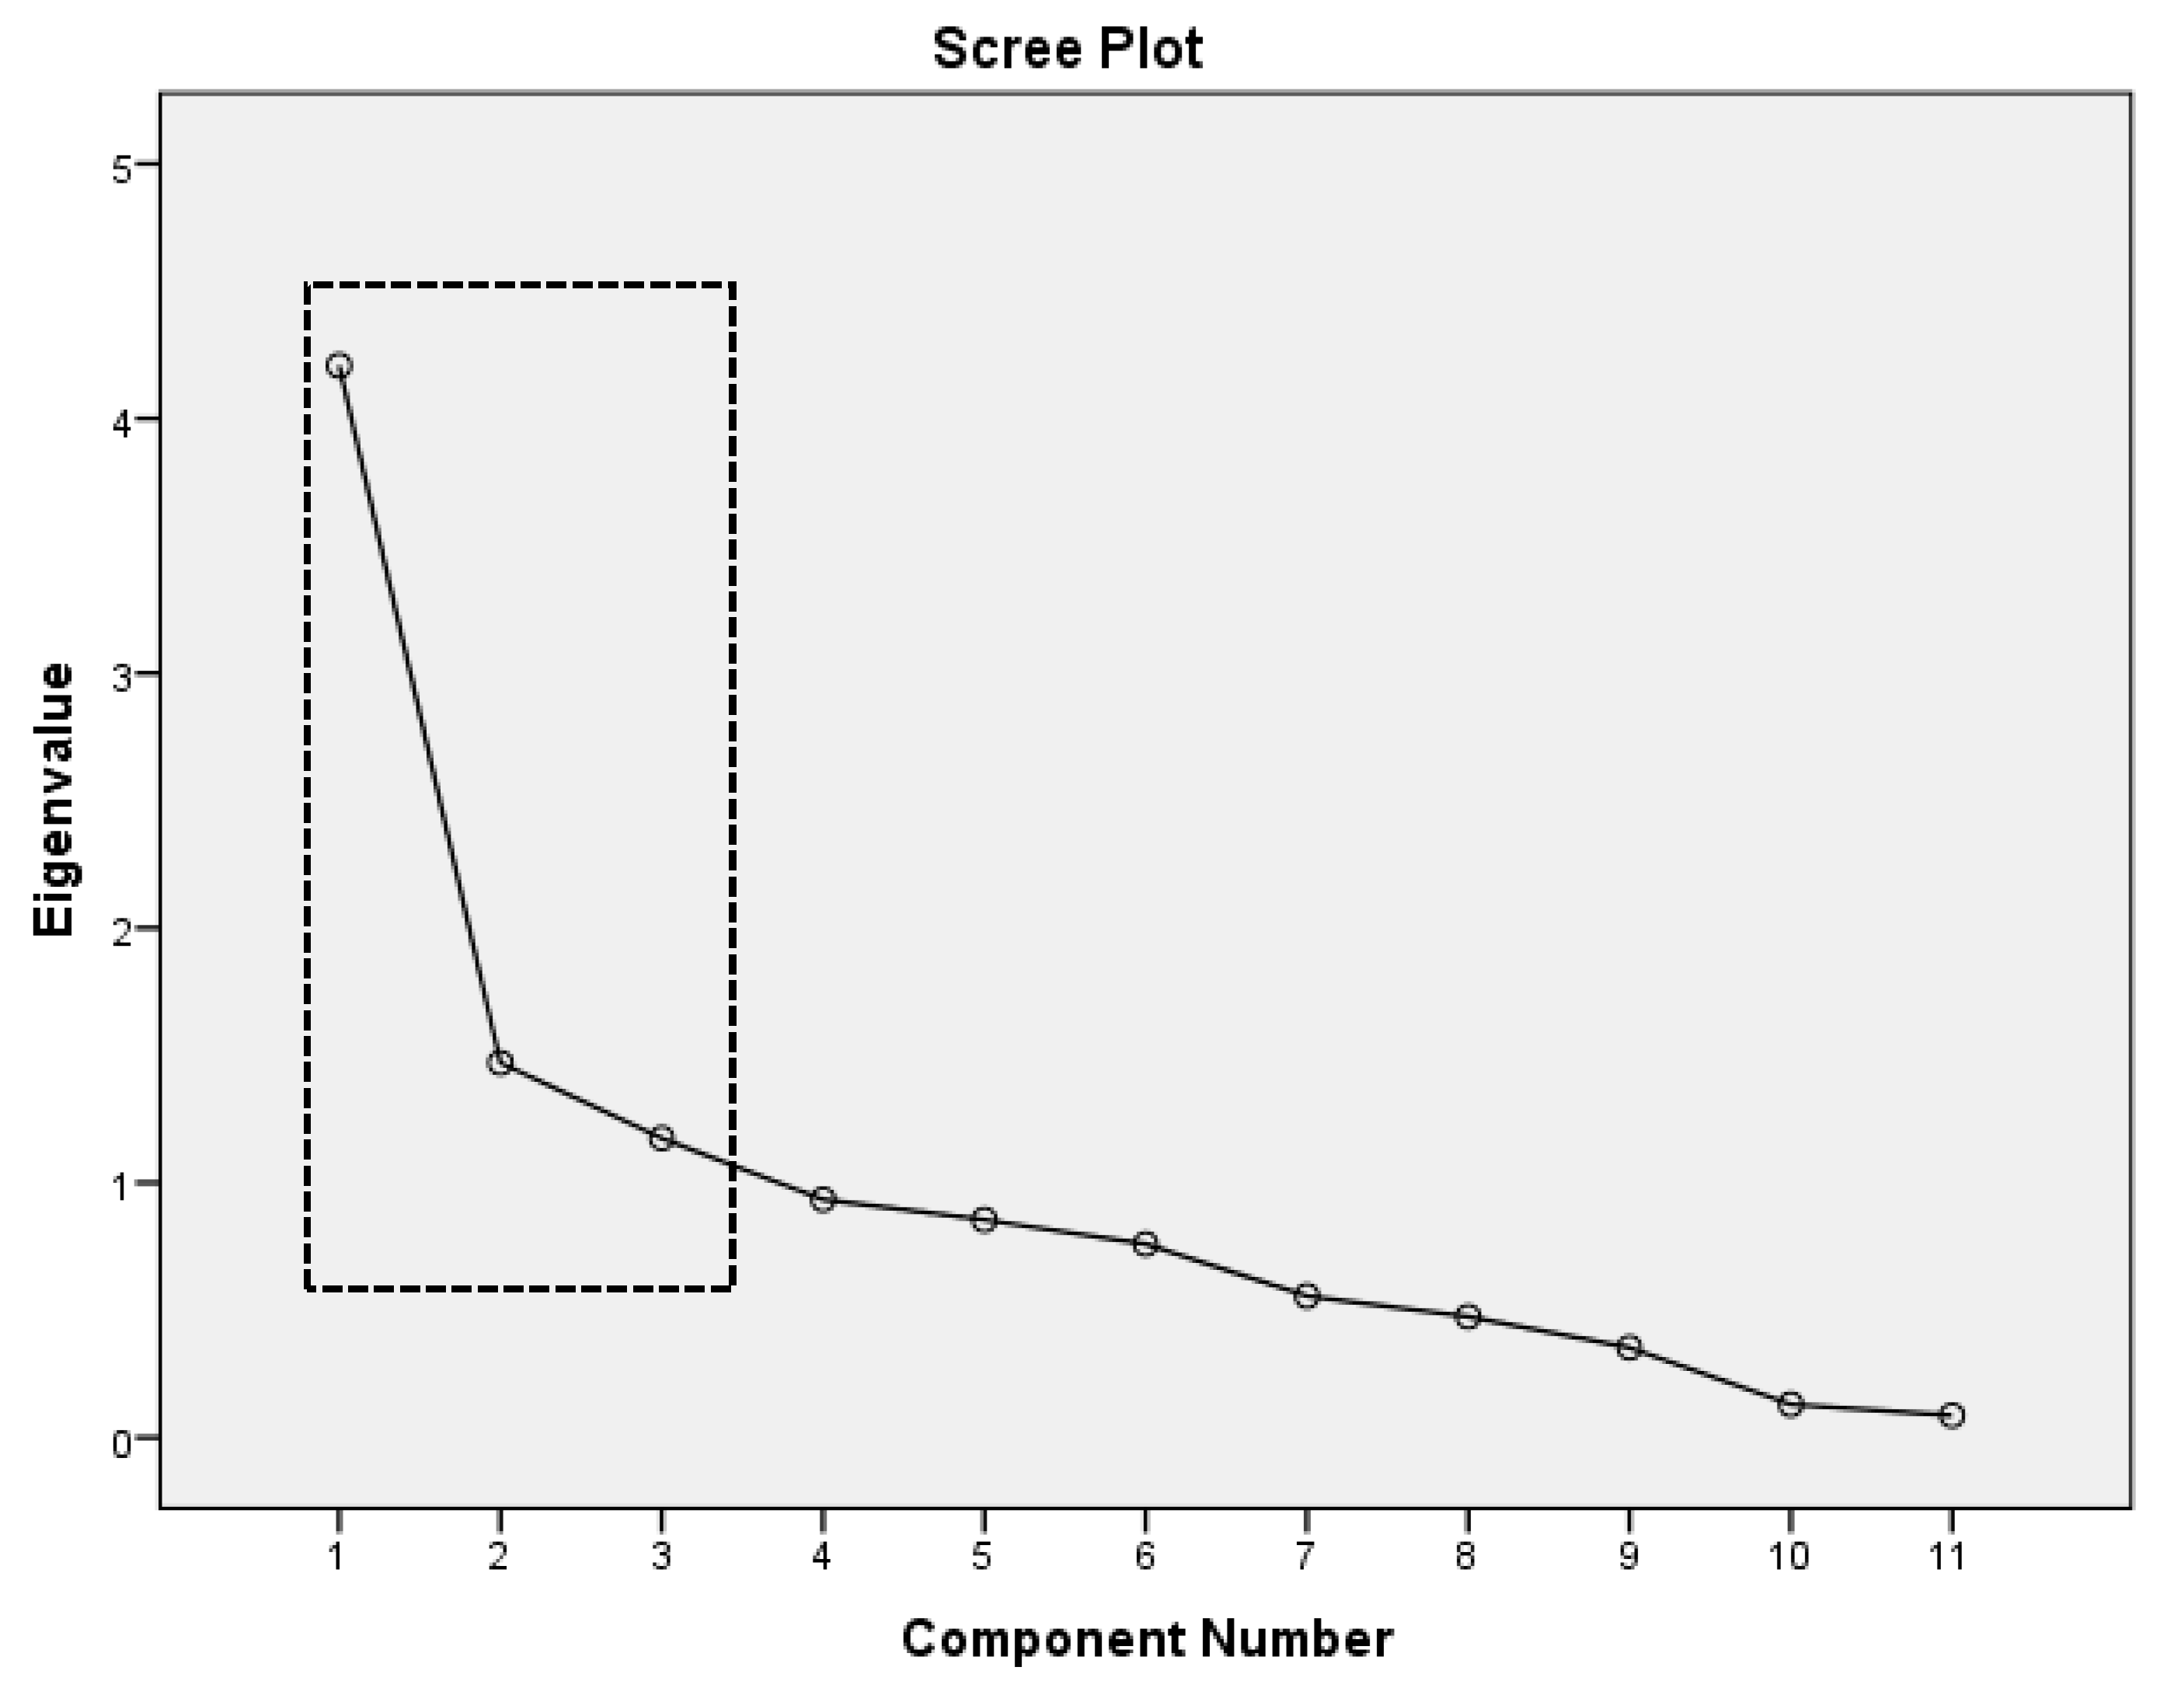
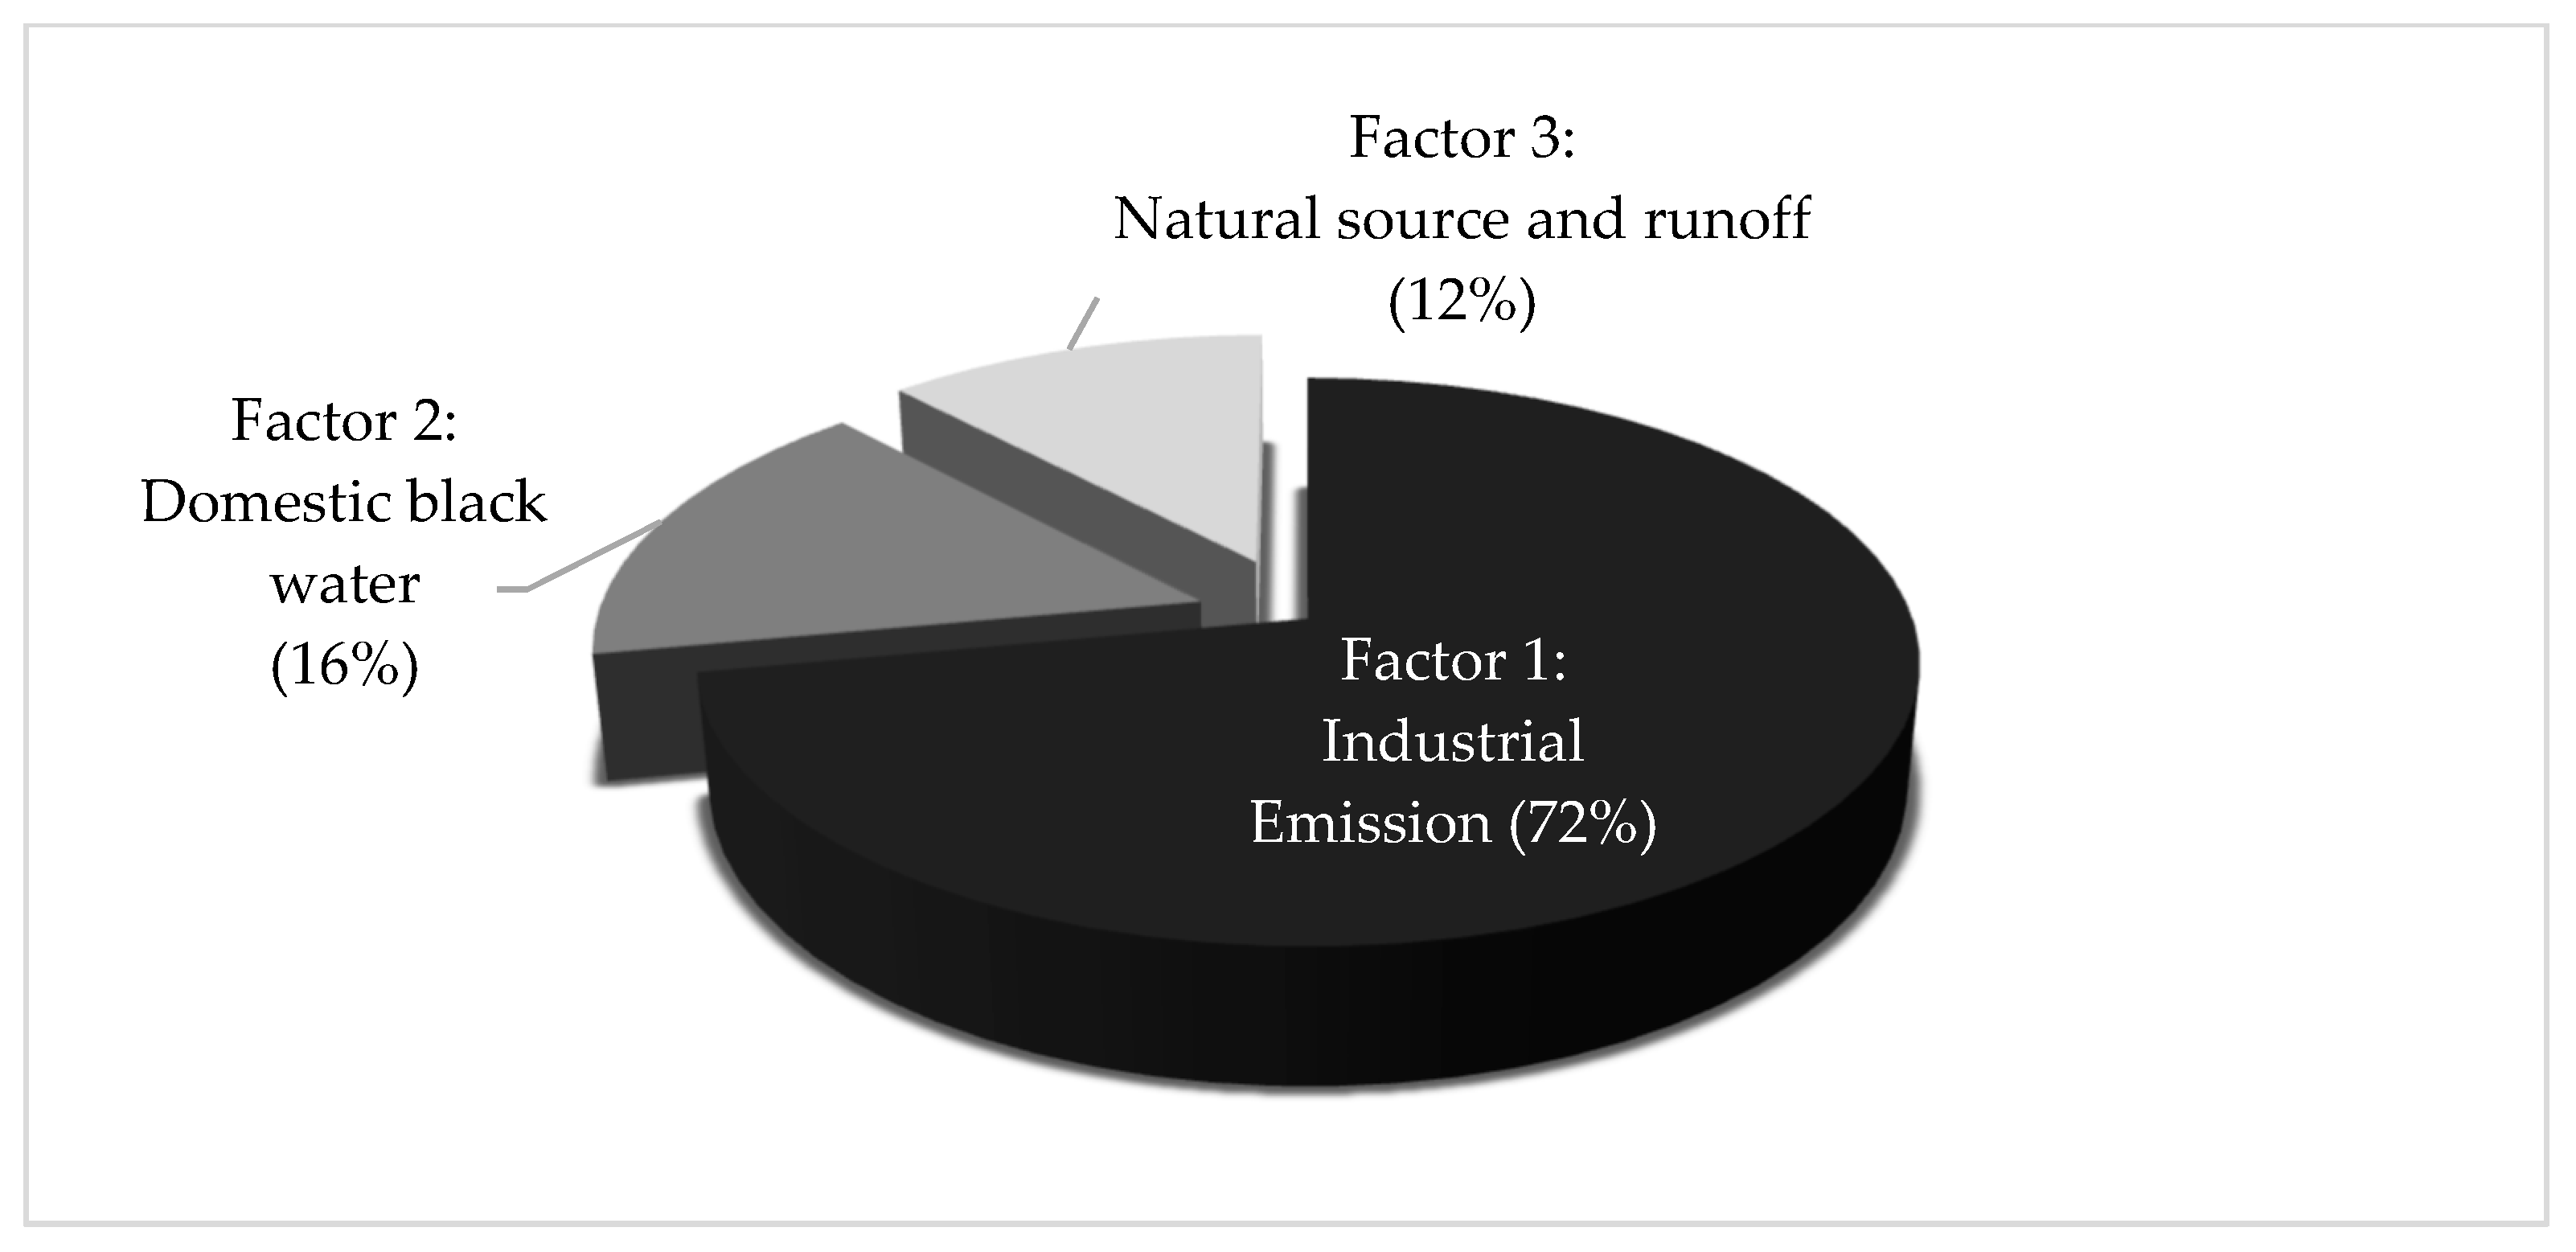
3.3. Source Identification and Apportionment
4. Discussion
5. Conclusions
Supplementary Materials
Author Contributions
Funding
Acknowledgments
Conflicts of Interest
References
- Wang, X.; Zhang, L.; Cai, Y. Heavy metal pollution in reservoirs in the hilly area of southern China: Distribution, source apportionment and health risk assessment. Sci. Total Environ. 2018, 634, 158–169. [Google Scholar] [CrossRef] [PubMed]
- Huang, F.; Wang, X.; Lou, L.; Zhou, Z.; Wu, J. Spatial variation and source apportionment of water pollution in Qiantang River (China) using statistical techniques. Water Res. 2010, 44, 1562–1572. [Google Scholar] [CrossRef] [PubMed]
- Elhatip, H.; Hınıs, M.A.; Gülbahar, N. Evaluation of the water quality at Tahtali dam watershed in Izmir-Turkey by means of statistical methodology. Stochastic Environ. Res. Risk Assess. 2007, 22, 391–400. [Google Scholar] [CrossRef]
- Kolovos, A.; Christakos, G.; Serre, M.L.; Miller, C.T. Computational bayesian maximum entropy solution of a stochastic advection-reaction equation in the light of site-specific information. Water Resour. Res. 2002, 38, 1–17. [Google Scholar] [CrossRef]
- World Bank. Riding the Wave: An East Asian Miracle for the 21st Century; The World Bank: Washington, DC, USA, 2017. [Google Scholar]
- Tsai, D.H.A. The effects of dynamic industrial transition on sustainable development. Struct. Chang. Econ. Dyn. 2018, 44, 46–54. [Google Scholar] [CrossRef]
- Administration, T.E.P. Taiwan River Annual Report; Taiwan Environmental Protection Administration: Taipei, Taiwan, 1998. [Google Scholar]
- Chen, Y.-C.; Yeh, H.-C.; Wei, C. Estimation of River Pollution Index in a Tidal Stream Using Kriging Analysis. Int. J. Environ. Res. Public Health 2012, 9, 3085–3100. [Google Scholar] [CrossRef] [PubMed]
- Liou, S.-M.; Lo, S.-L.; Hu, C.-Y. Application of two-stage fuzzy set theory to river quality evaluation in Taiwan. Water Res. 2003, 37, 1406–1416. [Google Scholar] [CrossRef]
- Hsieh, P.-Y.; Shiu, H.-Y.; Chiueh, P.-T. Reconstructing nutrient criteria for source water areas using reference conditions. Sustain. Environ. Res. 2016, 26, 243–248. [Google Scholar] [CrossRef]
- Lai, Y.C.; Tu, Y.T.; Yang, C.P.; Surampalli, R.Y.; Kao, C.M. Development of a water quality modeling system for river pollution index and suspended solid loading evaluation. J. Hydrol. 2013, 478, 89–101. [Google Scholar] [CrossRef]
- Chiu, Y.-W.; Yeh, F.-L.; Shieh, B.-S.; Chen, C.-M.; Lai, H.-T.; Wang, S.-Y.; Huang, D.-J. Development and assays estradiol equivalent concentration from prawn (p-EEQ) in river prawn, Macrobrachium nipponense, in Taiwan. Ecotoxicol. Environ. Saf. 2017, 137, 12–17. [Google Scholar] [CrossRef] [PubMed]
- Elsayed, E.A. Using QUAL2K Model and river pollution index for water quality management in Mahmoudia Canal, Egypt. J. Nat. Resour. Dev. 2014. [Google Scholar] [CrossRef]
- Aneja, V.P.; Blunden, J.; James, K.; Schlesinger, W.H.; Knighton, R.; Gilliam, W. Ammonia assessment from agriculture: U.S. status and needs. J. Environ. Qual. 2008, 37, 515. [Google Scholar] [CrossRef] [PubMed]
- Morales, M.M.; Martı́, P.; Llopis, A.; Campos, L.; Sagrado, S. An environmental study by factor analysis of surface seawaters in the Gulf of Valencia (Western Mediterranean). Anal. Chim. Acta 1999, 394, 109–117. [Google Scholar] [CrossRef]
- Liou, S.-M.; Lo, S.-L.; Wang, S.-H. A generalized water quality index for Taiwan. Environ. Monit. Assess. 2004, 96, 35–52. [Google Scholar] [CrossRef] [PubMed]
- Li, B.; Yang, G.; Wan, R.; Hormann, G.; Huang, J.; Foher, N.; Zhang, L. Combining multivariate statistical techniques and random forests model to assess and diagnose the trophic status of Poyang Lake in China. Ecol. Indic. 2017, 83, 74–83. [Google Scholar] [CrossRef]
- Shrestha, S.; Kazama, F. Assessment of surface water quality using multivariate statistical techniques: A case study of the Fuji river basin, Japan. Environ. Model. Softw. 2007, 22, 464–475. [Google Scholar] [CrossRef]
- Singh, K.P.; Malik, A.; Sinha, S. Water quality assessment and apportionment of pollution sources of Gomti river (India) using multivariate statistical techniques—A case study. Anal. Chim. Acta 2005, 538, 355–374. [Google Scholar] [CrossRef]
- Singh, K.P.; Malik, A.; Mohan, D.; Sinha, S. Multivariate statistical techniques for the evaluation of spatial and temporal variations in water quality of Gomti River (India)—A case study. Water Res. 2004, 38, 3980–3992. [Google Scholar] [CrossRef] [PubMed]
- Chen, H.; Teng, Y.; Yue, W.; Song, L. Characterization and source apportionment of water pollution in Jinjiang River, China. Environ. Monit. Assess. 2013, 185, 9639–9650. [Google Scholar] [CrossRef] [PubMed]
- Taylor, R. Interpretation of the correlation coefficient: A basic review. J. Diagn. Med. Sonogr. 1990, 6, 35–39. [Google Scholar] [CrossRef]
- Pett, M.A.; Lackey, N.R.; Sullivan, J.J. Making Sense of Factor Analysis: The Use of Factor Analysis for Instrument Development in Health Care Research; SAGE Publications: Dartford, UK, 2003. [Google Scholar]
- Yang, L.; Mei, K.; Liu, X.; Wu, L.; Zhang, M.; Xu, J.; Wang, F. Spatial distribution and source apportionment of water pollution in different administrative zones of Wen-Rui-Tang (WRT) river watershed, China. Environ. Sci. Pollut. Res. Int. 2013, 20, 5341–5352. [Google Scholar] [CrossRef] [PubMed]
- Kim, G.-H.; Jung, K.-Y.; Yoon, J.-S.; Cheon, S.-U. Temporal and spatial analysis of water quality data observed in lower watershed of nam river dam. J. Korean Soc. Hazard Mitig. 2013, 13, 429–437. [Google Scholar] [CrossRef]
- Carpenter, S.R.; Caraco, N.F.; Correll, D.L.; Howarth, R.W.; Sharpley, A.N.; Smith, V.H. Nonpoint pollution of surface waters with phosphorus and nitrogen. Ecol. Appl. 1998, 8, 559. [Google Scholar] [CrossRef]
- Vega, M.; Pardo, R.; Barrado, E.; Debán, L. Assessment of seasonal and polluting effects on the quality of river water by exploratory data analysis. Water Res. 1998, 32, 3581–3592. [Google Scholar] [CrossRef]
- Islam, M.A.; Islam, S.L.; Hassan, A. Impact of Climate Change on Water with Reference to the Ganges–Brahmaputra–Meghna River Basin, in Chemistry and Water; Elsevier: Amsterdam, The Netherlands, 2017. [Google Scholar]
- Chinn, D.L. Rural poverty and the structure of farm household income in developing countries: Evidence from Taiwan. Econ. Dev. Cult. Chang. 1979, 27, 283–301. [Google Scholar] [CrossRef]
- Hajigholizadeh, M.; Melesse, A.M. Assortment and spatiotemporal analysis of surface water quality using cluster and discriminant analyses. Catena 2017, 151, 247–258. [Google Scholar] [CrossRef]
- Lee, C.-C.; Jiang, L.-Y.; Kuo, Y.-L.; Hsieh, C.-Y.; Chen, C.S.; Tien, C.-J. The potential role of water quality parameters on occurrence of nonylphenol and bisphenol A and identification of their discharge sources in the river ecosystems. Chemosphere 2013, 91, 904–911. [Google Scholar] [CrossRef] [PubMed]
- Yang, C.P.; Yu, Y.T.; Kao, C.M. Impact of climate change on kaoping river water quality. Appl. Mech. Mater. 2012, 212, 137–140. [Google Scholar] [CrossRef]
- Wu, C.; Wu, J.; Qi, J.; Zhang, L.; Huang, H.; Lou, L.; Chen, Y. Empirical estimation of total phosphorus concentration in the mainstream of the Qiantang River in China using Landsat TM data. Int. J. Remote Sens. 2010, 31, 2309–2324. [Google Scholar] [CrossRef]
- EPA. Our Erren River—Propaganda Handbook of River Conservation; Environmental Protection Administration, Executive Yuan: Taipei, Taiwan, 2011. [Google Scholar]
- Chen, Y.C.; Hwang, H.J.; Chang, W.B.; Yeh, W.J.; Chen, M.H. Comparison of the metal concentrations in muscle and liver tissues of fishes from the Erren River, southwestern Taiwan, after the restoration in 2000. J. Food Drug Anal. 2004, 12, 358–366. [Google Scholar]


| Code | River Name * | Main River Length ** (km) | Average Discharge ** (m3/s) | Number of Monitoring Stations * | Coordinate * | Municipality * |
|---|---|---|---|---|---|---|
| N1 | Dahan | 135 | 59.62 | 7 | 25°2′33.36″ N, 121°29′2.4″ E | New Taipei and Taoyuan |
| N2 | Danshuei | 158.7 | 62.96 | 4 | 25°10′30″ N, 121°24′30″ E | New Taipei and Taipei |
| N3 | Jilong | 96 | 39.5 | 13 | 25°6′43.92″ N, 121°27′50.4″ E | Keelung, New Taipei, and Taipei |
| N4 | Laojie | 36.7 | Not available | 7 | 24°52′21” N, 121°13′17.4” E | Taoyuan |
| E1 | Dongshan | 24 | Not available | 3 | 24°40′3.1″ N, 121°48′41.1″ E | Yilan |
| C1 | Jhuoshuei | 186.6 | 143.73 | 5 | 23°50′22″ N, 120°15′14″ E | Nantou and Yunlin |
| C2 | Wu | 119.13 | 55.86 | 18 | 24° 10′11.5″ N, 120°31′5.7″ E | Nantou, Taichung, and Zhanghua |
| C3 | Xinhuwei | 49.85 | Not available | 5 | 23°44′58.95” N, 120°30′58.69” E | Yunlin |
| S1 | Erren | 61.20 | 8.43 | 18 | 22°54′46.8″ N, 120°10′33.6″ E | Kaohsiung and Tainan |
| S2 | Gaoping | 171 | 216.96 | 9 | 22°28′59″ N, 120°34′47″ E | Kaohsiung and Pingdong |
| S3 | Jishuei | 65 | 9.43 | 7 | 23°17′52.8″ N, 120°6′18″ E | Tainan |
| S4 | Puzi | 75.87 | 13.98 | 8 | 23°30′18.52” N, 120°29′51.53” E | Chiayi |
| S5 | Yanshuei | 41.3 | 5.92 | 11 | 23° 0′14.4″ N, 120°9′0″ E | Tainan |
| S6 | Zengwun | 138.47 | 9.2 | 11 | 23°3′0″ N, 120°4’1.2″ E | Tainan |
| River Name | Pb (mg/L) | As (mg/L) | Cd (mg/L) | Cr (mg/L) | Zn (mg/L) | ||||||||||
| N | Mean | SD | N | Mean | SD | N | Mean | SD | N | Mean | SD | N | Mean | SD | |
| Dahan | 412 | 0.01 | 0.02 | 412 | 0.002 | 0.004 | 412 | 0.0013 | 0.0027 | 412 | 0.004 | 0.003 | 412 | 0.059 | 0.13 |
| Danshuei | 236 | 0.01 | 0.01 | 236 | 0.002 | 0.002 | 236 | 0.001 | 0.0003 | 236 | 0.003 | 0.002 | 236 | 0.031 | 0.03 |
| Jilong | 301 | 0.01 | 0.01 | 301 | 0.004 | 0.003 | 301 | 0.0011 | 0.0008 | 301 | 0.004 | 0.003 | 301 | 0.021 | 0.02 |
| Laojie | 767 | 0.01 | 0.03 | 765 | 0.001 | 0.001 | 767 | 0.0011 | 0.0013 | 765 | 0.003 | 0.003 | 767 | 0.03 | 0.04 |
| Dongshan | 413 | 0.02 | 0.09 | 413 | 0.004 | 0.006 | 413 | 0.0013 | 0.0028 | 413 | 0.008 | 0.054 | 413 | 0.187 | 0.34 |
| Jhuoshuei | 267 | 0.03 | 0.03 | 267 | 0.003 | 0.002 | 267 | 0.0013 | 0.001 | 267 | 0.004 | 0.004 | 267 | 0.079 | 0.09 |
| Wu | 1042 | 0.01 | 0.04 | 1040 | 0.001 | 0.001 | 1042 | 0.0011 | 0.0006 | 1041 | 0.007 | 0.019 | 1042 | 0.04 | 0.08 |
| Xinhuwei | 300 | 0.02 | 0.02 | 300 | 0.005 | 0.004 | 300 | 0.0011 | 0.0005 | 300 | 0.004 | 0.004 | 300 | 0.055 | 0.06 |
| Erren | 668 | 0.02 | 0.02 | 668 | 0.008 | 0.005 | 668 | 0.0019 | 0.0026 | 668 | 0.009 | 0.074 | 668 | 0.125 | 0.28 |
| Gaoping | 948 | 0.02 | 0.02 | 944 | 0.003 | 0.005 | 948 | 0.001 | 0.0003 | 944 | 0.004 | 0.006 | 948 | 0.048 | 0.29 |
| Jishuei | 439 | 0.01 | 0.01 | 439 | 0.009 | 0.005 | 439 | 0.001 | 0.0003 | 439 | 0.004 | 0.006 | 438 | 0.022 | 0.03 |
| Puzi | 442 | 0.01 | 0.01 | 442 | 0.005 | 0.003 | 442 | 0.001 | 0.0003 | 442 | 0.005 | 0.01 | 442 | 0.065 | 0.31 |
| Yanshuei | 343 | 0.01 | 0.01 | 343 | 0.009 | 0.005 | 343 | 0.0011 | 0.001 | 343 | 0.005 | 0.012 | 343 | 0.04 | 0.07 |
| Zengwun | 665 | 0.01 | 0.02 | 665 | 0.003 | 0.003 | 665 | 0.001 | 0.0005 | 665 | 0.004 | 0.004 | 665 | 0.023 | 0.04 |
| River Name | Hg (mg/L) | Cu (mg/L) | Mn (mg/L) | Ag (mg/L) | Se (mg/L) | ||||||||||
| N | Mean | SD | N | Mean | SD | N | Mean | SD | N | Mean | SD | N | Mean | SD | |
| Dahan | 384 | 0.0004 | 0.00038 | 412 | 0.036 | 0.097 | 412 | 0.22 | 0.62 | 412 | 0.0026 | 0.0027 | 307 | 0.0013 | 0.00045 |
| Danshuei | 220 | 0.00044 | 0.00051 | 236 | 0.018 | 0.032 | 236 | 0.12 | 0.12 | 236 | 0.0028 | 0.0043 | 176 | 0.0013 | 0.00045 |
| Jilong | 715 | 0.00038 | 0.0003 | 767 | 0.007 | 0.011 | 765 | 0.11 | 0.12 | 765 | 0.0028 | 0.0049 | 570 | 0.0013 | 0.00044 |
| Laojie | 385 | 0.00032 | 0.00015 | 413 | 0.06 | 1.777 | 413 | 0.22 | 0.7 | 413 | 0.0024 | 0.002 | 308 | 0.0013 | 0.00045 |
| Dongshan | 285 | 0.00033 | 0.00012 | 301 | 0.005 | 0.009 | 301 | 0.1 | 0.06 | 301 | 0.0029 | 0.003 | 252 | 0.0013 | 0.00045 |
| Jhuoshuei | 251 | 0.00041 | 0.00036 | 267 | 0.019 | 0.03 | 267 | 0.69 | 1.16 | 267 | 0.0023 | 0.0017 | 191 | 0.0013 | 0.00049 |
| Wu | 970 | 0.00031 | 0.00006 | 1042 | 0.009 | 0.012 | 1040 | 0.11 | 0.17 | 1040 | 0.0023 | 0.0019 | 759 | 0.0013 | 0.0006 |
| Xinhuwei | 280 | 0.00034 | 0.00012 | 300 | 0.012 | 0.019 | 300 | 0.36 | 0.47 | 300 | 0.0022 | 0.0017 | 220 | 0.0013 | 0.00051 |
| Erren | 632 | 0.00058 | 0.00017 | 668 | 0.05 | 0.158 | 668 | 0.23 | 0.24 | 668 | 0.0025 | 0.0033 | 519 | 0.0014 | 0.00087 |
| Gaoping | 879 | 0.00034 | 0.00018 | 948 | 0.009 | 0.016 | 944 | 0.41 | 0.71 | 944 | 0.0028 | 0.0076 | 689 | 0.0013 | 0.00057 |
| Jishuei | 411 | 0.00034 | 0.00017 | 439 | 0.005 | 0.004 | 439 | 0.25 | 0.18 | 439 | 0.0024 | 0.0025 | 330 | 0.0013 | 0.00044 |
| Puzi | 415 | 0.00032 | 0.00013 | 442 | 0.007 | 0.043 | 442 | 0.23 | 0.24 | 442 | 0.0023 | 0.0022 | 327 | 0.0017 | 0.00197 |
| Yanshuei | 319 | 0.00032 | 0.0001 | 343 | 0.011 | 0.016 | 343 | 0.28 | 0.19 | 343 | 0.0023 | 0.0017 | 256 | 0.0013 | 0.00045 |
| Zengwun | 622 | 0.00034 | 0.00016 | 665 | 0.006 | 0.009 | 665 | 0.18 | 0.52 | 665 | 0.0023 | 0.002 | 490 | 0.0013 | 0.00044 |
| Parameter | RPI | Air Temperature | Water Temperature | pH | Conductivity | DO | BOD | COD | SS | Coliform | Ammonia | TP | TOC | Nitrate | Nitrite |
|---|---|---|---|---|---|---|---|---|---|---|---|---|---|---|---|
| RPI | 1 | −0.089 | −0.0072 | −0.438 | −0.376 ** | −0.719 ** | 0.621 ** | 0.339 ** | 0.512 ** | 0.333 ** | 0.587 ** | 0.402 ** | 0.383 ** | −0.301 ** | 0.308 ** |
| Air Temperature | - | 1 | 0.875 ** | −0.082 ** | −0.067 ** | 0.055 * | −0.165 ** | −0.169 ** | 0.053 * | −0.068 ** | −0.174 ** | −0.313 ** | −0.192 ** | 0.130 ** | −0.006 |
| Water Temperature | - | - | 1 | −0.1 ** | −0.043 | 0.052 * | −0.0167 ** | −0.172 ** | 0.018 | −0.080 ** | −0.178 ** | −0.3 ** | −0.137 ** | 0.063 | −0.046 |
| pH | - | - | - | 1 | 0.039 | 0.607 ** | −0.256 ** | −0.144 ** | 0.001 | −0.119 ** | 0.062 ** | 0.231 ** | −0.227 ** | 0.121 ** | −0.068 |
| Conductivity | - | - | - | - | 1 | 0.515 ** | −0.173 ** | −0.182 ** | −0.561 ** | −0.016 | −0.145 ** | −0.166 ** | −0.247 ** | 0.564 ** | 0.113 ** |
| DO | - | - | - | - | - | 1 | −0.415 ** | −0.346 ** | 0.062 ** | −0.069 ** | −0.194 ** | −0.125 ** | −0.434 ** | 0.254 ** | −0.176 ** |
| BOD | - | - | - | - | - | - | 1 | 0.853 ** | −0.026 | 0.550 ** | 0.419 ** | 0.407 ** | 0.788 ** | −0.203 ** | 0.098 * |
| COD | - | - | - | - | - | - | - | 1 | 0.133 ** | 0.255 ** | 0.548 ** | 0.603 ** | 0.854 ** | −0.150 ** | 0.093 * |
| SS | - | - | - | - | - | - | - | 1 | −0.011 | −0.065 ** | −0.021 | −0.106 ** | 0.245 ** | −0.095 * | |
| Coliform | - | - | - | - | - | - | - | - | 1 | 0.036 | 0.042 | 0.565 ** | −0.051 | −0.046 | |
| Ammonia | - | - | - | - | - | - | - | - | - | 1 | 0.738 ** | 0.562 ** | −0.093 * | 0.098 * | |
| TP | - | - | - | - | - | - | - | - | - | - | 1 | 0.501 ** | −0.006 | 0.102 * | |
| TOC | - | - | - | - | - | - | - | - | - | - | - | 1 | −0.248 ** | 0.094 | |
| Nitrate | - | - | - | - | - | - | - | - | - | - | - | - | 1 | −0.066 | |
| Nitrite | - | - | - | - | - | - | - | - | - | - | - | - | - | 1 |
| Component (Factor) | Initial Eigenvalues | ||
|---|---|---|---|
| Total | % of Variance | Cumulative % | |
| 1 | 4.208 | 38.25 | 38.25 |
| 2 | 1.471 | 13.37 | 51.62 |
| 3 | 1.175 | 10.68 | 62.3 |
| Parameter | Component (Factor) | ||
|---|---|---|---|
| 1 | 2 | 3 | |
| DO | −0.050 | −0.734 | 0.301 |
| BOD | 0.487 | 0.748 | 0.066 |
| COD | 0.564 | 0.718 | 0.137 |
| Ammonia | 0.858 | 0.069 | −0.086 |
| TP | 0.866 | 0.027 | 0.005 |
| TOC | 0.671 | 0.727 | 0.024 |
| Conductivity | −0.203 | −0.231 | −0.737 |
| Nitrate | −0.097 | −0.458 | 0.700 |
| SS | −0.185 | −0.008 | 0.709 |
| Nitrite | −0.067 | 0.714 | −0.558 |
| Coliform | 0.046 | 0.810 | 0.031 |
| Model | B | Sig. | Percentage | R2 |
|---|---|---|---|---|
| Constant | −0.602 | 0.000 | - | 0.74 |
| Regression Factor 1 | 2.573 | 0.000 | 72% | |
| Regression Factor 2 | 0.554 | 0.000 | 16% | |
| Regression Factor 3 | 0.440 | 0.000 | 12% |
© 2018 by the authors. Licensee MDPI, Basel, Switzerland. This article is an open access article distributed under the terms and conditions of the Creative Commons Attribution (CC BY) license (http://creativecommons.org/licenses/by/4.0/).
Share and Cite
Putri, M.S.A.; Lou, C.-H.; Syai’in, M.; Ou, S.-H.; Wang, Y.-C. Long-Term River Water Quality Trends and Pollution Source Apportionment in Taiwan. Water 2018, 10, 1394. https://doi.org/10.3390/w10101394
Putri MSA, Lou C-H, Syai’in M, Ou S-H, Wang Y-C. Long-Term River Water Quality Trends and Pollution Source Apportionment in Taiwan. Water. 2018; 10(10):1394. https://doi.org/10.3390/w10101394
Chicago/Turabian StylePutri, Marsha Savira Agatha, Chao-Hsun Lou, Mat Syai’in, Shang-Hsin Ou, and Yu-Chun Wang. 2018. "Long-Term River Water Quality Trends and Pollution Source Apportionment in Taiwan" Water 10, no. 10: 1394. https://doi.org/10.3390/w10101394
APA StylePutri, M. S. A., Lou, C.-H., Syai’in, M., Ou, S.-H., & Wang, Y.-C. (2018). Long-Term River Water Quality Trends and Pollution Source Apportionment in Taiwan. Water, 10(10), 1394. https://doi.org/10.3390/w10101394