1. Introduction
In 2015 the 2030 Agenda for Sustainable Development was unanimously adopted by the 193 Member States of the United Nations (UN) including Sustainable Development Goal 6 (SDG 6): “Ensure availability and sustainable management of water and sanitation for all”—often referred to as the ‘water goal’. A report was commissioned in 2016 and published in 2018—‘Sustainable Development Goal 6 Synthesis Report on Water and Sanitation 2018’ (and is referred to throughout this paper as the ‘report’)—to review progress with SDG 6 at the global and regional levels based on the available evidence and complementary UN and non-UN information sources [
1]. The report was based on the latest data available for the 11 SDG 6 global indicators that track progress towards the 8 SDG 6 global targets as well as complementary data and information from the literature. The report sought to inform discussions among Member States during the High-Level Political Forum (HLPF) on Sustainable Development in July 2018. It also aimed to inform policy and decision-makers working in water, environment, and sustainable development, and was expected to be of particular value to professionals in the water and water-using sectors, education and research, and NGOs. Significant outcomes from the report included a baseline status from which to measure progress, gaps in knowledge, capacity and resource availability, and directions for enabling and accelerating progress towards achieving SDG 6 by 2030.
This paper reviews the report from an academic perspective and we ask how those involved in education, training, and research can contribute to enabling and accelerating progress towards achieving SDG 6. We first explore the advent and development of SDG 6 as concerns about water and sanitation began to emerge during the early development of the Millennium Development Goals (MDGs), in order to better understand what SDG 6 is about, and how and why eventually it became an important and central feature of the 2030 Agenda. Indeed, the UN Deputy Secretary General described SDG 6 as the ‘docking station’ for all the SDGs and the 2030 Agenda (speech at Stockholm World Water Week 2018). We then distill those aspects that we consider to be particularly important for those involved in education and research and who may wish to engage with SDG 6. These include the key areas of data acquisition, human and institutional capacity development, and taking research into practice.
2. Advent and Development of SDG 6
SDG 6 was one of 17 SDGs in the UN 2030 Agenda for Sustainable Development that embodied universal aspirations for achieving a future without poverty, more just, equitable, peaceful and sustainable, that leaves no one behind [
2]. It provided a framework that fostered universality and integration across countries, mobilized all stakeholders, and inspired action. It invited everyone in both developing and developed countries to accept and embrace comprehensiveness and interconnectedness.
The 2030 Agenda explicitly included all aspects of water resources, water supply, and sanitation, but this was not always the case. The 2030 Agenda and the SDGs were built on the foundation created by the MDGs between 2000 and 2015. The first UN Conference dedicated to water was held in 1977 in Mar del Plata (Argentina), but wider concerns about water resources were only just emerging on the political scene in the early 1990s. In 1992, the International Conference on Water and the Environment was responsible for developing the ‘Dublin Principles’ that provided the foundation for an integrated approach to managing water resources. In 2000, world leaders adopted the Millennium Declaration from which eight MDGs set out elements of development policy, including target 7C: to halve “the proportion of the population without sustainable access to safe drinking water and basic sanitation” by 2015. However, the original wording only referred to drinking water and it was not until 2002 that sanitation was added following the 2002 Johannesburg Plan of Action. Water resources as such did not feature in the MDGs, except implicitly in goals such as halving extreme poverty rates, reducing child mortality, halting the spread of HIV/AIDS and other diseases, and ensuring environmental sustainability.
The actions carried out as a result of the MDGs enabled millions to gain access to clean drinking water, sanitation, and basic hygiene. In 1990, the reference year for measuring MDG progress, global coverage of the use of improved drinking water sources was 76% and sanitation facilities was only 54%. In 2015, access to drinking water rose to 88% and sanitation facilities to 77% [
3].
With hindsight, the MDGs had significant shortcomings. They paid little attention to the interactions between goals and whether the total demand for key resources, such as water, could be met without degrading the natural resource base and the underlying water-related ecosystems [
4]. In 2015, the 2030 Agenda and the SDGs were built on the foundation created by the MDGs. The 2030 Agenda provided a framework that fostered universality and integration across countries, mobilized all stakeholders, and inspired action, inviting everyone in both developing and developed countries to accept and embrace comprehensiveness and interconnectedness. It took into consideration the growing global concern over the availability and quality of water resources, not just to meet water supply and sanitation needs but also to satisfy the world’s increasing demand for water in the face of rapidly expanding populations, agricultural intensification, urbanization, increasing energy demand, industrial production and pollution, and climate change.
In 2015, the World Economic Forum listed water insecurity as the greatest long-term risk facing society [
5] and water has since remained one of the top global risks. In 2016, the UN World Water Development Report suggested that, if society continued to pursue the current “business as usual” model, by 2050, water demand would exceed supply by over 40%, which would put at risk 45% of global GDP, 52% of the world’s population, and 40% of grain production [
6].
In 2016, agriculture (including irrigation, livestock, and aquaculture) accounted for 69% of all annual water withdrawals globally, industry (including power generation) accounted for 19%, and households for 12% [
7]. But meeting these demands was just one side of the coin. The other side was that all water uses can pollute freshwater resources. Globally, it was estimated that 80% of wastewater from municipal, industrial, and agricultural sources was discharged back into water bodies without proper treatment, further reducing the availability of fresh water for drinking and other uses [
8]. Thus, water demand, how it was used, and how wastewater was discharged into water bodies could no longer continue to be treated as separate entities if we wished for sustainable development.
The 2030 Agenda was more comprehensive than the MDGs: 17 goals instead of eight, 163 targets instead of 21, and 230 indicators instead of 60 (see
Box 1). There was also growing acceptance of water’s central role in development and, as water was connected to most if not all the proposed SDGs, water management would be taken care of within each SDG. However, this raised serious concerns within the water sector that such an approach would be contrary to the 2030 Agenda aspiration for integration, as it would perpetuate the fragmented or ‘silo’ approach to managing water within water-using sectors, such as in water supply, in energy, and agriculture—a management approach that was and continues to be prevalent in most countries. Ait Kadi [
2] suggested that this option would also fail to highlight water as a limiting resource and recognize both the scale and complexity of the huge and multidimensional water challenge facing the world. As a result, most international water-related organizations concluded that water was so crucial to development it should have its own goal.
The acceptance of a dedicated water goal (SDG 6) was a major ‘game-changer’ for water and water-using sectors. The goal flagged water as in need of serious attention and placed primary responsibility for water management with the water sector. The new goal went much further than water supply, sanitation, and hygiene (WASH) to include all aspects of the water cycle and explicitly recognized that water has impact across the entire development agenda. It targeted water quantity (scarcity) and quality, water-use efficiency, and water-related ecosystems. It promoted a basin approach to water management and the need for Integrated Water Resources Management (IWRM), which goes beyond national administrative boundaries and embraced transboundary water management that affects almost half the Earth’s land surface.
A major step forward among Member States was recognizing the significance of IWRM as a coping strategy for managing water shortages and as a means of reconciling many competing and potentially conflicting demands for water. The water sector has a long history of taking a fragmented approach to water management. Adopting an integrated approach was an ambitious step and not without its critics, but it aligned well with the overall aspiration for an integrated and collaborative approach across the 2030 Agenda. The implication that stemmed from such an approach was that the success of each SDG would be linked to the success of others. SDG 6 would most effectively be achieved if the other goals also succeeded and, in turn, the success of other goals would depend on the success of SDG 6.
Box 1. Establishing the Sustainable Development Goals (SDGs).
The United Nations Statistical Commission established an Interagency and Expert Group on SDG Indicators to develop and implement the global indicator framework for the goals and targets of the 2030 agenda. The SDG targets are “global in nature and universally applicable, taking into account different national realities, capacities and levels of development, and respecting national policies and priorities”. They are aspirational, and each government must decide how to incorporate the targets into national planning processes, policies, and strategies, taking into account national circumstances.
Global assessments provide a synthesis of current thinking about complex issues, and guidance about what should be done. They may not be so useful for guiding investment and solving local problems, but economic interconnections today can mean that specific geographical problems can have global reach.
Source: Adapted from [
1].
3. SDG 6 Synthesis Report 2018
The report, which presented a global review of the water sector and progress with SDG 6, was the first of its kind and as such its authors considered the report to be a ‘work in progress’—one that would inevitably improve as subsequent progress reports were issued. This was an ambitious and unique undertaking that brought together the custodians of the 11 SDG 6 global indicators and involved 14 UN agencies, several international organizations, and many individuals, directly and indirectly (
Table 1). The report itself thus became a major exercise in cooperation and integration.
The report first presented the global baseline status of each target and associated indicators, including the challenges, opportunities, and policy implications. The report’s focus then shifted towards what needed to be done to enable and accelerate progress within the water sector to achieve SDG 6 by 2030, including the thorny issues of putting integration into practice, improving water governance, and eliminating inequality, which is an essential feature of the 2030 Agenda of leaving no-one behind.
In the spirit of the 2030 Agenda, the report also examined how SDG 6 connected with other SDGs, the benefits water could bring to sustainable development, and in turn the benefits that other SDGs could bring to the water sector. There were many ways of describing the myriad connections, but too often discussions about them were intuitive due to the lack of data and analysis to create quantitative arguments. The report went beyond rhetoric and offered evidence to demonstrate the importance of water connections, particularly those that maximized synergies and reduced the risks that actions taken to meet one goal would, if not well explored, undermine other goals. Such an integrated approach could help to ensure appropriate timing and sequencing of policy and institutional reforms and public investments so that limited resources were used more efficiently and sustainably. The outcome from the report was summarized in a set of messages on the process of integrating SDG 6 into the 2030 Agenda, on understanding the baseline status and trends based on interpreting the data from the indicators, and on enabling and accelerating progress towards achieving SDG 6.
Three issues of specific interest and concern to those in education, training, and research emerged from the report. First was the dearth of data across the global water sector. Second was the acute lack of human and institutional capacity to manage water in many low- and middle-income countries, and third was the need to turn research into policy-making and practical development. None of these findings was surprising. They have constrained water-related development and economic growth, particularly in the developing countries where water insecurity was already high, where population growth was expected to be greatest, and where the impact of global changes, including climate change, were expected to be most severe.
What was remarkable and paradoxical was the limited attention that governments appeared to give to these issues when concerns over water resources were high on the political Agenda in many water-insecure countries. Behind this was the suspicion that Adam Smith’s comment in 1776 [
9] still pervaded much of the thinking about water resources, its relative importance, and value, “Nothing is more useful than water, but it will purchase scarce anything”. Water is a commodity that should not be wasted or treated poorly if global and local water crises are to be avoided.
4. SDG 6 Indicators
Although readers may tend to focus on the headline findings, such as “SDG 6 is not on track for 2030”, the report raised concerns about some of the indicators and their value in supporting the targets and that, in turn, support policy and decision-making, and monitoring status and progress.
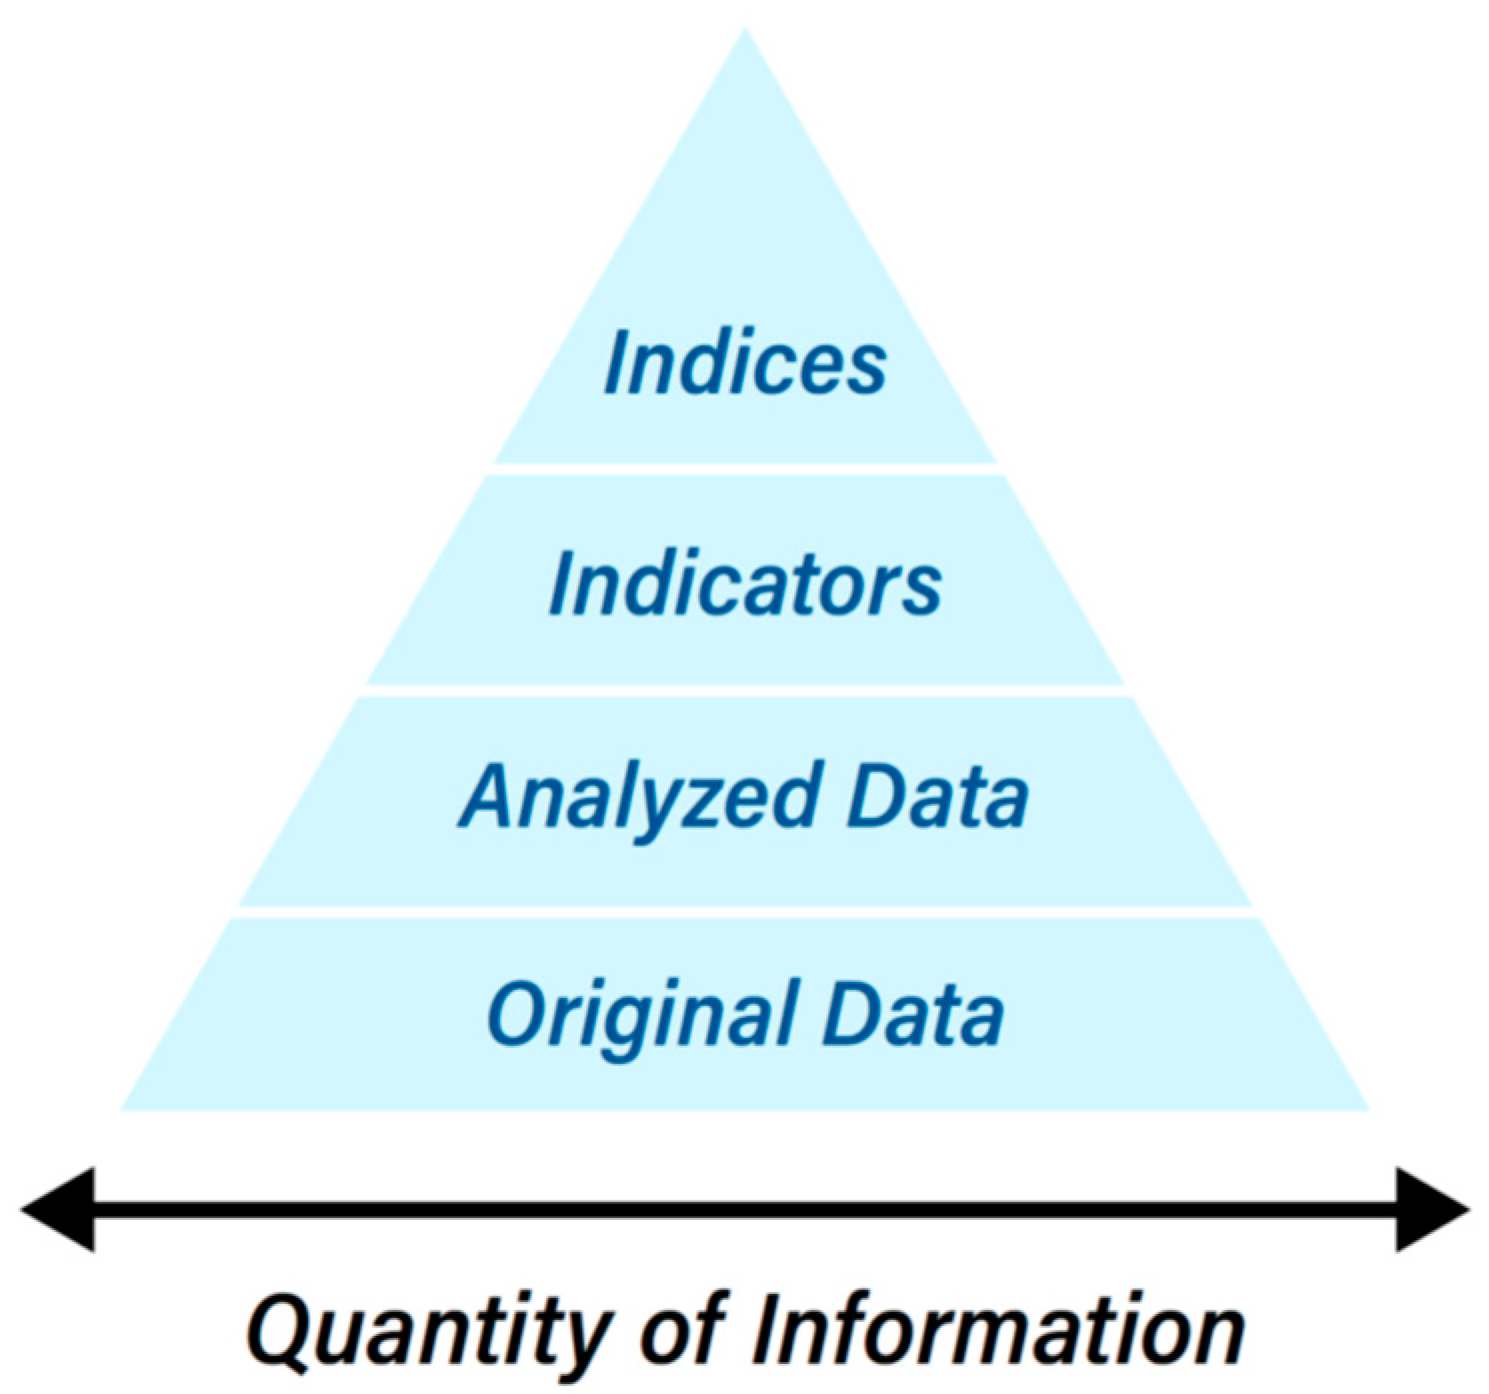
Indicators are a means of packaging or aggregating data into a form that can be more easily interpreted from a policy perspective and used to monitor status and progress towards a target and a goal (
Figure 1). In contrast to original data, indicators are usually single-valued numbers that aggregate different sources of information and reflect the overall score of a process. Establishing good indicators was about capturing and analyzing key data to provide a realistic picture of status and progress towards a target. If there were too few indicators, it could be difficult to build an accurate picture, whereas too many indicators and the process of data acquisition, analysis, and interpretation would become overly complex and unmanageable, particularly in countries that lack the capacity to do this. Achieving the right balance between accuracy and practicality by focusing on informing policy and decision-making is difficult but necessary.
SDG 6 comprised eight targets that addressed the entire water cycle (
Table 1). The targets included: provision of drinking water (6.1) and sanitation and hygiene services (6.2), treatment and reuse of wastewater and ambient-water quality (6.3), water-use efficiency and scarcity (6.4), IWRM including through transboundary cooperation (6.5), protection and restoration of aquatic water-related ecosystems (6.6), international cooperation and capacity-building (6.a), and local participation in water and sanitation management (6.b).
Eleven indicators measure progress towards those targets. All the indicators were new, though some were based on indicators from the MDG period, and now incorporated many new elements that reflect the increased ambition of the 2030 Agenda. Not all indicators were well-established. Some were clearly defined, while others were still in a development phase. The UN classified indicators in three tiers according to their level of development: Tier I indicators had established methods, standards, and data available for at least 50% of the global population and 50% of countries, Tier II indicators had established methods and standards, but data were not regularly produced by countries, and Tier III had no established methodologies and were still being developed. The tier classification was updated regularly.
Table 2 summarizes the status of SDG 6 indicators in 2018.
4.1. Targets 6.1—Drinking Water and 6.2—Hygiene and Sanitation
Achieving Target 6.1 called for progressively improving the quality of services to 2.1 billion people who lacked water accessible on premises, available when needed, and free from contamination (safely managed drinking water) and reaching the 4.5 billion people worldwide who lacked a safely managed sanitation service in 2015 [
11]. These set the targets for drinking water, sanitation, and hygiene and called for universal and equitable access to safe and affordable services for all by 2030. They built on the MDGs but went well beyond simply measuring access to infrastructure to take account of the quality of services provided. Indicator 6.1.1 was about monitoring the proportion of population using safely managed drinking water (available on the premises, whenever needed, and free from fecal and chemical contamination). Indicator 6.2.1 monitored safely managed sanitation (not shared and excreta safely disposed) and included handwashing facilities. The main concern was not the indicators
per se, but the sheer volume of data needed for assessment. As a consequence, significant data gaps were identified in some countries, mainly because of introducing the new indicators.
4.2. Target 6.3—Water Quality and Wastewater
This target presented highly complex challenges for many countries. Globally, 80% of all wastewater (from domestic, industrial, and urban sources, and from agriculture) were reported to be discharged untreated into water bodies [
8]. However, the target called for countries to halve the proportion of untreated wastewater by 2030 by increasing wastewater collection and ensuring that treatment produced effluents that consistently met national standards both for domestic sewage and industrial wastewater. Dealing with what were described as point-source solutions also needed to go in tandem with tackling diffuse pollution, mainly from agriculture.
Water pollution has worsened since the 1990s in almost all the rivers in Latin America, Africa, and Asia, putting tens of millions of people at risk [
12] as many developing countries have tended to focus on economic and social development, often at the expense of the water-related environment. Progress on this target was also linked to safe drinking water, reducing waterborne disease, and safe water for increasing food production, plus many other development issues. It was monitored via two indicators: Indicator 6.3.1 monitored the proportion of safely treated wastewater and Indicator 6.3.2 monitored the proportion of water bodies with good ambient-water quality.
As with Indicators 6.1 and 6.2, data acquisition was the major challenge for monitoring the two indicators. The efficiency of monitoring programs and data interpretation varied in developed countries, but major challenges were expected in developing countries, mainly due to the lack of physical infrastructure for sample collection and analysis and human capacity. Data were often stored within single institutions and many countries did not have a central facility for water-quality data, nor did they have policies in place to harmonize data standards and enable intra- and intersectoral cooperation within and beyond national boundaries. The report was unable to provide detailed insights into industrial pollution, as discharges were poorly monitored, and data were seldom available at national level.
4.3. Target 6.4—Water Use and Scarcity
This targeted water-use efficiency (Indicator 6.4.1) and water scarcity (Indicator 6.4.2)—both aspects proved difficult to assess on a global scale. There were concerns about the indicators as well as the available data. For this reason, analysis was based on data already available in international datasets, such as AQUASTAT [
7].
Indicator 6.4.1 was about using less water to carry out society’s economic activities and measured the financial value produced by an economy (i.e., gross domestic product, GDP) relative to the volume of water used (US$/m3). It included all water used in municipalities, industry, agriculture, and mining. As most countries relied less than 30% on agriculture for their GDP, the report argued that it was essential to consider all the sectors using water to assess the capacity for economic growth without overexploiting water resources. However, the report suggested that this indicator did not tell the whole story for those countries whose GDP relied on low-value agriculture. Improvements in water productivity and irrigation efficiency in agriculture and reducing water losses in municipal distribution networks and industrial and energy cooling processes, were among the main issues that indicators should monitor to provide decision-makers with the information they need to orient their development choices.
It was important to understand the SDG 6 definition of water-use efficiency to avoid confusion with other definitions of efficiency commonly used in the water sector. Water-supply engineers, for example, measure water-use efficiency as the amount of amount of water lost through leakage relative to the amount of water supplied into the system. Irrigation engineers define water-use efficiency as the amount of water consumed by a crop divided by the amount withdrawn from a water source, or the amount of water consumed to produce a measured quantity of produce. Improving water-use efficiency implied water saving and making water available for other purposes, such as environmental flows, but this is not always the case. Research has shown that farmers who ‘saved’ water by investing in various technologies tended to increase their irrigated area rather than release water for others to use [
13,
14].
Water stress affected countries on every continent, and hindered the sustainability of natural resources, as well as economic and social development. Indicator 6.4.2 measured water scarcity as the proportion of total freshwater withdrawn to the total available resource. The indicator now included all water uses and particularly environmental-flow requirements to sustain vital water-related ecosystems.
Indicator 6.4.2 was a good example of how scale affected the result of monitoring and reporting. Average global stress value was only 11% that might lead some to conclude that the world was not really heading for a water crisis. However, there were clearly significant differences among countries and regions that were hidden within the global figure. Sub-Saharan Africa, for example, was reported to experience only 3% water stress, but this regional value hid the large differences between the wetter north and the drier south that regularly suffered from severe drought. Similar significant differences could also occur within countries and catchments. Clearly, disaggregating data to (sub)country or (sub-) basin level must be the norm to aid decision-makers. It was pertinent that, within southern Africa, there were significant water-resource endowments that were underdeveloped and less than 18% of agricultural land was equipped with irrigation systems [
7]. Thus, the portion of withdrawals of the total available water resources remained low and agriculture was largely dependent on the uncertainties of rain-fed farming.
In favor of the current indicators, as economies grow, countries tend to use more water for irrigation, households, energy, industry, mining, and leisure. Each has a different capacity to produce value. Data showed that, in most countries, there was scope to increase water use without affecting water resources. However, a decline in water-use efficiency, particularly if accompanied by an increase in water stress, would instead indicate that the development pattern will become unsustainable in the future [
1].
4.4. Target 6.5—IWRM
This target is about putting IWRM into practice within national (Indicator 6.5.1) and transboundary contexts (Indicator 6.5.2). Integration was a central theme across the entire 2030 Agenda and the report argued that putting IWRM into practice would be one of the most comprehensive steps that countries can make towards achieving SDG 6. Implementing a holistic IWRM approach would provide institutional structures and multistakeholder processes to balance the development and use of water resources for people, for sustainable economic growth, and for supporting vital water-related ecosystem services. There was ‘no one size fits all’ solution. Each country would need to seek its own pathway towards integration based on its unique mix of natural resources and social and economic development. A key factor would be long-term political commitment to change at the highest level [
2].
The report referred to a framework promoted by GWP to help countries decide on the actions needed based on their level of socioeconomic development [
15]. Evidence was also presented that correlated a country’s Human Development Index (HDI) with IWRM progress. This pointed to IWRM being primarily associated with richer countries, but evidence in the report suggested this was not always the case. According to Shah [
15], high HDI clearly helped but low HDI was not be a barrier to implementing IWRM in countries that had strong national institutional capacity and coordination, and high stakeholder participation at national and local levels. Eight African countries were listed as making important steps towards putting IWRM into practice.
Status and progress on IWRM were measured using a questionnaire. This was country-driven and designed to include both multiple governmental and nongovernmental stakeholder groups. Completed questionnaires, which contain reasoning for the scores for each question, provided national policy-makers with a diagnostic tool to identify which areas were progressing well, and those that may be facing barriers to progress. Questions were posed around four categories: the introduction of policy, laws, and plans (global average score, 50%); institutions and participation (53%); the use of management instruments (49%); and financing (39%). The global IWRM score was 48%, corresponding to medium–low implementation based on surveys from 157 countries. Earlier surveys in 2007 and 2011 (referred to in the report) showed modest progress globally. All countries were not expected to reach full implementation by 2030 [
16].
Indicator 6.5.2 measured and monitored the proportion of a transboundary basin area within a country covered by an ‘operational arrangement’ defined as a treaty, convention, agreement, or other formal arrangement that met several operational criteria that sought to go beyond simply measuring whether arrangements were in place. This was an important target because it was one of the few SDG targets that explicitly demanded transboundary cooperation over natural-resource management. Most countries, with riparian rights, recognized the importance of adopting basinwide cooperation agreements to share water in rivers, lakes, and aquifers. Based on questionnaires, the average of the national percentage of transboundary basins covered by an operational arrangement was 59% based on data from 61 out of 153 countries sharing transboundary waters. Countries highlighted significant challenges in developing transboundary cooperative arrangements, such as power asymmetries among countries; fragmentation in national legal, institutional, and administrative frameworks; lack of financial, human, and technical capacity; and poor data availability, especially in relation to transboundary aquifers [
1]. Despite these challenges, managing water bodies that cross national administrative boundaries could catalyze cooperation, bring peace and stability to regions, and promote economic development.
One of the strengths of questionnaires was that data can be easily disaggregated by question and used by countries as a quick diagnostic tool. This could help to identify those aspects of IWRM and transboundary management that were progressing well, and at what level (local, national, or transboundary) and highlight barriers to progress. The report suggested the greatest opportunities to accelerate implementation were in financing water-resource development and management, and in devolving IWRM to the lowest appropriate level.
4.5. Target 6.6—Water-Related Ecosystems
The world has lost around 70% of its natural wetland over the last century, including significant loss of freshwater species. Such losses can seriously threaten sustainable development because water-related ecosystems underpin other SDGs, in particular those relating to food and energy production, biodiversity, and ecosystems on land and sea. Protecting and restoring water-related ecosystems could not be achieved without progress on these other goals and vice versa. Water-related ecosystems tended to be managed for short-term gain at the expense of long-term benefits, and large-scale human activities threatened to degrade and destroy them [
17]. This target sought to halt ecosystem degradation and destruction and to assist in recovering those already degraded.
Indicator 6.6.1 brought together information on four categories of ecosystems: vegetated wetlands (including swamps, swamp forests, marshes, paddies, peatlands, and mangroves), open-water bodies (such as lakes and reservoirs), rivers and estuaries, and groundwater. Four sub-indicators (spatial extent, water quantity, water quality, and ecosystem health) described different aspects of these ecosystems.
The report suggested that global data used during the SDG process did not reflect the well-established concerns and trends on freshwater-ecosystem degradation that other data sources show. Data-collection systems did not differentiate between natural and artificial water bodies, such as reservoirs, dams, and rice paddies. All have been increasing in most regions, while natural wetlands were in decline.
The global indicator was helpful in highlighting these issues but was considered too broad for decision-making. Insufficient data were generated by countries to adequately measure progress. Further detailed data (quantitative, geospatial, and qualitative) would be essential for a more accurate understanding of water-related ecosystems and the benefits they provide. Earth observations could complement local ground data and support the national burden of acquisition and reporting. Member States were advised to strengthen operational capacity and increase financial resources, implement clear roles and responsibilities for data collection and processing, and ensure political will at the highest level. Monitoring at ecosystem level and at basin scale was important. The local level would provide evidence for practical action, while larger basin monitoring would provide an overall perspective within hydrological boundaries.
Monitoring also revealed a variety of opportunities, such as monitoring change over time. Understanding how ecosystems were changing could provide evidence of their value that could underpin decision-making towards their future protection and restoration.
4.6. Target 6a—Cooperation and Capacity Building
International cooperation and building (developing) capacity contributed to all the SDG targets, but the report suggested they need to be better understood and the monitoring framework improved over time, possibly with additional indicators. Cooperation was largely about funding and was strongly focused on external support. Substantially more funding was needed to reach SDG 6 Targets 6.1 to 6.6. Currently, data are insufficient to assess the extent to which overseas development aid was included in government spending plans. Most data available were from the WASH sector because of the extensive availability of GLASS data. Few data were available on other water-related investments and on funding for the recurring costs of operation and maintenance. There was as yet no indicator for capacity development related to the full scope of SDG 6. Data available on capacity needs and progress were largely limited to the WASH sector (see Capacity Development below).
4.7. Target 6b—Stakeholder Participation
Effective and sustainable water management depended on stakeholders participating in decisions linked to water development. Singto et al. [
18] concluded that “participation should be institutionalized and facilitated in a way that fosters accountable representation by all stakeholders, builds trust, and recognizes stakeholder interests and knowledge”.
In 2015, over 75% of countries reported having clearly defined policies and procedures in place for service users and communities to participate in planning programs for drinking water supply (urban: 79%, rural: 85%) and sanitation (urban: 79%, rural: 81%) [
19]. For water-resource planning and management, 83% of reporting countries had policies and procedures in place.
Although these results look encouraging, there were concerns over how participation was monitored and, as such, the monitoring framework was still under development. Current measurements were based only on the numbers of people involved in participation, whereas the target needed a clearer set of indicators that included the quality of participation, such as nature, effectiveness, and value.
The data for this indicator mostly came from the WASH sector, although steps were in place to include data from other activities, such as IWRM. Monitoring needed to give a “voice” to other groups, particularly those in agriculture where there is a long tradition of farmer participation in water-user associations.
5. Data Acquisition
The UN-Water Integrated Monitoring Initiative for SDG 6 (For more information:
http://www.sdg6monitoring.org/) highlighted concerns over the lack of data both for the indicators and for national planning and decision-making. The report gave emphasis to that well-known statement, “We cannot plan and manage what we do not measure and monitor”. Data were at the heart of decision-making, providing the raw material for accountability. Data also underpinned good water governance, enabling decision-making to move from political whim towards sound evidence-based planning. Whittington et al. [
20] argued it was imperative that governments performed the analytical work required to understand complex hydrological systems and to determine the economic costs and benefits of policy interventions.
Overall, less than half of Member States had comparable data on progress towards each of the SDG indicators. The average Member State only reported on one-third of the SDG 6 indicators and only 6% reported on more than eight out of the 11 indicators (
Figure 2). No country reported on all indicators and 6% did not report on any indicator. This represented a major knowledge gap, and the challenge of acquiring sufficient data should not be underestimated.
To help resolve this problem, in 2016–2018 a major integrated monitoring program was established to provide support tools to Member States to help generate and compile data. Initially, 30 countries were selected to engage in long-term institution building to monitor SDG 6 indicators, with encouraging early results (green in
Figure 2). More are expected to follow as the UN commits to continue this program of support. This is likely to bring benefits not only to improved monitoring and reporting on SDG 6, but also in providing data for national and local water-resource planning.
One notable exception was data acquisition for water supply and sanitation (SDG 6.1 and 6.2). Most countries tended to be comparable and data-rich in terms of WASH because the data-collection systems were well-developed during the MDG period. This early establishment meant that WASH targets had a head start on other targets in terms of reporting and particularly in establishing trends. The 2016/2017 GLASS survey indicated that nearly 70% of countries had data available to support resource allocation for drinking water and sanitation (
Figure 3). However, WASH now had several new indicators for safely managed services and data collection and analysis, for these were proving to be a challenge for some countries.
What lessons could be learned from SDG 6 data acquisition and monitoring? The report highlighted the lack of readiness among many countries to report on the SDG 6 targets. Not surprisingly, some countries, usually the more developed and data-rich, had the capacity to collect data, to analyze, and report. Others, mostly the less-developed, had only limited data and all too often lacked capacity, in terms of people, equipment to collect data, funding, and a national infrastructure to process and report. Some countries had valuable datasets but not in a format compatible with the requirements for SDGs, while others had data scattered in ministries, universities, laboratories, and private-sector organizations with little capacity to integrate these resources within a national collection point, such as a national statistics office. Scattered data sources can also bring problems of willingness to invest and participate, as well as issues of standardization, credibility, transparency, accountability, and acceptability.
Many countries did not have the infield data-collection systems in place to acquire even the most basic information on climate, rivers flows, and water quality. The resource implications of monitoring were also highlighted both in terms of staff schedules and budgets, and through better coordination among ministries and departments. As part of the 2030 Agenda, the UN promoted an integrated approach to data acquisition as a means of reducing time and costs by exploiting synergies and reducing overlaps in monitoring efforts.
Regional monitoring initiatives were another key element of the monitoring landscape. Regional organizations received data from national governments that were used for global monitoring. Examples included the European Union’s Water Framework Directive that sets standards and monitors water quality in rivers and is often described as Europe’s approach to IWRM. Another was the Pan-African Monitoring and Reporting System (
http://www.africawat-sanreports.org) that harmonized monitoring and reporting on water and sanitation indicators for the whole of Africa while linking with other global monitoring and reporting processes. The African Ministers’ Council on Water (AMCOW), which leads Pan-African monitoring, has worked closely with both countries and international organizations to ensure alignment.
Other targets, such as those for water scarcity and quality, water-use efficiency, IWRM, and water-related ecosystems, were new elements in the 2030 Agenda and so too were their indicators. To compensate for the lack of national data, some new indicators, such as water-use efficiency and water scarcity, relied on internationally available datasets, such as AQUASTAT, which has a long, established record of capturing national water resources and water-use data [
7].
Data acquisition required time and funding, and international donors were often reluctant to fund data acquisition and preferred innovative and exciting ideas related to modeling and IT or visualizations. This challenge was not limited to developing countries: the USGS Hydrologic Monitoring Network Stability identified stations where normal data-collection operations had become unstable due to lack of funding (
https://water.usgs.gov/networks/fundingstability/). Ways of overcoming the official and/or on-site data problem include the use of Earth observation, such as in monitoring open-water aquatic ecosystems, the use of citizen science, and acquiring private-sector data. The Statistics Division of the UN has prepared a handbook introducing the use of Earth observation data for official statistics, sources available, and methodologies for producing statistics [
21]. The World Bank has also produced a report especially dedicated to the use of Earth observation for water management [
22]. However, these innovative approaches have not yet been sufficiently incorporated into routine data-monitoring systems at all levels. Research is needed to map alternative ways of acquiring data, establishing common metrics, developing methods of capture, and ensuring the effective use of these data for water management and decision-making, at the local and national level in developing countries.
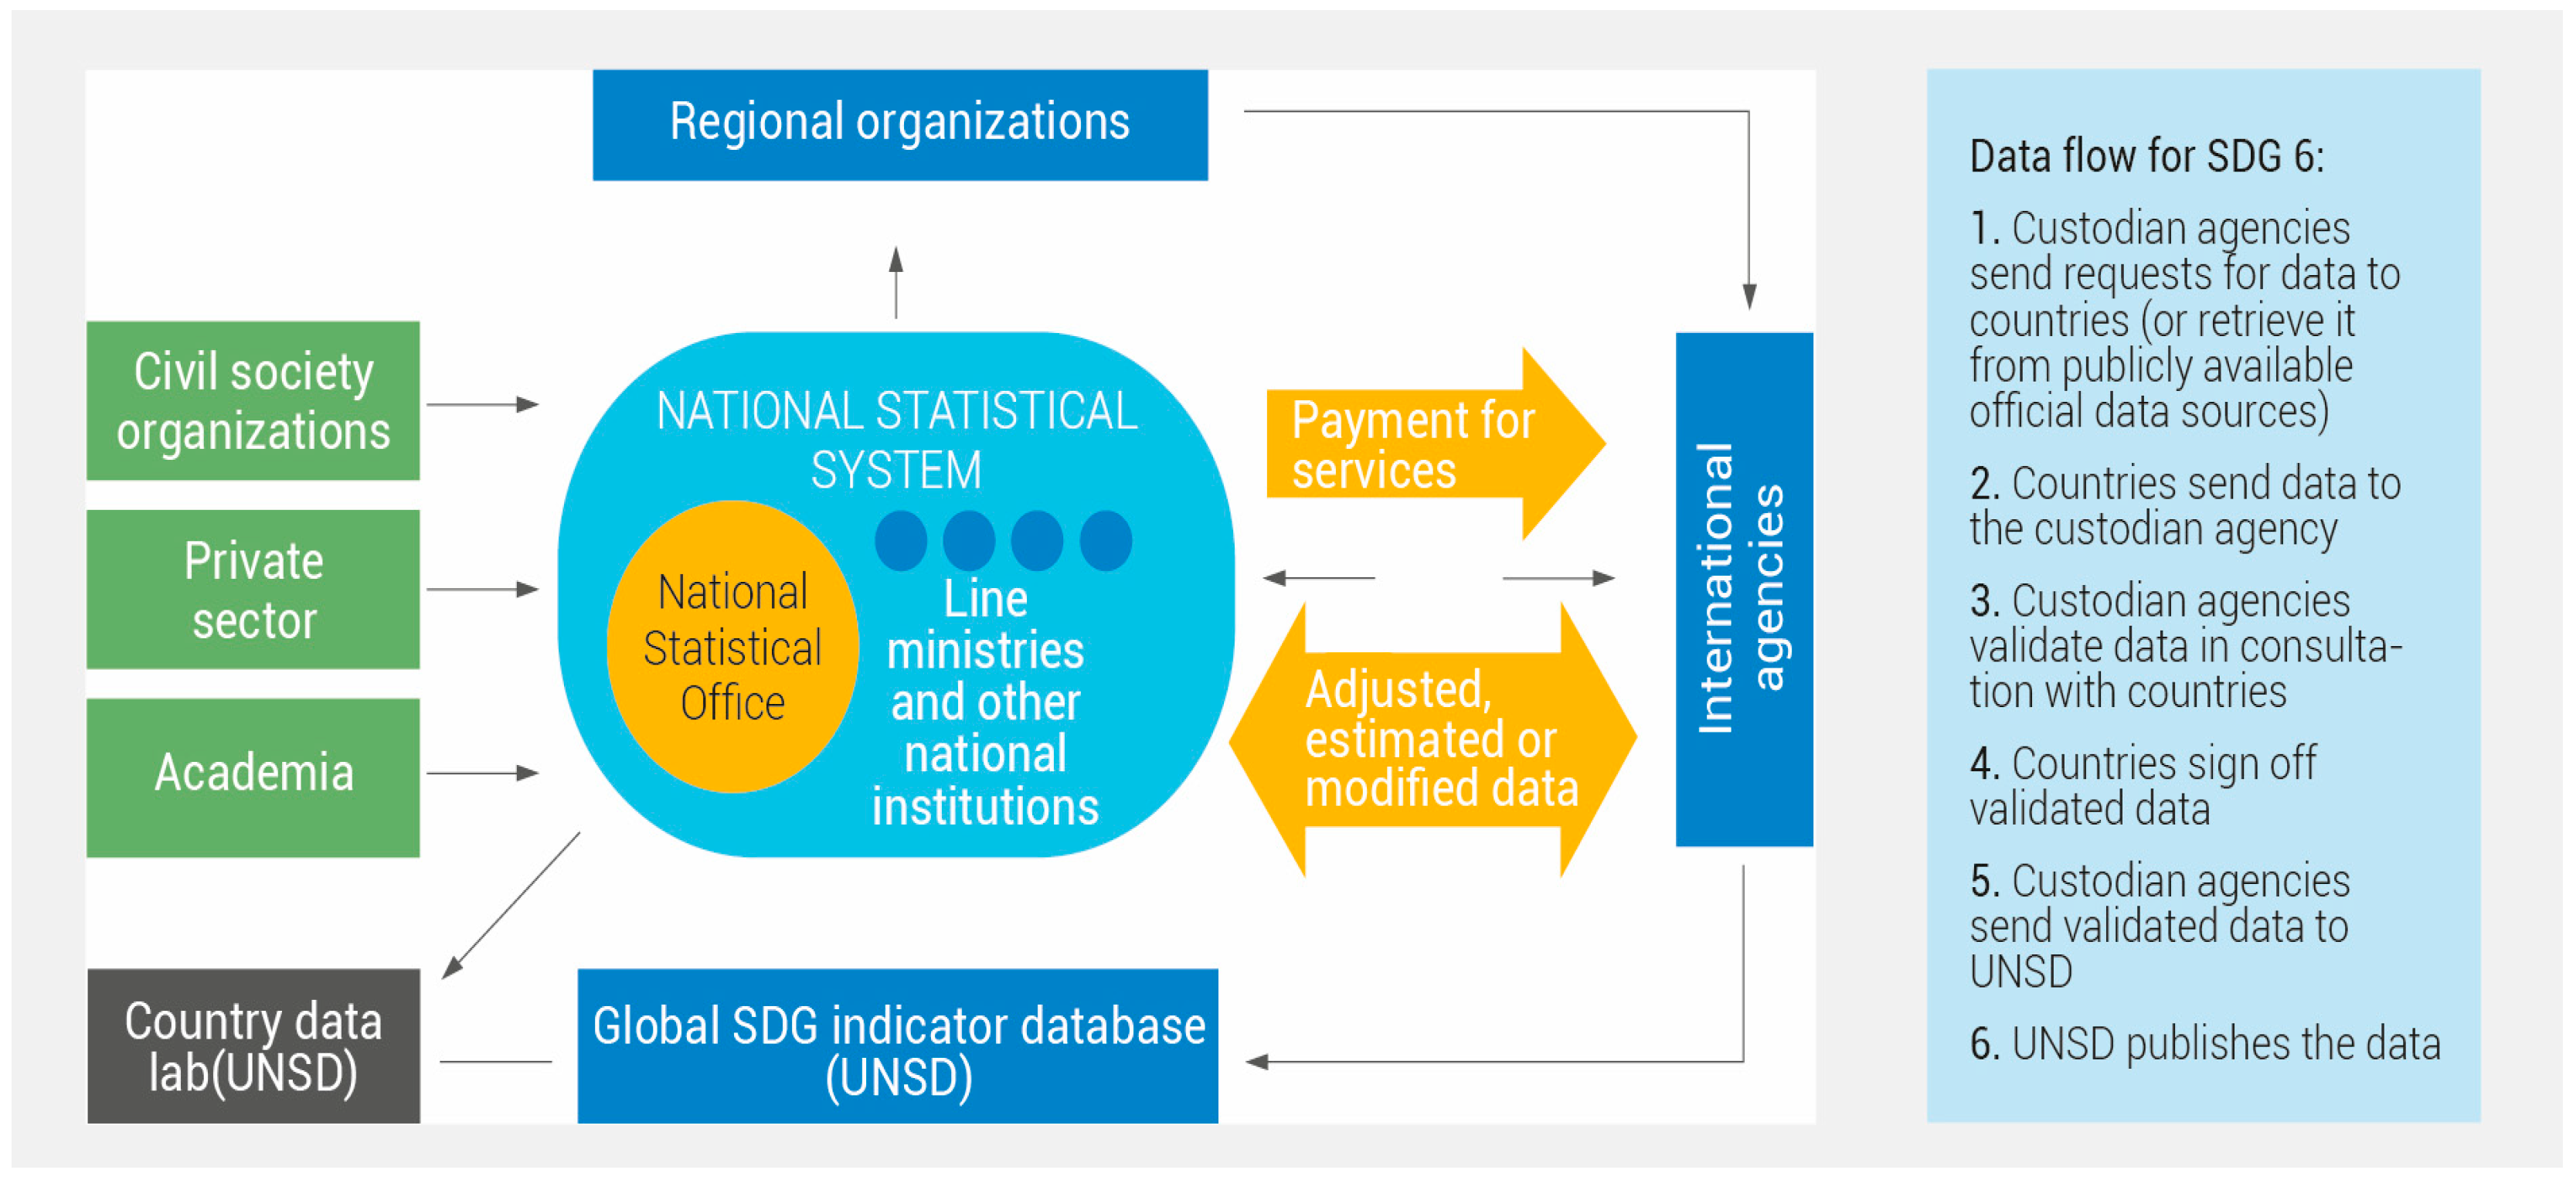
The UN suggested models for SDG 6 reporting based around national statistical systems (
Figure 4). However, there were concerns that monitoring should align with existing systems rather than impose additional monitoring burdens on Member States. Moreover, more institutional and technical capacity for monitoring was needed.
6. Capacity Development
Capacity development across the 2030 Agenda is generally covered in SDG 4 (quality education), SDG 17 (means of implementation), and SDG 6. Although Target 6.a did refer to capacity building, there is as yet no indicator to explicitly monitor it.
Capacity development in developing countries is not a new problem. It has been a leading concern and constraint on water-related development for many decades [
23,
24]. In 2002, UNDP held a High-Level Round Table on Capacity Development in Accra and highlighted concerns about capacity development and the role of technical cooperation in meeting the demand for increased capacity in many developmental sectors, not just water. UNDP [
25] defined capacity development as: “including both attainment of skills and the capabilities to use them” but the key questions posed were: “which skills and whose capabilities?” UNDP concluded that there were no easy answers because each development context was unique and continually changing. Solutions were specific to the circumstances of countries and communities, and this made capacity development such an inexact science.
The report indicated that the water sector had an acute lack of strong, formal and informal institutions and human resources to underpin good water governance. It also indicated that these deficiencies limited water-resource development and management in all its facets, across most developing countries, particularly in Sub-Saharan Africa and south and Southeast Asia [
26,
27,
28]. Indirect evidence also came from research that linked water with economic growth [
29]. This demonstrated that countries with highly variable and “difficult” hydrology (“Difficult” hydrology affects most developing countries where rainfall is seasonal and intensive with variations exceeding 40%–50% of long-term averages, and there are extremes of floods and droughts that make infrastructure more expensive. In contrast, “easy” hydrology occurs when rainfall is more reliable; it is mostly within 15%–20% of long-term averages and its intensity is modest [
29]) and low investment in water security experienced low growth. In turn, this implied not only a lack of funding but also a lack of intuitional and human capacity to absorb investment.
In the 1980s, strategic planning for human resource (HR) development (known then as manpower planning) was proposed to improve the ‘science’ of assessing the supply and demand for HR in irrigated agricultural development in sub-Saharan Africa [
30,
31]. This provided an analytical framework for assessing requirements at all levels from vocational to professional based on projected rates of irrigation development. The methodology accounted for both quantity and quality of HR, the institutional requirements, and provided numerical projections of HR needs and proposals for training. This approach may be somewhat dated, but the principles were still sound, and the approach could have strong relevance across the today’s water sector.
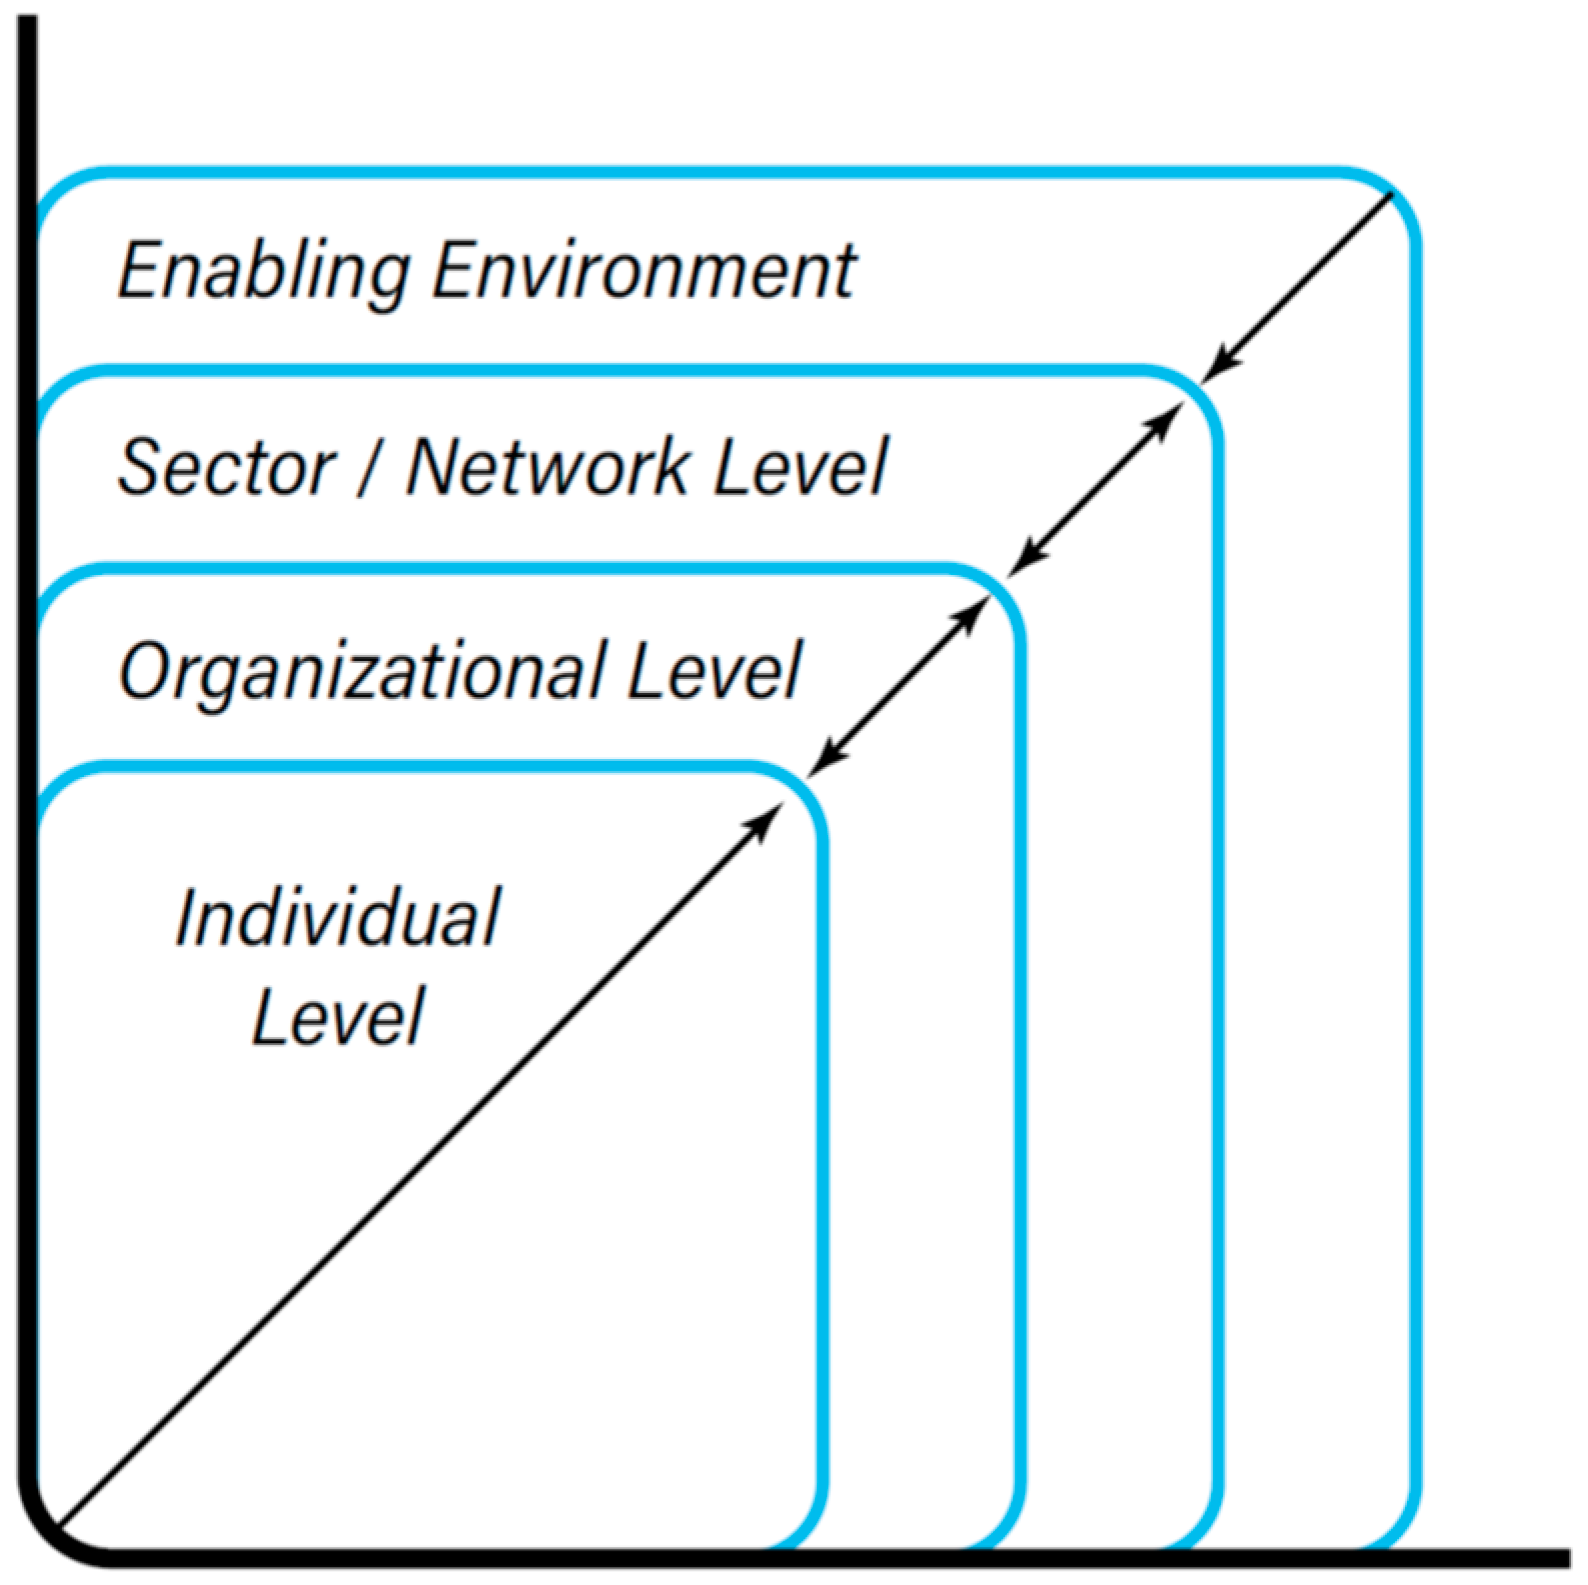
Developing capacity was reported as people-centered, but people can only function well within strong institutional structures that can only exist within a stable enabling environment (
Figure 5). Much water-related HR development has failed to deliver results because it has shied away from addressing fundamental weaknesses in organizations [
23]. Recent surveys provided evidence of shortages in human resources in the WASH sector [
32]. Nearly half of the 74 countries surveyed for a global status update in 2011 were unable to state how many staff members were working in the sector. Only one-third of 94 countries surveyed had comprehensive human-resource strategies for WASH services in urban and rural areas [
33].
HR shortages were reported in all key areas, including: agriculture and irrigated farming; water-related risk management; water and sanitation services; wastewater treatment, recycling, and reuse technologies; and desalination. Every investment in water infrastructure was at risk and may even be ineffective if not accompanied with capacity-development programs to ensure proper management and maintenance.
Across the agriculture sector, which is a key area supporting food security, nutrition, and health, skills and capabilities were lacking in irrigated farming and in water conservation for rain-fed farming [
24]. The increasing involvement of the private sector in agriculture and irrigation was creating new demands for more-responsive government agencies. Skills such as organizing stakeholders and openly providing information for activities like contracting and tendering were increasingly sought by government agencies as the role of governments changed from provider to enabler. A lack of qualified professionals and technicians weakened the institutions that provided water governance.
On the supply side of HR development, tertiary education in many developing countries often lacked experienced teachers, salaries were low, and laboratories and facilities were poor. There was over-reliance on traditional curriculum, which tended to be engineering- and science-oriented, and which did not adequately address the needs of modern water management, the environment, and the realities of local socioeconomic circumstances.
On the demand side, the water sector often lacked incentives and career structures to attract young professionals who preferred more lucrative and financially rewarding and progressive careers in the expanding private sector. One World Bank irrigation consultant, experienced in large irrigation schemes in India, suggested that irrigated agriculture in Sub-Saharan Africa was ‘too small’, meaning that it was not possible to develop exciting career pathways for young engineers to climb as was the case in India (personal communication). The sector also carried a stigma that made it difficult to attract professionals, particularly those willing to work in rural areas where risks to health were high [
28].
Education and training programs provided a foundation for building much-needed human capacity in the water and water-using sectors. Many strategies have been developed to guide educators in meeting today’s curriculum, such as the T-shaped education competency profile for water professionals [
35]. This recommended that effective water professionals should have in-depth knowledge of one discipline (vertical leg of the T) plus broader professional and personal competencies, and a basic understanding of other disciplines (horizontal bar of the T). The expertise required across the water sector at all levels of education, in numerous agencies, communities, schools and private companies, was extremely broad and complex to satisfy. Strengthening professional and technical/vocational training programs was essential for achieving SDG 6. SDG 4.c supported this by calling for “substantially increasing the supply of qualified teachers, including through international cooperation for teacher training in developing countries, especially least-developed countries and small-island developing States” by 2030.
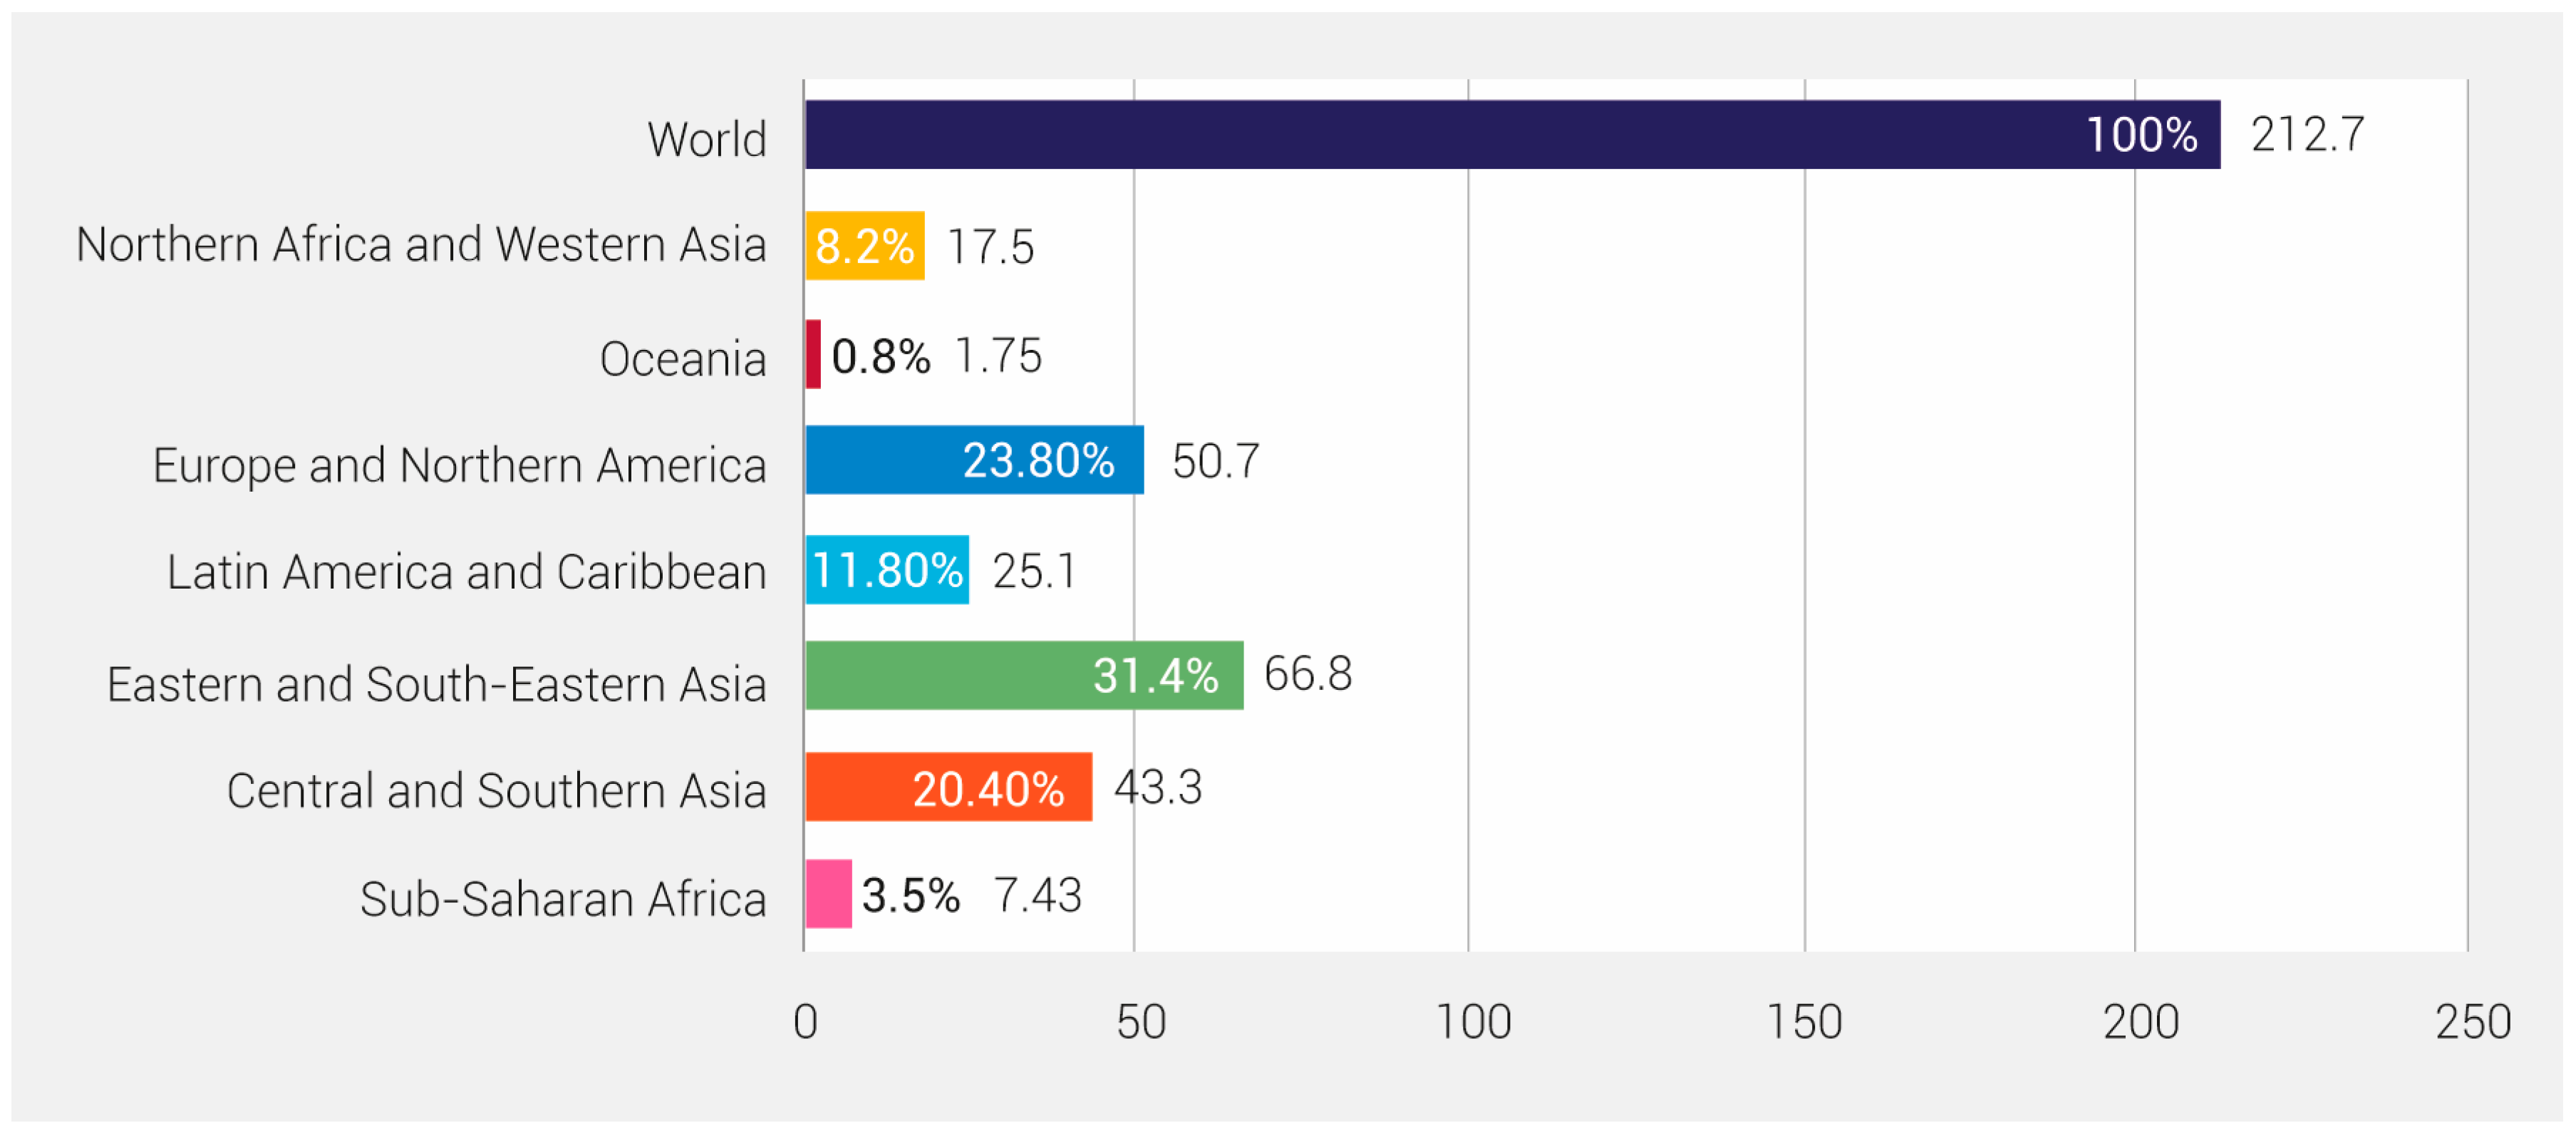
Figure 6 provides an indication of the numbers of students enrolled in tertiary education in 2015 in the various regions, though it was not disaggregated into sectors. There were notable low numbers in sub-Saharan Africa, which has a population of about 1 billion people. In 2015, however, only 3.5% of students (7.43 million) enrolled in tertiary education.
Data were scarce on national capacity-development strategies for the water sector, but some countries were reported to be producing them [
6]. However, the big challenge was implementation. Increasing vocational skills was a relatively short-term activity, but producing the professionals who could plan, manage, and lead water-sector development, and strengthen institutional capacity, would take many years. In the 1980s and 1990s, one way of filling the gap was for donor agencies to provide scholarships to send young professionals overseas to gain qualifications, skills, and experience. Opportunities now, however, are fewer as governments can no longer afford the rising costs of international education and fewer international scholarships are available.
Most countries have basic education institutional structures in place, but they too are often in need of strengthening and funding. There may be options for regional training with countries sharing facilities and costs. There was also a wealth of literature on capacity development produced by UNDP and others in the 1990s [
25], particularly using experiences gained in the health sector, though largely applicable to other aspects of development, including the water sector. There are no easy solutions to resolving this problem except for countries and their schools, colleges, training centers, and universities to plan, finance, and implement capacity-development programs that would meet the expectations of national development plans. SDG 4.4 called for “substantially increasing the number of youth and adults who have relevant skills, including technical and vocational skills for employment, decent jobs, and entrepreneurship” by 2030. However, in the past, governments and international agencies have seemed more willing to invest in ‘hard’ infrastructure rather than ‘soft’ education and capacity development, which was less visible and more difficult to measure.
7. Research into Policy and Practice
Although there was no specific research main message in the report, it was implicit that research was an essential part of development across the water sector. But how could research support SDG 6? In 2004, the UN Secretary General, speaking about research in Africa, said, “The knowledge required for Sub-Saharan Africa to achieve its own green revolution is not lacking, what is lacking as ever, is the will to turn knowledge into practice”. This statement did not question so much the quality of research in Africa; rather, it questioned the focus of research and the effectiveness of the pathway from research into policy and practice [
36].
Research undertaken by the Soil and Water Management Network (SWMnet) of the Association for Strengthening Agricultural Research in Eastern and Central Africa (ASARECA) [
37] attempted to explore the pathway from research into policy. The findings suggested that natural-resource-management researchers tended to focus on their professional interests, with less time devoted to how their work would be used in practice (
Figure 7). A linear pathway was often assumed from innovative technologies and new practices to writing papers and reports, mostly for a limited audience and not enough time or incentive was available within research projects to communicate findings to potential beneficiaries. This research encouraged ASARECA to ask more searching questions about how the research would be used in practice before they agreed to fund projects.
A study of ‘research into practice’ based on a major UK-funded natural-resource-systems research program (Natural Resources Systems Program (1995–2005) was a 10-year program of research, funded by the UK, across countries in Africa and Asia focused on improving agricultural productivity in six production systems aimed at improving natural-resource management to meet the needs of poor people and improve livelihoods.
www.webarchive.org.uk/ukwa/target/143053/source/subject) across several countries in Africa and Asia found that researchers often had a simple linear view of the relationship between research and policy [
38]. In their view, policy-makers systematically and rationally analyzed problems, defined solutions using the results of research, and then implemented them. The crucial role that politics and power play in decision-making was often ignored. The research found that technical solutions, which downplay reality on the ground, institutional change, and politics, reduced the chances of good research having propoor impact on society.
Harrison [
38] recommended that positive impact was more likely when research was development-oriented towards national priorities, when there were close relations between natural and social scientists, and when researchers were more visible and engaged directly in the processes they sought to influence through networking and supporting policy-makers. The role of trusted individuals, researchers who would ‘champion’ their work, was also considered crucial in catalyzing institutional change [
37]. Timing, continuity, and commitment were also considered to be important factors as researchers and local partners took ownership of their work and research-funding bodies made long-term commitments. A 13-year program of rainwater-harvesting research in Tanzania, followed by socioeconomic surveys to assess the benefits that accrued to rural communities, resulted in rainwater harvesting being adopted in the country’s National Water Policy in 2002 and widely promoted in rural areas [
37].
8. Concluding Remarks
This paper looked at the SDG 6 Synthesis Report 2018 on Water and Sanitation from the perspective of those involved in education, training, and research, and asked the question how they might contribute to enabling and accelerating progress towards achieving SDG 6. Three important areas where identified, namely, data acquisition, capacity development, and research into practice. The agreement among Member States to implement SDG 6 was a timely catalyst for those in natural-resource research and education to engage with governments and national development programs in all three areas. Governments will require support from the science community to achieved and monitor SDGs. This opens new challenges for research, partnerships, and opportunities to find solutions to complex development challenges [
39].
Data are the ‘stock-in-trade’ for researchers who are no doubt aware of the major deficiencies in water data and data collection, particularly in developing countries. Researchers have valuable skills and experience in acquiring and analyzing data, they understand their importance in developing sound evidence-based policy and decision-making and are well-placed to support government and private-sector initiatives. Few governments have the resources, time, and possibly the inclination to reinstate lost data-collection systems, such as metrological stations. If it were not possible to go back to established technologies, the report suggested governments should look forward to smart technologies, such as Earth observations and citizen science for data collection, and efficient tools for (big) data analysis and integration. The private sector is also more conscious of data and monitoring as they embrace water stewardship to secure their supply chains and markets. Researchers are well-placed to support all these initiatives.
Researchers can also play a key role in developing national indicators that better reflect local circumstances as well as support the SDG global indicators. The SDG targets, although global in nature, are expected to take account of different national realities (socioeconomic and environmental), capacities, and levels of development, and respect national policies and priorities. Adapting and adding local indicators that do not increase the demand on services that are already burdened with need careful thought.
The report also recognized the immense need for human capacity at all levels across the water and water-using sectors. In most developing countries, there is a major role for those in education and training to help develop the human capacity that countries need to plan and manage their limited water resources in the face of growing demands for water and its services. There are no easy solutions to this long-standing challenge, and there is inertia across the education sector in many developing countries that will need to be overcome. Educators are well-placed to help nations to find ways of developing capacity in challenging situations where funding is limited and the value of investing in people is discussed and appreciated, but there is too little action in practice. Short-term fixes are often only possible at vocational and technician levels. However, as the report suggests, short-term thinking must not be at the expense of long-term initiatives that will produce the experienced cadre of future water engineers, scientists, and managers that many countries so desperately need.
Development needs to be based on good science, so researchers should continue to engage with decision-makers if their research is to influence policy and practice and benefit poor and vulnerable people. Creating integrated research teams, including social and natural scientists that interact continuously with stakeholders (transdisciplinary research approach), could significantly improve the chances of research reaching the main beneficiaries. Such cooperation would complement those aspirations for integration expressed in the 2030 Agenda.


