Trends, Variability, and Seasonality of Maximum Annual Daily Precipitation in the Upper Vistula Basin, Poland


Abstract
1. Introduction
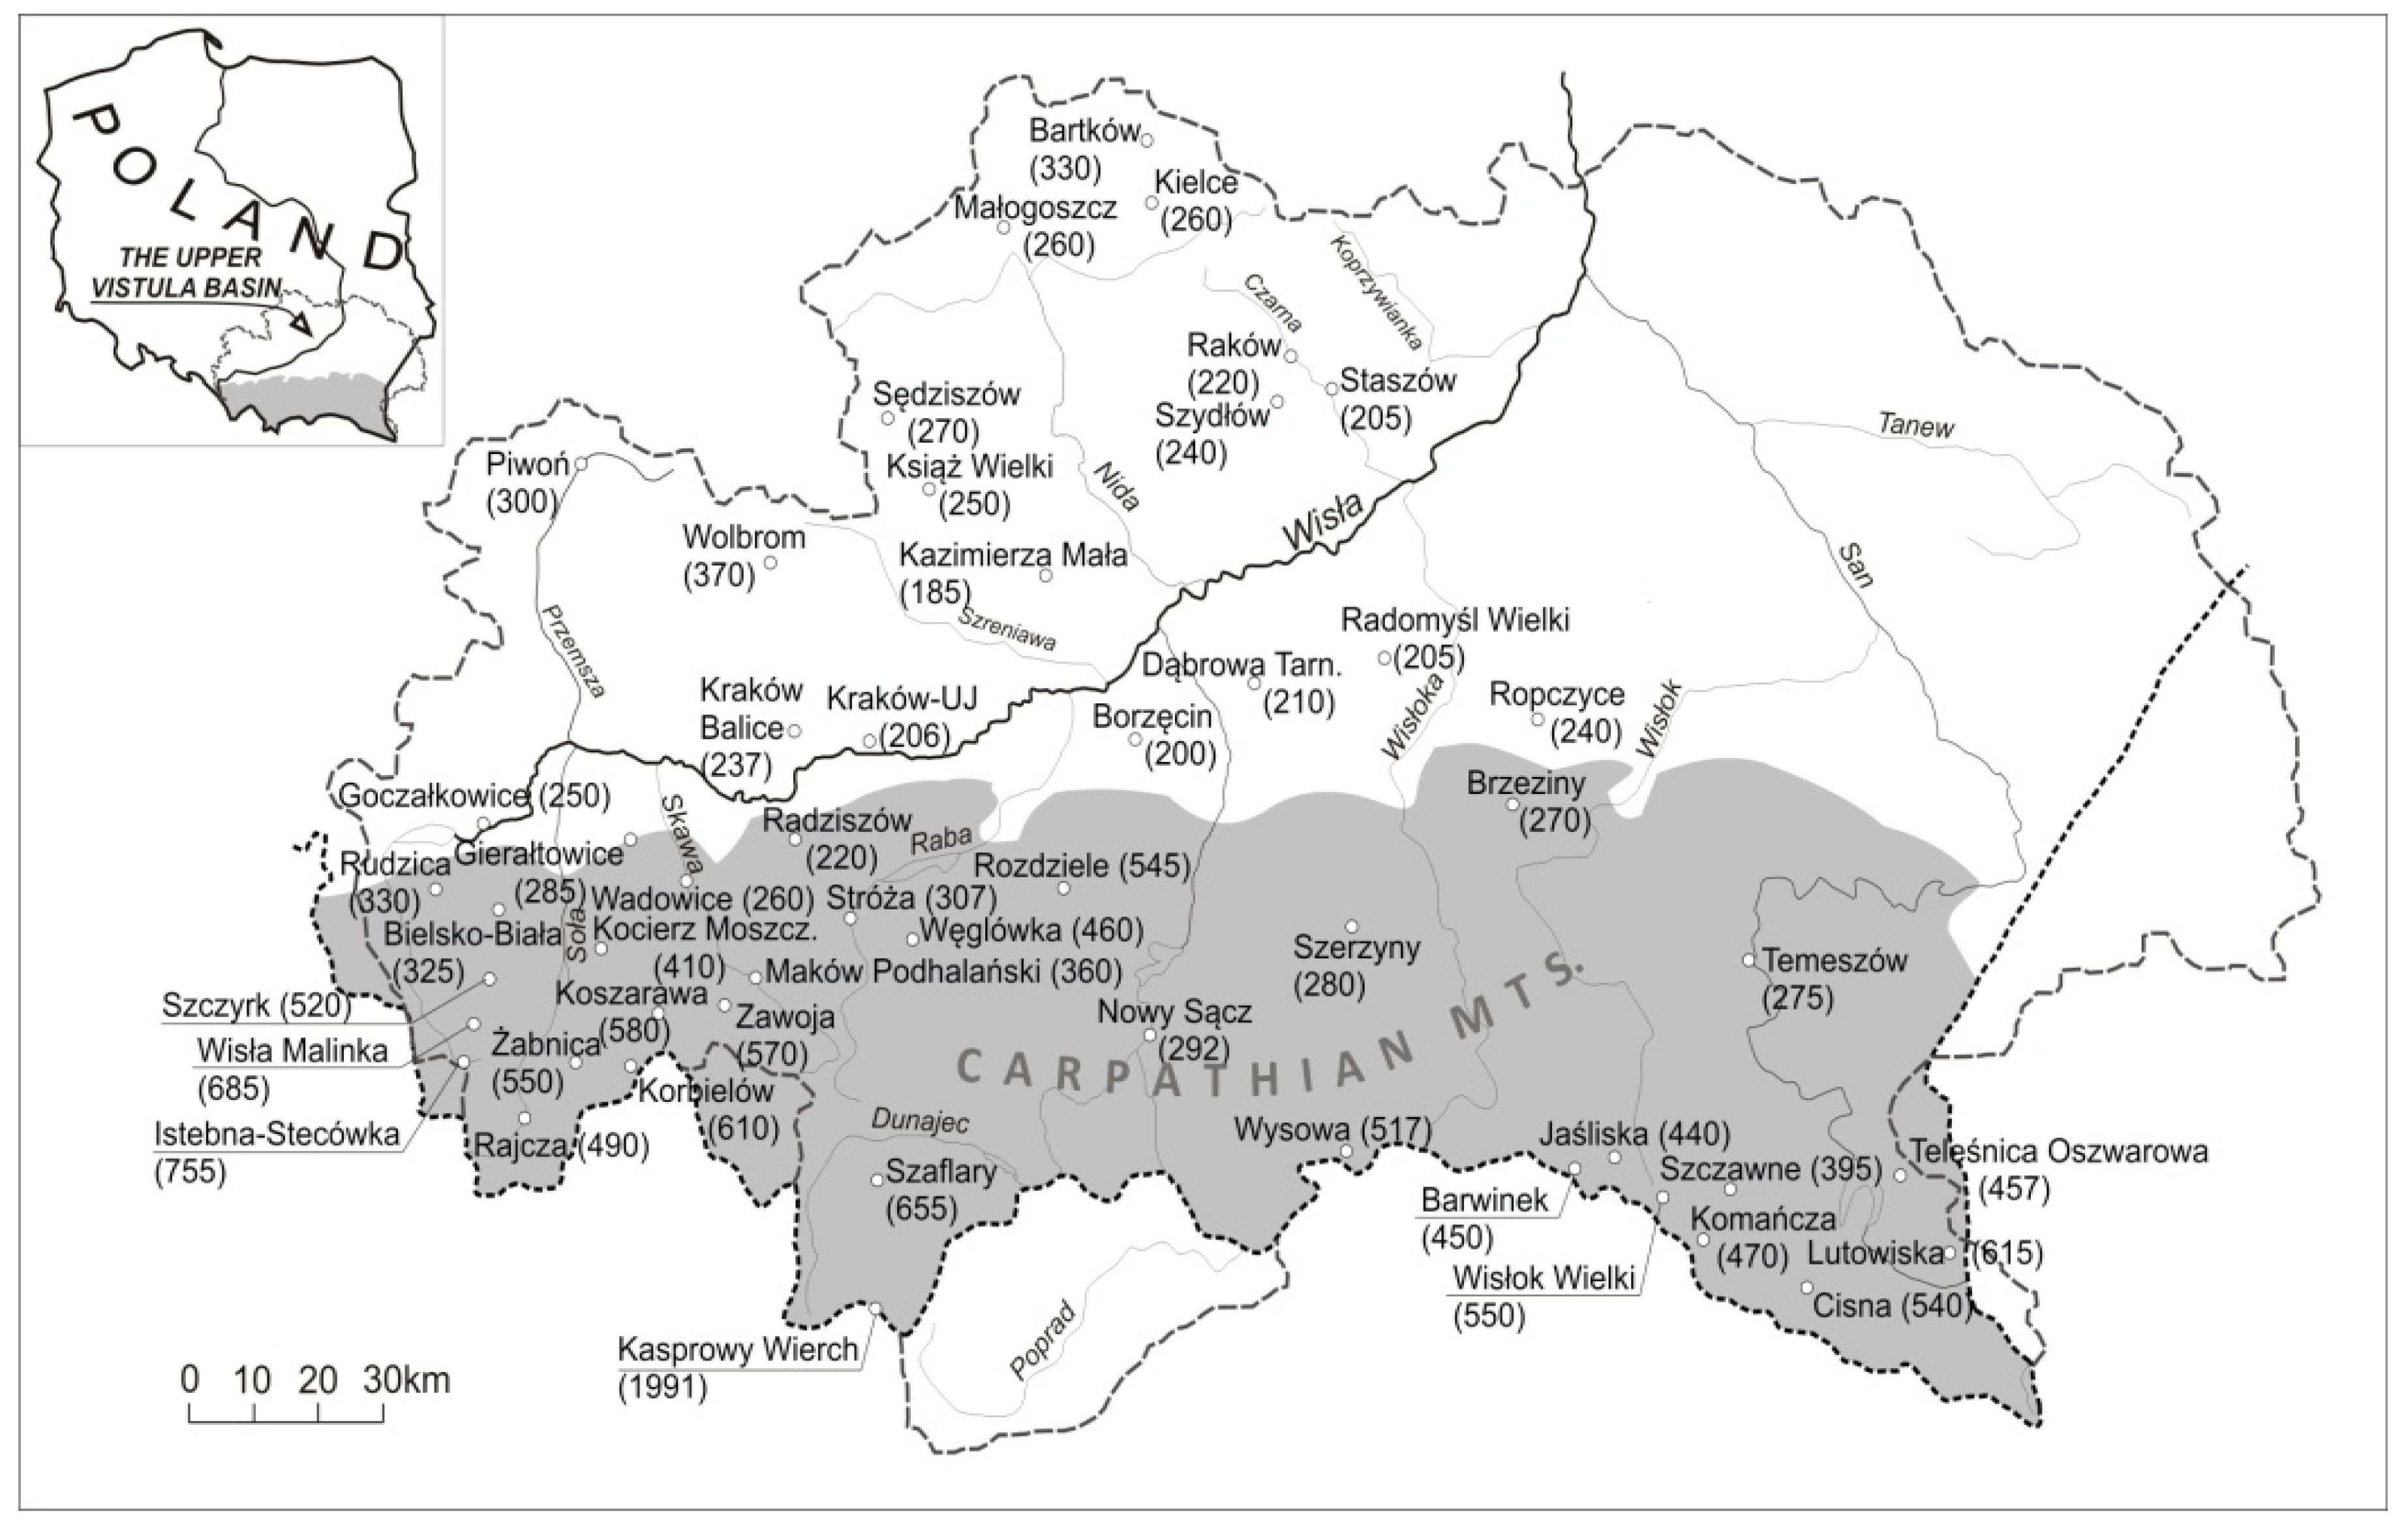
2. Data and Methods
2.1. Significance Verification of the Trend for the Highest Daily Total Precipitation
2.2. Analysis of Weather Conditions’ Impact on the Occurrence of the Highest Daily Precipitation
2.3. Seasonality Analysis of the Occurrence of the Annual Maximum Daily Precipitation
3. Results and Discussion
3.1. Significant Verification of the Trend for the Annual Maximum Daily Precipitation
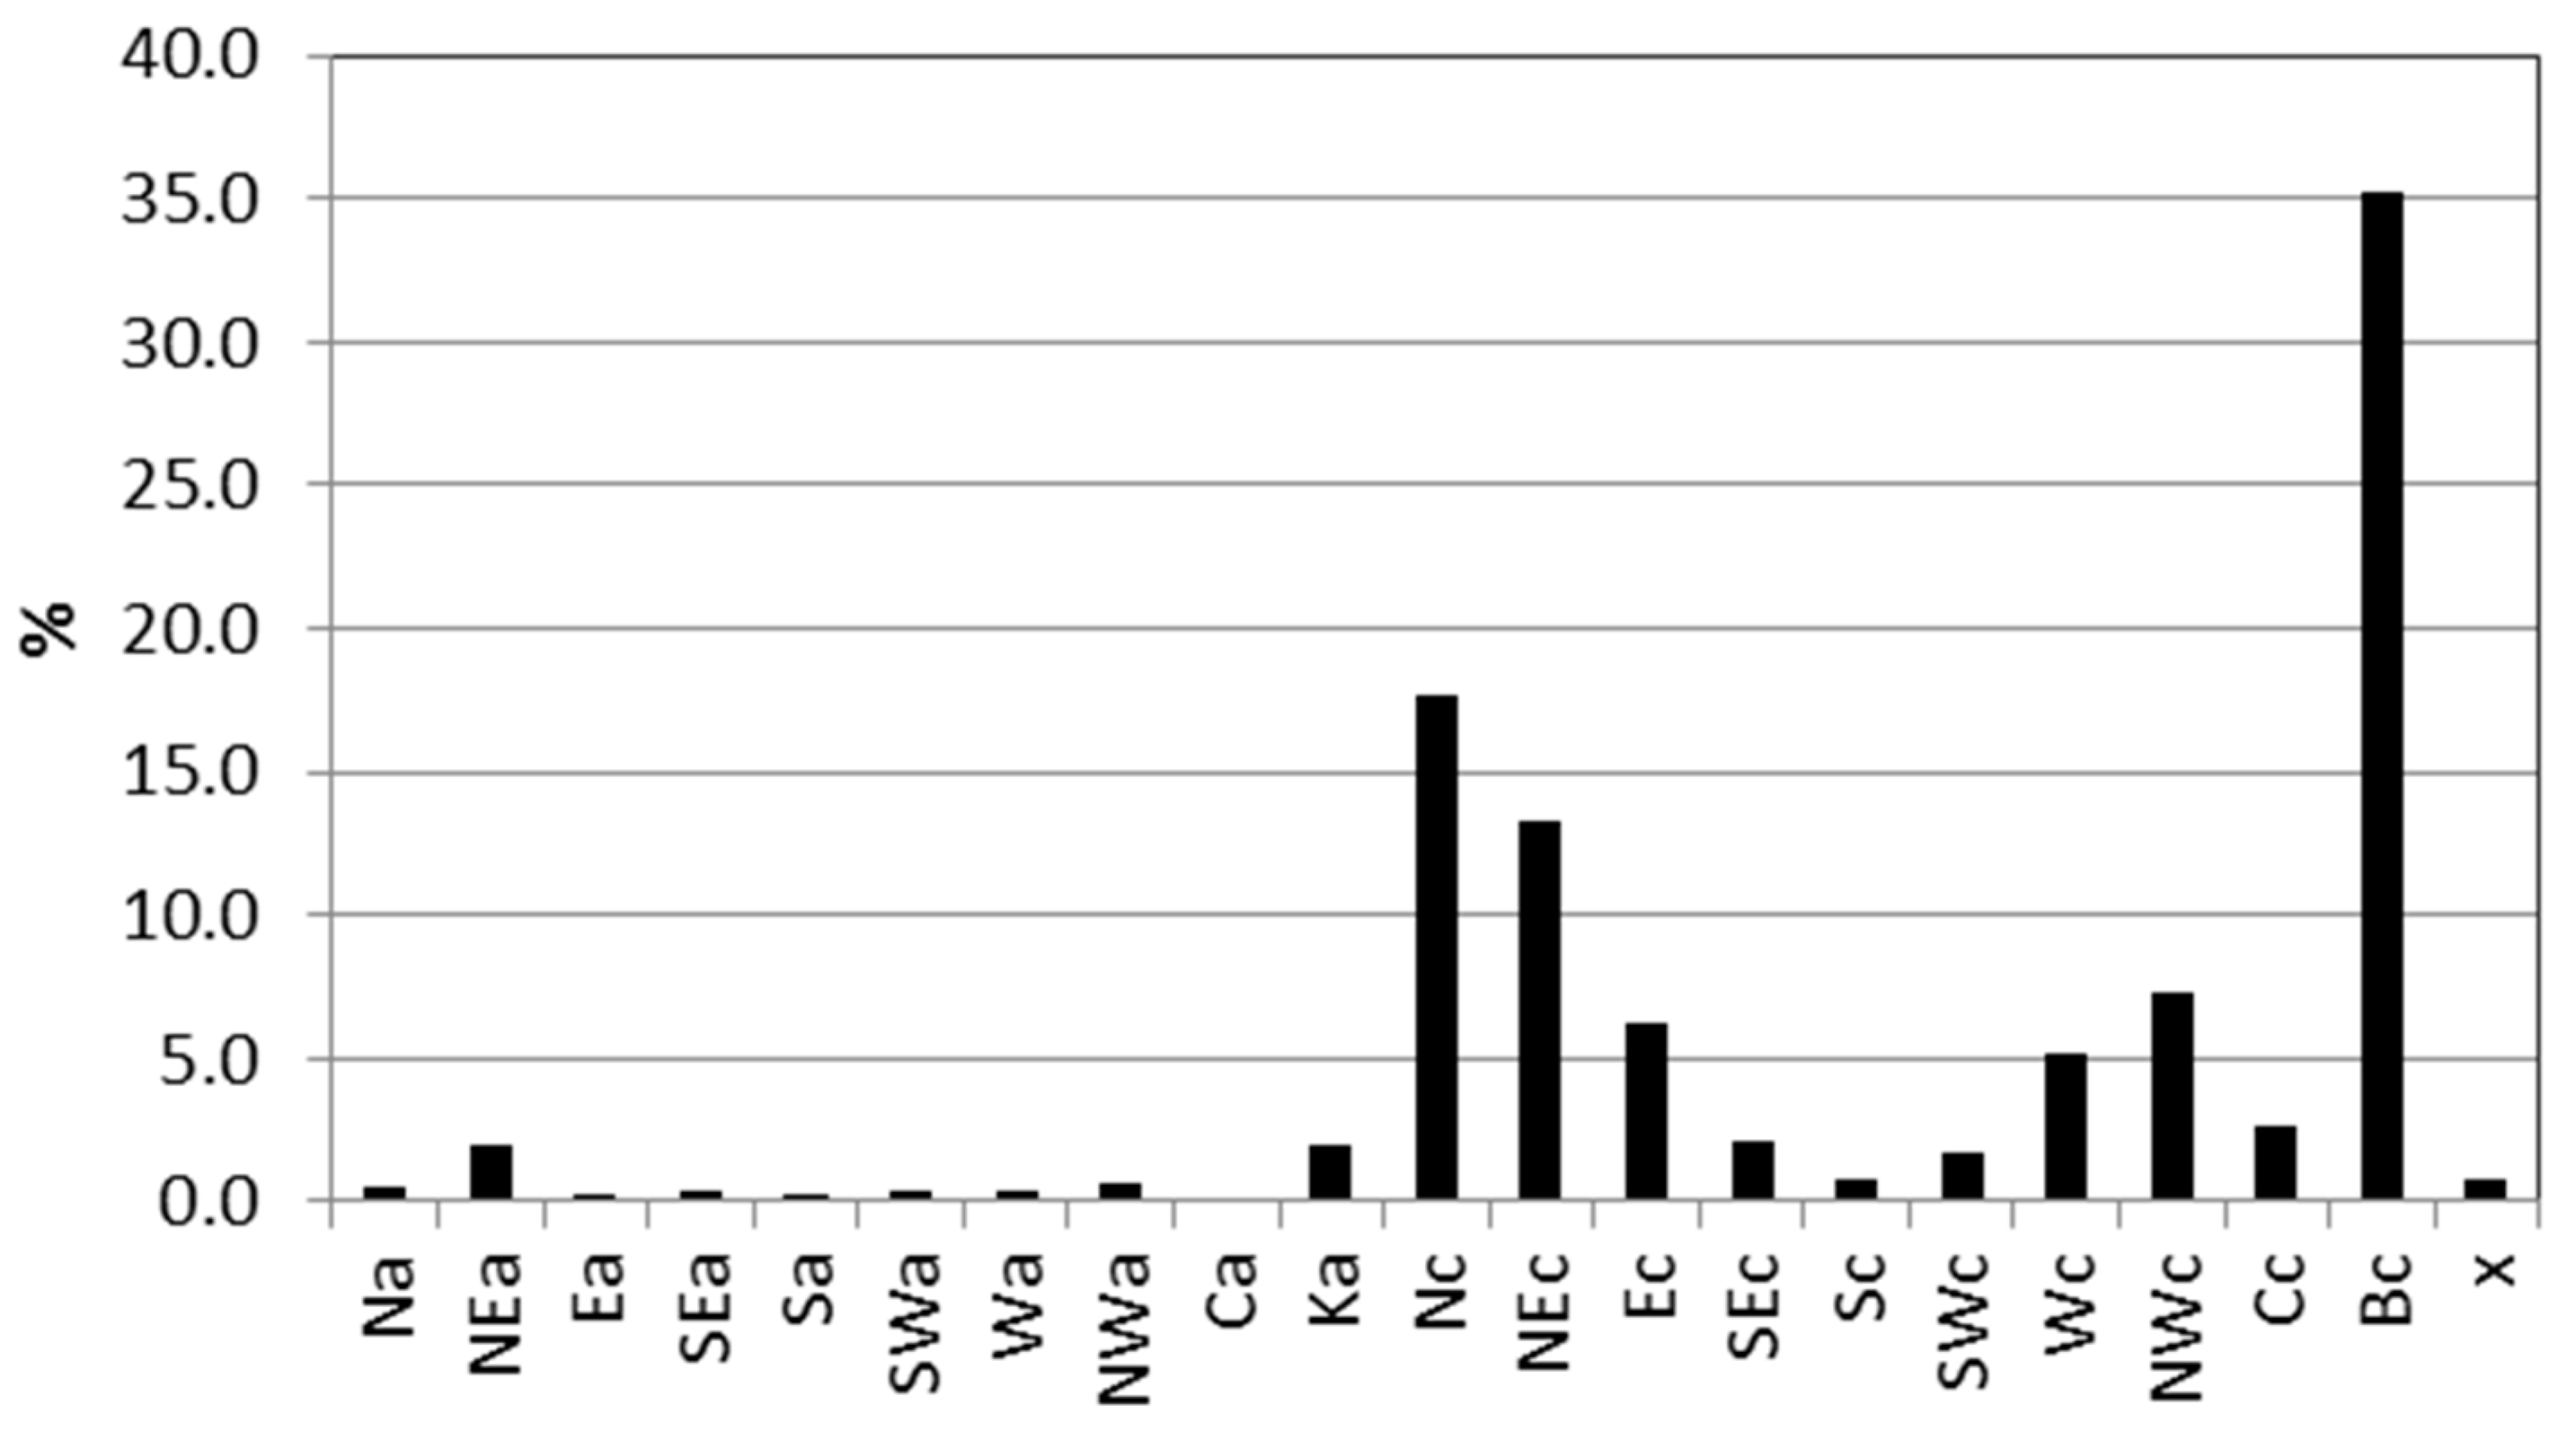
3.2. Analysis of Weather Conditions Impact on the Occurrence of the Highest Daily Precipitation
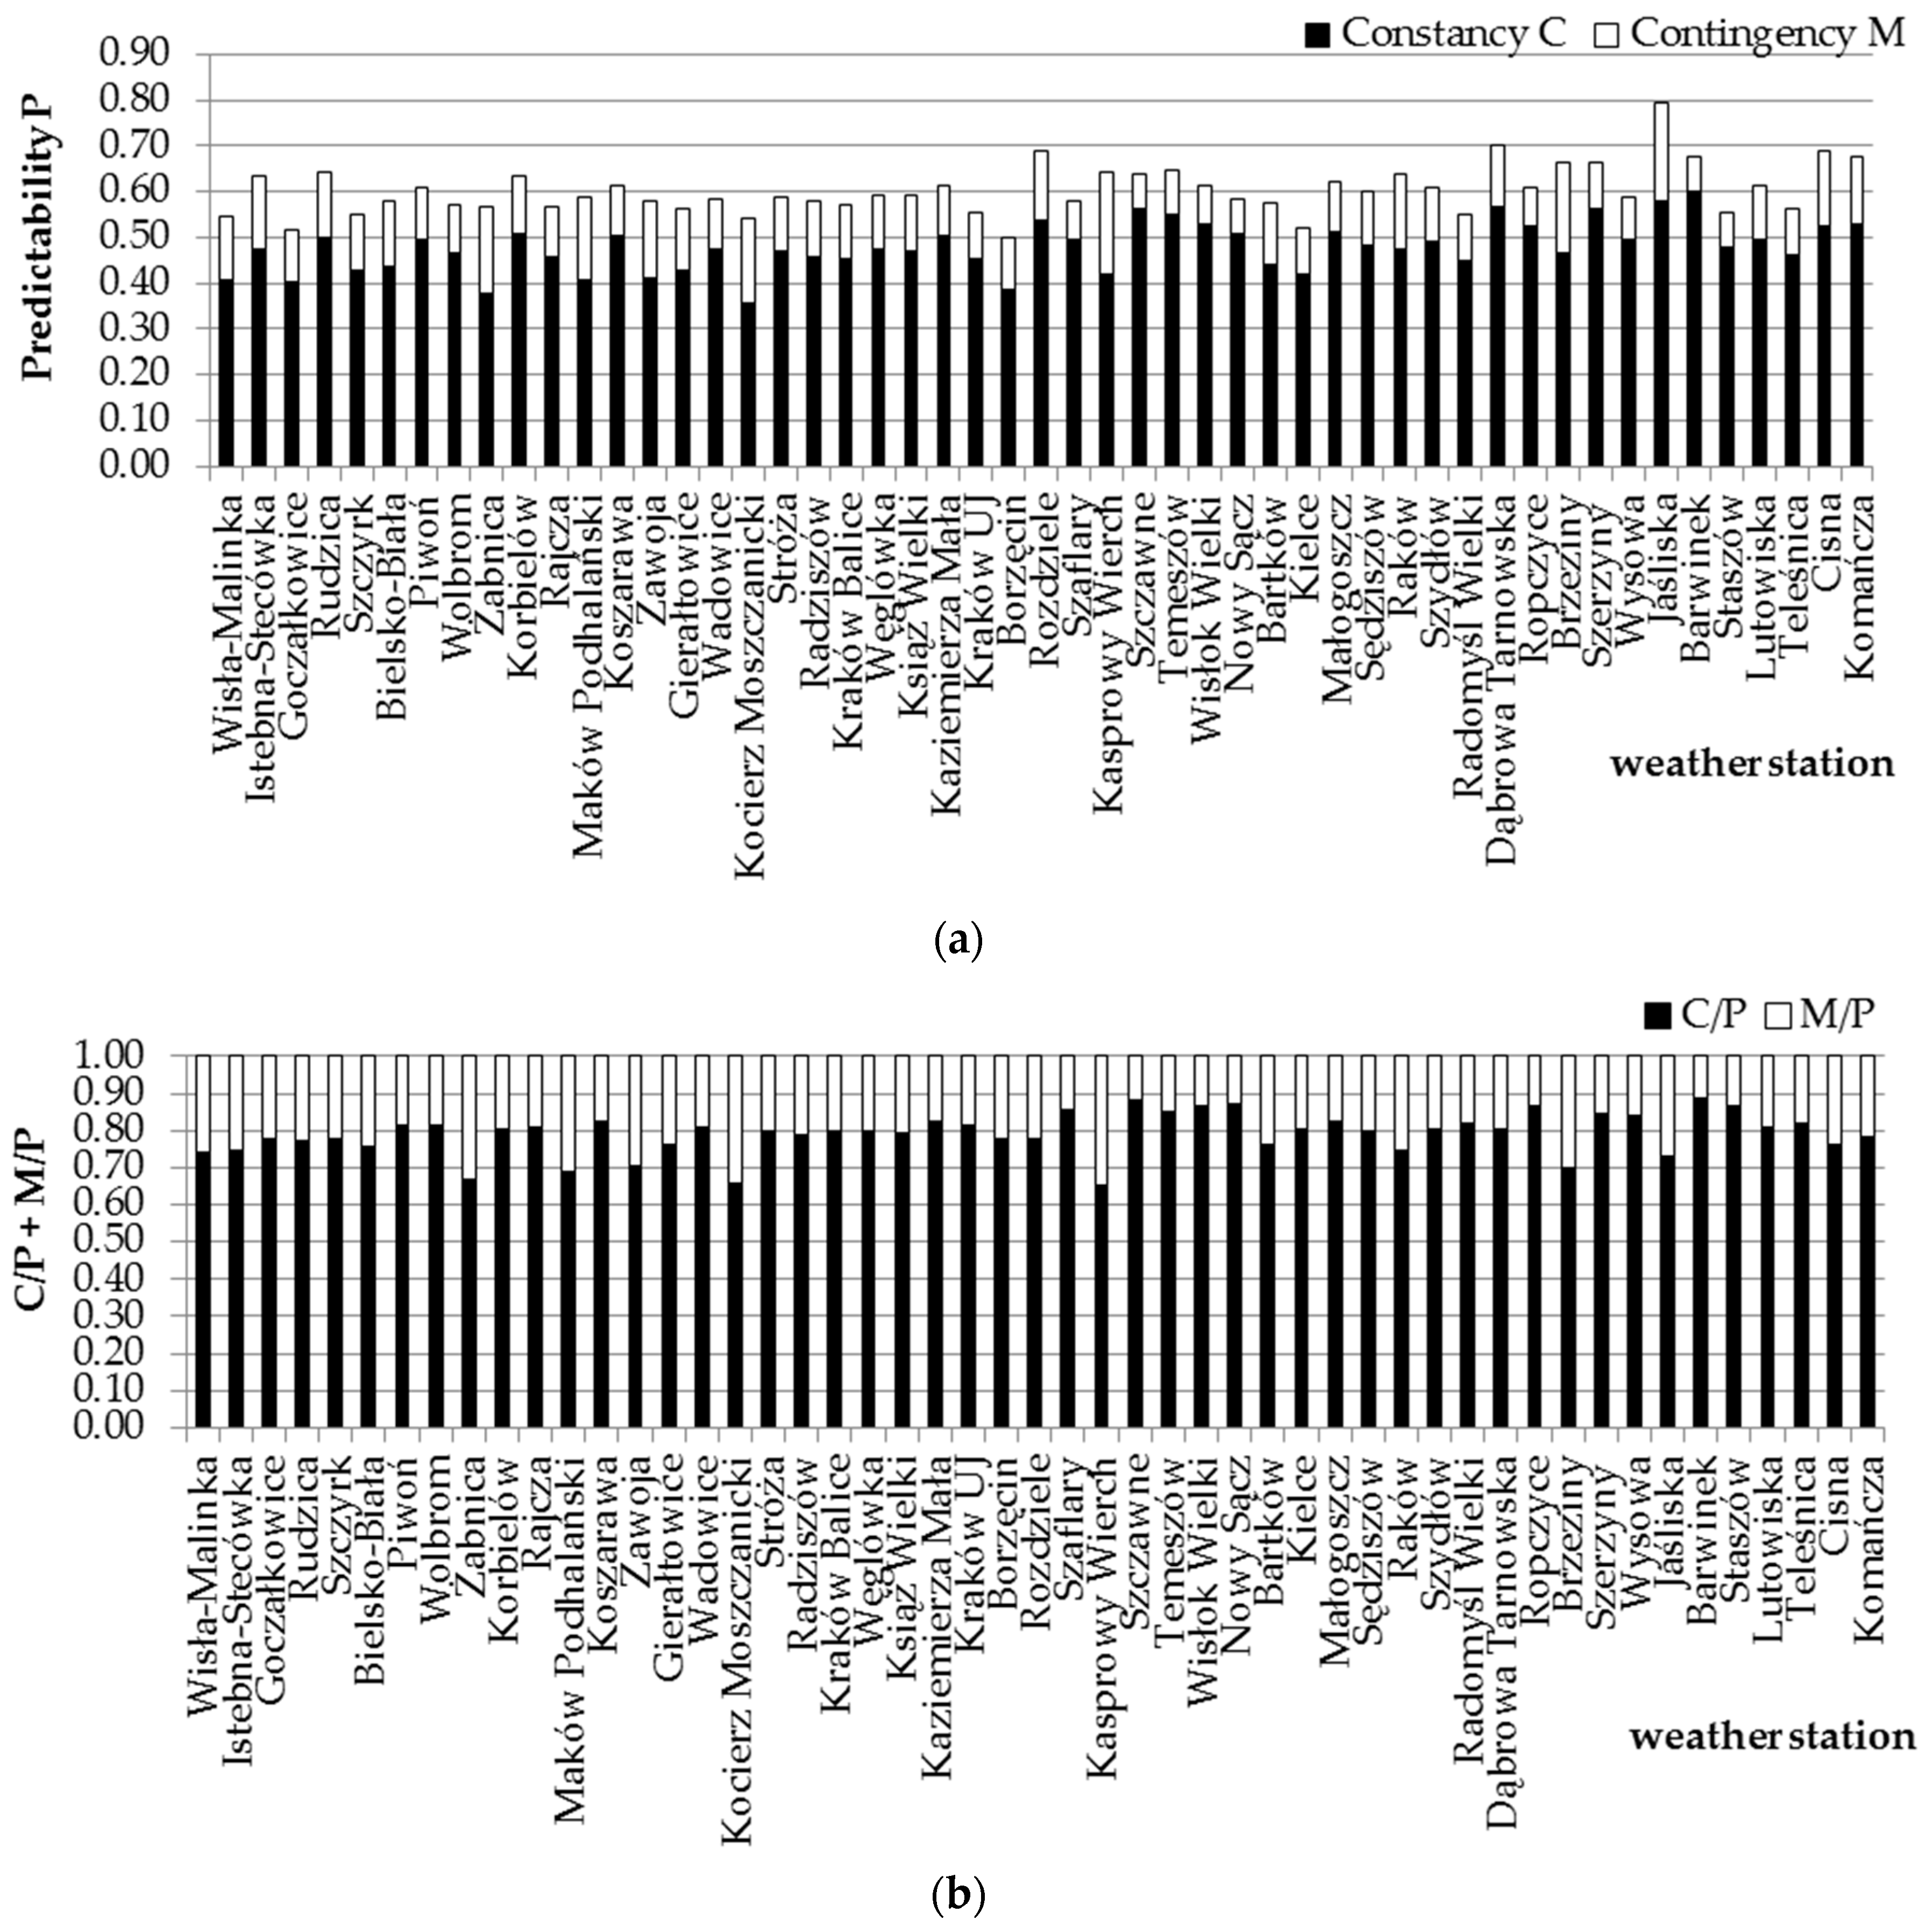
3.3. Seasonality Analysis of the Occurrence of the Annual Maximum Daily Precipitation
4. Conclusions
Author Contributions
Funding
Acknowledgments
Conflicts of Interest
References
- Alpert, P.; Ben-Gai, T.; Baharad, A.; Benjamini, Y.; Yekutieli, D.; Colacino, M.; Diodato, L.; Ramis, C.; Homar, V.; Romero, R.; et al. The paradoxical increase of Mediterranean extreme daily rainfall in spite of decrease in total values. Geophys. Res. Lett. 2002, 29, 1–4. [Google Scholar] [CrossRef]
- Diaz, H.F.; Wahl, E.R. Recent California Water Year Precipitation Deficits: A 440-Year Perspective. J. Clim. 2015, 28, 4637–4652. [Google Scholar] [CrossRef]
- O’Gorman, P.A. Precipitation Extremes under Climate Change. Curr. Clim. Chang. Rep. 2015, 1, 49–59. [Google Scholar] [CrossRef] [PubMed]
- Kaczor, G.; Chmielowski, K.; Bugajski, P. The effect of total annual precipitation on the volume of accidental water entering sanitary sewage system. Annu. Set Environ. Prot. 2017, 19, 668–681. [Google Scholar]
- Longobardi, A.; Villani, P. Trend analysis of annual and seasonal rainfall time series in the Mediterranean area. Int. J. Climatol. 2010, 30, 1538–1546. [Google Scholar] [CrossRef]
- Bodini, A.; Cossu, Q.A. Vulnerability assessment of Central-East Sardinia (Italy) to extreme rainfall events. Nat. Hazards Earth Syst. Sci. 2010, 10, 61–72. [Google Scholar] [CrossRef]
- Nastos, P.T. Trends and variability of precipitation within the Mediterranean region, based on Global Precipitation Climatology Project (GPCP) and ground based datasets. In Advances in the Research of Aquatic Environment; Lambrakis, N., Stournaras, G., Katsanou, K., Eds.; Springer: Berlin/Heidelberg, Germany, 2011; ISBN 978-3-642-19902-8. [Google Scholar]
- Willems, P.; Arnbjerg-Nielsen, K.; Olsson, J.; Nguyen, V.T.V. Climate change impact assessment on urban rainfall extremes and urban drainage: Methods and shortcomings. Atmos. Res. 2012, 103, 106–118. [Google Scholar] [CrossRef]
- Carvalho, J.R.P.; Assad, E.D.; Oliveira, A.F.; Pinto, H.S. Annual maximum daily rainfall trends in the Midwest, southeast and southern Brazil in the last 71 years. Weather Clim. Extrem. 2014, 5–6, 7–15. [Google Scholar] [CrossRef]
- Halmstad, A.; Najafi, M.R.; Moradkhani, H. Analysis of precipitation extremes with the assessment of regional climate models over the Willamette River Basin-U.S. Hydrol. Process. 2012, 27, 2579–2590. [Google Scholar] [CrossRef]
- Donat, M.; Alexander, L.; Yang, H.; Durre, I.; Vose, R.; Dunn, R.; Willett, K.; Aguilar, E.; Brunet, M.; Caesar, J.; et al. Updated analyses of temperature and precipitation extreme indices since the beginning of the twentieth century: The HadEX2 dataset. J. Geophys. Res. 2013, 118, 2098–2118. [Google Scholar] [CrossRef]
- Westra, S. Global increasing trends in annual maximum daily precipitation. J. Clim. 2013, 26, 3904–3918. [Google Scholar] [CrossRef]
- Greve, P.; Orlowsky, B.; Mueller, B.; Sheffield, J.; Reichstein, M.; Seneviratne, S.I. Global assessment of trends in wetting and drying over land. Nat. Geosci. 2014, 7, 716–721. [Google Scholar] [CrossRef]
- Fischer, E.M.; Knutti, R. Anthropogenic contribution to global occurrence of heavy-precipitation and high-temperature extremes. Nat. Clim. Chang. 2015, 5, 560–564. [Google Scholar] [CrossRef]
- Zahiri, E.P.; Bamba, I.; Famien, A.M.; Koffi, A.K.; Ochou, A.D. Mesoscale extreme rainfall events in West Africa. The cases of Niamey (Niger) and the Upper Ouémé Valley (Benin). Weather Clim. Extrem. 2016, 13, 15–34. [Google Scholar] [CrossRef]
- Irannezhad, M.; Martilla, H.; Chen, D.; Kløve, B. Century-long variability and trends in daily precipitation characteristics at three Finnish stations. Adv. Clim. Chang. Res. 2016, 7, 54–69. [Google Scholar] [CrossRef]
- Rana, A.; Moradkhani, H. Spatial, temporal and frequency based climate change assessment in Columbia River Basin using multi downscaled-scenarios. Clim. Dyn. 2016, 47, 579–600. [Google Scholar] [CrossRef]
- Jakob, D.; Walland, D. Variability and long-term change in Australian temperature and precipitation extremes. Weather Clim. Extrem. 2016, 14, 36–55. [Google Scholar] [CrossRef]
- Soro, G.E.; Noufé, D.E.; Goula Bi, T.A.; Shorohou, B. Trend analysis for extreme rainfall at sub-daily and daily timescales in Côte d’Ivoire. Climate 2016, 4, 37–51. [Google Scholar] [CrossRef]
- Agilan, V.; Umamahesh, N.V. Modelling nonlinear trend for developing non-stationary rainfall intensity–duration–frequency curve. Int. J. Climatol. 2017, 37, 1265–1281. [Google Scholar] [CrossRef]
- Madsen, H.; Lawrance, D.; Lang, M.; Martinkova, M.; Kjeldsen, T.R. Review of trend analysis and climate change projections of extreme precipitation and floods in Europe. J. Hydrol. 2014, 519, 3634–3650. [Google Scholar] [CrossRef]
- Villarini, G.; Smith, J.A.; Serinaldi, F.; Ntelekos, A. Analyses of seasonal and annual maximum daily discharge records for central Europe. J. Hydrol. 2011, 399, 299–312. [Google Scholar] [CrossRef]
- Perez, E.C.; Stephens, E.; Bischiniotis, K.; Aalst, M.; Hurk, B.; Mason, S.; Nissan, H.; Pappenberger, F. Should seasonal rainfall forecasts be used for flood preparedness? Hydrol. Earth Syst. Sci. 2015, 21, 4517–4524. [Google Scholar] [CrossRef]
- Gaudry, M.M.C.; Gutknecht, D.; Parajka, J.; Perdigão, R.A.P.; Blöschl, G. Seasonality of runoff and precipitation regimes along transects in Peru and Austria. J. Hydrol. Hydromech. 2017, 65, 347–358. [Google Scholar] [CrossRef]
- Hasan, G.M.J.; Chowdhury, M.A.I.; Ahmed, S. Analysis of the statistical behavior of daily maximum and monthly average rainfall along with rainy days variation in Sylhet, Bangladesh. J. Eng. Sci. Technol. 2014, 9, 559–578. [Google Scholar]
- Borwein, J.; Howlett, P.; Piantadosi, J. Modelling and simulation of seasonal rainfall using the principle of maximum entropy. Entropy 2014, 16, 747–769. [Google Scholar] [CrossRef]
- Skowera, B.; Kopcińska, J.; Ziernicka-Wojtaszek, A.; Wojkowski, J. Precipitation deficiencies and excesses during the growing season of late potato in the opolskie voivodship (1981–2010). Acta Sci. Pol. Form. Circumiectus 2016, 15, 137–149. [Google Scholar] [CrossRef]
- Twardosz, R.; Niedźwiedź, T.; Łupikasza, E. The influence of atmospheric circulation on thetype of precipitation (Krakow, southern Poland). Theor. Appl. Climatol. 2011, 104, 233–250. [Google Scholar] [CrossRef]
- Kundzewicz, Z.W.; Stoffel, M.; Niedźwiedź, T.; Wyżga, B. Flood Risk in the Upper Vistula Basin; Springer: Basel, Switzerland, 2016; ISBN 978-3-319-41923-7. [Google Scholar]
- Rutkowska, A.; Ptak, M. On certain stationary tests for hydrological series. Stud. Geotech. Mech. 2012, 4, 51–63. [Google Scholar] [CrossRef]
- Banasik, K.; Hejduk, L. Long term changes in runoff from a small agricultural catchment. Soil Water Res. 2012, 7, 64–72. [Google Scholar] [CrossRef]
- Jeneiová, K.; Kohnová, S.; Sabo, M. Detecting trends in the annual maximum discharges in the Vah River Basin, Slovakia. Acta Silv. Lign. Hung. 2014, 10, 133–144. [Google Scholar] [CrossRef]
- Blain, G.C. The influence of nonlinear trends on the power of the trend-free pre-whitening approach. Acta Sci. Agron. 2015, 37, 21–28. [Google Scholar] [CrossRef]
- Niedźwiedź, T. Synoptic Situations and Their Impact on the Spatial Diversity of Selected Climate Elements in the Upper Vistula Basin; Rozprawy habilitacyjne UJ: Kraków, Poland, 1981. (In Polish) [Google Scholar]
- Niedźwiedź, T. Calendar of Circulation Types for Southern Poland; Uniwersytet Śląski, Katedra Klimatologii: Sosnowiec, Poland, 2015. (In Polish) [Google Scholar]
- Twardosz, R. The Synoptic and Probabilistic Aspects of Diurnal Precipitation Variation in Cracow (1886–2002); Institute of Geography and Spatial Management of Jagiellonian University: Kraków, Poland, 2005. [Google Scholar]
- Jiang, M.; Felzer, B.S.; Sahagian, D. Predictability of precipitation over the Conterminous U.S. based on the CMIP5 multi-model ensemble. Sci. Rep. 2016, 6, 1–9. [Google Scholar] [CrossRef] [PubMed][Green Version]
- Wałęga, A.; Młyński, D. Seasonality of median monthly discharge in selected Carpathian rivers of the upper Vistula basin. Carpath. J. Earth Environ. 2017, 12, 617–628. [Google Scholar]
- Colwell, R.K. Predictability, constancy, and contingency of periodic phenomena. Ecology 1974, 55, 1148–1153. [Google Scholar] [CrossRef]
- Kennard, M.J.; Pusey, B.J.; Olden, J.D.; Mackay, S.J. Classification of natural flow regimes in Australia to support environmental flow management. Freshw. Biol. 2010, 55, 171–193. [Google Scholar] [CrossRef]
- Cebulska, M.; Twardosz, R. Temporal variability of maximum monthly precipitation totals in the Polish Western Carpathian Mts during the period 1951–2005. Prace Geogr. 2012, 128, 123–134. (In Polish) [Google Scholar]
- Niedźwiedź, T.; Łupikasza, E.; Pińskwar, I.; Kundzewicz, Z.W.; Stoffel, M.; Małarzewski, Ł. Climatological background of floods at the northern foothills of the Tatra Mountains. Theor. Appl. Climatol. 2014, 119, 273–284. [Google Scholar] [CrossRef]
- Hermida, L.; López, L.; Merino, A.; Berthet, C.; García-Ortega, E.; Sánchez, J.L.; Dessens, J. Hailfall in southwest France: Relationship with precipitation, trends and wavelet analysis. Atmos. Res. 2015, 156, 174–188. [Google Scholar] [CrossRef]
- Zelenáková, M.; Vido, J.; Portela, M.M.; Purcz, P.; Blištán, P.; Hlavatá, H.; Hluštík, P. Precipitation trends over Slovakia in the period 1981–2013. Water 2017, 9, 922–942. [Google Scholar] [CrossRef]
- Łupikasza, E. Relationships between occurrence of high precipitation and atmospheric circulation in Poland using different classifications of circulation types. Phys. Chem. Earth 2010, 35, 448–455. [Google Scholar] [CrossRef]
- Kundzewicz, Z.W.; Stoffel, M.; Kaczka, R.J.; Wyżga, B.; Niedźwiedź, T.; Pińskwar, I.; Ruiz-Villanueva, V.; Łupikasza, E.; Czajka, B.; Ballesteros-Canovas, J.A.; et al. Floods at the Northern Foothills of the Tatra Mountains—A Polish–Swiss Research Project. Acta Geophys. 2014, 62, 620–641. [Google Scholar] [CrossRef]
- Walega, A.; Młyński, D.; Bogdał, A.; Kowalik, T. Analysis of the course and frequency of high water stages in selected catchments of the Upper Vistula basin in the south of Poland. Water 2016, 8, 394–408. [Google Scholar] [CrossRef]
- Młyński, D.; Petroselli, A.; Walega, A. Flood frequency analysis by an event-based rainfall-runoff model in selected catchments of southern Poland. Soil Water Res. 2018, 13, 170–176. [Google Scholar]
- Kundzewicz, Z.W.; Pińskwar, I.; Choryński, A.; Wyżga, B. Floods still pose a hazard. Aura 2017, 3, 3–9. (In Polish) [Google Scholar]
- Twardosz, R.; Cebulska, M.; Walanus, A. Anomalously heavy monthly and seasonal precipitation in the Polish Carpathian Mountains and their foreland during the years 1881–2010. Theor. Appl. Climatol. 2016, 126, 323–337. [Google Scholar] [CrossRef]
- Cebulak, E.; Kilar, P.; Limanówka, D.; Mizera, M.; Pyrc, R. The intensity and spatial distribution of atmospheric precipitation. In Dorzecze Wisły—Monografia Powodzi Maj-Czerwiec 2010; Maciejewski, M., Ostojski, M., Walczykiewicz, T., Eds.; Instytut Meteorologii i Gospodarki Wodnej–Państwowy Instytut Badawczy: Warszawa, Poland, 2011; pp. 11–19. ISBN 978-83-61102-59-5. (In Polish) [Google Scholar]
- Niedźwiedź, T.; Łupikasza, E. Change in Atmospheric Circulation Patterns. In Flood Risk in the Upper Vistula Basin; Kundzewicz, Z.W., Stoffel, M., Niedźwiedź, T., Wyżga, B., Eds.; Springer International Publishing: Basel, Switzerland, 2016; ISBN 978-3319419220. [Google Scholar]
- Ratna, S.B.; Ratnama, J.V.; Behera, S.K.; Cherchi, A.; Wang, W.; Yamagata, T. The unusual wet summer (July) of 2014 in Southern Europe. Atmos. Res. 2017, 189, 61–68. [Google Scholar] [CrossRef][Green Version]


| Weather Station | Annual Maximum Daily Precipitation (mm) | Coefficient of Variation (%) | Mann–Kendall Statistics | Trend (mm/10 Years) |
|---|---|---|---|---|
| Wolbrom | 82.3 | 36 | 1.901 | 4(***) |
| Rajcza | 124.8 | 42 | 2.137 | 5.8(**) |
| Kocierz Moszczanicki | 180.4 | 62 | 2.473 | 9.5 (**) |
| Kraków Balice | 87.4 | 36 | 1.852 | 2(***) |
| Książ Wielki | 86.4 | 36 | 2.823 | 4.3(*) |
| Wisłok Wielki | 89.7 | 31 | 3.216 | 4.7(*) |
| Nowy Sącz | 82.6 | 33 | 1.730 | 2.7(***) |
| Radomyśl Wielki | 93.9 | 39 | 1.966 | 3.7(**) |
| Wysowa | 84.5 | 32 | 1.721 | 3(***) |
| Cisna | 102.0 | 28 | 2.205 | 3.5(**) |
| Komańcza | 93.5 | 31 | 1.703 | 2.6(***) |
| Date | % of Stations with the Annual Maximum Daily Precipitation * | Circulation Type |
|---|---|---|
| 15 May 2014 | 61 | NEc |
| 5 July 1997 | Bc | |
| 6 July 1997 | Nc | |
| 7 July 1997 | 65 | NEc |
| 8 July 1997 | Nc | |
| 9 July 1997 | Nc | |
| 27 July 2004 | Nc | |
| 28 July 2004 | 63 | NEc |
| 29 July 2004 | NEc | |
| 7 August 1985 | Nc | |
| 8 August 1985 | 51 | Nc |
| 20 August 1972 | NEc | |
| 21 August 1972 | 75 | Nc |
| 22 August 1972 | Nc | |
| 6 September 1996 | Nc | |
| 7 September 1996 | 57 | Nc |
© 2018 by the authors. Licensee MDPI, Basel, Switzerland. This article is an open access article distributed under the terms and conditions of the Creative Commons Attribution (CC BY) license (http://creativecommons.org/licenses/by/4.0/).
Share and Cite
Młyński, D.; Cebulska, M.; Wałęga, A. Trends, Variability, and Seasonality of Maximum Annual Daily Precipitation in the Upper Vistula Basin, Poland. Atmosphere 2018, 9, 313. https://doi.org/10.3390/atmos9080313
Młyński D, Cebulska M, Wałęga A. Trends, Variability, and Seasonality of Maximum Annual Daily Precipitation in the Upper Vistula Basin, Poland. Atmosphere. 2018; 9(8):313. https://doi.org/10.3390/atmos9080313
Chicago/Turabian StyleMłyński, Dariusz, Marta Cebulska, and Andrzej Wałęga. 2018. "Trends, Variability, and Seasonality of Maximum Annual Daily Precipitation in the Upper Vistula Basin, Poland" Atmosphere 9, no. 8: 313. https://doi.org/10.3390/atmos9080313
APA StyleMłyński, D., Cebulska, M., & Wałęga, A. (2018). Trends, Variability, and Seasonality of Maximum Annual Daily Precipitation in the Upper Vistula Basin, Poland. Atmosphere, 9(8), 313. https://doi.org/10.3390/atmos9080313