Review

Irradiance Variability Quantification and Small-Scale Averaging in Space and Time: A Short Review

by
Gerald M. Lohmann
Energy Meteorology Group, Institute of Physics, Oldenburg University, 26111 Oldenburg, Germany
Atmosphere 2018, 9(7), 264; https://doi.org/10.3390/atmos9070264
Submission received: 19 June 2018 / Revised: 12 July 2018 / Accepted: 13 July 2018 / Published: 15 July 2018
(This article belongs to the Special Issue Energy Meteorology)

Abstract

:
The ongoing world-wide increase of installed photovoltaic (PV) power attracts notice to weather-induced PV power output variability. Understanding the underlying spatiotemporal volatility of solar radiation is essential to the successful outlining and stable operation of future power grids. This paper concisely reviews recent advances in the characterization of irradiance variability, with an emphasis on small spatial and temporal scales (respectively less than about 10 km and 1 min), for which comprehensive data sets have recently become available. Special attention is given to studies dealing with the quantification of variability using such unique data, the analysis and modeling of spatial smoothing, and the evaluation of temporal averaging.

1. Introduction

The last decade has seen a noticeable increase in the installed capacity of photovoltaic (PV) power all over the world, and the corresponding fast-paced growth (e.g., 25% in 2015 [1]) is expected to continue in the future. From well over 200 GW in the beginning of 2016 [2], the global PV capacity is estimated to multiply more than tenfold until 2030, with capacity projections ranging between 3 TW and 10 TW [3]. As a result, problems related to the intrinsic variability of PV power production will considerably increase as well [4,5]. These challenges include the correct estimation of a PV system’s yield [6], the proper dimensioning of energy storage [7], the balancing of generation and load [8], as well as the support of power quality (e.g., voltage and frequency stability) [9]. As PV power variability is mainly determined by weather-induced heterogeneity in fields of downwelling solar radiation [10], corresponding data-driven analyses and irradiance variability quantifications are essential to the successful outlining and stable operation of future power grids [11].
In this context, variability in irradiance itself is as interesting as variability in irradiance increments—that is, transitions from one point in time to another, also known as changes (e.g., [12]), step changes (e.g., [13]), or ramp rates (e.g., [14]). Irradiance variability mainly impacts a PV system’s yield and the proper dimensioning of energy storage, while increment variability affects power quality as well as the maintenance of the generation load balance. The relevant spatiotemporal scales of variability span many orders of magnitude: from meters and seconds through hundreds of kilometers and multiple days, depending on the PV capacity and power grid size in question [15]. There is an ongoing need to deepen the understanding of misrepresentation of temporal variability caused by temporally coarse-resolution measurements [16,17], as well as how spatial smoothing (resulting from many PV systems dispersed over a large area) affects variability [18,19]. This is especially true for small sub-minute and sub-kilometer scales, which have only begun to receive increased scientific attention in the last couple of years, and for which comprehensive data sets have recently become available [10,12,15].
Early ground-based analyses have characterized single-site irradiance on time scales ranging from hours to months [20,21], while later studies have often been geared towards increasing temporal resolutions of, e.g., 300 s [22,23], 60 s [24,25,26,27], 20 s [12,28,29], 15 s [30,31,32,33,34,35,36,37,38,39,40], 10 s [10,13,41], 5 s [42,43], 1 s [14,44,45,46,47,48,49,50,51,52,53,54,55,56,57,58,59,60,61], and occasionally even down to 0.1 s [62], 0.04 s [63], 0.01 s [16,17,64,65], and 0.0005 s [66]. However, the spatial coverage of many of these data has remained very confined due to the typically small number of pyranometers in simultaneous operation. Satellite-derived irradiance data have additionally been used in order to augment the ground-based measurements and to extend the analyses to larger spatial scales on the order of tens of kilometers and more [10,29,67]. However, the best possible temporal resolutions realized by these satellite data range between about 15 min and 1 h. In one way or another, all studies have thus been either bound by a restricted resolution in space, a restricted resolution in time, or both. To exceed these limitations, some studies have employed synthetically generated data, either by modelling cloud shapes of varying complexity [52,68,69,70,71] and/or by deriving “virtual networks” from single-sensor data shifted in time [12,13,71]. Yet, these artificial data do not automatically compare well to reality. To remedy some of the above-mentioned deficiencies, increasing efforts have recently been devoted to the collection of high-resolution ( 1 s) ground-based irradiance data using networks of multiple (up to 99) synchronized photodiode pyranometers deployed over extended domains (between about 1 km2 and 80 km2, some of which are readily available online [72,73,74,75,76].
Altogether, there is a large body of literature touching on various aspects of irradiance variability and its underlying processes in time and space. Recent topics of interest—especially in the realm of small scales—have included, for example,
  • the analysis of power spectra and non-linear characteristics of PV power and solar irradiance time series [17,18,44,47,54,55,60,77,78,79,80,81,82],
  • the consideration of sunshine number and sunshine stability number to characterize the level and stability of the solar radiative regime [30,31,32,33,34,35,36,37,38,39,40],
  • the intercomparison of solar irradiance fluctuations and power generation variability of co-located PV plants [26,55,70,83],
  • the characterization of PV power generation variability as a function of installed capacity and plant size [14,26,48,56],
  • the assessment of the effects of partial shadowing on performance reduction from single modules to entire PV systems [63,84,85,86],
  • the development of methods to infer irradiance and PV power estimates from whole sky photos taken by purpose-built sky imager systems [59,87,88,89,90,91,92,93,94,95],
  • the proposition of classification schemes and measures to quantify variability [26,50,51,96,97,98,99,100,101],
  • the estimation of spatial smoothing, including correlation structures of irradiance and PV power, as well as their increments [10,12,13,16,27,41,45,49,51,52,61,68,70,71,102,103,104,105,106,107], and
  • the determination of temporal averaging effects and differences in temporal variability on time scales between seconds and hours, including statistical downscaling [9,67,100,108,109,110,111,112,113,114,115,116,117,118].
With an emphasis on the three last-mentioned research topics and on sub-minute scales below about 10 km, this short review article summarizes previous findings from the literature and concisely recapitulates the essentials of characterizing normalized time-scale-specific changes in irradiance (Section 2), as well as quantifying variability (Section 3) and averaging effects in space (Section 4) and time (Section 5). The conclusions finally provide a short outlook onto possible further research questions in light of the state-of-the-art (Section 6). The paper complements previous textbooks and literature reviews on solar energy forecasting and resource assessment [119,120,121,122,123,124,125,126,127,128], the estimation of variability in different renewable resources [15,129], the use of machine learning in solar power applications [130,131,132], and small-scale structures of irradiance fields [133].

2. Irradiance Normalization and Time-Scale-Specific Changes

It is well-known that variability in global horizontal irradiance (GHI) can generally be influenced by processes of both astronomical and atmospheric origin [119]. On the one hand, astronomical relationships cause seasonal and diurnal variations, which are accurately computable and relatively small on short sub-minute time scales. On the other hand, atmospheric phenomena can affect irradiance in complicated ways in a range of time scales (e.g., cloud dynamics can exert influence on the seasonal cycle as well as sub-minute variability). Some studies aim to focus on the actual magnitude of irradiance including all aforementioned influences, but occasionally employ a normalization to irradiance under standard test conditions (STC) G S T C = 1000 Wm−2 [26,50]. In order to study the stochastic nature of weather-induced variability on short time scales, most authors take measures to remove deterministic trends from GHI time series G by estimating either the clearness index (a.k.a. transmission coefficient, e.g., [20])
k = G G e x t r a
or the clear-sky index
k = G G c l e a r
The clearness index represents a normalization of G to the extraterrestrial solar radiation G e x t r a (i.e., irradiance at a particular location without considering the atmosphere), while the clear-sky index relates G to a theoretical clear-sky radiation G c l e a r (i.e., irradiance at a particular location assuming a cloud-free atmosphere). The extraterrestrial solar radiation G e x t r a is exclusively determined by well-known astronomical interrelations, whereas the characteristics of G c l e a r depend on parameters of atmospheric conditions and are thus model-specific. Many different clear-sky models have been proposed to date [134,135,136,137], and the use of any of them introduces unique uncertainties to the clear-sky index time series, which are not included in the source GHI observations. With G c l e a r thus not being unambiguously defined, its values represent typical rather than effective clear-sky irradiance. Nevertheless, many authors have favored the clear-sky index over the clearness index, although nomenclature varies and some call k as defined in Equation (2) “clearness index” (e.g., [100]).
Figure 1 presents (a) an example time series of surface irradiance recorded with 1 s temporal resolution during the HD(CP)2 Observational Prototype Experiment (HOPE) campaign [138,139] along with simulated clear-sky irradiance derived by a basic model [140], and (b) estimated clear-sky index as per Equation (2). Several typical features of the clear-sky index are evident in the time series. For example, the lowest clear-sky index values are usually greater than zero, because irradiance is never attenuated completely, no matter how dark the cloud. Moreover, the upper boundary of k often exceeds 1, mostly due to cloud enhancement (i.e., reflections from surrounding clouds add to the measurement) and to a lesser degree due to imperfectly modelled clear-sky conditions. Under broken cloud conditions, cloud enhancement has been reported to lead to single-point irradiance observations exceeding their clear-sky expectation by more than 50% on sub-minute time scales [17,64,65,141,142,143,144]. However, cloud enhancement cannot be unambiguously identified using absolute values of k , because these can be biased by the clear-sky model of choice.
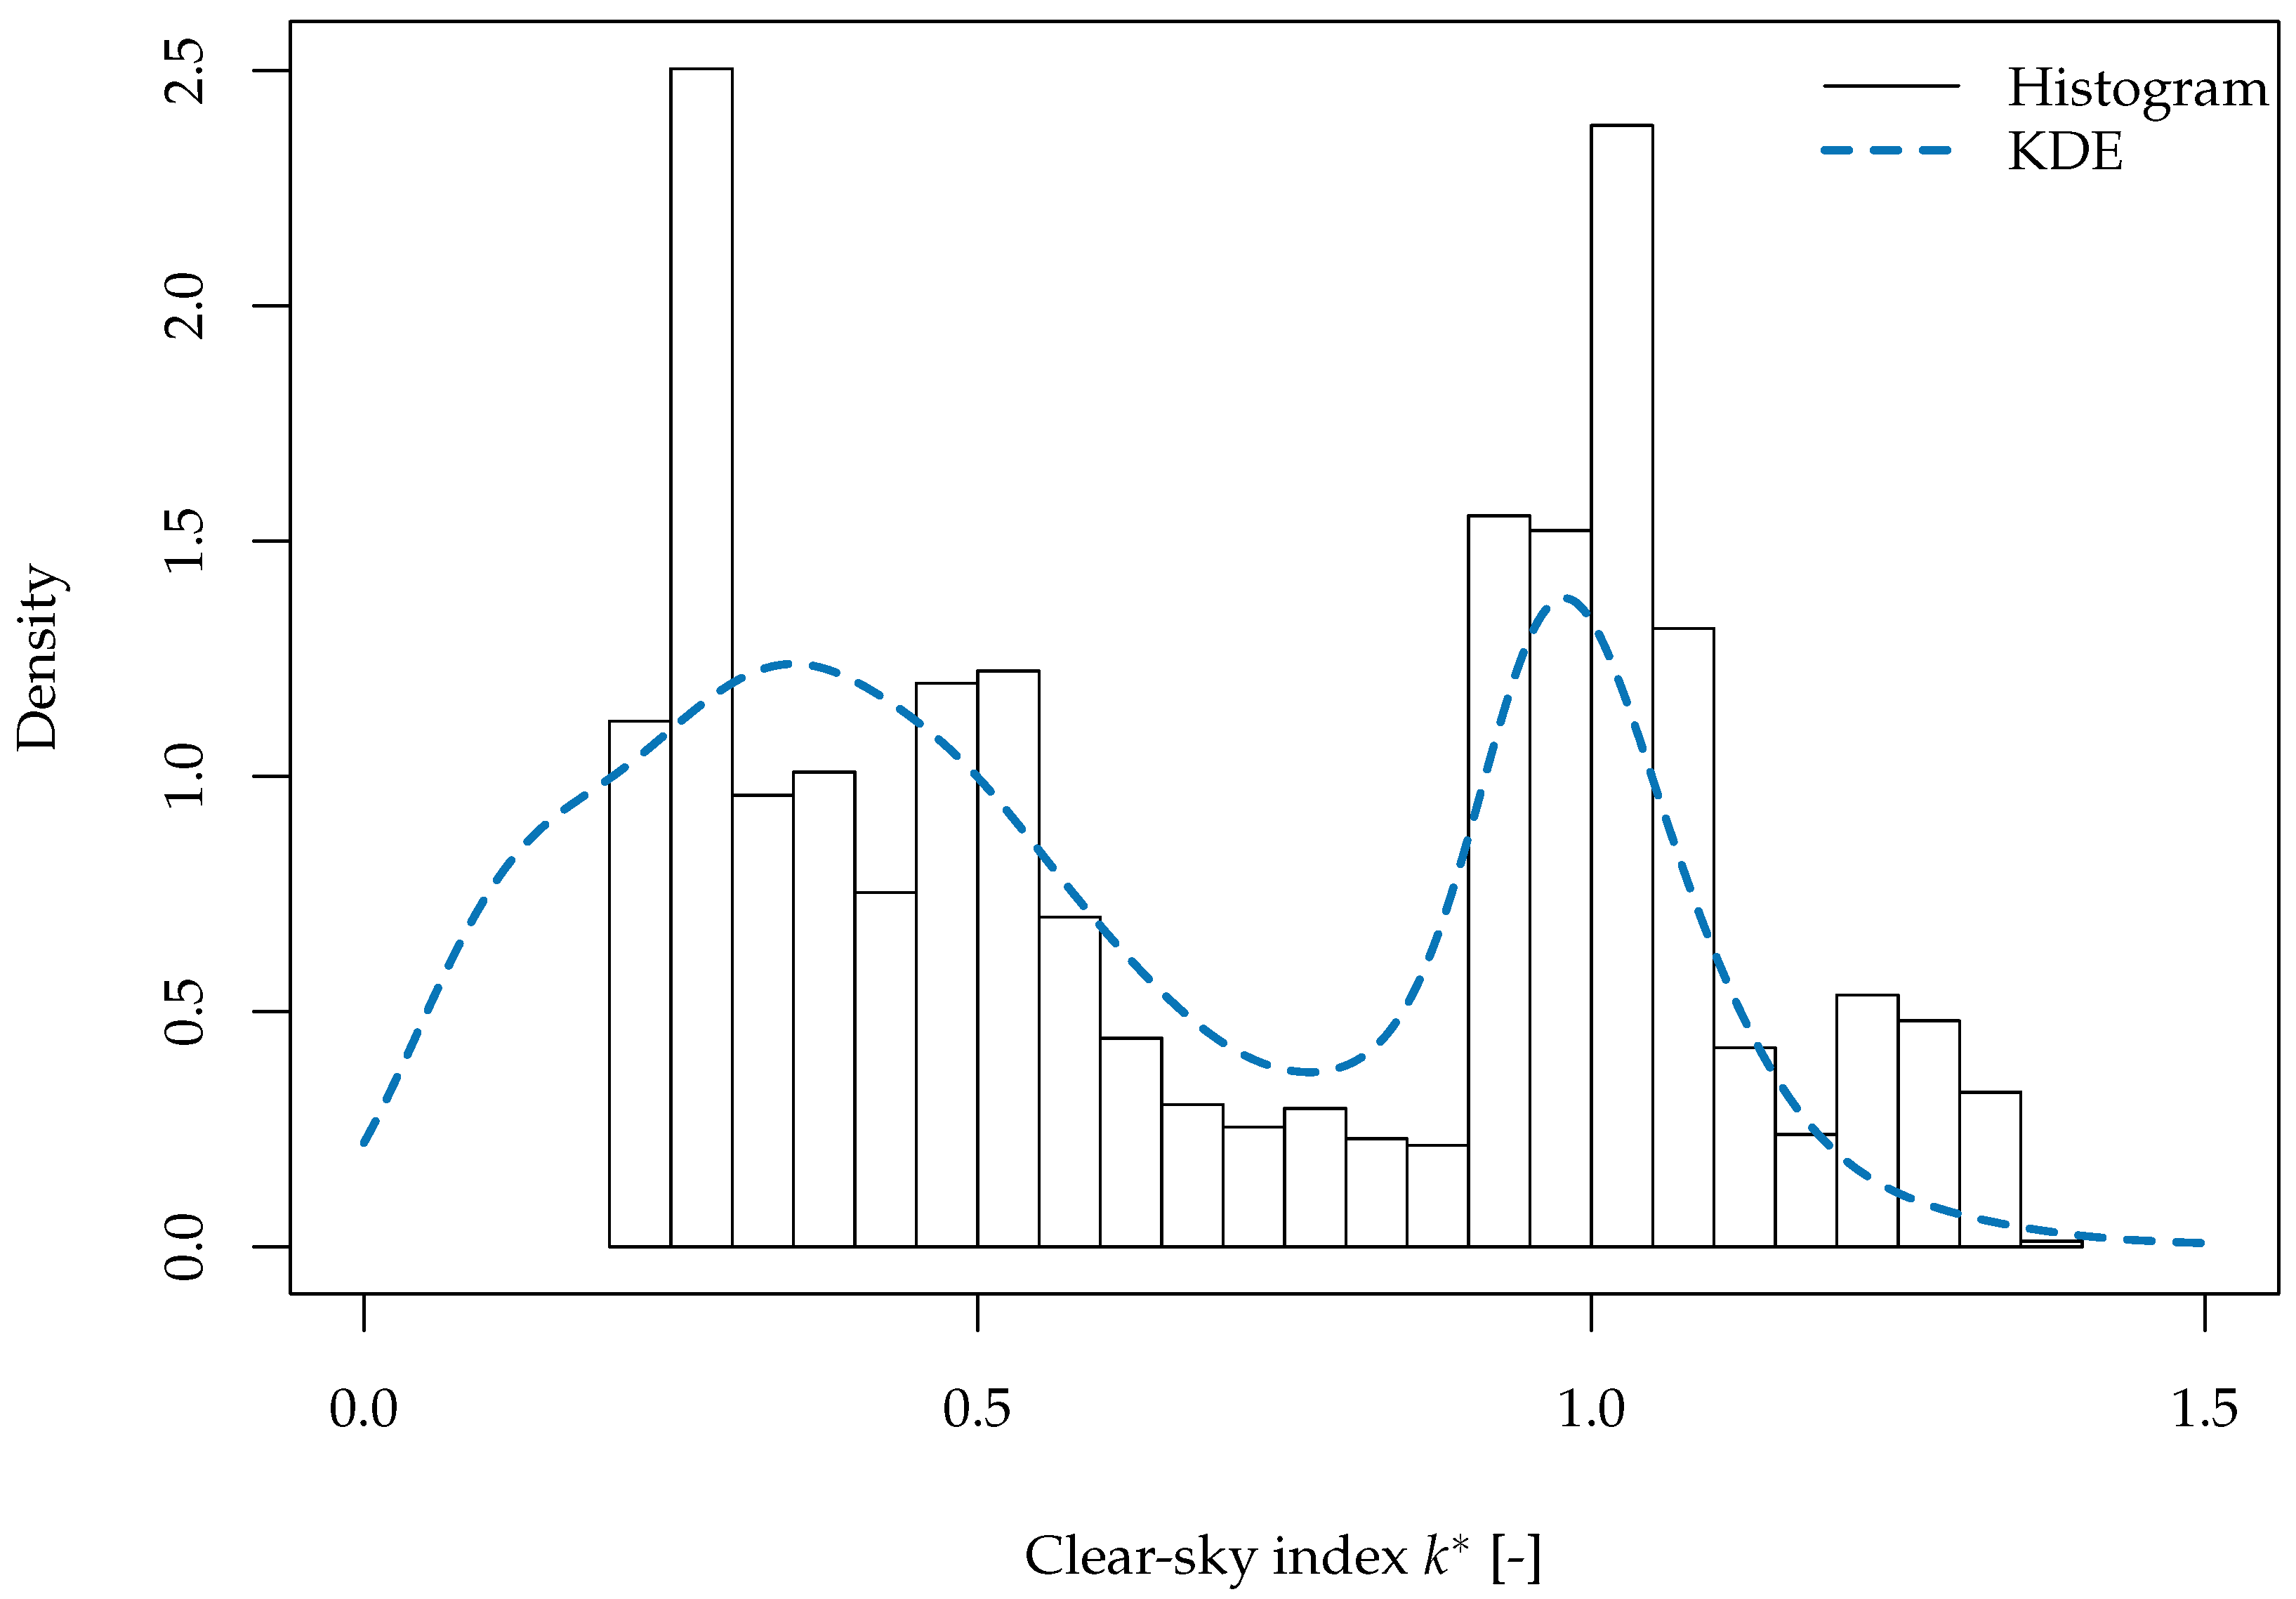
On these short time scales, the probability density function of clear-sky index time series is typically bimodal in nature, with the two peaks respectively representing states with and without cloud coverage [22,23,24,145,146]. Figure 2 correspondingly shows two estimates of the clear-sky index probability density function based on a histogram of the example time series shown in panel (b) of Figure 1, as well as a kernel density estimate (KDE) [147] of all available data from that sensor (about 4.5 · 10 6 s worth of 1 s data). While the histogram does not correspond to a perfectly bi-modal distribution due to the limited number of data available from the single-day example, the kernel density estimate clearly illustrates the two peaks representing overcast and clear skies.
The statistical moments associated with a given clear-sky index time series of length T, such as the sample arithmetic mean
k ¯ = 1 T t = 1 T k ( t )
and the sample standard deviation
σ k = 1 T 1 t = 1 T ( k ( t ) k ¯ ) 2
can be used to characterize the time series’ variability to a degree [51]. However, these measures do not consider the chronology of the observations, and are thus not suited to assess changes therein (i.e., temporally shuffling all clear-sky index data will affect neither the respective probability density function nor the corresponding moments). Instead, characterizations of clear-sky index variability can be geared towards changes over specified intervals of time τ by deriving statistics of k increments
k τ ( t ) = k ( t + τ ) k ( t )
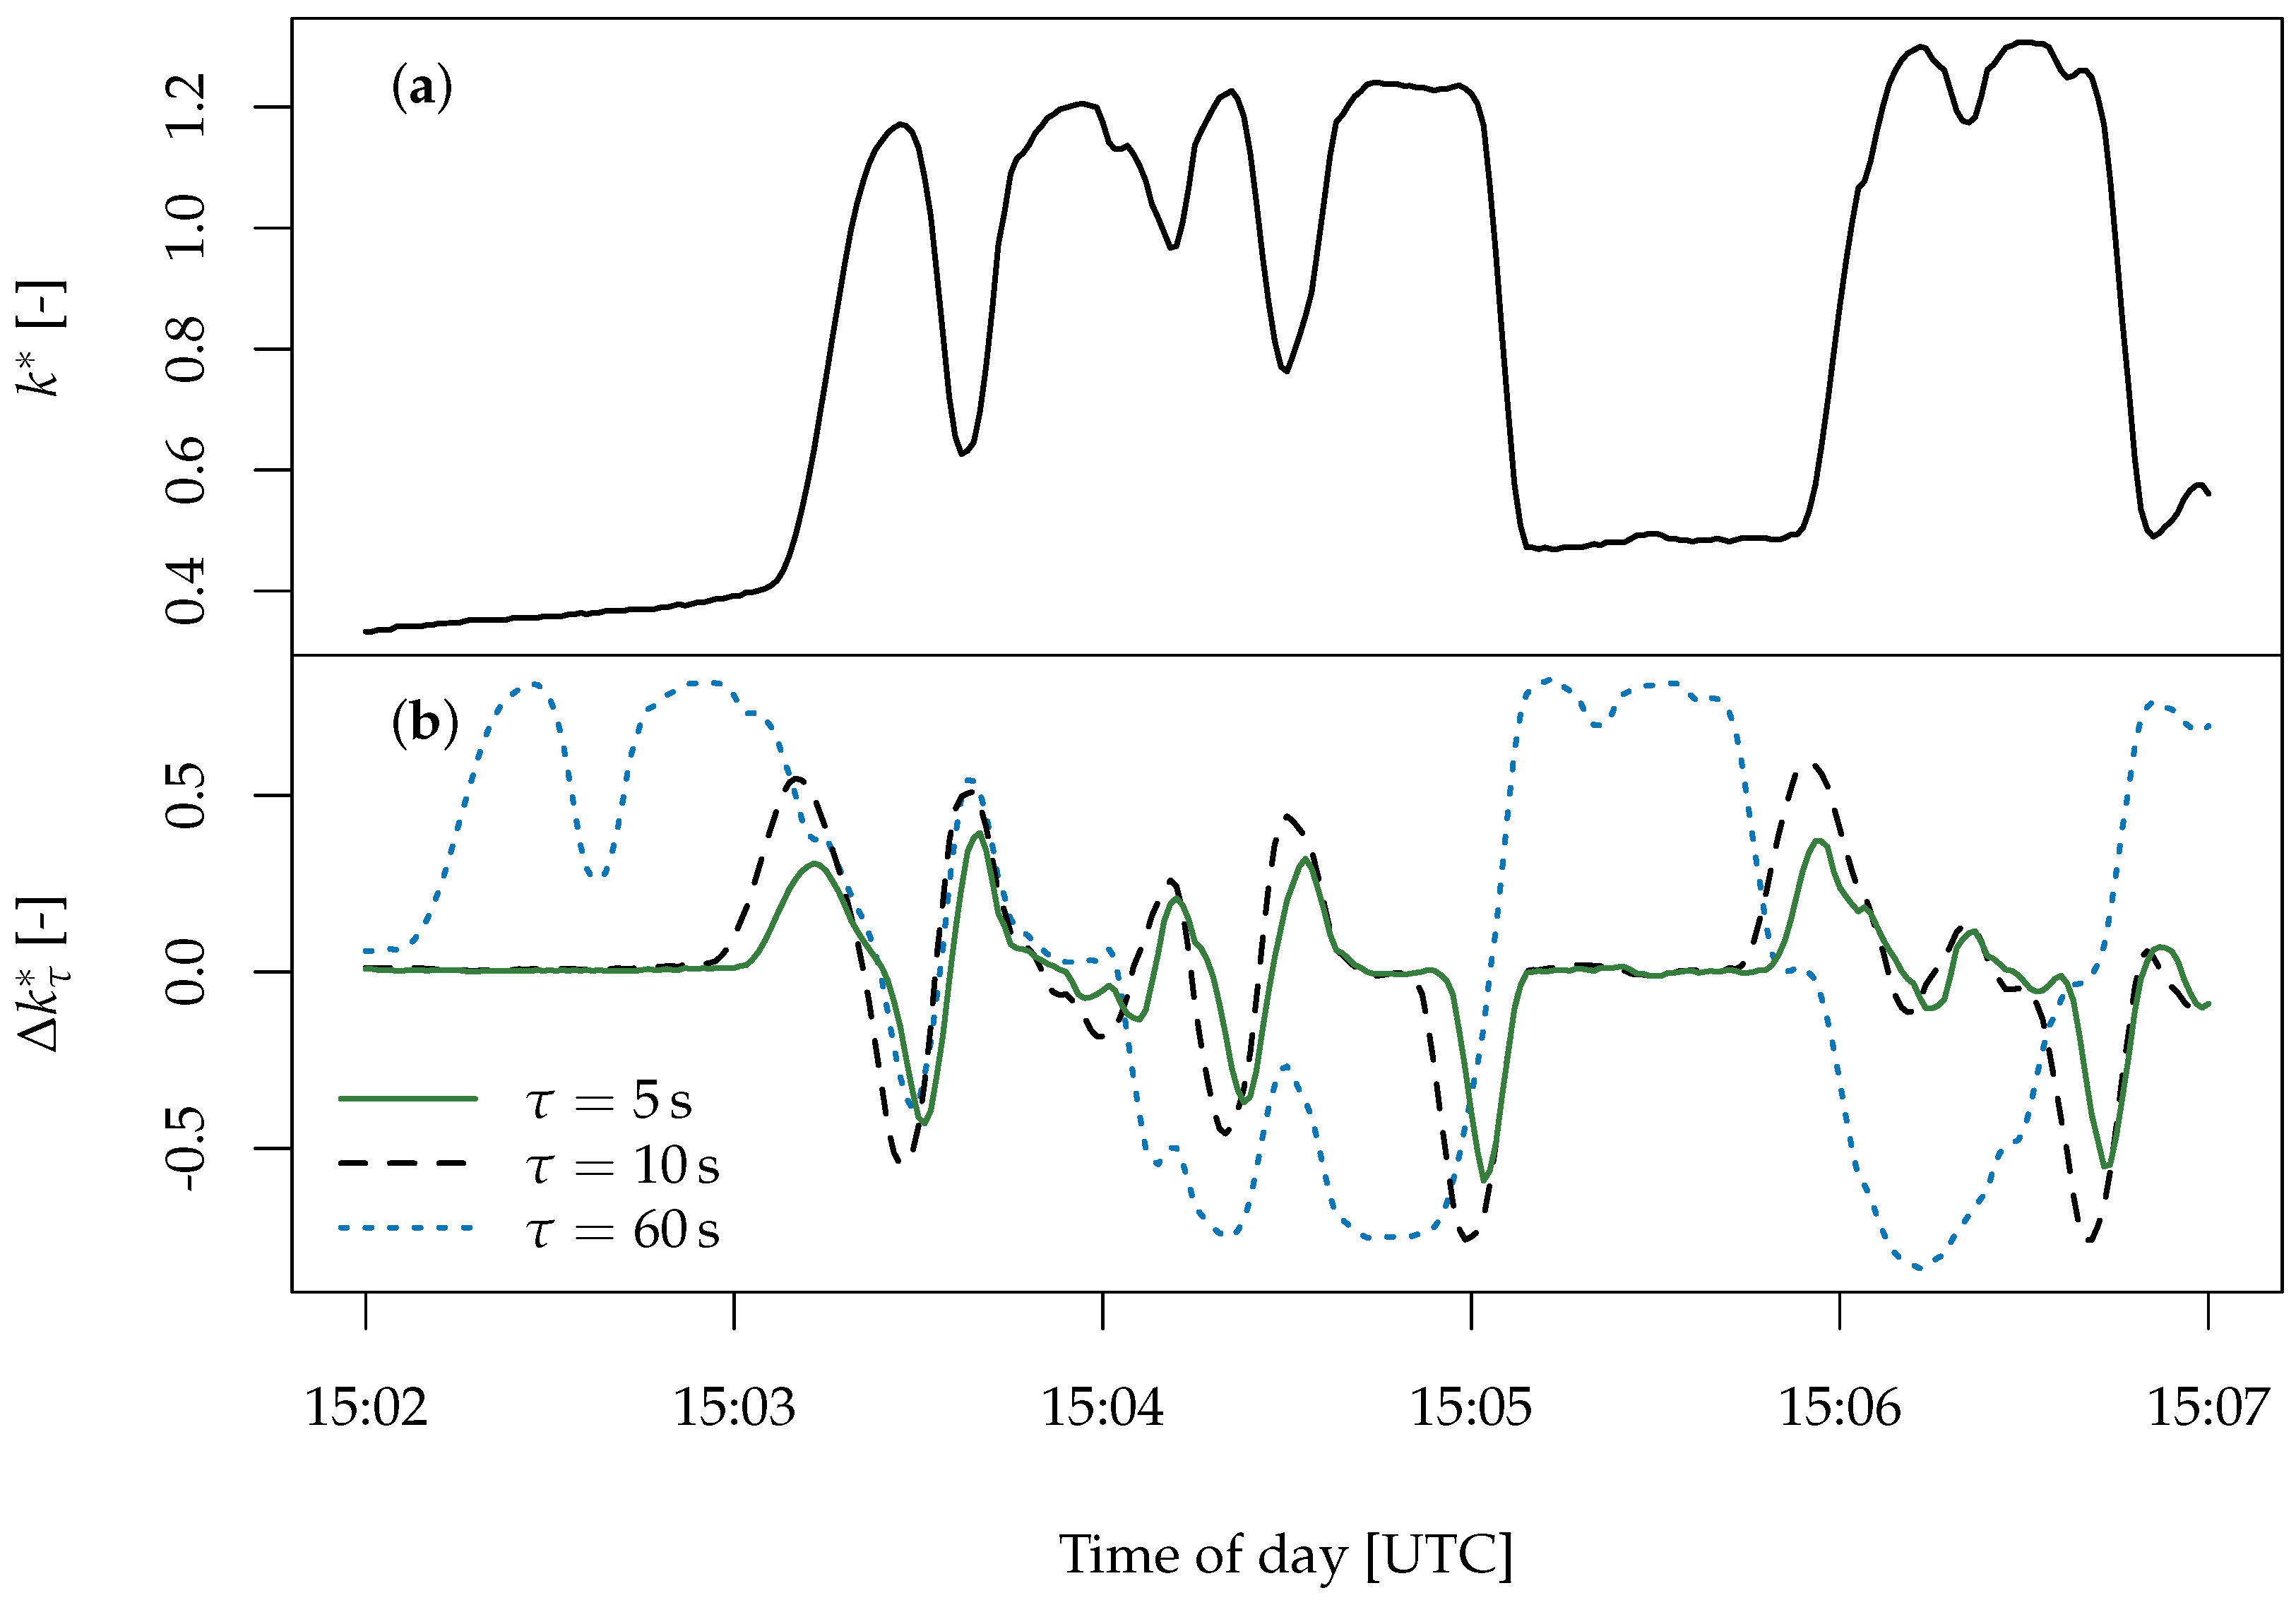
which are a useful measure of intermittency [148]. Figure 3 presents an illustrative example of thus-derived clear-sky index increments for three short-term time steps τ = 5 s, τ = 10 s, and τ = 60 s, based on a five-minute subset of the data previously shown in Figure 1. The short duration of the series was specifically selected to facilitate an intuitive comprehension of the nature of increment time series.
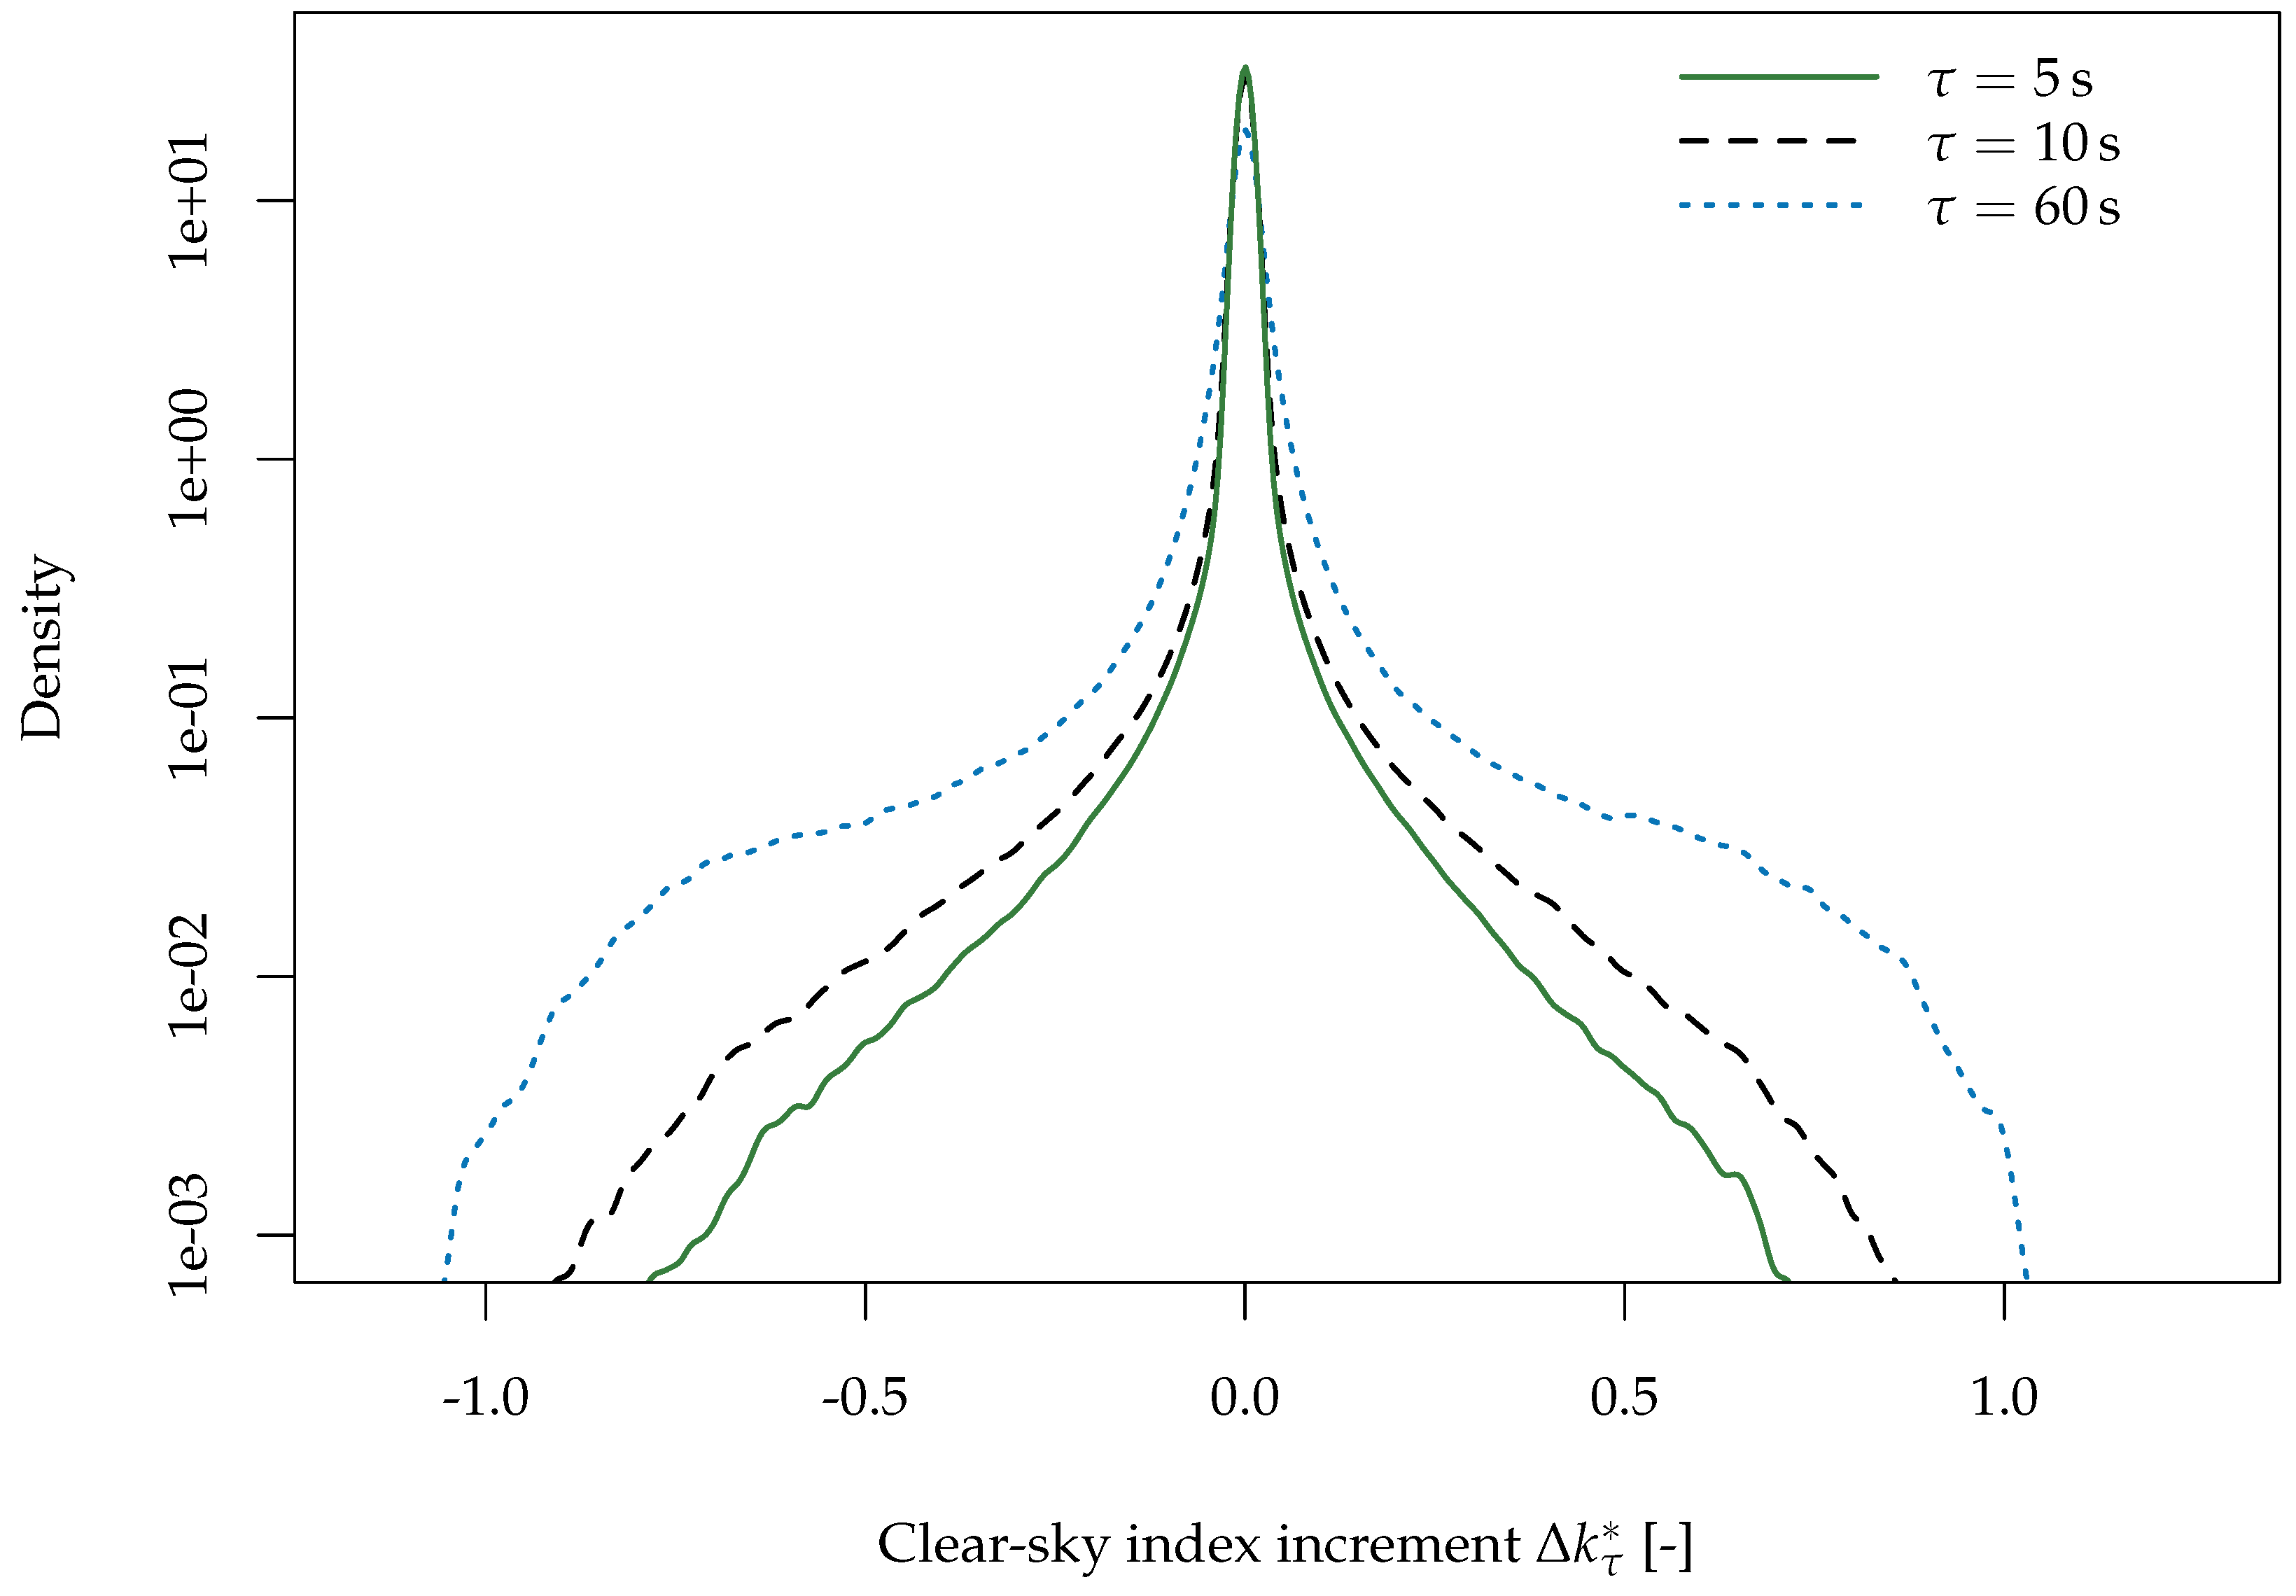
The probability density functions of single-point clear-sky index increments generally exhibit a slim central peak (representing a high probability of occurence from relatively small changes), enclosed by widespread tails of decreasing probabilities from stronger variations. For increasing increment time steps, the numbers of high-magnitude changes also increase, leading to more pronounced tails of the corresponding distributions [78]. These general characteristics are illustrated for the same three time steps as before (τ = 5 s, τ = 10 s, and τ = 60 s) by means of kernel density estimates in Figure 4, using the same data as for the KDE in Figure 2 (i.e., about 4.5 · 106 s worth of 1 s clear-sky index data).
Comparisons of spatially averaged increment distributions of multiple pyranometers (or PV plants of different capacities) indicate that the numbers of high-magnitude changes and, thus the width of the increment distribution, are reduced for an increasing number of sensors (or larger PV plants) [26,48,56]. However, higher-than-normal (i.e., compared to a Gaussian distribution) probabilities of comparatively high-magnitude changes remain common across time scales (e.g., increments on the order of tens of standard deviations can be recorded on a regular basis [44,104]). Similarly, temporal averaging on scales 1 s can also result in a narrowing of increment distributions, and hence a potential underestimation of actual variability [111]. Yet, this drawback can be acceptable, for example, when variability at different locations is compared by means of data featuring diverse temporal resolutions [50].

3. Variability Quantification

Several different single-number metrics have been proposed to quantify variability in irradiance, normalized irradiance, and/or PV power (some of the underlying concepts can be applied to several of these quantities) within a well-defined period. These include specialized measures such as the variability index (VI) [96], which is tailored specifically to employ measured irradiance G and simulated clear-sky irradiance G c l e a r , and is defined as
VI = t = 1 T 1 [ G ( t + 1 ) G ( t ) ] 2 + T 2 t = 1 T 1 [ G c l e a r ( t + 1 ) G c l e a r ( t ) ] 2 + T 2
with T denoting the number of consecutive observations and T representing the averaging interval of the time series (e.g., T = 1 for minute-averaged irradiance measurements). In contrast, the intra-hour variability score (IHVS) [98] and the daily aggregate ramp rate (DARR) [26] have also been proposed to be used with irradiance data, but can easily be adapted to other quantities, because they simply represent the sum of all absolute increment values during a given hour or day, respectively. For example, the DARR of any time series X can be defined as
DARR = t = 1 T 1 | X ( t + 1 ) X ( t ) | C
with T again denoting the number of consecutive observations and C representing an (optional) scaling constant (e.g., for irradiance, C = 1000 Wm−2 can be used to normalize to STC [26]). The variability score (VS) [50] is another versatile measure, which can be defined for any time step τ as
VS τ = max [ X 0 × P ( | X τ | > X 0 ) ]
with X τ = X ( t + τ ) X ( t ) denoting all increments of X using time step τ (i.e., analogous to Equation (5)), X 0 consisting of values between 0 and max ( | X τ | ) , and P ( | X τ | > X 0 ) representing the probability of absolute increment values greater than X 0 to occur. In its original formulation, the VS is calculated based on increments in temporally averaged data, with averaging time scale T = τ , and it is expressed as a percentage, with X τ and X 0 representing either increments in irradiance normalized to STC or increments in rated PV power capacity [50]. However, the concept of the variability score can generally also be applied to other time series, such as clearness index or clear-sky index. The variability score compares well to the variability index, as both yield comparable estimations of variability with a very high linear correlation between the two measures for a given time scale [16,50].
Finally, changes in the variability of any increment time series X τ are also reflected by changes of the corresponding standard deviation
σ X τ = 1 T 1 t = 1 T [ X τ ( t ) X τ ¯ ] 2
with T denoting the number of increment values in the series, and X τ ¯ representing the mean increment values (in practice, X τ ¯ 0 ). Increment standard deviation σ X τ characterizes typical excursions from the mean, and has become a well-established measure to quantify variability in irradiance, clear-sky index, and PV power output [10,15,19,28,51,111]. For example, the standard deviation is particularly convenient when considering averaged k time series across multiple pyranometers, as it will change as n 0.5 for a number of n uncorrelated locations, regardless of the underlying distribution [51]. Note, however, that the non-Gaussianity of irradiance-related increment statistics causes the standard deviation to not necessarily represent the size of extreme fluctuations appropriately. For example, the universal three-sigma rule, stating that a range of ± 3 σ X τ around the mean will cover 99.73% of all values if X τ are normally distributed [149], does not apply to increments in irradiance, clear-sky index, or PV power.
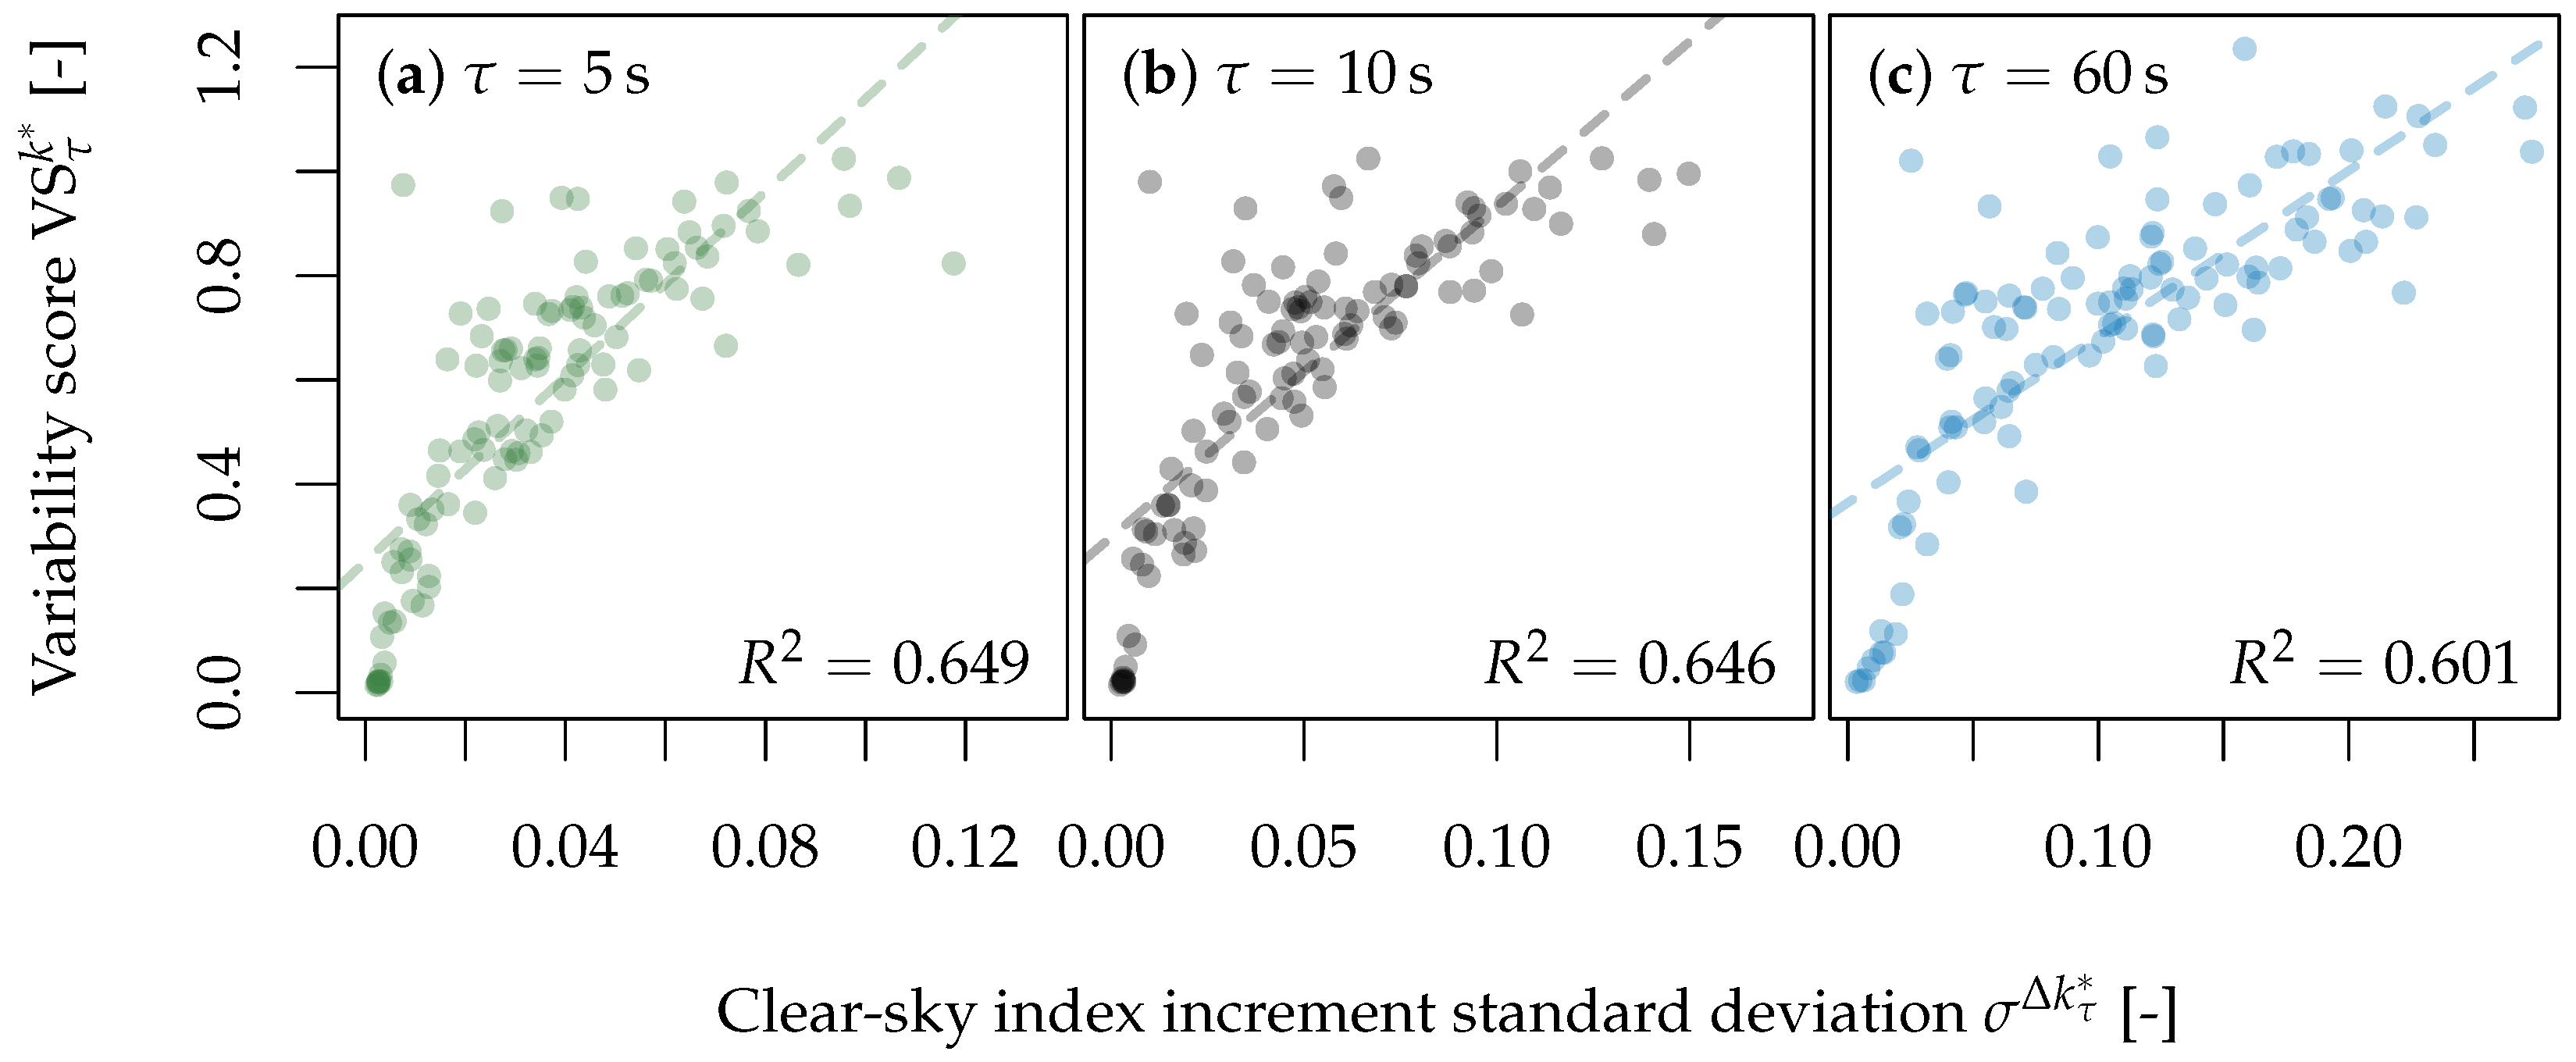
Figure 5 compares daily values of the clear-sky index variability score VS τ k (cf. Equation (8)) and the clear-sky index increment standard deviation σ k τ (cf. Equation (9)) for three time steps τ = 5   s , τ = 10   s , and τ = 60   s . Although increasing standard deviations generally correspond to increasing variability scores, there is considerable spread around the least-square fits shown in Figure 5. Consequentially, the coefficients of determination 0.60 R 2 0.65 associated with the fits only indicate a moderate correlation between the two quantities considered. As both measures are actively being used to quantify variability throughout the literature, it may be worthwhile to systematically compare the two in a more detailed manner in order to improve the interpretability of their values. However, such an analysis would go beyond the scope of this review.
Additionally, a number of studies have applied classification schemes in order to group sets of time series according to their variability characteristics. Typically, the resulting variability classes are made up of at least “high-variability”, “medium-variability”, and “low-variability” [97], although the nomenclature varies (e.g., high variability can be called “mixed-sky”, medium variability “clear-sky”, and low variability “overcast” [51]). Some authors split the range of a single-number metric into subsets using fixed thresholds [101], while others employ multivariate classification schemes [51,100] or machine learning algorithms [97,99].

4. Spatial Averaging

Compared to a single-point irradiance measurement, the larger the panel-covered area of a PV plant, the less variable its power production becomes [26], especially on short sub-minute time scales [55,56]. Similarly, the power output of a single high-capacity PV plant occupying a relatively small area is more variable than the aggregate power of a large number of small plants amounting to a similar total capacity, but occupying a considerably larger area [28]. In lieu of suitable PV power data, averages of irradiance or clear-sky index increments can serve as output variability estimates of a set of PV power plants located at different locations [10].
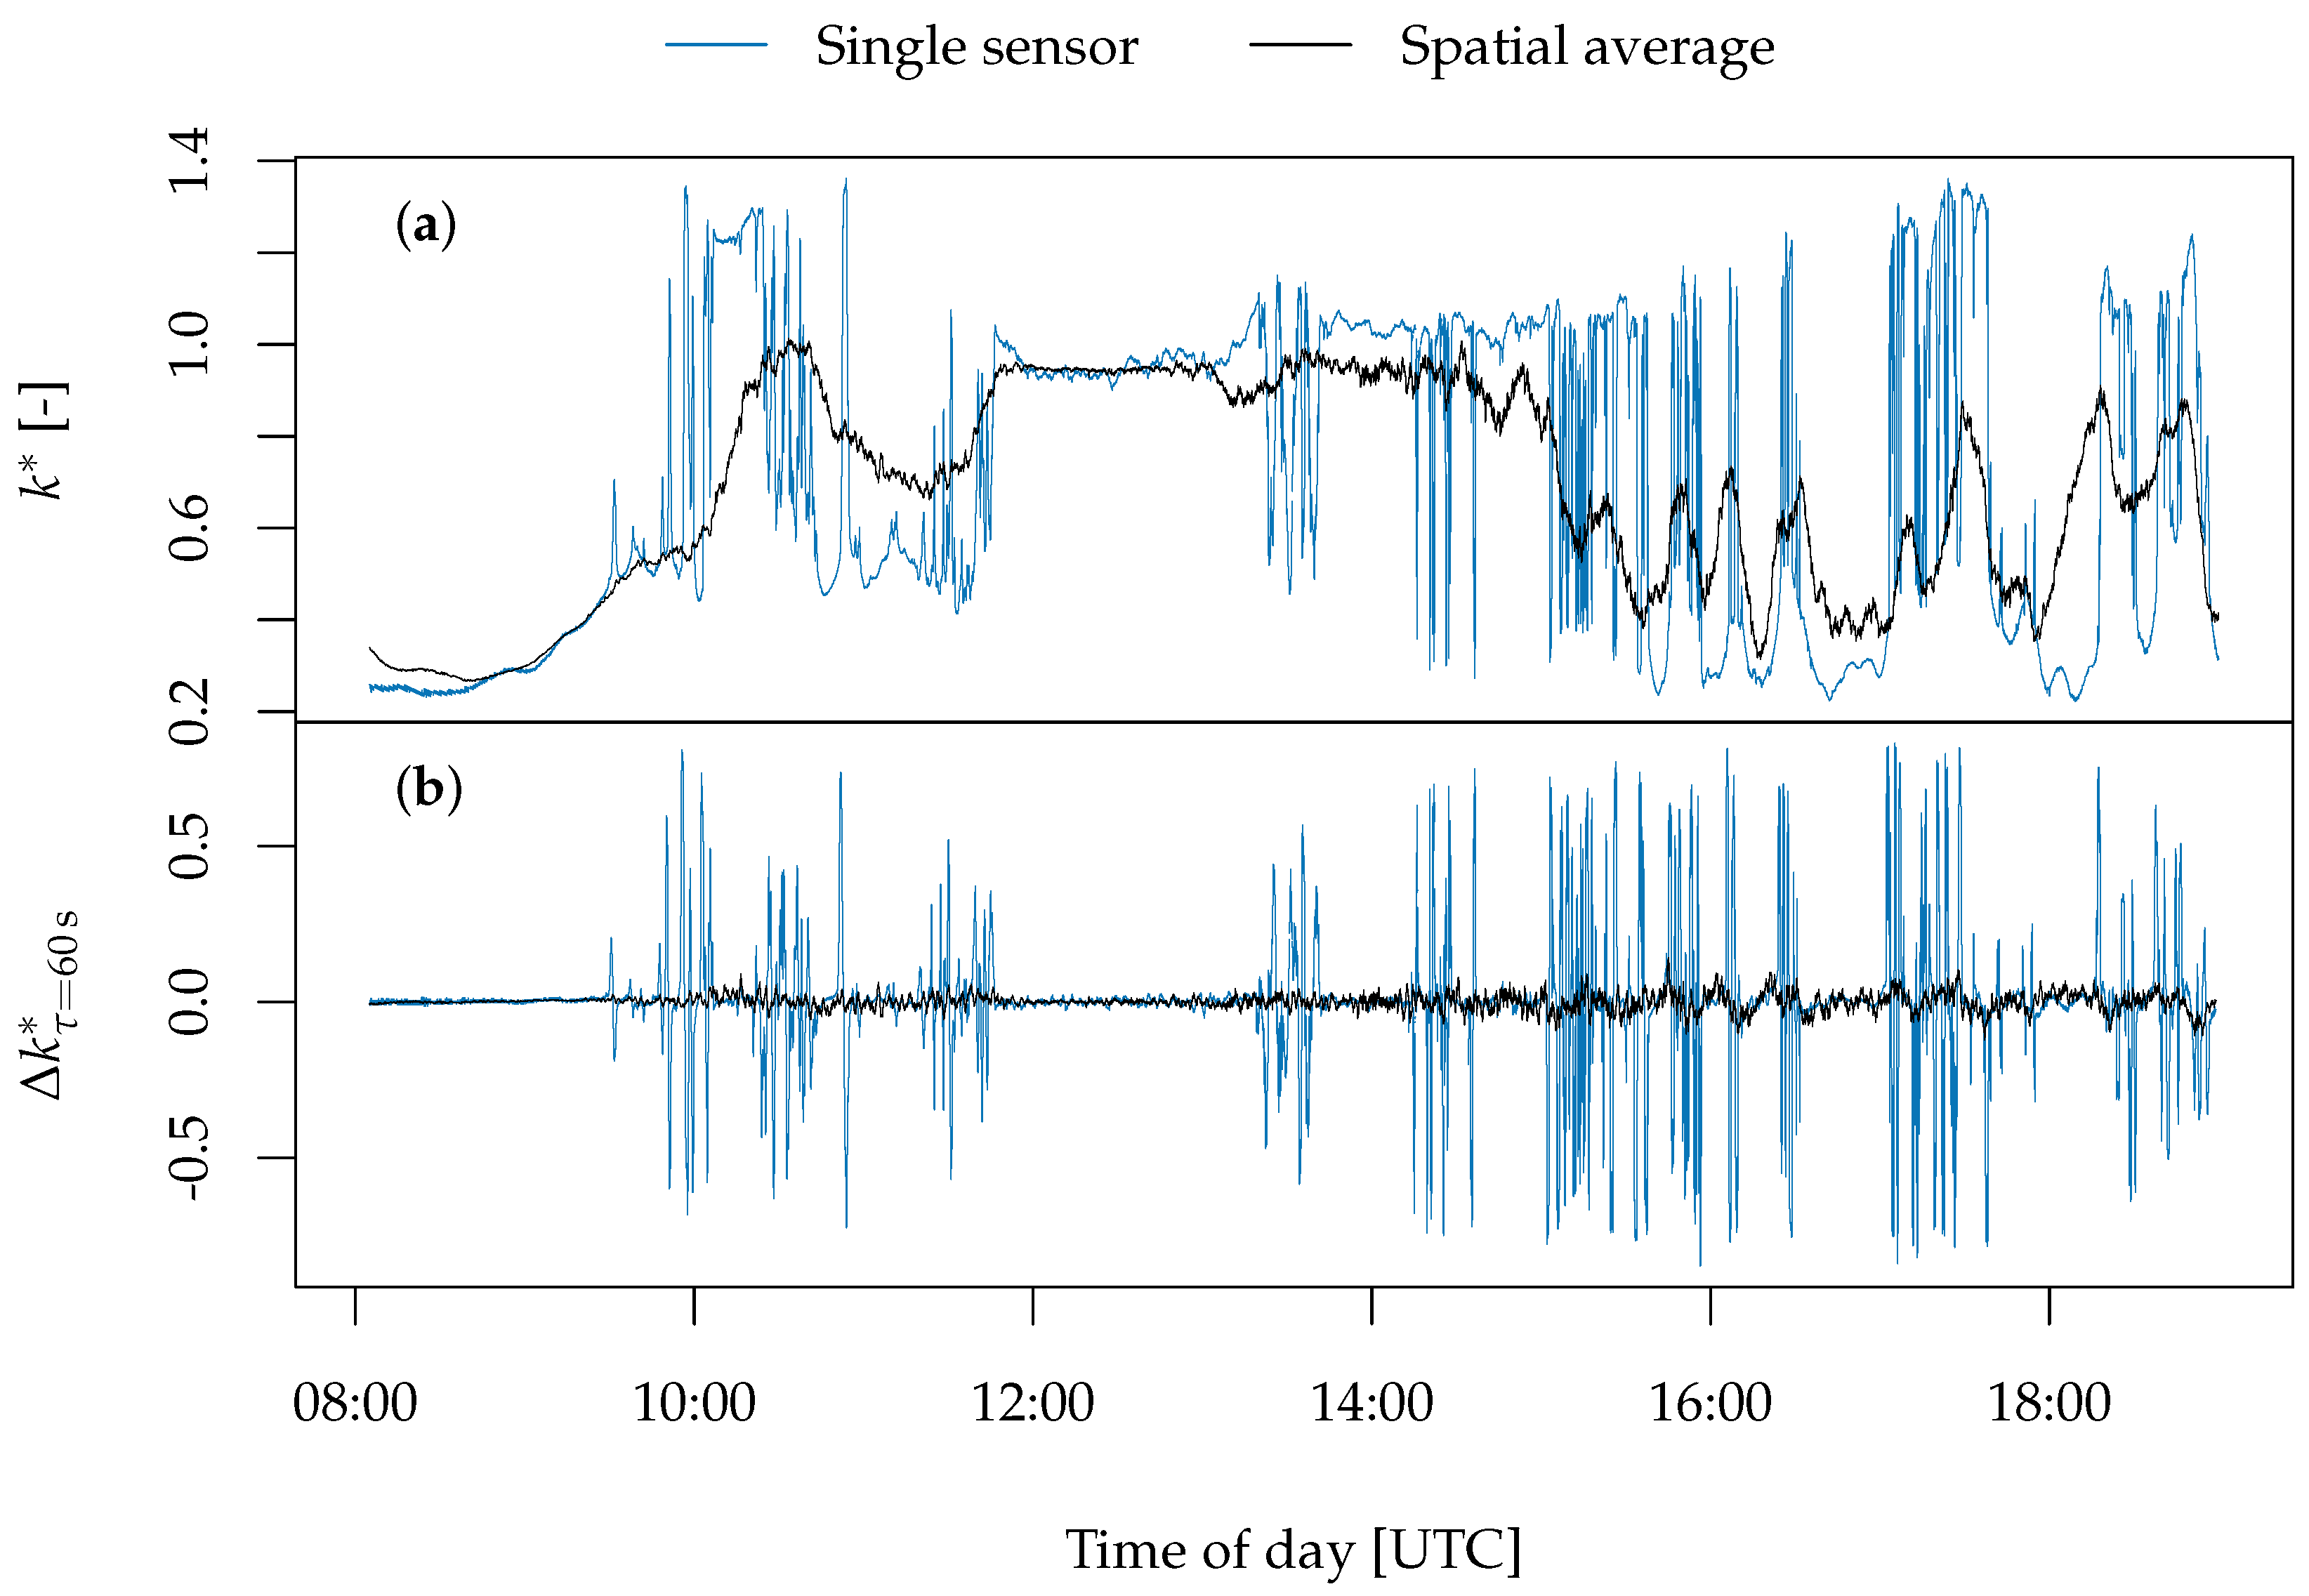
An illustrative example of spatial averaging is shown in Figure 6, where (a) single-sensor clear-sky index estimates are contrasted with the spatially averaged values of up to 99 synchronized pyranometers dispersed over an area of approximately 80 km2, and (b) 1 min increments are shown for both the single sensor and the spatial average. Pronounced spatial smoothing is evident in both panels.
As a characterization of the spatial structure of k τ fields, it is useful to consider spatial two-point correlation coefficients between locations i and j:
ρ i j k τ = t = 1 T ( k τ , i ( t ) k τ , i ¯ ) ( k τ , j ( t ) k τ , j ¯ ) t = 1 T ( k τ , i ( t ) k τ , i ¯ ) 2 t = 1 T ( k τ , j ( t ) k τ , j ¯ ) 2
which govern the process of spatial averaging (i.e., the standard deviation σ x + y of the sum of two random variables x + y with correlation coefficient ρ x y is σ x + y = σ x 2 + σ y 2 + 2 ρ x y σ x σ y . In Equation (10), k τ , i ( t ) and k τ , j ( t ) are the two individual increment time series at the two locations i and j, while k τ , i ¯ and k τ , j ¯ are the corresponding arithmetic means (computed as in Equation (3)), and the quantity T denotes the number of data points in each of the two time series. These correlation structures can, for example, serve to directly model the generation variability of distributed and/or large PV plants based on a single pyranometer, using a wavelet approach [48,58,83,97].
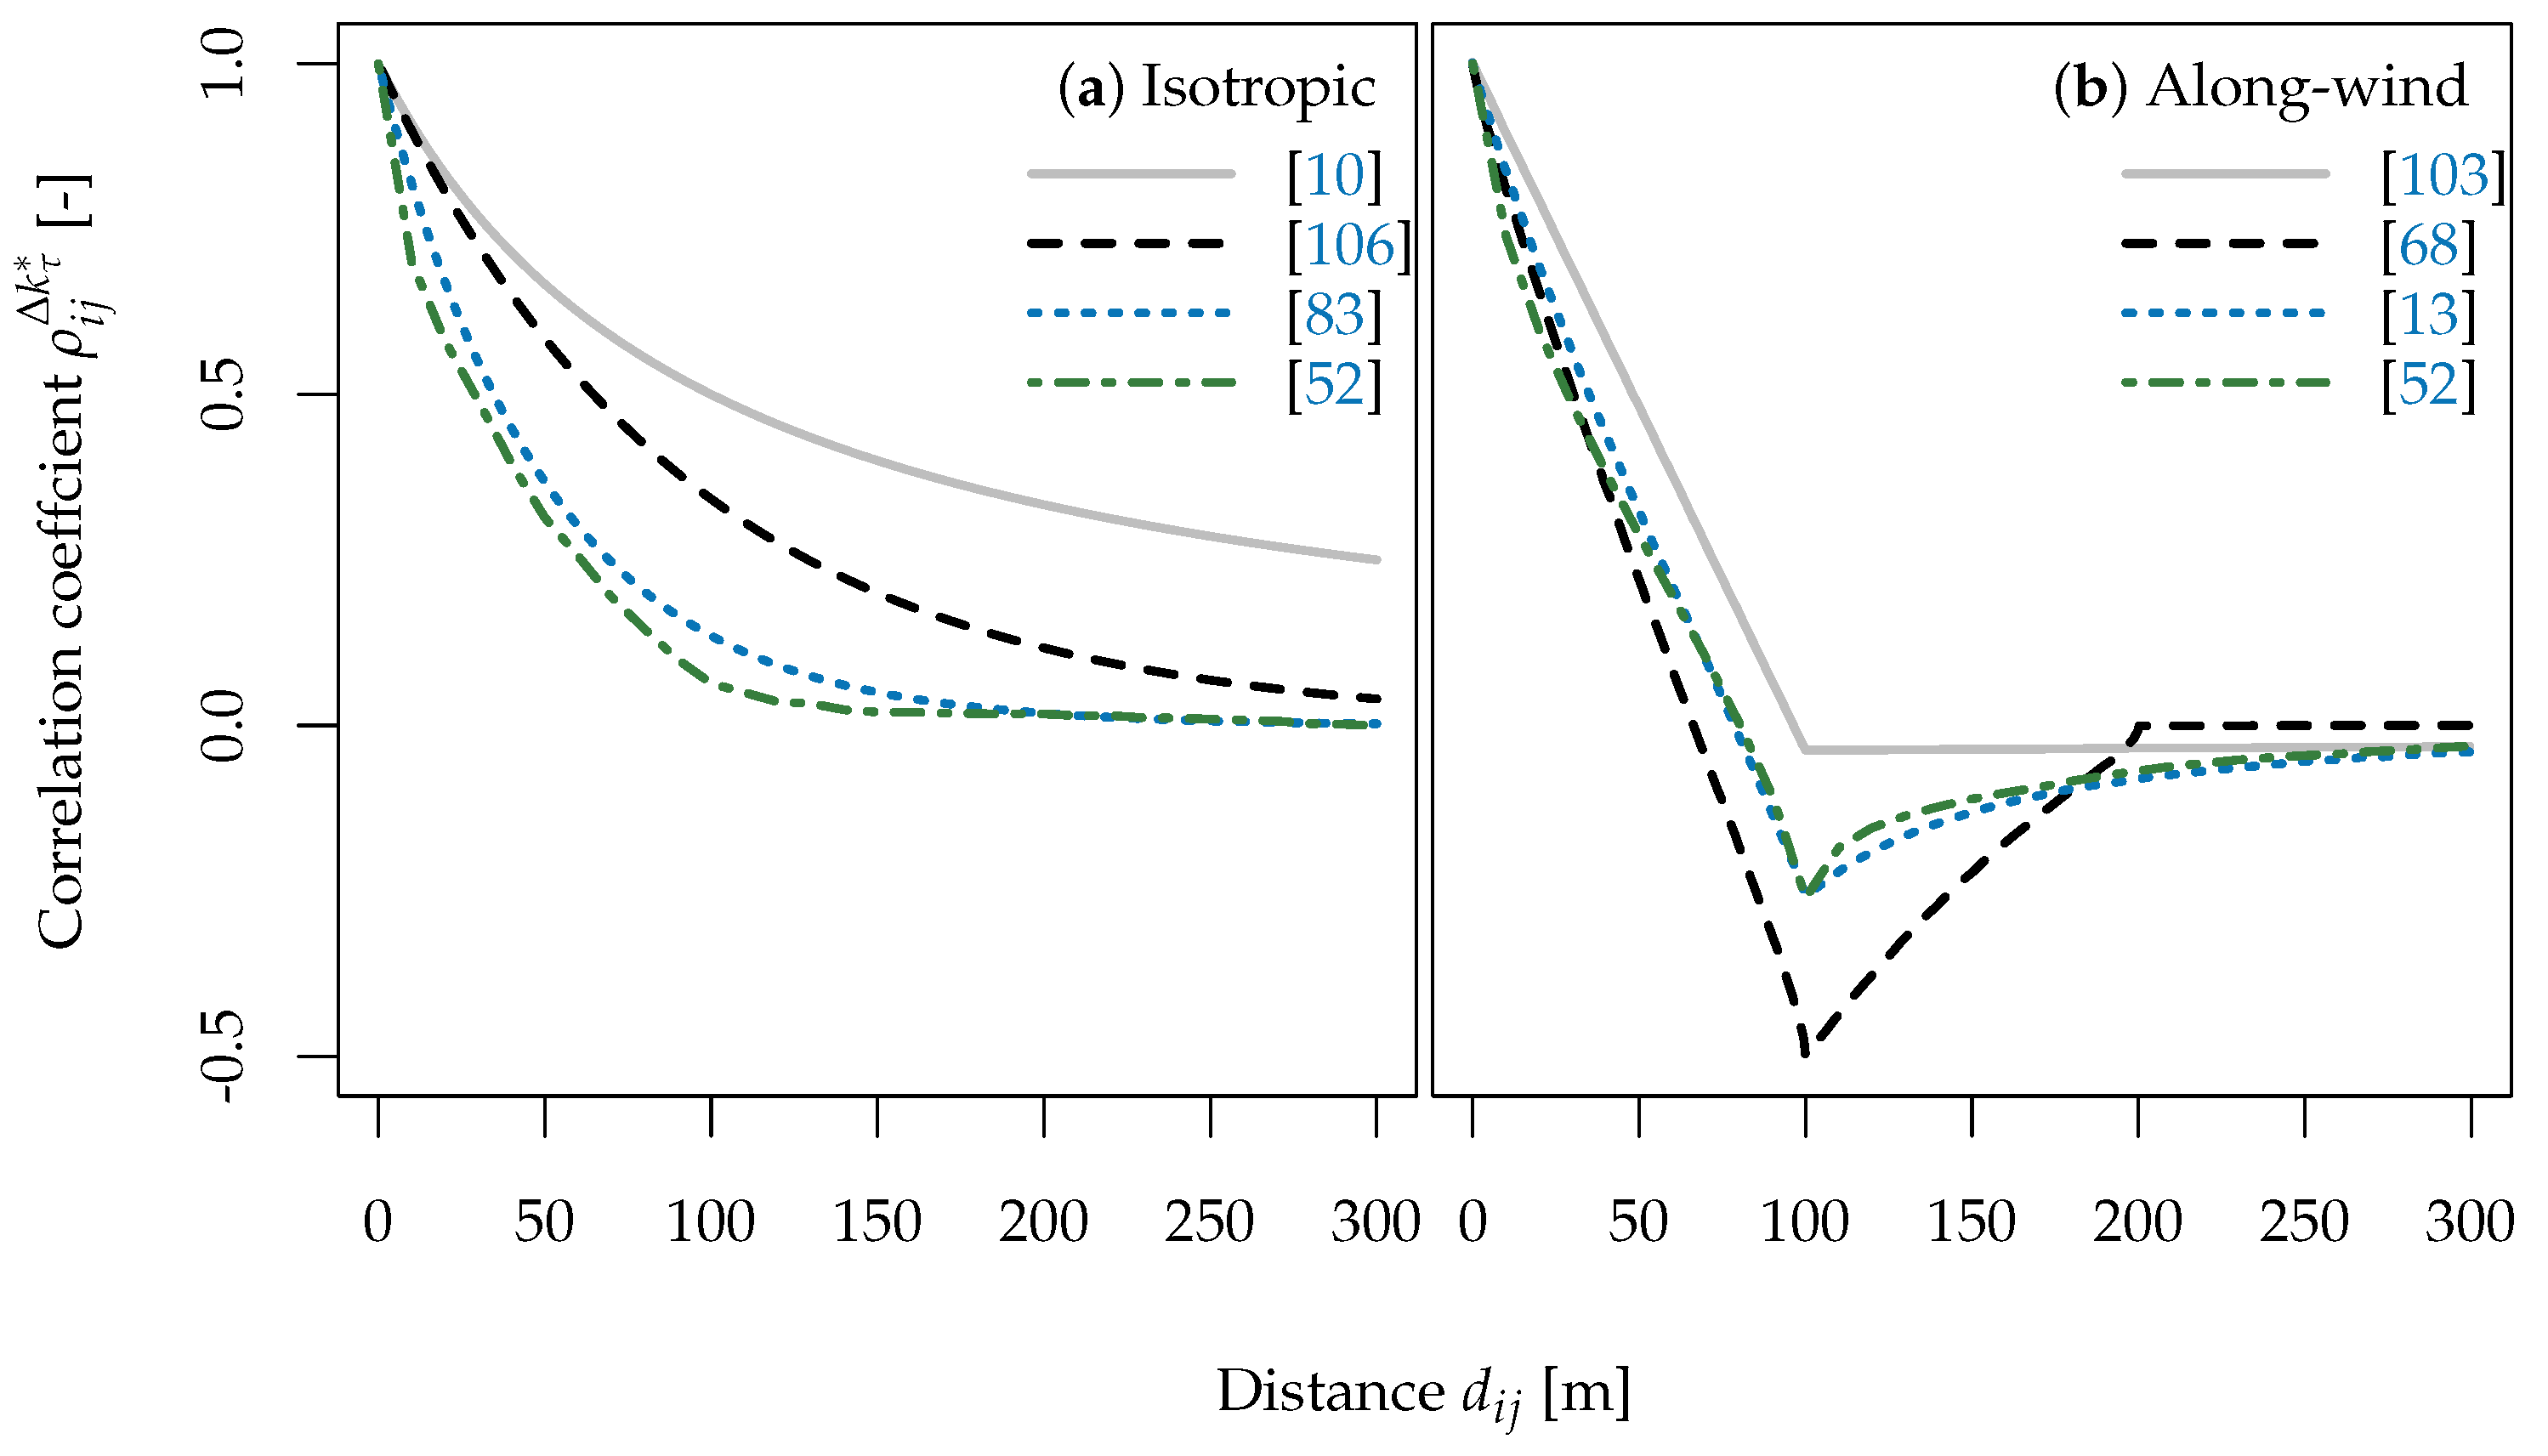
Increment correlations (in both time and space) have been shown to depend on effective cloud speed [10,28], different daily variability categories [13,97], and short-term sky types [51]. Moreover, correlation coefficients can be influenced by the sensor pair orientation relative to the direction of cloud motion [49,52,68,71,103]. For all measures and approaches considered, increment correlation structures consistently decrease with increasing pair distance, and the rate of decrease becomes smaller (longer decorrelation distances) when considering larger-increment time steps. Along-wind increment correlation structures have also been suggested to feature negative peaks, with correlation coefficients reaching values between 0.5 < ρ i j k τ < 0 [12,13,49,70,71].
Several methods have been suggested to simulate increment correlation structures for specific time scales. Many authors have employed empirical fits to measured data [10,13,70,97,103,104,106], while others used simplified cloud shapes generated by randomly positioned and subsequently blurred squares [70], unions of randomly positioned discs [68], double-sigmoidal clear-sky index deviations [71], or fractal structures [52]. For example, k increment correlation structures were extracted from hourly satellite-derived irradiance data, with pair distances in the range of 10   km d i j 300   km [10]. Taking increment time lags of 1   h τ 4   h and estimated relative cloud speed v into account, the correlation structure was estimated as ρ i j k τ = ( 1 + d i j · τ 1 · v 1 ) 1 , implying a linear interrelation between pair distance d i j and time lag τ for fixed values of ρ i j k τ . Similar implications were made by other proposed models, for example ρ i j k τ = exp ( d i j · ln ( 0.2 ) · 1.5 1 · τ 1 · v 1 ) [106] and ρ i j k τ = exp ( d i j 0.5 · τ · v ) [70,83]. These models were obtained as curve fits from different data with relatively coarse spatiotemporal resolutions.
Figure 7 contrasts estimated clear-sky index increment correlation structures ρ i j k τ as a function of distance d i j for increment time scale τ = 10 s and cloud speed v = 10 ms−1, based on several proposed models [10,13,52,68,83,103,106]. Isotropic structures obtained without regards to the direction of cloud motion and structures calculated along the main wind direction are respectively considered in panels (a) and (b). While each isotropic curve in panel (a) decreases monotonously from 1 towards 0 for increasing distances, the rate of decrease differs considerably between models. For example, at a pair distance of d i j 100   m , model results range between 0 ρ i j k τ 0.5 . Similarly, all along-wind correlation structures in panel (b) decrease with distinct rates for increasing distances up to d i j = 100   m , where differences between models range between 0.5 ρ i j k τ 0 . For further increasing distances d i j > 100   m , each curve transitions to its own unique character of constant or increasing correlation coefficients, approaching 0.

5. Temporal Averaging

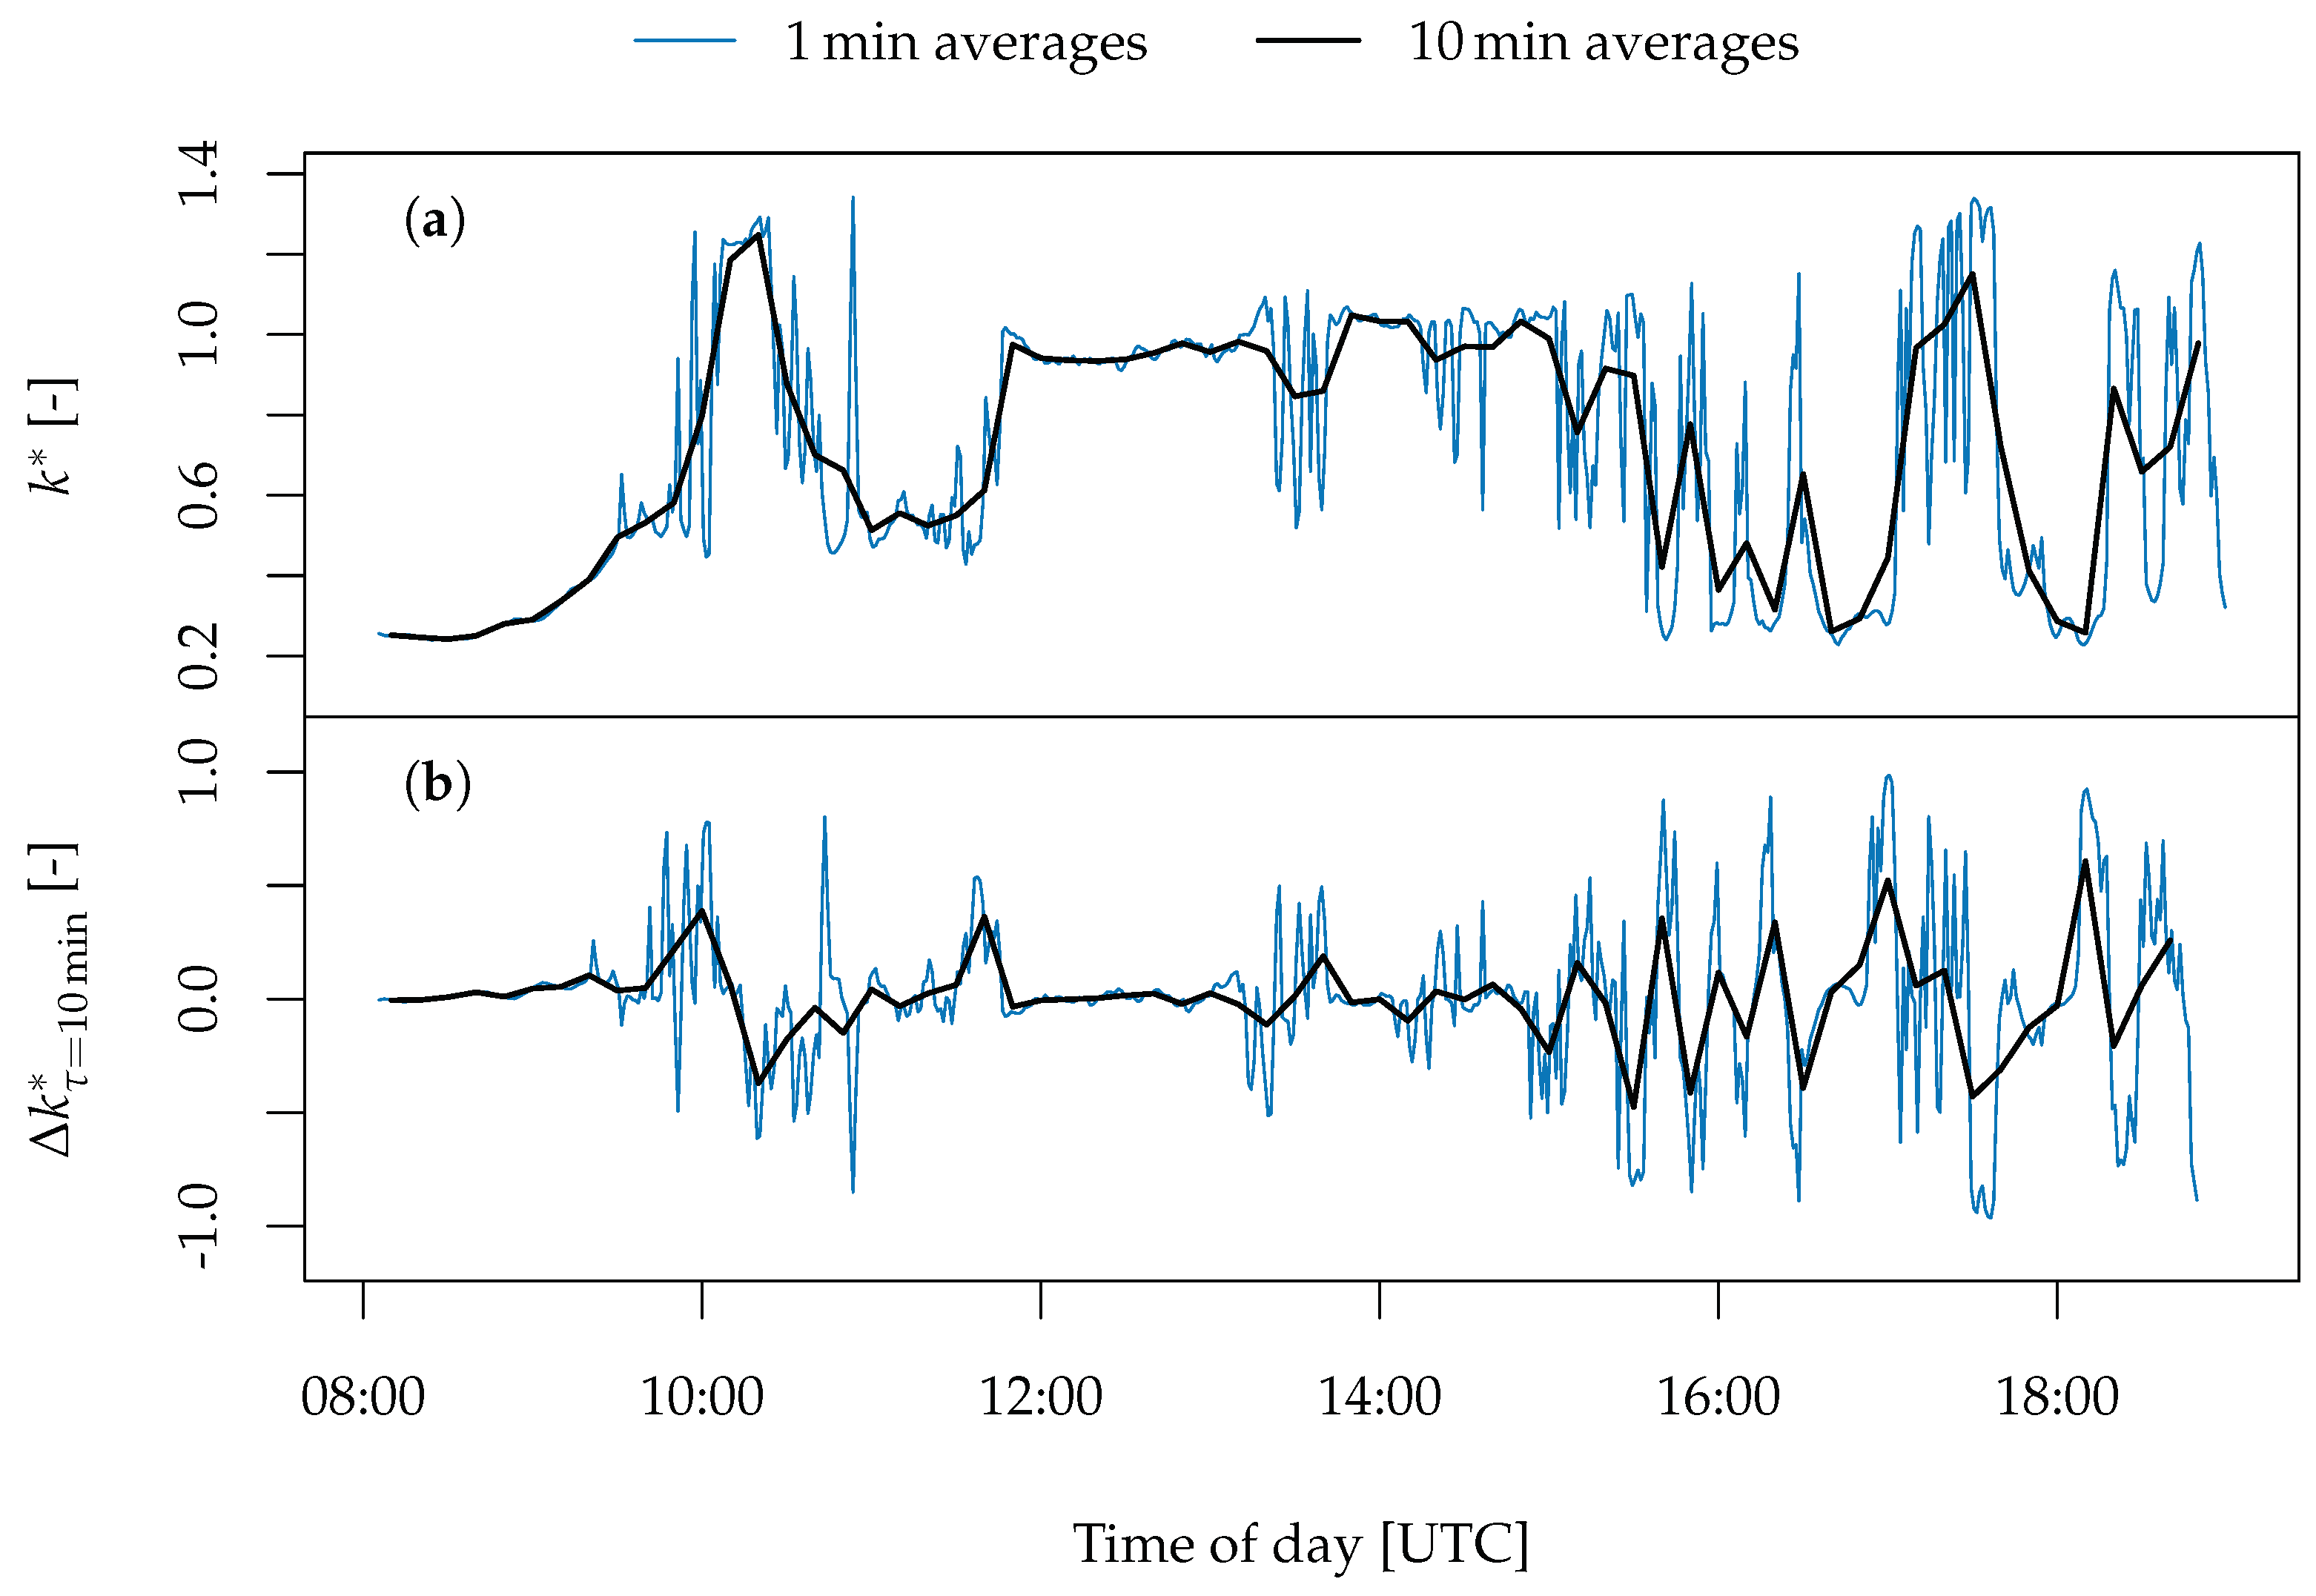
Similar to spatial averaging, irradiance variability is reduced when considering temporally averaged data. Figure 8 presents examples of such temporal averaging, based on the example period employed in the previous figures, using two different averaging periods of 1 min and 10 min. Panel (a) shows the clear-sky index time series for these averages, while panel (b) illustrates the averaging effect on 10 min increments in the clear-sky index. The misrepresentation of variability is evident for the longer averaging time in both panels.
As indicated in Section 1, ground-based solar irradiance observations have often been averaged using a range of different temporal resolutions (from hours to fractions of a second), and there is no broad agreement on the ideal temporal resolution best-suited to record all relevant variability. Early studies showed temporal averaging on time scales larger than minutes to introduce considerable smoothing to the clear-sky index, and to affect its probability distribution [23,24]. More recent analyses have concluded that the temporal resolution required to determine irradiance variability across time scales may be as small as 0.1 s [17,63,65], 0.4 s [16], or 1 s [111]. The studies that argued for second-or-higher resolutions were based on
  • determining instantaneous irradiance variations for each of a few hundred days in spring and summer by calculating the second temporal derivative of each observation, considering the minimum (i.e., negative) value of a day’s derivatives to represent the day’s most severe fluctuation, and then computing an ideal averaging time by assuming the variations to feature parabolic shapes and accepting an error of 10 Wm−2 in the measurements [17];
  • assessing the reduction of the standard deviation of an irradiance time series (measured during 7 h on a single summer’s day) as a function of increasing averaging time scales [63];
  • separately studying the variability index and the variability score of irradiance for seven selected days as functions of increasing averaging time scales [16]; and
  • characterizing the changes of k and k τ standard deviations as a function of averaging time using thousands of hours worth of irradiance observations with raw temporal resolutions ranging from 0.01 through 1 s [111].
In addition to these differences in methods and quantity of data, some of the studies were limited to specific geographic areas (i.e., Southern Norway [17], Southern Finland [63], and Eastern Canada [16]), whereas another compared data from four different regions in the Northern Hemisphere (i.e., Eastern Canada, Germany, Hawaii, and Arizona) [111].
In practice, the effectively necessary temporal resolution of data strongly depends on the spatial scale considered. On the one hand, fluctuations of up to ± 50 % from one second to the next (and changes of more than 90% within 20 s) have been documented in the feed-in of a relatively small 48 kWp PV plant [56]. On the other hand, considerably larger multi-megawatt utility-scale PV plants may not require highly resolved measurements on the order of seconds for monitoring purposes [150], while minute-averaged observations may be resolved too coarsely [26].
In view of the relatively small number of high-resolution datasets available to date, several methods have been proposed to downscale more easily-accessible low-resolution data to smaller scales. For example, Markov-model-based approaches have been applied to 15-min PV power [118], hourly irradiance [112], hourly weather observations [69,109], or daily clearness index [151], in order to simulate variability on temporal scales well below those of the input data. Other downscaling approaches include providing a library of representative high-resolution irradiance samples [152] as well as simulating changes in the clear-sky index differently for different classes of variability [100,117]. A number of other sophisticated methods have been proposed to simulate relatively high-resolution data in time and/or space (using, for example, copulas or Markov chains), but without conditioning to large-scale information [27,41,61,105,153,154]. While these last-mentioned approaches were not specifically designed to downscale coarsely resolved real-world measurements, they can likely be adapted for this purpose.

6. Conclusions

This article concisely reviews recently published essentials from the literature regarding the quantification and small-scale averaging of irradiance variability in time and space. Complementing previous textbooks and literature reviews [15,119,120,121,122,123,124,125,126,127,128,129,130,131,132,133], the paper emphasizes relatively small sub-minute scales below about 10 km. Despite the many articles touching on the subject of irradiance variability, suitable high-resolution measurement data are still relatively scarce. While some small-scale irradiance data have been publicly released (e.g., [72,73,74,75,76]), there is still a need for more high-resolution measurements to robustly validate previous findings [52]. Granting open access to such data and corresponding models is considered best practice in order to foster scientific discussion and facilitate knowledge-based energy policies [155].
Beyond the collection of more suitable in-situ data, and with new satellite generations such as Meteosat Third Generation (MTG) in the pipeline, future efforts may also be geared towards inferring characteristics of small-scale variability from large-scale spaceborne observations. Two initial studies show great promise in this regard [67,99]. Both can be developed further in order to estimate complex climatological variability characteristics [67], and to eventually nowcast the character of short-term volatility in real time [99].
With regards to the applicability of irradiance variability research to PV power systems, there is a need for considering variability in irradiance on tilted surfaces as well as its effects on the processes of energy conversion. While most of the research presented in this review has been based on global horizontal irradiance, PV systems typically feature tilted modules. On a daily basis, irradiance variability has been shown to be higher on an inclined plane than on the horizontal [6,156], but corresponding analyses of high-resolution sub-minute data are still lacking. Likewise, an extensive validation of models separating direct and diffuse irradiance (a necessary step to predict irradiance on an inclined plane as a function of GHI) is not yet possible on sub-minute scales for lack of suitable data (it has, however, recently been performed using minute-scale data [157,158]). In general, small-scale specific phenomena such as cloud enhancement may call for future adaptations and extensions of well-established large-scale-based methods and conclusions [159].
The studies covered by this review have unanimously identified clouds as the dominant source of short-term fluctuations in surface irradiance and photovoltaic power. Beyond that, aerosols have been shown to considerably affect irradiance variability as well, albeit on relatively large spatiotemporal scales and with an emphasis on concentrated solar power applications [160,161,162,163,164,165,166,167,168,169,170,171]. In consideration of extreme dust events, such as forest fires or sand storms (which can quickly generate large numbers of aerosols [172]), aerosol-induced small-scale irradiance variability could be non-negligible and further research is necessary in this regard. However, corresponding high-quality data sets of both aerosol optical depth and surface irradiance are relatively difficult to obtain [160], especially on the small scales considered in this review.

Funding

This research was partly funded by the German Federal Ministry of Education and Research (Bundesministerium für Bildung und Forschung; BMBF) grant number 03ET4027B.

Acknowledgments

This article is based in part on the preface of the author’s doctoral thesis [173]. Co-supervisor Adam H. Monahan of the University of Victoria, BC, Canada, and external reviewer Jan Kleissl of the University of California, San Diego, USA, are gratefully acknowledged for suggesting to go the extra mile and turn the text into this review paper. Additional comments made by three anonymous reviewers have further extended and improved the work. Some of the data displayed in Figure 7b have been extracted from a digitized plot of Elsinga and van Sark [71] (cf. their Figure 2). The remaining figures of this article are based on data courtesy of Andreas Macke of the Leibniz Institute for Tropospheric Research (TROPOS), Leipzig, Germany. Said data were collected during the HOPE campaign [138,139] and are readily available online [74]. The open access publication fund at the University of Oldenburg and the corresponding financial support of the German Research Foundation (DFG) are acknowledged for covering the costs to publish this paper in open access.

Conflicts of Interest

The author declares no conflict of interest.

References

  1. Solar Power Europe (SPE). Solar Market Report & Membership Directory; Publishing Events Ltd.: London, UK, 2016. [Google Scholar]
  2. REN21. Renewables 2016 Global Status Report; Technical report; REN21 Secretariat: Paris, France, 2016. [Google Scholar]
  3. Haegel, N.M.; Margolis, R.; Buonassisi, T.; Feldman, D.; Froitzheim, A.; Garabedian, R.; Green, M.; Glunz, S.; Henning, H.M.; Holder, B.; et al. Terawatt-scale photovoltaics: Trajectories and challenges. Science 2017, 356, 141–143. [Google Scholar] [CrossRef] [PubMed] [Green Version]
  4. Stetz, T.; von Appen, J.; Niedermeyer, F.; Scheibner, G.; Sikora, R.; Braun, M. Twilight of the grids: The impact of distributed solar on Germany’s energy transition. IEEE Power Energy Mag. 2015, 13, 50–61. [Google Scholar] [CrossRef]
  5. Perez, R.; Rábago, K.R.; Trahan, M.; Rawlings, L.; Norris, B.; Hoff, T.; Putnam, M.; Perez, M. Achieving very high PV penetration—The need for an effective electricity remuneration framework and a central role for grid operators. Energy Policy 2016, 96, 27–35. [Google Scholar] [CrossRef]
  6. Suri, M.; Huld, T.; Dunlop, E.; Albuisson, M.; Lefevre, M.; Wald, L. Uncertainties in solar electricity yield prediction from fluctuation of solar radiation. In Proceedings of the 22nd European Photovoltaic Solar Energy Conference, Milan, Italy, 3–7 September 2007. [Google Scholar]
  7. Bridier, L.; David, M.; Lauret, P. Optimal design of a storage system coupled with intermittent renewables. Renew. Energy 2014, 67, 2–9. [Google Scholar] [CrossRef]
  8. Denholm, P.; Hand, M. Grid flexibility and storage required to achieve very high penetration of variable renewable electricity. Energy Policy 2011, 39, 1817–1830. [Google Scholar] [CrossRef]
  9. Widén, J.; Wäckelgård, E.; Paatero, J.; Lund, P. Impacts of distributed photovoltaics on network voltages: Stochastic simulations of three Swedish low-voltage distribution grids. Electr. Power Syst. Res. 2010, 80, 1562–1571. [Google Scholar] [CrossRef] [Green Version]
  10. Hoff, T.E.; Perez, R. Modeling PV fleet output variability. Solar Energy 2012, 86, 2177–2189. [Google Scholar] [CrossRef]
  11. Mills, A.; Ahlstrom, M.; Brower, M.; Ellis, A.; George, R.; Hoff, T.; Kroposki, B.; Lenox, C.; Miller, N.; Milligan, M.; et al. Dark Shadows. IEEE Power Energy Mag. 2011, 9, 33–41. [Google Scholar] [CrossRef] [Green Version]
  12. Perez, R.; Kivalov, S.; Schlemmer, J.; Hemker, K., Jr.; Hoff, T.E. Short-term irradiance variability: Preliminary estimation of station pair correlation as a function of distance. Solar Energy 2012, 86, 2170–2176. [Google Scholar] [CrossRef]
  13. Widén, J. A model of spatially integrated solar irradiance variability based on logarithmic station-pair correlations. Solar Energy 2015, 122, 1409–1424. [Google Scholar] [CrossRef]
  14. Lave, M.; Kleissl, J.; Arias-Castro, E. High-frequency irradiance fluctuations and geographic smoothing. Solar Energy 2012, 86, 2190–2199. [Google Scholar] [CrossRef]
  15. Widén, J.; Carpman, N.; Castellucci, V.; Lingfors, D.; Olauson, J.; Remouit, F.; Bergkvist, M.; Grabbe, M.; Waters, R. Variability assessment and forecasting of renewables: A review for solar, wind, wave and tidal resources. Renew. Sustain. Energy Rev. 2015, 44, 356–375. [Google Scholar] [CrossRef]
  16. Gagné, A.; Turcotte, D.; Goswamy, N.; Poissant, Y. High resolution characterisation of solar variability for two sites in Eastern Canada. Solar Energy 2016, 137, 46–54. [Google Scholar] [CrossRef]
  17. Yordanov, G.; Saetre, T.; Midtgard, O.M. Optimal temporal resolution for detailed studies of cloud-enhanced sunlight (Overirradiance). In Proceedings of the 2013 IEEE 39th Photovoltaic Specialists Conference (PVSC), Tampa, Fl, USA, 16–21 June 2013; pp. 985–988. [Google Scholar] [CrossRef]
  18. Klima, K.; Apt, J. Geographic smoothing of solar PV: Results from Gujarat. Environ. Res. Lett. 2015, 10, 104001. [Google Scholar] [CrossRef]
  19. Perez, R.; David, M.; Hoff, T.E.; Jamaly, M.; Kivalov, S.; Kleissl, J.; Lauret, P.; Perez, M. Spatial and temporal variability of solar energy. Found. Trends Renew. Energy 2016, 1, 1–44. [Google Scholar] [CrossRef]
  20. Liu, B.Y.; Jordan, R.C. The interrelationship and characteristic distribution of direct, diffuse and total solar radiation. Solar Energy 1960, 4, 1–19. [Google Scholar] [CrossRef]
  21. Bendt, P.; Collares-Pereira, M.; Rabl, A. The frequency distribution of daily insolation values. Solar Energy 1981, 27, 1–5. [Google Scholar] [CrossRef]
  22. Jurado, M.; Caridad, J.; Ruiz, V. Statistical distribution of the clearness index with radiation data integrated over five minute intervals. Solar Energy 1995, 55, 469–473. [Google Scholar] [CrossRef]
  23. Skartveit, A.; Olseth, J. The probability density and autocorrelation of short-term global and beam irradiance. Solar Energy 1992, 49, 477–487. [Google Scholar] [CrossRef]
  24. Suehrcke, H.; McCormick, P.G. The frequency distribution of instantaneous insolation values. Solar Energy 1988, 40, 413–422. [Google Scholar] [CrossRef]
  25. Tomson, T.; Tamm, G. Short-term variability of solar radiation. Solar Energy 2006, 80, 600–606. [Google Scholar] [CrossRef]
  26. Van Haaren, R.; Morjaria, M.; Fthenakis, V. Empirical assessment of short-term variability from utility-scale solar PV plants. Prog. Photovolt. Res. Appl. 2014, 22, 548–559. [Google Scholar] [CrossRef]
  27. Munkhammar, J.; Widén, J. An autocorrelation-based copula model for generating realistic clear-sky index time-series. Solar Energy 2017, 158, 9–19. [Google Scholar] [CrossRef]
  28. Hoff, T.E.; Perez, R. Quantifying PV power output variability. Solar Energy 2010, 84, 1782–1793. [Google Scholar] [CrossRef]
  29. Perez, R.; Kivalov, S.; Schlemmer, J.; Hemker, K.; Hoff, T. Parameterization of site-specific short-term irradiance variability. Solar Energy 2011, 85, 1343–1353. [Google Scholar] [CrossRef]
  30. Soriga, I.; Badescu, V. Thermal inertia of flat-plate solar collectors in different radiative regimes. Energy Convers. Manag. 2016, 111, 27–37. [Google Scholar] [CrossRef]
  31. Badescu, V.; Budea, S. How significant is the stability of the radiative regime when the best operation of solar DHW systems is evaluated? Renew. Energy 2016, 88, 346–358. [Google Scholar] [CrossRef]
  32. Brabec, M.; Paulescu, M.; Badescu, V. Statistical properties of clear and dark duration lengths. Solar Energy 2017, 153, 508–518. [Google Scholar] [CrossRef]
  33. Brabec, M.; Badescu, V.; Paulescu, M. Cloud shade by dynamic logistic modeling. J. Appl. Stat. 2014, 41, 1174–1188. [Google Scholar] [CrossRef]
  34. Brabec, M.; Paulescu, M.; Badescu, V. Generalized additive models for nowcasting cloud shading. Solar Energy 2014, 101, 272–282. [Google Scholar] [CrossRef]
  35. Badescu, V.; Paulescu, M. Statistical properties of the sunshine number illustrated with measurements from Timisoara (Romania). Atmos. Res. 2011, 101, 194–204. [Google Scholar] [CrossRef]
  36. Paulescu, M.; Badescu, V.; Brabec, M. Tools for PV (photovoltaic) plant operators: Nowcasting of passing clouds. Energy 2013, 54, 104–112. [Google Scholar] [CrossRef]
  37. Brabec, M.; Badescu, V.; Paulescu, M. Nowcasting sunshine number using logistic modeling. Meteorol. Atmos. Phys. 2013, 120, 61–71. [Google Scholar] [CrossRef]
  38. Badescu, V.; Paulescu, M. Autocorrelation properties of the sunshine number and sunshine stability number. Meteorol. Atmos. Phys. 2011, 112, 139–154. [Google Scholar] [CrossRef]
  39. Paulescu, M.; Badescu, V. New approach to measure the stability of the solar radiative regime. Theor. Appl. Climatol. 2011, 103, 459–470. [Google Scholar] [CrossRef]
  40. Paulescu, M.; Badescu, V.; Brabec, M. Retrieval of effective cloud field parameters from radiometric data. Theor. Appl. Climatol. 2018, 133, 437–446. [Google Scholar] [CrossRef]
  41. Munkhammar, J.; Widén, J.; Hinkelman, L.M. A copula method for simulating correlated instantaneous solar irradiance in spatial networks. Solar Energy 2017, 143, 10–21. [Google Scholar] [CrossRef]
  42. Woyte, A.; Van Thong, V.; Belmans, R.; Nijs, J. Voltage fluctuations on distribution level introduced by photovoltaic systems. IEEE Trans. Energy Convers. 2006, 21, 202–209. [Google Scholar] [CrossRef]
  43. Woyte, A.; Belmans, R.; Nijs, J. Localized spectral analysis of fluctuating power generation from solar energy systems. EURASIP J. Adv. Signal Process. 2007, 2007. [Google Scholar] [CrossRef]
  44. Anvari, M.; Lohmann, G.; Wächter, M.; Milan, P.; Lorenz, E.; Heinemann, D.; Tabar, M.R.R.; Peinke, J. Short term fluctuations of wind and solar power systems. New J. Phys. 2016, 18, 063027. [Google Scholar] [CrossRef] [Green Version]
  45. Barry, J.; Munzke, N.; Thomas, J. Power fluctuations in solar-storage clusters: Spatial correlation and battery response times. Energy Procedia 2017, 135, 379–390. [Google Scholar] [CrossRef]
  46. Bosch, J.; Kleissl, J. Cloud motion vectors from a network of ground sensors in a solar power plant. Solar Energy 2013, 95, 13–20. [Google Scholar] [CrossRef]
  47. Calif, R.; Schmitt, F.G.; Huang, Y.; Soubdhan, T. Intermittency study of high frequency global solar radiation sequences under a tropical climate. Solar Energy 2013, 98, 349–365. [Google Scholar] [CrossRef]
  48. Dyreson, A.R.; Morgan, E.R.; Monger, S.H.; Acker, T.L. Modeling solar irradiance smoothing for large PV power plants using a 45-sensor network and the Wavelet Variability Model. Solar Energy 2014, 110, 482–495. [Google Scholar] [CrossRef]
  49. Hinkelman, L.M. Differences between along-wind and cross-wind solar irradiance variability on small spatial scales. Solar Energy 2013, 88, 192–203. [Google Scholar] [CrossRef]
  50. Lave, M.; Reno, M.J.; Broderick, R.J. Characterizing local high-frequency solar variability and its impact to distribution studies. Solar Energy 2015, 118, 327–337. [Google Scholar] [CrossRef]
  51. Lohmann, G.M.; Monahan, A.H.; Heinemann, D. Local short-term variability in solar irradiance. Atmos. Chem. Phys. 2016, 16, 6365–6379. [Google Scholar] [CrossRef] [Green Version]
  52. Lohmann, G.M.; Hammer, A.; Monahan, A.H.; Schmidt, T.; Heinemann, D. Simulating clear-sky index increment correlations under mixed sky conditions using a fractal cloud model. Solar Energy 2017, 150, 255–264. [Google Scholar] [CrossRef]
  53. Lorenzo, A.T.; Holmgren, W.F.; Cronin, A.D. Irradiance forecasts based on an irradiance monitoring network, cloud motion, and spatial averaging. Solar Energy 2015, 122, 1158–1169. [Google Scholar] [CrossRef] [Green Version]
  54. Madhavan, B.L.; Deneke, H.; Witthuhn, J.; Macke, A. Multiresolution analysis of the spatiotemporal variability in global radiation observed by a dense network of 99 pyranometers. Atmos. Chem. Phys. 2017, 17, 3317–3338. [Google Scholar] [CrossRef] [Green Version]
  55. Marcos, J.; Marroyo, L.; Lorenzo, E.; Alvira, D.; Izco, E. From irradiance to output power fluctuations: The PV plant as a low pass filter. Prog. Photovolt. Res. Appl. 2011, 19, 505–510. [Google Scholar] [CrossRef] [Green Version]
  56. Marcos, J.; Marroyo, L.; Lorenzo, E.; Alvira, D.; Izco, E. Power output fluctuations in large scale PV plants: One year observations with one second resolution and a derived analytic model. Prog. Photovolt. Res. Appl. 2011, 19, 218–227. [Google Scholar] [CrossRef] [Green Version]
  57. Monger, S.H.; Morgan, E.R.; Dyreson, A.R.; Acker, T.L. Applying the kriging method to predicting irradiance variability at a potential PV power plant. Renew. Energy 2016, 86, 602–610. [Google Scholar] [CrossRef]
  58. Perpiñán, O.; Lorenzo, E. Analysis and synthesis of the variability of irradiance and PV power time series with the wavelet transform. Solar Energy 2011, 85, 188–197. [Google Scholar] [CrossRef] [Green Version]
  59. Schmidt, T.; Kalisch, J.; Lorenz, E.; Heinemann, D. Evaluating the spatio-temporal performance of sky-imager-based solar irradiance analysis and forecasts. Atmos. Chem. Phys. 2016, 16, 3399–3412. [Google Scholar] [CrossRef] [Green Version]
  60. Tabar, M.R.R.; Anvari, M.; Lohmann, G.; Heinemann, D.; Wächter, M.; Milan, P.; Lorenz, E.; Peinke, J. Kolmogorov spectrum of renewable wind and solar power fluctuations. Eur. Phys. J. Spec. Top. 2014, 223, 1–8. [Google Scholar] [CrossRef]
  61. Widén, J.; Shepero, M.; Munkhammar, J. On the properties of aggregate clear-sky index distributions and an improved model for spatially correlated instantaneous solar irradiance. Solar Energy 2017, 157, 566–580. [Google Scholar] [CrossRef]
  62. Yordanov, G.H.; Saetre, T.O.; Midtgård, O.M. Extreme overirradiance events in Norway: 1.6 suns measured close to 60° N. Solar Energy 2015, 115, 68–73. [Google Scholar] [CrossRef]
  63. Torres Lobera, D.; Mäki, A.; Huusari, J.; Lappalainen, K.; Suntio, T.; Valkealahti, S. Operation of TUT solar PV power station research plant under partial shading caused by snow and buildings. Int. J. Photoenergy 2013, 2013. [Google Scholar] [CrossRef]
  64. Yordanov, G.; Midtgård, O.M.; Saetre, T.; Nielsen, H.; Norum, L. Overirradiance (cloud enhancement) events at high latitudes. IEEE J. Photovolt. 2013, 3, 271–277. [Google Scholar] [CrossRef]
  65. Yordanov, G.H.; Saetre, T.O.; Midtgard, O.M. 100-millisecond Resolution for Accurate Overirradiance Measurements. IEEE J. Photovolt. 2013, 3, 1354–1360. [Google Scholar] [CrossRef]
  66. Driesse, A.; Stein, J.S.; Riley, D.; Carmignani, C. Sampling and Filtering in Photovoltaic System Performance Monitoring; Sandia National Laboratories: Albuquerque, NM, USA, 2014; Volume 12, p. 2016.
  67. Lave, M.; Broderick, R.J.; Reno, M.J. Solar variability zones: Satellite-derived zones that represent high-frequency ground variability. Solar Energy 2017, 151, 119–128. [Google Scholar] [CrossRef]
  68. Arias-Castro, E.; Kleissl, J.; Lave, M. A Poisson model for anisotropic solar ramp rate correlations. Solar Energy 2014, 101, 192–202. [Google Scholar] [CrossRef]
  69. Bright, J.M.; Babacan, O.; Kleissl, J.; Taylor, P.G.; Crook, R. A synthetic, spatially decorrelating solar irradiance generator and application to a LV grid model with high PV penetration. Solar Energy 2017, 147, 83–98. [Google Scholar] [CrossRef]
  70. Lave, M.; Kleissl, J. Cloud speed impact on solar variability scaling—Application to the wavelet variability model. Solar Energy 2013, 91, 11–21. [Google Scholar] [CrossRef]
  71. Elsinga, B.; van Sark, W.G. Analytic model for correlations of cloud induced fluctuations of clear-sky index. Solar Energy 2017, 155, 985–1001. [Google Scholar] [CrossRef]
  72. Lorenzo, A.T.; Holmgren, W.F.; Cronin, A.D. Irradiance Monitoring Network Data and Wind Motion Vectors; Zenodo: Geneva, Switzerland, 2015. [Google Scholar] [CrossRef]
  73. Natural Resources Canada. High-Resolution Solar Radiation Datasets; Natural Resources Canada: Ottawa, ON, Canada, 2016. Available online: http://www.nrcan.gc.ca/energy/renewable-electricity/solar-photovoltaic/18409 (accessed on 13 June 2017).
  74. Standardized Atmospheric Measurement Data. HD(CP)2 Short Term Observations, sw Broadband Downwelling Radiation (Surface) Data of Pyranometer Network (no. 00), HOPE Campaign by TROPOS, Data Version 00. PID: Madhavan Bomidi. 2017. Available online: https://icdc.cen.uni-hamburg.de/index.php?id=hopetroppyrnet00l1rsds (accessed on 13 June 2017).
  75. Sengupta, M.; Andreas, A. Oahu Solar Measurement Grid (1-Year Archive): 1-s Solar Irradiance; Oahu, Hawaii (Data); Technical report; National Renewable Energy Lab. (NREL): Golden, CO, USA, 2010. [CrossRef]
  76. Schmidt, T.; Lohmann, G.M. A 10 Hz Irradiance Dataset from Oldenburg, Germany; Zenodo: Geneva, Switzerland, 2018. [Google Scholar] [CrossRef]
  77. Curtright, A.E.; Apt, J. The character of power output from utility-scale photovoltaic systems. Prog. Photovolt. Res. Appl. 2008, 16, 241–247. [Google Scholar] [CrossRef] [Green Version]
  78. Lave, M.; Kleissl, J. Solar variability of four sites across the state of Colorado. Renew. Energy 2010, 35, 2867–2873. [Google Scholar] [CrossRef]
  79. Madanchi, A.; Absalan, M.; Lohmann, G.; Anvari, M.; Reza Rahimi Tabar, M. Strong short-term non-linearity of solar irradiance fluctuations. Solar Energy 2017, 144, 1–9. [Google Scholar] [CrossRef]
  80. Anvari, M.; Werther, B.; Lohmann, G.; Wächter, M.; Peinke, J.; Beck, H.P. Suppressing power output fluctuations of photovoltaic power plants. Solar Energy 2017, 157, 735–743. [Google Scholar] [CrossRef]
  81. Schmietendorf, K.; Peinke, J.; Kamps, O. The impact of turbulent renewable energy production on power grid stability and quality. Eur. Phys. J. B 2017, 90, 222. [Google Scholar] [CrossRef]
  82. Vindel, J.; Polo, J. Intermittency and variability of daily solar irradiation. Atmos. Res. 2014, 143, 313–327. [Google Scholar] [CrossRef]
  83. Lave, M.; Kleissl, J.; Stein, J.S. A wavelet-based variability model (WVM) for solar PV power plants. IEEE Trans. Sustain. Energy 2013, 4, 501–509. [Google Scholar] [CrossRef]
  84. Woyte, A.; Nijs, J.; Belmans, R. Partial shadowing of photovoltaic arrays with different system configurations: Literature review and field test results. Solar Energy 2003, 74, 217–233. [Google Scholar] [CrossRef]
  85. Pareek, S.; Dahiya, R. Enhanced power generation of partial shaded photovoltaic fields by forecasting the interconnection of modules. Energy 2016, 95, 561–572. [Google Scholar] [CrossRef]
  86. Belhaouas, N.; Cheikh, M.S.A.; Agathoklis, P.; Oularbi, M.R.; Amrouche, B.; Sedraoui, K.; Djilali, N. PV array power output maximization under partial shading using new shifted PV array arrangements. Appl. Energy 2017, 187, 326–337. [Google Scholar] [CrossRef]
  87. Kurtz, B.; Kleissl, J. Measuring diffuse, direct, and global irradiance using a sky imager. Solar Energy 2016. [Google Scholar] [CrossRef]
  88. Urquhart, B.; Kurtz, B.; Dahlin, E.; Ghonima, M.; Shields, J.E.; Kleissl, J. Development of a sky imaging system for short-term solar power forecasting. Atmos. Meas. Tech. 2015, 8, 875–890. [Google Scholar] [CrossRef] [Green Version]
  89. Yang, H.; Kurtz, B.; Nguyen, D.; Urquhart, B.; Chow, C.W.; Ghonima, M.; Kleissl, J. Solar irradiance forecasting using a ground-based sky imager developed at UC San Diego. Solar Energy 2014, 103, 502–524. [Google Scholar] [CrossRef]
  90. Chauvin, R.; Nou, J.; Thil, S.; Grieu, S. Modelling the clear-sky intensity distribution using a sky imager. Solar Energy 2015, 119, 1–17. [Google Scholar] [CrossRef]
  91. Gohari, M.; Urquhart, B.; Yang, H.; Kurtz, B.; Nguyen, D.; Chow, C.; Ghonima, M.; Kleissl, J. Comparison of solar power output forecasting performance of the Total Sky Imager and the University of California, San Diego Sky Imager. Energy Procedia 2014, 49, 2340–2350. [Google Scholar] [CrossRef]
  92. Schmidt, T.; Calais, M.; Roy, E.; Burton, A.; Heinemann, D.; Kilper, T.; Carter, C. Short-term solar forecasting based on sky images to enable higher PV generation in remote electricity networks. Renew. Energy Environ. Sustain. 2017, 2, 23. [Google Scholar] [CrossRef] [Green Version]
  93. Jazayeri, M.; Jazayeri, K.; Uysal, S. Generation of spatially dispersed irradiance time-series based on real cloud patterns. Solar Energy 2017, 158, 977–994. [Google Scholar] [CrossRef]
  94. Nou, J.; Chauvin, R.; Eynard, J.; Thil, S.; Grieu, S. Towards the intrahour forecasting of direct normal irradiance using sky-imaging data. Heliyon 2018, 4, e00598. [Google Scholar] [CrossRef] [PubMed]
  95. Anagnostos, D.; Schmidt, T.; Cavadias, S.; Soudris, D.; Poortmans, J.; Catthoor, F. A Method for Detailed, Short-Term Energy Yield Forecasting of Photovoltaic Installations. Renew. Energy 2018. [Google Scholar] [CrossRef]
  96. Stein, J.S.; Hansen, C.W.; Reno, M.J. The variability index: A new and novel metric for quantifying irradiance and PV output variability. In Proceedings of the World Renewable Energy Forum, Denver, CO, USA, 13–17 May 2012; pp. 13–17. [Google Scholar]
  97. Perpiñán, O.; Marcos, J.; Lorenzo, E. Electrical power fluctuations in a network of DC/AC inverters in a large PV plant: Relationship between correlation, distance and time scale. Solar Energy 2013, 88, 227–241. [Google Scholar] [CrossRef] [Green Version]
  98. Lenox, C.; Nelson, L. Variability comparison of large-scale photovoltaic systems across diverse geographic climates. In Proceedings of the 25th European Photovoltaic Solar Energy Conference, Valencia, Spain, 6–10 September 2010. [Google Scholar]
  99. Watanabe, T.; Oishi, Y.; Nakajima, T.Y. Characterization of surface solar-irradiance variability using cloud properties based on satellite observations. Solar Energy 2016, 140, 83–92. [Google Scholar] [CrossRef]
  100. Hummon, M.; Ibanez, E.; Brinkman, G.; Lew, D. Sub-Hour Solar Data for Power System Modeling From Static Spatial Variability Analysis: Preprint; Technical report; National Renewable Energy Laboratory (NREL): Golden, CO, USA, 2012.
  101. Wolff, B.; Kühnert, J.; Lorenz, E.; Kramer, O.; Heinemann, D. Comparing support vector regression for PV power forecasting to a physical modeling approach using measurement, numerical weather prediction, and cloud motion data. Solar Energy 2016, 135, 197–208. [Google Scholar] [CrossRef]
  102. Elsinga, B.; van Sark, W. Spatial power fluctuation correlations in urban rooftop photovoltaic systems. Prog. Photovolt. Res. Appl. 2014. [Google Scholar] [CrossRef]
  103. Lonij, V.P.; Brooks, A.E.; Cronin, A.D.; Leuthold, M.; Koch, K. Intra-hour forecasts of solar power production using measurements from a network of irradiance sensors. Solar Energy 2013, 97, 58–66. [Google Scholar] [CrossRef]
  104. Mills, A. Implications of Wide-Area Geographic Diversity for Short-Term Variability of Solar Power 2010. Available online: https://cloudfront.escholarship.org/dist/prd/content/qt9mz3w055/qt9mz3w055.pdf (accessed on 3 May 2013).
  105. Munkhammar, J.; Widén, J. A Markov-chain probability distribution mixture approach to the clear-sky index. Solar Energy 2018, 170, 174–183. [Google Scholar] [CrossRef]
  106. Perez, R.; Hoff, T.; Kivalov, S. Spatial & temporal characteristics of solar radiation variability. In Proceedings of the International Solar Energy (ISES) World Congress, Kassel, Germany, 28 August–2 September 2011. [Google Scholar]
  107. Schwarz, M.; Folini, D.; Hakuba, M.Z.; Wild, M. Spatial representativeness of surface-measured variations of downward solar radiation: Spatiotemporal representativeness of SSR. J. Geophys. Res. Atmos. 2017. [Google Scholar] [CrossRef]
  108. Bengulescu, M.; Blanc, P.; Wald, L. Characterizing Temporal Variability in Measurements of Surface Solar Radiation and its Dependence on Climate. Energy Procedia 2016, 97, 164–171. [Google Scholar] [CrossRef]
  109. Bright, J.; Smith, C.; Taylor, P.; Crook, R. Stochastic generation of synthetic minutely irradiance time series derived from mean hourly weather observation data. Solar Energy 2015, 115, 229–242. [Google Scholar] [CrossRef]
  110. Hansen, C.W.; Stein, J.S.; Riley, D. Effect of Time Scale on Analysis of PV System Performance; SANDIA Report; Sandia National Laboratories: Albuquerque, NM, USA, 2012.
  111. Lohmann, G.M.; Monahan, A.H. Effects of temporal averaging on short-term irradiance variability under mixed sky conditions. Atmos. Meas. Tech. 2018, 11, 3131–3144. [Google Scholar] [CrossRef] [Green Version]
  112. Kim, I. Markov chain Monte Carlo and acceptance–rejection algorithms for synthesising short-term variations in the generation output of the photovoltaic system. IET Renew. Power Gener. 2017, 11, 878–888. [Google Scholar] [CrossRef]
  113. Perry, M.; Troccoli, A. An approach for generating synthetic fine temporal resolution solar radiation time series from hourly gridded datasets. Meteorol. Z. 2017, 26, 265–276. [Google Scholar] [CrossRef]
  114. Riley, D.M.; Cameron, C.P.; Jacob, J.A.; Granata, J.E.; Galbraith, G.M. Quantifying the effects of averaging and sampling rates on PV system and weather data. In Proceedings of the 2009 34th IEEE Photovoltaic Specialists Conference (PVSC), Washington, DC, USA, 7–12 June 2009; pp. 456–461. [Google Scholar]
  115. Huang, J.; Davy, R.J. Predicting intra-hour variability of solar irradiance using hourly local weather forecasts. Solar Energy 2016, 139, 633–639. [Google Scholar] [CrossRef]
  116. Lave, M.; Weekley, A. Comparison of high-frequency solar irradiance: Ground measured vs. satellite-derived. In Proceedings of the 2016 IEEE 43rd Photovoltaic Specialists Conference (PVSC), Portland, OR, USA, 5–10 June 2016; pp. 1101–1106. [Google Scholar]
  117. Hummon, M.; Weekley, A.; Searight, K.; Clark, K. Downscaling Solar Power Output to 4-Seconds for Use in Integration Studies: Preprint; Technical repor; National Renewable Energy Laboratory (NREL): Golden, CO, USA, 2013.
  118. Wegener, J.; Lave, M.; Luoma, J.; Kleissl, J. Temporal Downscaling of Irradiance Data via Hidden Markov Models on Wavelet Coefficients: Application to California Solar Initiative Data; Technical report; University of California San Diego: La Jolla, CA, USA, 2012. [Google Scholar]
  119. Kleissl, J. Solar Energy Forecasting and Resource Assessment; Academic Press: New York, NY, USA, 2013. [Google Scholar]
  120. Inman, R.H.; Pedro, H.T.; Coimbra, C.F. Solar forecasting methods for renewable energy integration. Prog. Energy Combust. Sci. 2013, 39, 535–576. [Google Scholar] [CrossRef]
  121. Badescu, V. Modeling Solar Radiation at the Earth’s Surface; Springer: New York, NY, USA, 2014. [Google Scholar]
  122. Diagne, M.; David, M.; Lauret, P.; Boland, J.; Schmutz, N. Review of solar irradiance forecasting methods and a proposition for small-scale insular grids. Renew. Sustain. Energy Rev. 2013, 27, 65–76. [Google Scholar] [CrossRef]
  123. Raza, M.Q.; Nadarajah, M.; Ekanayake, C. On recent advances in PV output power forecast. Solar Energy 2016, 136, 125–144. [Google Scholar] [CrossRef]
  124. Yang, D.; Kleissl, J.; Gueymard, C.A.; Pedro, H.T.; Coimbra, C.F. History and trends in solar irradiance and PV power forecasting: A preliminary assessment and review using text mining. Solar Energy 2018, 168, 60–101. [Google Scholar] [CrossRef]
  125. Barbieri, F.; Rajakaruna, S.; Ghosh, A. Very short-term photovoltaic power forecasting with cloud modeling: A review. Renew. Sustain. Energy Rev. 2017, 75, 242–263. [Google Scholar] [CrossRef]
  126. Wan, C.; Zhao, J.; Song, Y.; Xu, Z.; Lin, J.; Hu, Z. Photovoltaic and solar power forecasting for smart grid energy management. CSEE J. Power Energy Syst. 2015, 1, 38–46. [Google Scholar] [CrossRef]
  127. Antonanzas, J.; Osorio, N.; Escobar, R.; Urraca, R.; Martinez-de Pison, F.; Antonanzas-Torres, F. Review of photovoltaic power forecasting. Solar Energy 2016, 136, 78–111. [Google Scholar] [CrossRef]
  128. Van der Meer, D.; Widén, J.; Munkhammar, J. Review on probabilistic forecasting of photovoltaic power production and electricity consumption. Renew. Sustain. Energy Rev. 2018, 81, 1484–1512. [Google Scholar] [CrossRef]
  129. Graabak, I.; Korpås, M. Variability Characteristics of European Wind and Solar Power Resources—A Review. Energies 2016, 9, 449. [Google Scholar] [CrossRef]
  130. Qazi, A.; Fayaz, H.; Wadi, A.; Raj, R.G.; Rahim, N.; Khan, W.A. The artificial neural network for solar radiation prediction and designing solar systems: A systematic literature review. J. Clean. Prod. 2015, 104, 1–12. [Google Scholar] [CrossRef]
  131. Kashyap, Y.; Bansal, A.; Sao, A.K. Solar radiation forecasting with multiple parameters neural networks. Renew. Sustain. Energy Rev. 2015, 49, 825–835. [Google Scholar] [CrossRef]
  132. Voyant, C.; Notton, G.; Kalogirou, S.; Nivet, M.L.; Paoli, C.; Motte, F.; Fouilloy, A. Machine learning methods for solar radiation forecasting: A review. Renew. Energy 2017, 105, 569–582. [Google Scholar] [CrossRef]
  133. Beyer, H.G. Handling of Small Scale Structures of the Irradiance Field for Solar Energy System Analysis—A Review. Energy Procedia 2016, 97, 141–148. [Google Scholar] [CrossRef]
  134. Badescu, V.; Gueymard, C.A.; Cheval, S.; Oprea, C.; Baciu, M.; Dumitrescu, A.; Iacobescu, F.; Milos, I.; Rada, C. Computing global and diffuse solar hourly irradiation on clear sky. Review and testing of 54 models. Renew. Sustain. Energy Rev. 2012, 16, 1636–1656. [Google Scholar] [CrossRef]
  135. Gueymard, C.A. Clear-sky irradiance predictions for solar resource mapping and large-scale applications: Improved validation methodology and detailed performance analysis of 18 broadband radiative models. Solar Energy 2012, 86, 2145–2169. [Google Scholar] [CrossRef]
  136. Reno, M.J.; Hansen, C.W.; Stein, J.S. Global Horizontal Irradiance Clear Sky Models: Implementation and Analysis. In SANDIA Report SAND2012-2389; 2012. Available online: http://prod.sandia.gov/techlib/access-control.cgi/2012/122389.pdf (accessed on 4 December 2017).
  137. Lefèvre, M.; Oumbe, A.; Blanc, P.; Espinar, B.; Gschwind, B.; Qu, Z.; Wald, L.; Schroedter-Homscheidt, M.; Hoyer-Klick, C.; Arola, A.; et al. McClear: A new model estimating downwelling solar radiation at ground level in clear-sky conditions. Atmos. Meas. Tech. 2013, 6, 2403–2418. [Google Scholar] [CrossRef] [Green Version]
  138. Madhavan, B.L.; Kalisch, J.; Macke, A. Shortwave surface radiation network for observing small-scale cloud inhomogeneity fields. Atmos. Meas. Tech. 2016, 9, 1153–1166. [Google Scholar] [CrossRef]
  139. Macke, A.; Seifert, P.; Baars, H.; Barthlott, C.; Beekmans, C.; Behrendt, A.; Bohn, B.; Brueck, M.; Bühl, J.; Crewell, S.; et al. The HD(CP)2 Observational Prototype Experiment (HOPE)—An overview. Atmos. Chem. Phys. 2017, 17, 4887–4914. [Google Scholar] [CrossRef]
  140. Dumortier, D. Modelling Global and Diffuse Horizontal Irradiances under Cloudless Skies with Different Turbidities; Daylight II, JOU2-CT92-0144, Final Report; CNRS-ENTPE: Vaulx-en-Velin, France, 1995. [Google Scholar]
  141. Schade, N.H.; Macke, A.; Sandmann, H.; Stick, C. Enhanced solar global irradiance during cloudy sky conditions. Meteorol. Z. 2007, 16, 295–303. [Google Scholar] [CrossRef]
  142. Piacentini, R.D.; Salum, G.M.; Fraidenraich, N.; Tiba, C. Extreme total solar irradiance due to cloud enhancement at sea level of the NE Atlantic coast of Brazil. Renew. Energy 2011, 36, 409–412. [Google Scholar] [CrossRef]
  143. Pecenak, Z.K.; Mejia, F.A.; Kurtz, B.; Evan, A.; Kleissl, J. Simulating irradiance enhancement dependence on cloud optical depth and solar zenith angle. Solar Energy 2016, 136, 675–681. [Google Scholar] [CrossRef]
  144. Gueymard, C.A. Cloud and albedo enhancement impacts on solar irradiance using high-frequency measurements from thermopile and photodiode radiometers. Part 1: Impacts on global horizontal irradiance. Solar Energy 2017, 153, 755–765. [Google Scholar] [CrossRef]
  145. Tovar, J.; Olmo, F.J.; Alados-Arboledas, L. One-minute global irradiance probability density distributions conditioned to the optical air mass. Solar Energy 1998, 62, 387–393. [Google Scholar] [CrossRef]
  146. Olseth, J.A.; Skartveit, A. A probability density model for hourly total and beam irradiance on arbitrarily orientated planes. Solar Energy 1987, 39, 343–351. [Google Scholar] [CrossRef]
  147. Ripley, B.D. Modern Applied Statistics with S; Springer: New York, NY, USA, 2002. [Google Scholar]
  148. Friedrich, R.; Peinke, J.; Sahimi, M.; Reza Rahimi Tabar, M. Approaching complexity by stochastic methods: From biological systems to turbulence. Phys. Rep. 2011, 506, 87–162. [Google Scholar] [CrossRef]
  149. Nikulin, M.S. Three-sigma rule. In Encyclopedia of Mathematics; Facts On File, Inc.: New York, NY, USA, 2002. [Google Scholar]
  150. Woyte, A.; Richter, M.; Moser, D.; Mau, S.; Reich, N.; Jahn, U. Monitoring of photovoltaic systems: Good practices and systematic analysis. In Proceedings of the 28th European Photovoltaic Solar Energy Conference, Paris, France, 30 September–4 October 2013; pp. 3686–3694. [Google Scholar]
  151. Ngoko, B.; Sugihara, H.; Funaki, T. Synthetic generation of high temporal resolution solar radiation data using Markov models. Solar Energy 2014, 103, 160–170. [Google Scholar] [CrossRef]
  152. Hansen, C.W.; Stein, J.S.; Ellis, A. Simulation of One-Minute Power Output from Utility-Scale Photovoltaic Generation Systems; Technical Report SAND 2011-5529; Sandia National Laboratories: Albuquerque, NM, USA, 2011.
  153. Morf, H. The stochastic two-state solar irradiance model (STSIM). Solar Energy 1998, 62, 101–112. [Google Scholar] [CrossRef]
  154. Morf, H. A stochastic solar irradiance model adjusted on the Ångström–Prescott regression. Solar Energy 2013, 87, 1–21. [Google Scholar] [CrossRef]
  155. Pfenninger, S. Energy scientists must show their workings. Nat. News 2017, 542, 393. [Google Scholar] [CrossRef] [PubMed]
  156. Perpiñán, O. Statistical analysis of the performance and simulation of a two-axis tracking PV system. Solar Energy 2009, 83, 2074–2085. [Google Scholar] [CrossRef] [Green Version]
  157. Gueymard, C.A.; Ruiz-Arias, J.A. Performance of separation models to predict direct irradiance at high frequency: Validation over arid areas. In Proceedings of the EuroSun 2014 ISES Conference, Aix-les-Bains, France, 16–19 September 2014. [Google Scholar]
  158. Gueymard, C.A.; Ruiz-Arias, J.A. Extensive worldwide validation and climate sensitivity analysis of direct irradiance predictions from 1-min global irradiance. Solar Energy 2016, 128, 1–30. [Google Scholar] [CrossRef]
  159. Engerer, N. Minute resolution estimates of the diffuse fraction of global irradiance for southeastern Australia. Solar Energy 2015, 116, 215–237. [Google Scholar] [CrossRef]
  160. Gueymard, C.A. Temporal variability in direct and global irradiance at various time scales as affected by aerosols. Solar Energy 2012, 86, 3544–3553. [Google Scholar] [CrossRef]
  161. Xia, X.; Chen, H.; Li, Z.; Wang, P.; Wang, J. Significant reduction of surface solar irradiance induced by aerosols in a suburban region in northeastern China. J. Geophys. Res. 2007, 112. [Google Scholar] [CrossRef]
  162. Mukkavilli, S.K.; Prasad, A.A.; Taylor, R.A.; Troccoli, A.; Kay, M.J. Mesoscale Simulations of Australian Direct Normal Irradiance, Featuring an Extreme Dust Event. J. Appl. Meteorol. Climatol. 2018, 57, 493–515. [Google Scholar] [CrossRef]
  163. Alfadda, A.; Rahman, S.; Pipattanasomporn, M. Solar irradiance forecast using aerosols measurements: A data driven approach. Solar Energy 2018, 170, 924–939. [Google Scholar] [CrossRef]
  164. Ruiz-Arias, J.A.; Gueymard, C.A.; Santos-Alamillos, F.J.; Pozo-Vázquez, D. Worldwide impact of aerosol’s time scale on the predicted long-term concentrating solar power potential. Sci. Rep. 2016, 6, 30546. [Google Scholar] [CrossRef] [PubMed] [Green Version]
  165. Mueller, R.; Träger-Chatterjee, C. Brief Accuracy Assessment of Aerosol Climatologies for the Retrieval of Solar Surface Radiation. Atmosphere 2014, 5, 959–972. [Google Scholar] [CrossRef] [Green Version]
  166. Mueller, R.; Pfeifroth, U.; Traeger-Chatterjee, C. Towards Optimal Aerosol Information for the Retrieval of Solar Surface Radiation Using Heliosat. Atmosphere 2015, 6, 863–878. [Google Scholar] [CrossRef] [Green Version]
  167. Ruiz-Arias, J.A.; Gueymard, C.A.; Santos-Alamillos, F.J.; Pozo-Vázquez, D. Do spaceborne aerosol observations limit the accuracy of modeled surface solar irradiance: Aerosol limits modeled solar radiation. Geophys. Res. Lett. 2015, 42, 605–612. [Google Scholar] [CrossRef]
  168. Alonso-Blanco, E.; Gómez-Moreno, F.; Artíñano, B.; Iglesias-Samitier, S.; Juncal-Bello, V.; Piñeiro-Iglesias, M.; López-Mahía, P.; Pérez, N.; Brines, M.; Alastuey, A.; et al. Temporal and spatial variability of atmospheric particle number size distributions across Spain. Atmos. Environ. 2018. [Google Scholar] [CrossRef]
  169. Nikitidou, E.; Kazantzidis, A.; Salamalikis, V. The aerosol effect on direct normal irradiance in Europe under clear skies. Renew. Energy 2014, 68, 475–484. [Google Scholar] [CrossRef]
  170. Polo, J.; Estalayo, G. Impact of atmospheric aerosol loads on Concentrating Solar Power production in arid-desert sites. Solar Energy 2015, 115, 621–631. [Google Scholar] [CrossRef]
  171. Law, E.W.; Prasad, A.A.; Kay, M.; Taylor, R.A. Direct normal irradiance forecasting and its application to concentrated solar thermal output forecasting–A review. Solar Energy 2014, 108, 287–307. [Google Scholar] [CrossRef]
  172. Nickovic, S.; Cuevas, E.; Baldasano, J.; Terradellas, E.; Nakazawa, T.; Baklano, A. Sand and Dust Storm Warning Advisory and Assessment System (SDS-WAS) Science and Implementation Plan: 2015–2020; World Meteorological Organization (WMO): Geneva, Switzerland, 2015. [Google Scholar]
  173. Lohmann, G.M. Solar Irradiance Variability on Small Spatial and Temporal Scales. Ph.D. Thesis, Carl von Ossietzky Universität Oldenburg, Oldenburg, Germany, 2017. [Google Scholar]
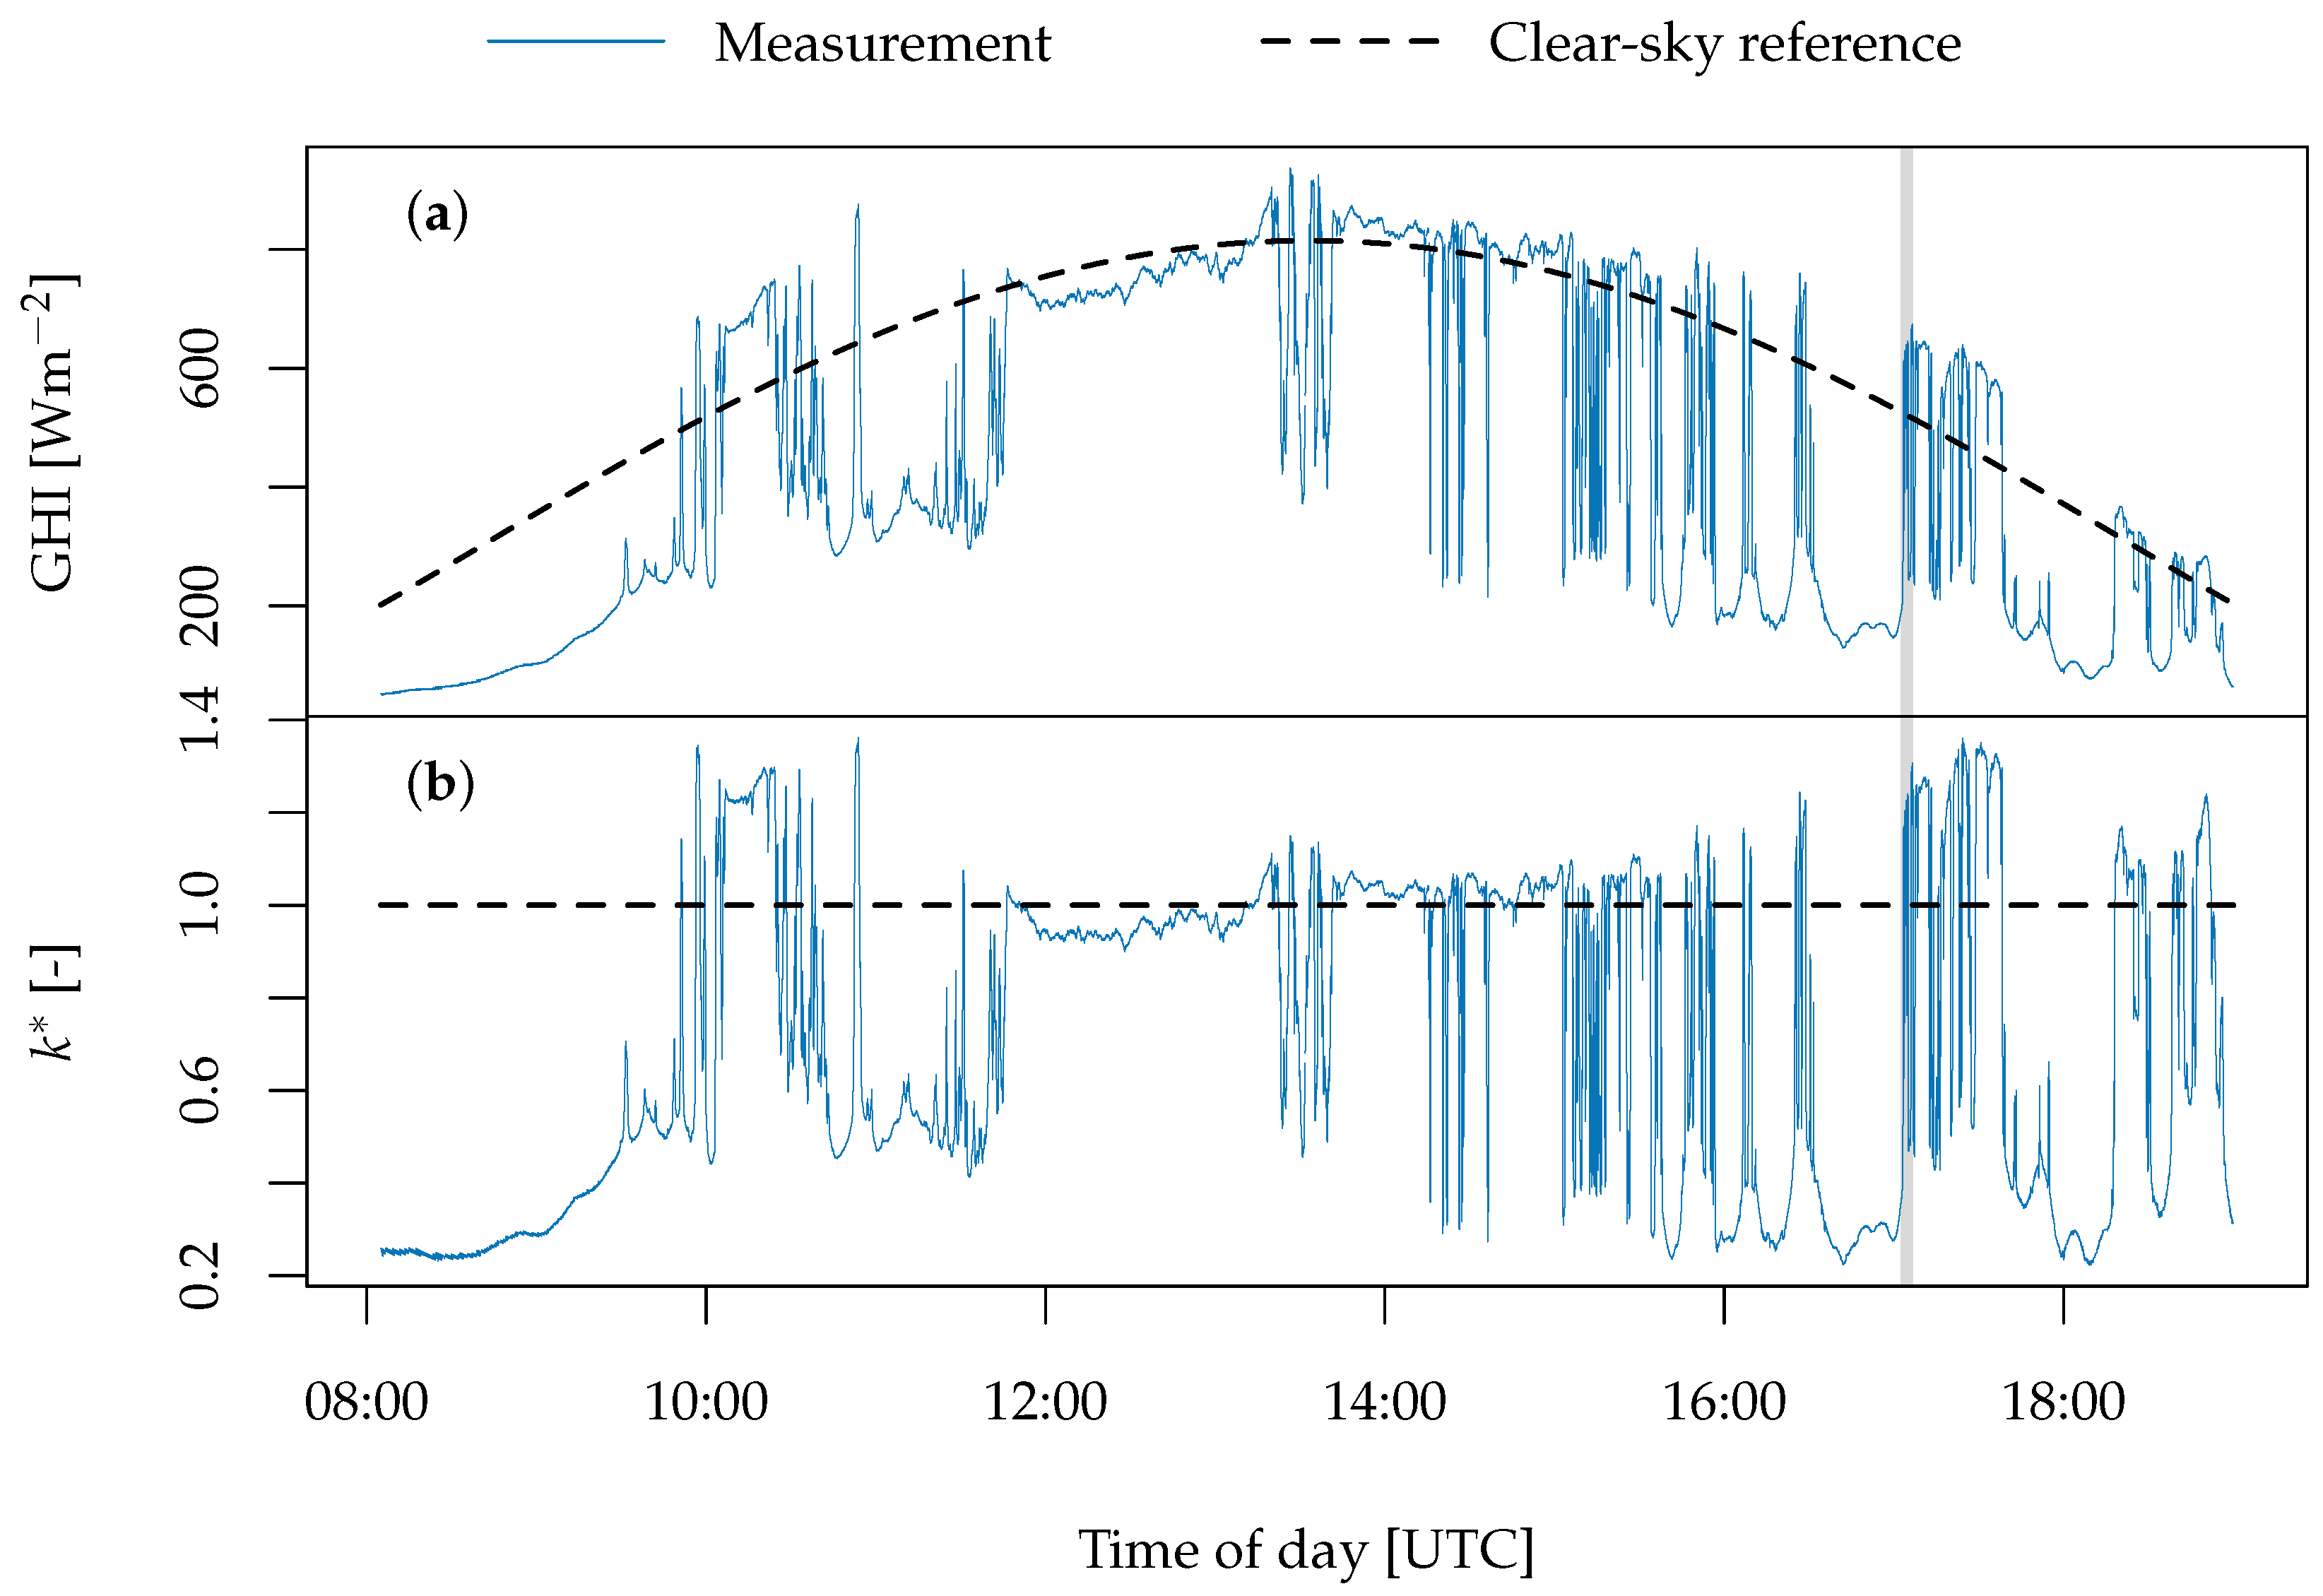
Figure 1. (a) An example of a diurnal cycle of measured global horizontal irradiance (GHI) along with simulated clear-sky irradiance derived by a basic model [140]; (b) A corresponding clear-sky index estimate k according to Equation (2). The irradiance data were measured during the HD(CP)2 Observational Prototype Experiment (HOPE) campaign [138,139] with 1 s temporal resolution near Jülich, Germany, on 25 April 2013, and have been conditioned to exclude times of low solar elevation angles α < 15 ° after sunrise and before sunset.
Atmosphere 09 00264 g001
Figure 2. Probability density estimates of clear-sky index k based on the single-day example time series previously shown in Figure 1 (histogram, black lines), as well as a considerably longer series containing a total of about 4.5 · 10 6 s worth of single-sensor 1 s measurements collected during the HOPE campaign [138,139] (kernel density estimate, KDE, dashed blue line). The KDE was derived using Gaussian kernels with a smoothing bandwidth (i.e., smoothing kernel standard deviation) of 0.05.
Atmosphere 09 00264 g002
Figure 3. A five-minute subset of the time series previously shown in Figure 1 (there indicated by a vertical gray line). (a) Clear-sky index k time series; (b) Corresponding clear-sky index increments k τ ( t ) as per Equation (5) for three distinct short-term increment time steps τ = 5   s , τ = 10   s , and τ = 60   s . The underlying irradiance data were collected during the HOPE campaign [138,139].
Atmosphere 09 00264 g003
Figure 4. Kernel density estimates of clear-sky index increments, using about 4.5 · 10 6 s worth of single-sensor 1 s data collected during the HOPE campaign [138,139]. The estimates were derived for increment time steps τ = 5   s , τ = 10   s , and τ = 60   s using Gaussian kernels with a smoothing bandwidth of 0.01.
Atmosphere 09 00264 g004
Figure 5. A comparison between daily values of the clear-sky index variability score VS τ k (cf. Equation (8)) and the clear-sky index increment standard deviation σ k τ (cf. Equation (9)) for three time steps (a) τ = 5   s , (b) τ = 10   s , and (c) τ = 60   s , using 105 days worth of single-sensor 1 s clear-sky index estimates derived from irradiance data collected during the HOPE campaign [138,139] (i.e., the same data as in Figure 4). Least-square fits are included as dashed lines, and the corresponding coefficients of determination R 2 are quoted in each panel.
Atmosphere 09 00264 g005
Figure 6. An example of spatial averaging: (a) the same 1 s single-sensor clear-sky index k time series as in Figure 1 along with a corresponding spatially averaged 1 s clear-sky index computed over as many as 99 pyranometers dispersed over an area of about 80 km2; (b) 1 min clear-sky index increments k τ derived according to Equation (5) for both the single-sensor time series and the spatial average. The underlying irradiance data were collected during the HOPE campaign [138,139].
Atmosphere 09 00264 g006
Figure 7. Some examples of previously proposed models to estimate the two-point correlation coefficient of clear-sky index increments ρ i j k τ as a function of distance d i j for increment time scale τ = 10 s and cloud speed v = 10 ms−1. Panel (a) shows examples of isotropic (i.e., without considering the direction of cloud motion) correlation structures proposed by Hoff and Perez [10], Perez et al. [106], and Lave et al. [83] (each derived from simple equations implying a linear relationship between d i j , τ and v), as well as Lohmann et al. [52] (based on 3 h worth of 1 s k field data simulated by a fractal cloud model with an assumed average cloud cover of 50%). Panel (b) presents along-wind structures according to models proposed by Lonij et al. [103], Arias-Castro et al. [68], and Widén [13] (the presented curves were extracted from Elsinga and van Sark [71]; cf. their Figure 2), as well as the aforementioned fractal model [52].
Atmosphere 09 00264 g007
Figure 8. An example of temporal averaging: (a) Averages of 1 min and 10 min temporal resolutions based on the 1 s single-sensor clear-sky index k time series shown in Figure 1 (collected during the HOPE campaign [138,139]); (b) Corresponding 10 min clear-sky index increments k τ derived according to Equation (5).
Atmosphere 09 00264 g008