Article

Evaluation of Fog and Low Stratus Cloud Microphysical Properties Derived from In Situ Sensor, Cloud Radar and SYRSOC Algorithm

1
Institut Pierre-Simon Laplace, École Polytechnique, UVSQ, Université Paris-Saclay, 91128 Palaiseau, France
2
Institut Pierre Simon Laplace, École Polytechnique, CNRS, Université Paris-Saclay, 91128 Palaiseau, France
3
Laboratoire de Météorologie Dynamique, École Polytechnique, Université Paris-Saclay, 91128 Palaiseau, France
4
Laboratoire Atmosphères, Milieux, Observations Spatiales/UVSQ/CNRS/UPMC, 78280 Guyancourt, France
5
LPC2E-CNRS/Université d’Orléans, 3A Avenue de la Recherche Scientifique, 45071 Orléans, France
6
Centre for Climate and Air Pollution Studie, National University of Ireland, Galway H91 CF50, Ireland
*
Author to whom correspondence should be addressed.
Atmosphere 2018, 9(5), 169; https://doi.org/10.3390/atmos9050169
Submission received: 15 March 2018 / Revised: 23 April 2018 / Accepted: 23 April 2018 / Published: 2 May 2018
(This article belongs to the Section Meteorology)

Abstract

:
The microphysical properties of low stratus and fog are analyzed here based on simultaneous measurement of an in situ sensor installed on board a tethered balloon and active remote-sensing instruments deployed at the Instrumented Site for Atmospheric Remote Sensing Research (SIRTA) observatory (south of Paris, France). The study focuses on the analysis of 3 case studies where the tethered balloon is deployed for several hours in order to derive the relationship between liquid water content (LWC), effective radius (Re) and cloud droplet number concentration (CDNC) measured by a light optical aerosol counter (LOAC) in situ granulometer and Bistatic Radar System for Atmospheric Studies (BASTA) cloud radar reflectivity. The well-known relationship Z = α × (LWC)β has been optimized with α ϵ [0.02, 0.097] and β ϵ [1.91, 2.51]. Similar analysis is done to optimize the relationship Re = f(Z) and CDNC = f(Z). Two methodologies have been applied to normalize the particle-size distribution measured by the LOAC granulometer with a visible extinction closure (R² ϵ [0.73, 0.93]) and to validate the LWC profile with a liquid water closure using the Humidity and Temperature Profiler (HATPRO) microwave radiometer (R² ϵ [0.83, 0.91]). In a second step, these relationships are used to derive spatial and temporal variability of the vertical profile of LWC, Re and CDNC starting from BASTA measurement. Finally, the synergistic remote sensing of clouds (SYRSOC) algorithm has been tested on three tethered balloon flights. Generally, SYRSOC CDNC and Re profiles agreed well with LOAC in situ and BASTA profiles for the studied fog layers. A systematic overestimation of LWC by SYRSOC in the top half of the fog layer was found due to fog processes that are not accounted for in the cloud algorithm SYRSOC.

1. Introduction

Accurate forecasts of atmospheric conditions resulting in low visibility, particularly on short timescales, have become an important issue [1,2,3,4,5,6,7,8,9,10,11,12,13,14,15,16,17,18,19,20,21,22,23,24]: Fog and low clouds often cause a strong reduction of visibility, thus affecting various types of transport systems such as car, air and ship traffic, and the financial and human costs are comparable to those of tornadoes and storms [9]. Low visibility during fog events is a result of complex radiative, turbulent and microphysical processes as well as interactions between the atmospheric boundary layer (ABL) and the underlying surface [5,6,7,8,9,10,11,12,13,14,15,16,17,18,19,20,21,22,23,24,25,26,27].
The mechanisms of fog formation, development and dissipation are very complex and have been extensively studied with a series of numerical simulations and comprehensive observational programs including in situ measurements [9]. From the numerical modelling point of view, meteorological models usually lack accuracy due to poor horizontal [18] and vertical [25] resolutions, and inadequacies in microphysical parametrizations [9].
To explore the parameterization of microphysical processes in fog, it is essential to observe the spatial and temporal variations of key microphysical parameters related to fog, cloud droplet number concentration (CDNC), liquid water content (LWC), and effective radius (Re). Fog drop size distribution (DSD) is undoubtedly an important parameter for describing various fog types and the lifecycle stages of fog. All the key microphysical parameters are affected by DSD when fog develops [16]. Fog drop-size distributions pertain to various types with spatial and temporal variations [26], and even at different heights of fog layers, fog drop size distributions vary due to inhomogeneous microphysical structures in fog [28]. The variability of fog drop-size distributions is incurred by the combined effects of microphysical processes, such as nucleation, activation, growth, gravitational setting, turbulent mixing, and macro conditions such as wind and radiative fluxes [17].
Unfortunately, few data are available concerning LWC in fog events, as well as for single fog lifecycle stages. Balloon-borne systems are also unsuitable for continuous spatial and temporal measurements of the vertical fog structure. One possible solution comprises frequency-modulated continuous wave technique (FMCW) cloud radars that could provide continuous but indirect LWC measurements in a high temporal resolution [2,3,4,5,6,7,8,9,10,11,12,13,14,15,16]. Reliable Z-LWC relationships for fog events are paramount to retrieving LWC profiles from radar reflectivity: existing procedures use empirically-derived static relationships [7,8,9,10,11,12,13,14,15,16,17,18,19,20,21,22], and some are more advanced accounting for additional instrumentation such as a ceilometer [3] or microwave radiometer [14]. However, assumptions about the shape of the droplet-size distribution lead to inaccuracies in retrieved Z-LWC because Z is proportional to the sixth moment of the DSD (in Rayleigh approximation, valid for small drops i.e., for fog) while LWC is proportional to the third moment of the DSD.
The objective of this study is (1) to derive microphysical property profiles from radar reflectivity, (2) to quantify the accuracy of retrievals with an in situ granulometer, and (3) to evaluate an algorithm to derive cloud-layer microphysical properties, the synergistic remote sensing of clouds (SYRSOC) algorithm [15]. In Section 2, we describe the instrumental setup of the intensive observational periods (IOP) carried out at the Instrumented Site for Atmospheric Remote Sensing Research (SIRTA) observatory, the dataset available for the four case studies, and the SYRSOC algorithm used in this study. Section 3 shows the parametric relationship used to derive the microphysical properties starting from radar reflectivity. In Section 4, the vertical profiles of microphysical properties such as LWC, Re and CDNC derived in Section 3 are compared to in situ sensor and SYRSOC output data.

2. Observational Dataset and Synergistic Remote Sensing of Clouds (SYRSOC) Algorithm

2.1. Intensive Observational Periods (IOP) and Three Tethered Balloon Flights

SIRTA is a French national observatory dedicated to studying clouds, aerosols, dynamics and thermodynamics in the boundary layer and the free troposphere. The SIRTA observatory is a mid-latitude site (48.7° N, 2.2° E) located in a semi-urban area, on the Saclay plateau 25 km south of Paris [10]. Table 1 describes the active and passive remote-sensing instruments and the main in situ sensors deployed at the SIRTA site for the IOP and used in this study. These IOP correspond to 6 January 2015, 19 December 2016, 3 January 2017 and 17 February 2017. On the three first dates, a tethered balloon carrying an optical particle counter was deployed to document fog and low-stratus microphysical properties, while during the fog on 17 February 2017 the balloon was not used and measurements were only taken at 4 m altitude. All instruments were set up in an area covering less than 1 km2. All times are universal time (UT) and all altitudes are above ground level (agl). Figure 1 shows a time series of the cloud radar reflectivity (colored panel) and tethered balloon (black markers) path for 3 January 2017 between 10:00 and 17:00. Fog thickness reaches 300 m at 10:30 and maximum altitude reached by the tethered balloon is 250 m around 11:00. During this event we performed 2 different flights, one during the morning (between 10:15 and 13:00), and one between 15:00 and 16:45.

2.2. Remote-Sensing Instruments and In Situ Sensor

A Degreane DF320 diffusometer (Degreane, La Garde, France) was operated near the ground (4 m agl). The instrument provides horizontal visibility range and particle extinction at 550 nm, with 10–25% uncertainty [6].
The cloud base height and the cloud top height were derived from the CL31 (Vaisala, Vantaa, Finland) or CHM15K ceilometer (Lufft, Berlin, Germany) backscatter signal and the BASTA 95 GHz Doppler cloud radar developed by the LATMOS laboratory, respectively [2]. The ceilometer and radar blind zones are 15 m and 40 m, with vertical resolutions of 15 m and 12.5 m, respectively. This zone corresponds to the altitude without information on lidar backscatter or radar reflectivity and Doppler velocity. The cloud radar is operated in a vertically pointing mode and uses the frequency modulated continuous wave approach at 95 GHz. Its bi-static configuration allows us to reduce the blind zone compared to mono-static radar. The 3.2 mm wavelength gives a clear advantage compared to classical meteorological radar in term of sensitivity for equivalent antenna size and emitted power, the cloud radar is perfectly suited for the characterization of microphysical properties of fog and stratus above 40 m height, while the CL31 or CHM15K ceilometer is totally attenuated when the fog thickness is more than some tens of meters. The sensitivity of the radar is estimated to be at about −40 dBZ at 1 km for a temporal resolution of 12 s and 12.5 m range resolution [2].
The Humidity and Temperature Profiler (RPG-HATPRO, Radiometer Physics Gmbh, Meckenheim, Germany) water vapor and oxygen multi-channel microwave profiler, installed at SIRTA site since February 2010, provides time series of the liquid water path when fog or clouds occur, and integrated water vapor on the total column of the atmosphere.
The Light Optical Aerosol Counter (LOAC) is a compact optical counter/sizer to perform measurements of liquid and solid particles at ground level and under all kinds of balloons in the troposphere and in the stratosphere [20]. Particles are collected and are injected through a laser beam by a pumping system. LOAC is characterized by a sampling rate around 2.5 L/min through a tube of 8 mm in diameter and 20 cm in lengths. Measurements of the light scattered by the particles are performed at two scattering angles. The first one is around 12°, and is almost insensitive to the refractive index of the particles; the second one is around 60° and is strongly sensitive to the refractive index of the particles. By combining measurements at the two angles, it is possible to retrieve the concentrations for 19 size classes between 0.2 µm and 50 µm in diameter and to estimate the main typology of the particles (droplets, carbonaceous, mineral particles, salts) when the medium is relatively homogeneous. This typology is based on calibration charts obtained in the laboratory [21].
The LOAC sensor calibration procedure follows the standard calibration of an optical counter, i.e., the particle size is controlled but not the number. Latex beads, which are perfect transparent spheres, have been used for diameter calibration below 2 µm. For the calibration in the 5–45 µm size range, different natures of irregular grains have been used: glass beads (quite irregular), carbonaceous particles, dust sand of several types, ashes and salts. Figure 2 shows an example of particle-size distribution measured with the LOAC sensor on 3 January 2017 at 10:00 and 11:00. At 10:00, LOAC is at the ground during the fog event with more than 50 particles bigger than 10 µm whereas at 11:00, LOAC sensor reaches the top of the fog layer with only one tenth of particles larger than 10 µm.
The uncertainty for total concentrations measurements is ±20% when concentrations are higher than 5 particles cm−3 (for a 10-min integration time). The uncertainties in size calibration are ±0.025 µm for particles smaller than 1 µm, and 10% for greater particles. The measurement accuracy of submicron particles is reduced when the concentration of particles >3 µm exceeds a few particles cm−3. In the case of measurements inside a thick fog, several particles are present in the laser beam at the same time and the concentrations can be underestimated. Corrective coefficients have been established to tentatively correct from this effect and to retrieve the relative distribution of the particles. Nevertheless, this procedure becomes inaccurate for the highest concentrations; it is then necessary to normalize also the results with the total number of particles estimated from independent measurements. The following part presents a possible method to normalize the particle-size distribution by comparing it to the optical extinction measured with the diffusometer.

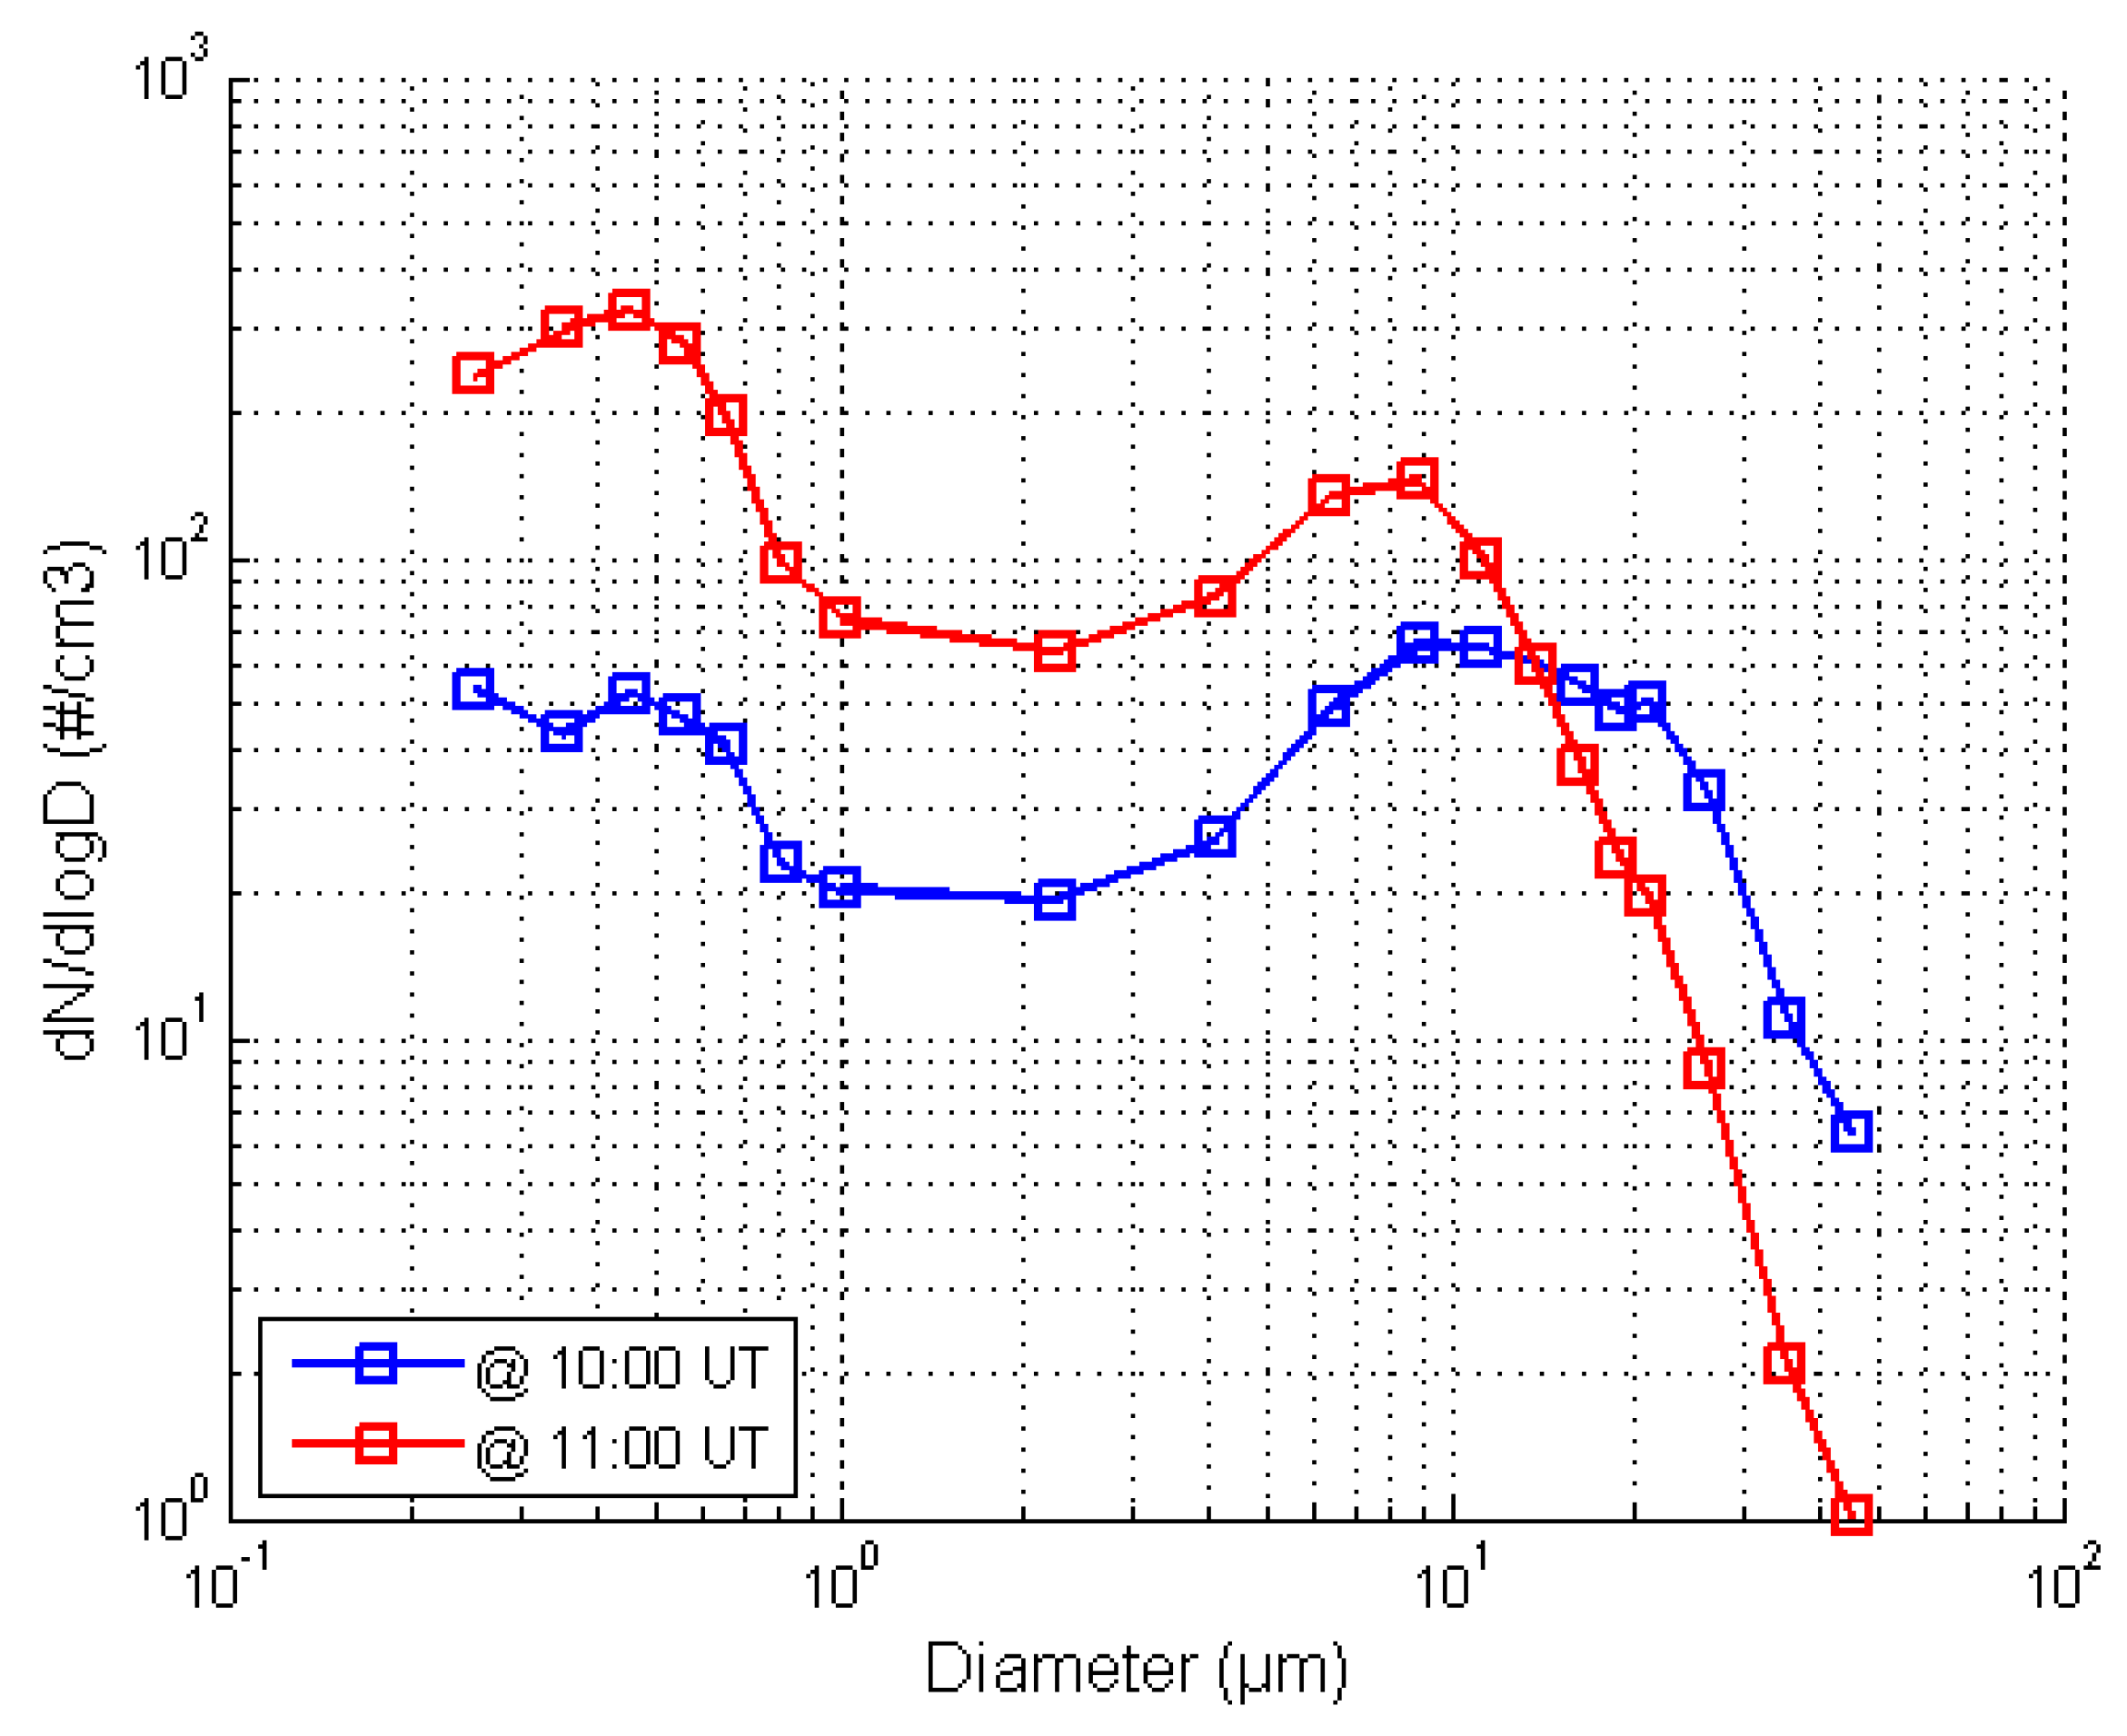
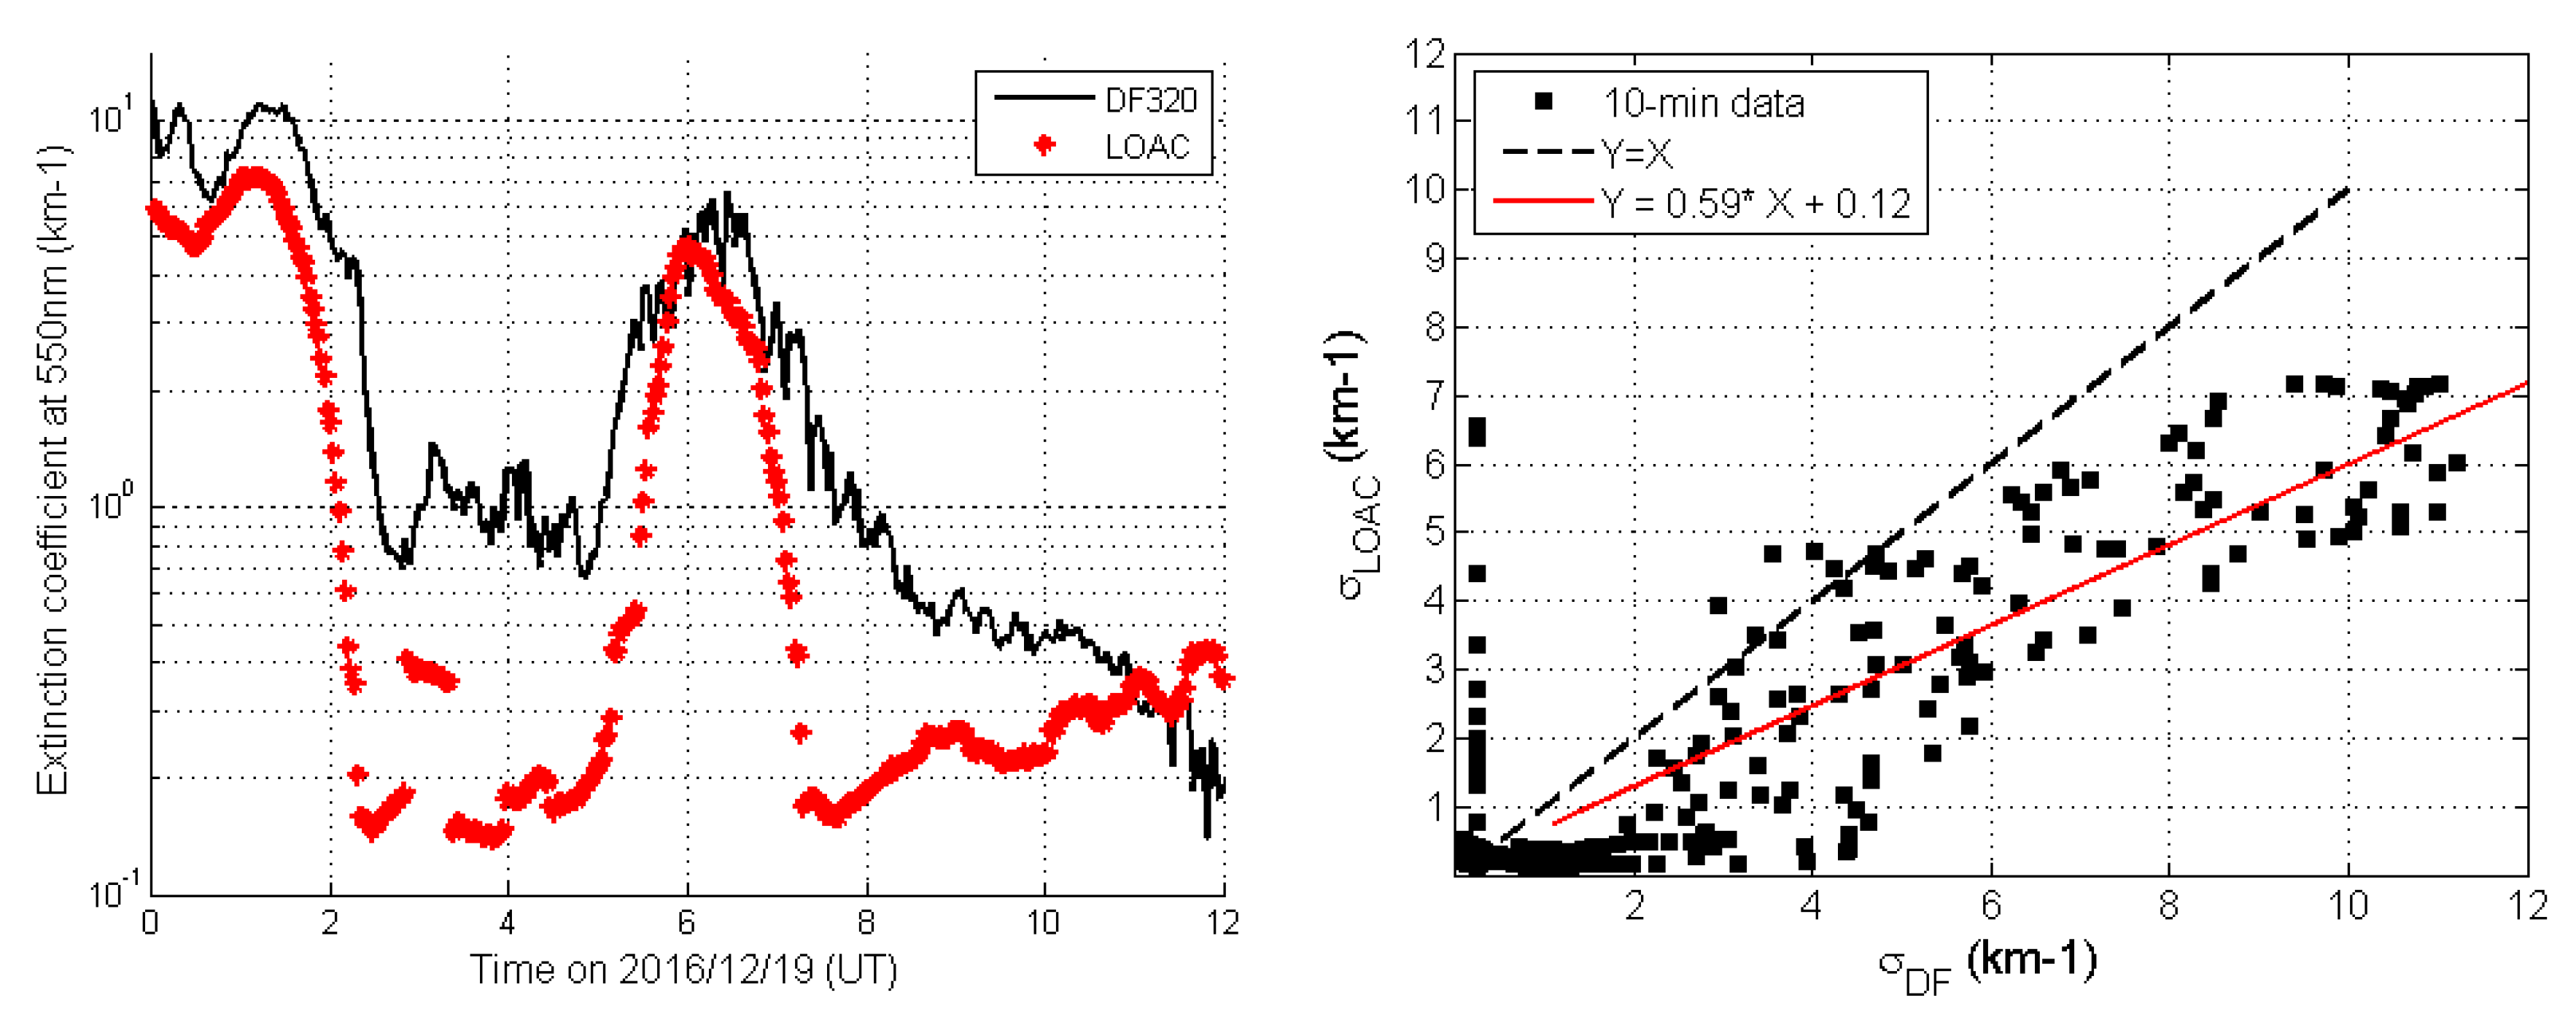
2.3. Visible Extinction Normalisation for Light Optical Aerosol Counter (LOAC) Validation

The particle-size distribution in ambient conditions is measured by the LOAC sensor and used to derive the extinction coefficient σloac. The measured size distribution, according to Mie applicable to spherical droplet particles allows us to derive σloac as the following equation:
σ loac = D min D max π D 2 4 N D Q ext ( m , D )
where Qext is the Mie extinction efficiency factor depending on the particle size D and the refractive index m. As for [6], we assume m = 1.33 for particles larger than 2 µm and m = 1.48 − 0.01i for particles smaller than 2 µm (derived from an AERONET sun photometerDmin equals to 0.1 µm and Dmax = 50 µm. D corresponds to mean diameter for the LOAC sensor and ND is the particles concentration for each size D.
The extinction coefficient σDF is here derived from the measured horizontal visibility (DF320 measurement) according to the Koschmieder equation [12]:
σ DF = ln ( VC ) Visi
where VC is the visual contrast defined here as 5%, and Visi is the horizontal visibility measured by the DF320 diffusometer [6].
Some visible extinction comparisons have been undertaken to compare extinction coefficient derived from LOAC sensor and measured by DF320 diffusometer (Figure 3 for collocated measurement at 4 m agl. Figure 3 on the left shows a time series of extinction coefficient derived from Equations (1) and (2). The black line corresponds to diffusometer data and the red line to LOAC processing. Fog occurs between 05:30 and 07:00. The following table shows slope (normalization factor), and correlation coefficient for four experimental closures in visible extinction according to the relationship as in Figure 3 on the right.
We note a significant difference for the normalization factor that can be explained by some physical phenomena. First, during the foggy situation considered on 6 January 2015 the temperature was about −1 °C with perhaps some ice crystal that can induce very important scattering inside the LOAC optical chamber leading to an overestimation of the optical extinction compared to true visibility measured by DF320 diffusometer. This explains why the slope between the LOAC extinction coefficient and the diffusometer extinction coefficient was 8.2 (Table 2). For 17 February 2017, the slope is equal to 4.2 according to very high number of particles larger than 10 µm about 110 #/cm3 compared to 35 or 55 #/cm3 for 3 January 2017 and 19 December 2016, respectively. We had some problems with the electronic card for this IOP because of a water leak in the electronic box several days before. So, for this IOP the relative size distribution is biased toward the largest droplets leading to an overestimation of the calculated visible extinction (Equation (1)). For 19 December 2016 and 3 January 2017, the slope is 0.59 and 0.92, respectively, for an average visibility of 500 m and 180 m. Additional explanation is provided in Section 3.5.

2.4. SYRSOC Algorithm

SYRSOC is an algorithm for the calculation of microphysical cloud-property profiles from collocated cloud radar, ceilometer or lidar, and microwave radiometer data. In this study, SYRSOC used backscatter signal from the CHM15k (Lufft) and CL31 (Vaisala) ceilometers to detect the cloud base. Reflectivity from BASTA cloud radar was used to detect the cloud top and to calculate cloud droplet number concentration (CDNC) combined with information from the other instruments. From the HATPRO microwave radiometer (RPG, Section 2.2), liquid water path (LWP) was used. Temperature profiles were derived from in situ mast measurements, assuming an adiabatic temperature decrease with height. Under the assumption of a mono-modal cloud droplet size distribution of single-layer purely liquid water clouds, profiles of Re and LWC were calculated from CDNC, which is the primary output of SYRSOC. Further details on SYRSOC were given by [15] and [19].
For this study, an entrainment factor has been introduced to take into account entrainment of dry air at the cloud top. The entrainment factor is calculated for the top 30% of the cloud, replicating the shape of the measured reflectivity profile. The ratio of radar reflectivity at each height bin to radar reflectivity at 30% from the cloud top is calculated. This height dependent factor is then multiplied to the CDNC profile to produce more realistic shapes of the CDNC profile, and subsequently of Re and LWC profiles.
This is the first time SYRSOC has been applied to fog layers. The cloud base in any fog layer is at ground level. However, BASTA has a blind zone in the lowest 40 m and a height range of incomplete overlap of outgoing radiation and receiver field of view from 40 m to 240 m [2]. Reflectivity below 240 m will be reduced due to this effect. However, LWP of the whole column is measured by HATPRO. In case of fog, much of the liquid water will be located in the lowest 240 m. The weak reflectivity would be causing SYRSOC to produce unrealistically high CDNC values and, consequently, very small Re. Therefore, BASTA reflectivity was corrected in the height range of 120–240 m using a near-field correction proposed by [23]. Below 120 m, reflectivity was assumed constant.

3. Liquid Water Content (LWC), Effective Radius (Re) and Cloud Droplet Number Concentration (CDNC) Retrievals

3.1. Pairing of Radar and In Situ Observations Along the Flight Path

In Section 3, we derive the microphysical properties such as liquid water content (LWC), effective radius (Re) and cloud droplet number concentration (CDNC) measured by the LOAC granulometer from BASTA cloud radar reflectivity (Z). We compare LWC, Re, CDNC and Z along the tethered balloon path. We consider 2 min average data of LOAC along the balloon path and we determine the identical time and altitude bins for BASTA measurements. We used the 12.5 m vertical resolution of BASTA and the closest gate to the average altitude of LOAC during the averaging period.

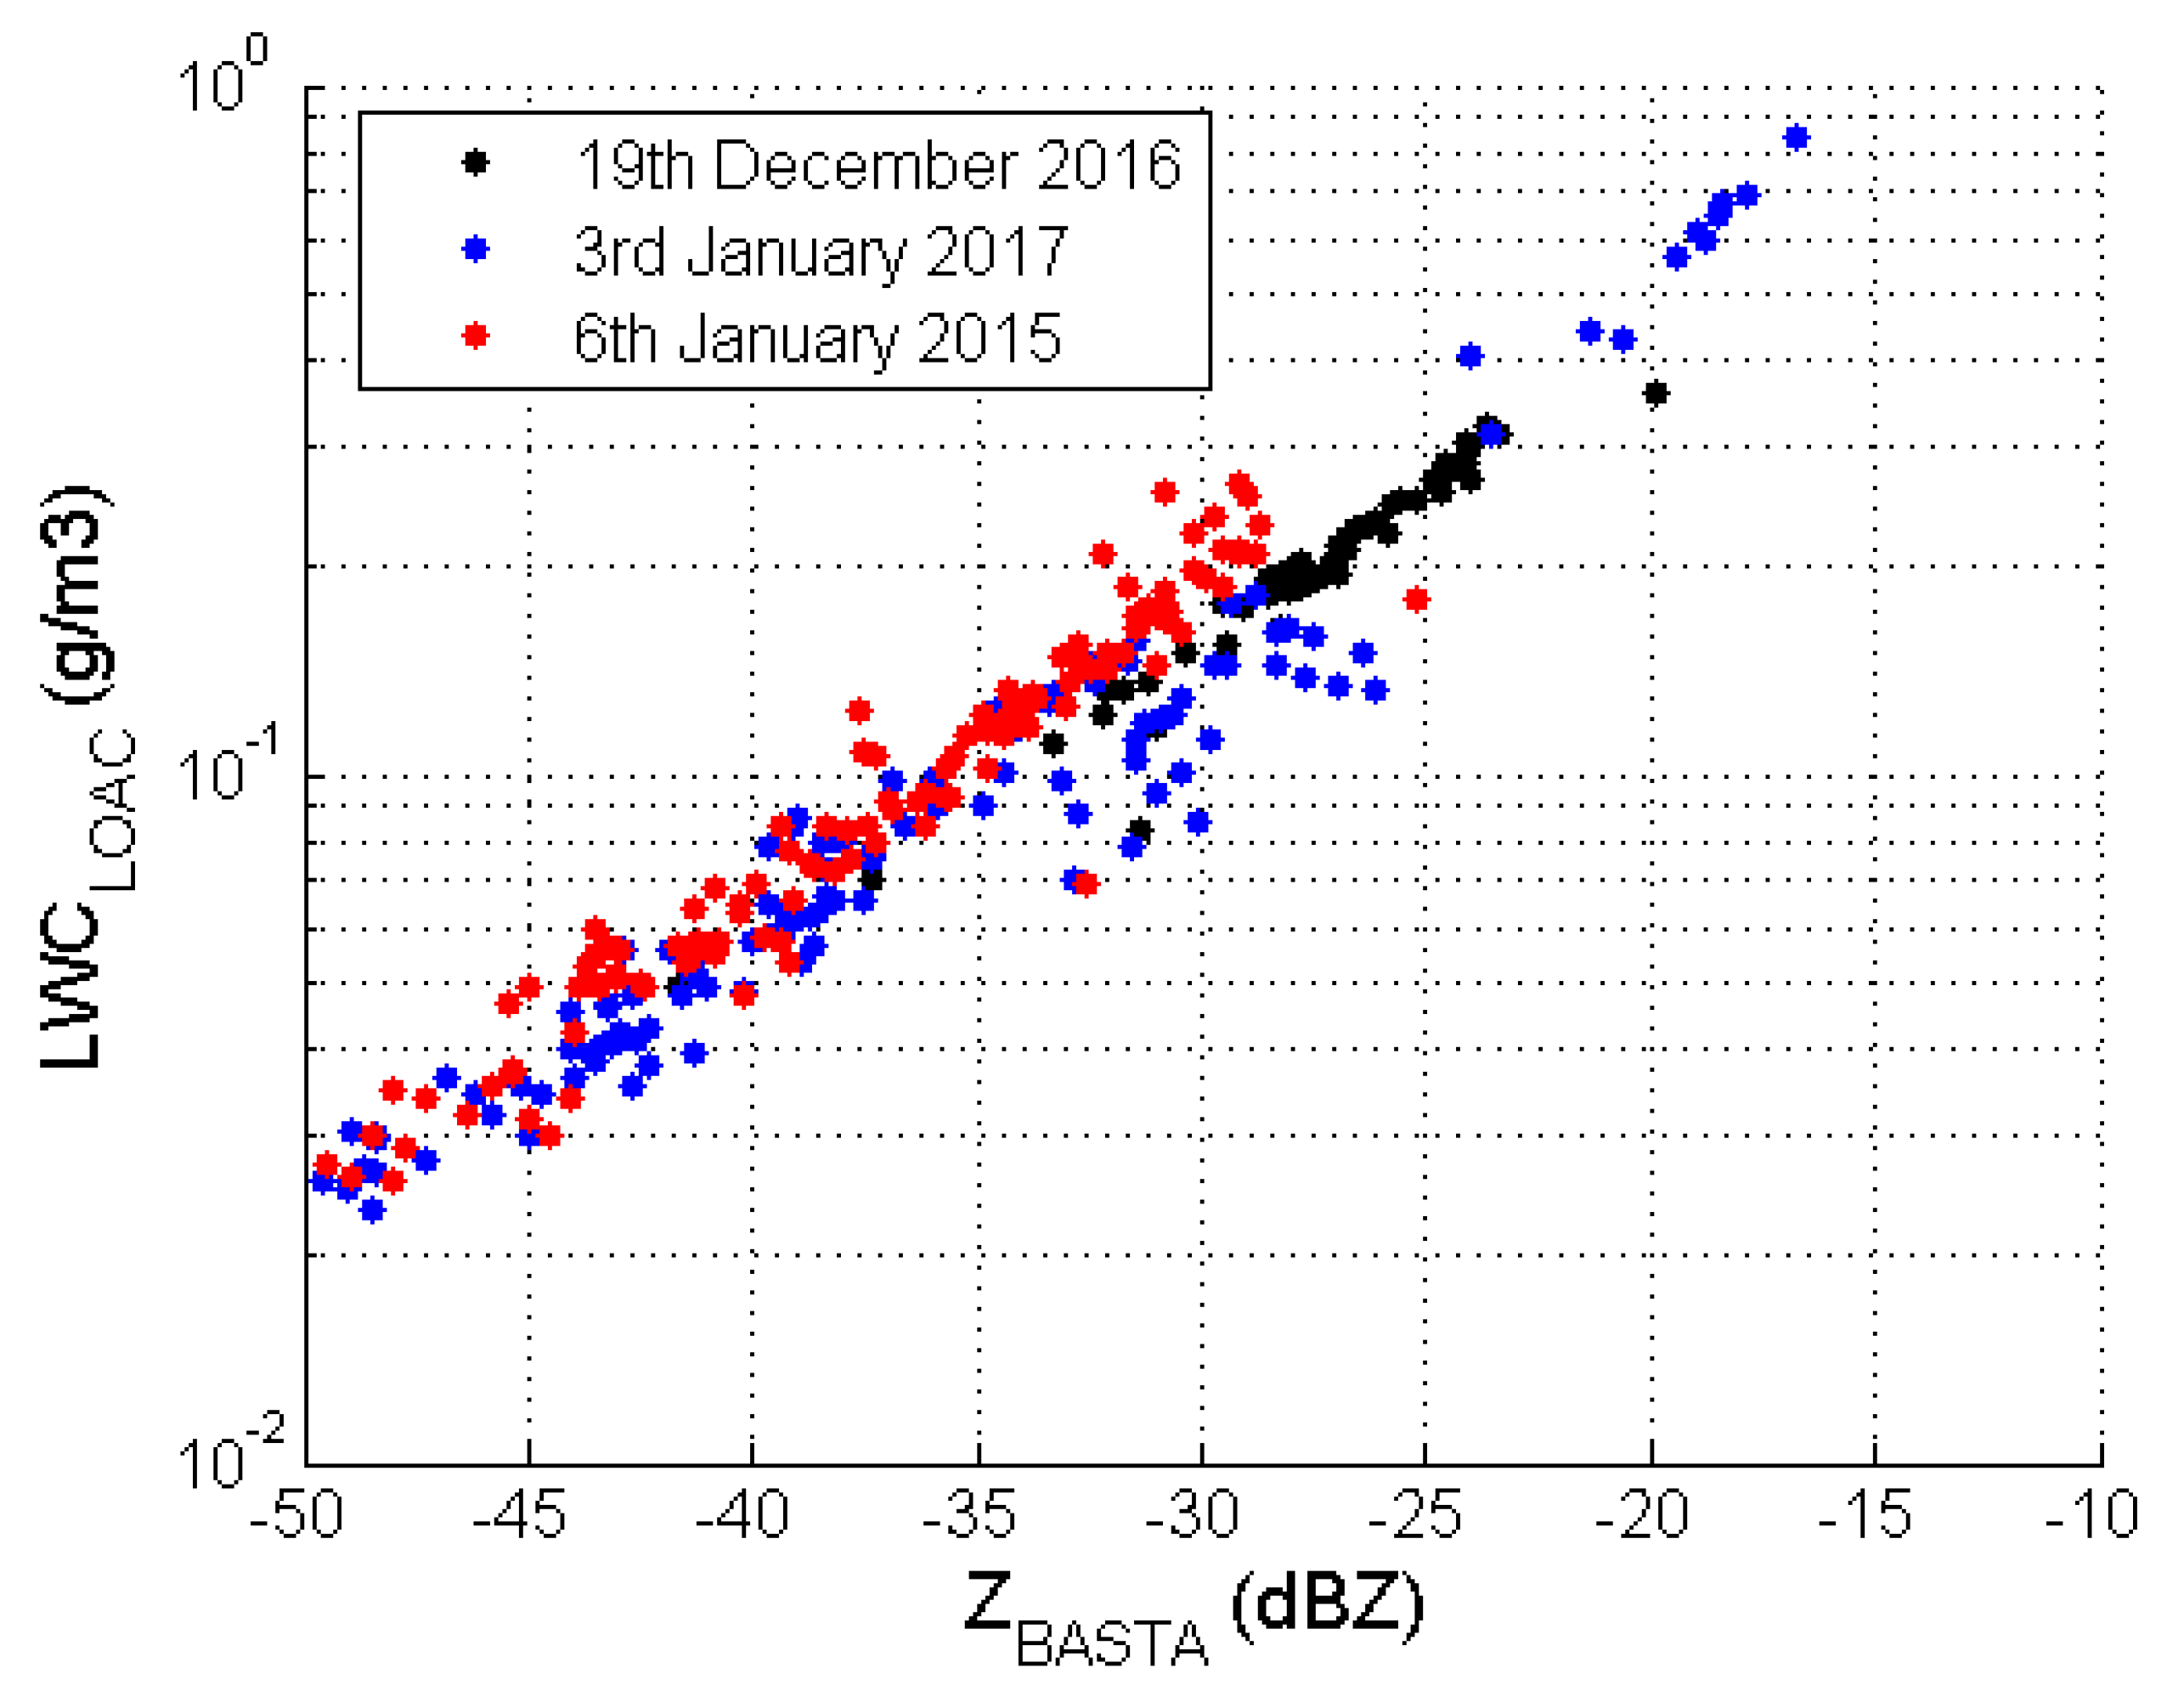
3.2. Doppler Cloud Radar Reflectivity (Z)–LWC Relationship

Theoretical relationships between cloud radar reflectivity and LWC have been developed and [7,8,9,10,11,12,13,14,15,16,17,18,19,20,21,22] proposed a relationship of the form:
Z ( mm 6 m 3 ) = α × LWC β
LWC = 10 Z dBZ 10 log 10 ( α ) β
During the three tethered balloon flights, LWC is measured by the LOAC sensor and Z is measured by the BASTA cloud radar. Figure 4 shows the relationship between LOAC liquid water content and BASTA reflectivity for the three tethered balloon flights (black markers for 19 December 2016, blue markers for 3 January 2017 and red markers for 6 January 2015). The LWC ranges between 0.01–0.7 g/m3 for the period of reflectivity increase from −58.5 to −16.5 dBZ.
Equation (3) derives a linear relationship between reflectivity in dBZ and the logarithm of LWC, which appears to agree well with the observations within each case study (Figure 4). It therefore allows us to derive α and β coefficients by the least square method. Statistical results are presented in Table 3 (ρ is the correlation factor). For our study, α ranges from 0.044 to 0.097 and β from 1.91 to 2.51 with an average reflectivity ranging from −33.4 to −22.7 dBZ leading to a LWC ranging from 0.07 to 0.19 g/m3, respectively. The total sample for this experiment is almost 186 5-min-periods and each correlation factor is bigger than 0.74.
The variability of the relationship between LWC and Z is analyzed and discussed in Section 3.6.

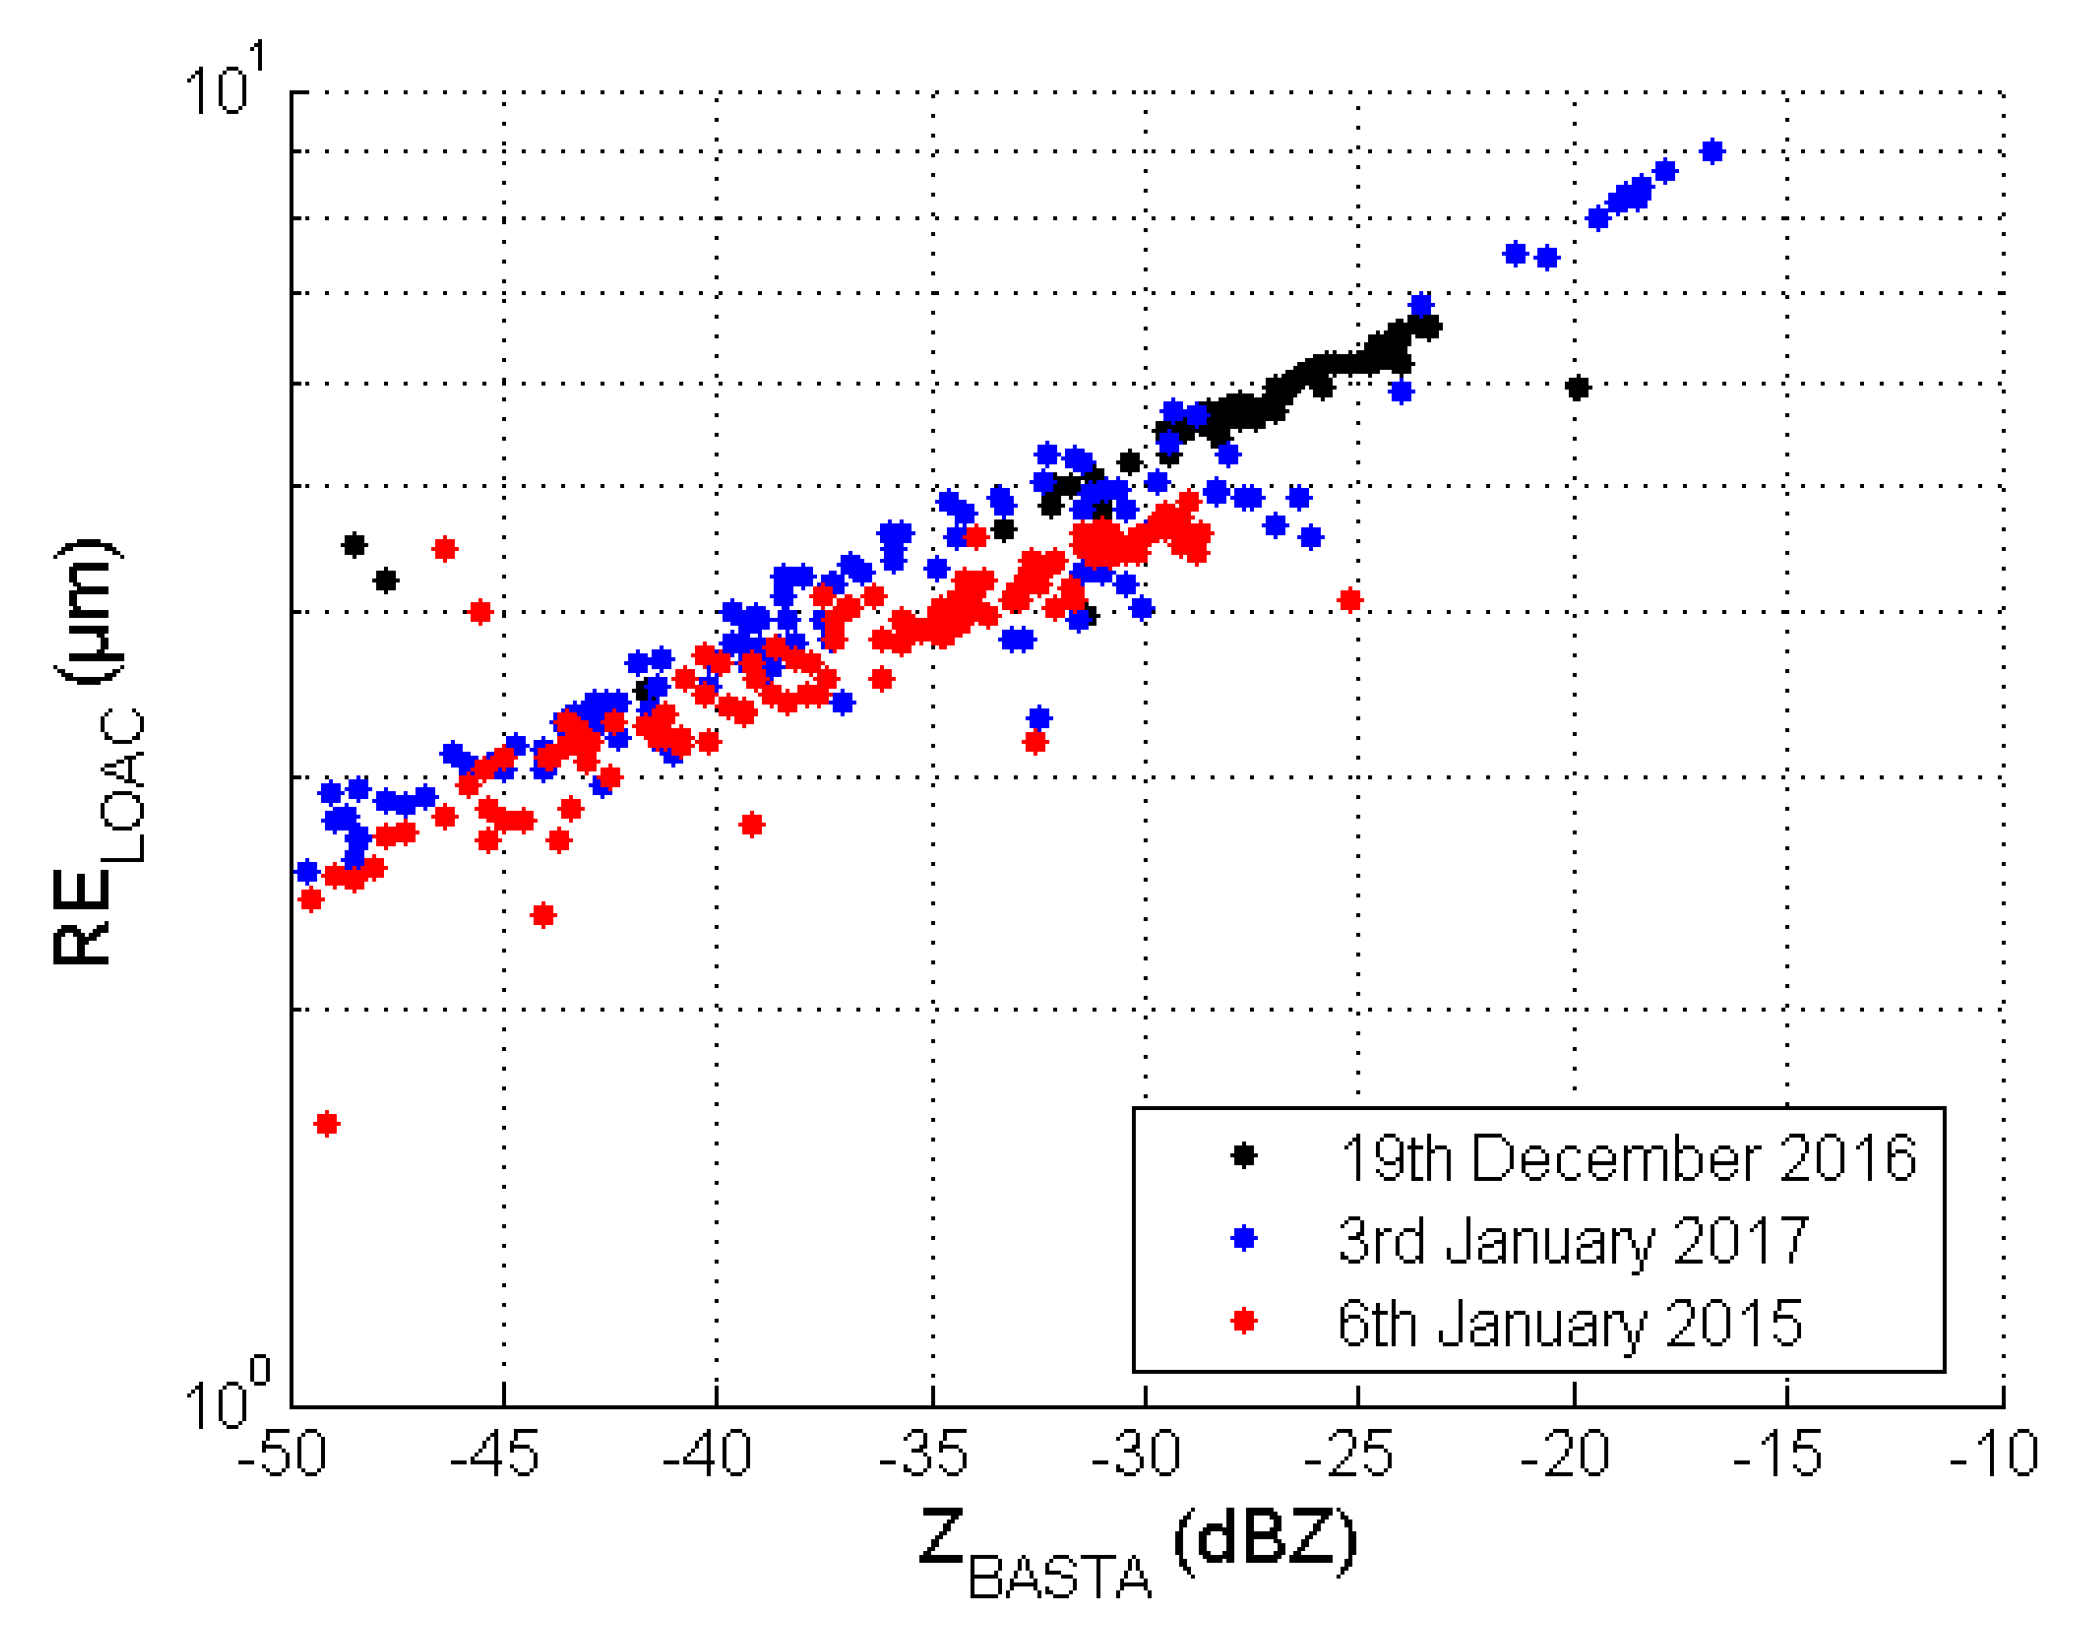
3.3. Z–Re Relationship

Fox and Illingworth (1997) have developed a best linear fit with the following form to link the reflectivity Z and the effective radius Re:
Z ( dBZ ) = γ × log 10 ( Re ) + δ
Re = 10 ( Z ( dBZ ) δ ) / γ
During the three tethered balloon flights, effective radius is measured with the LOAC sensor and Z corresponds to reflectivity measured with the BASTA cloud radar. Figure 5 shows the relationship between the effective radius and the reflectivity for each tethered balloon flight.
We applied the same method as for Equation (3) to derive γ and δ coefficients by the least square method and we present the result in Table 4. For our study, γ ranges from 52.60 to 69.2, δ from −80.7 to −94.2, and effective radius Re ranges from 3.6 to 5.7 µm. For this experiment, the reflectivity range between −57.5 and −11.5 dBZ.
The variability of the relationship between LWC and RE is analyzed and discussed in Section 3.6.

3.4. Cloud Droplet Number Concentration (CDNC)

The combination of Equations (3a) and (4) allows the estimation of the CDNC with the following equation:
CDNC = LWC 4 3 π × ρ l × Re 3
where ρl is the volumic mass of the liquid water and Re is the effective radius of the drops. For our study, CDNC measured by the LOAC sensor (noted * in Table 5) ranges from 54–108 cm−3. CDNC derived from the BASTA cloud radar data and Equation (6) ranged from 65–133 cm−3.

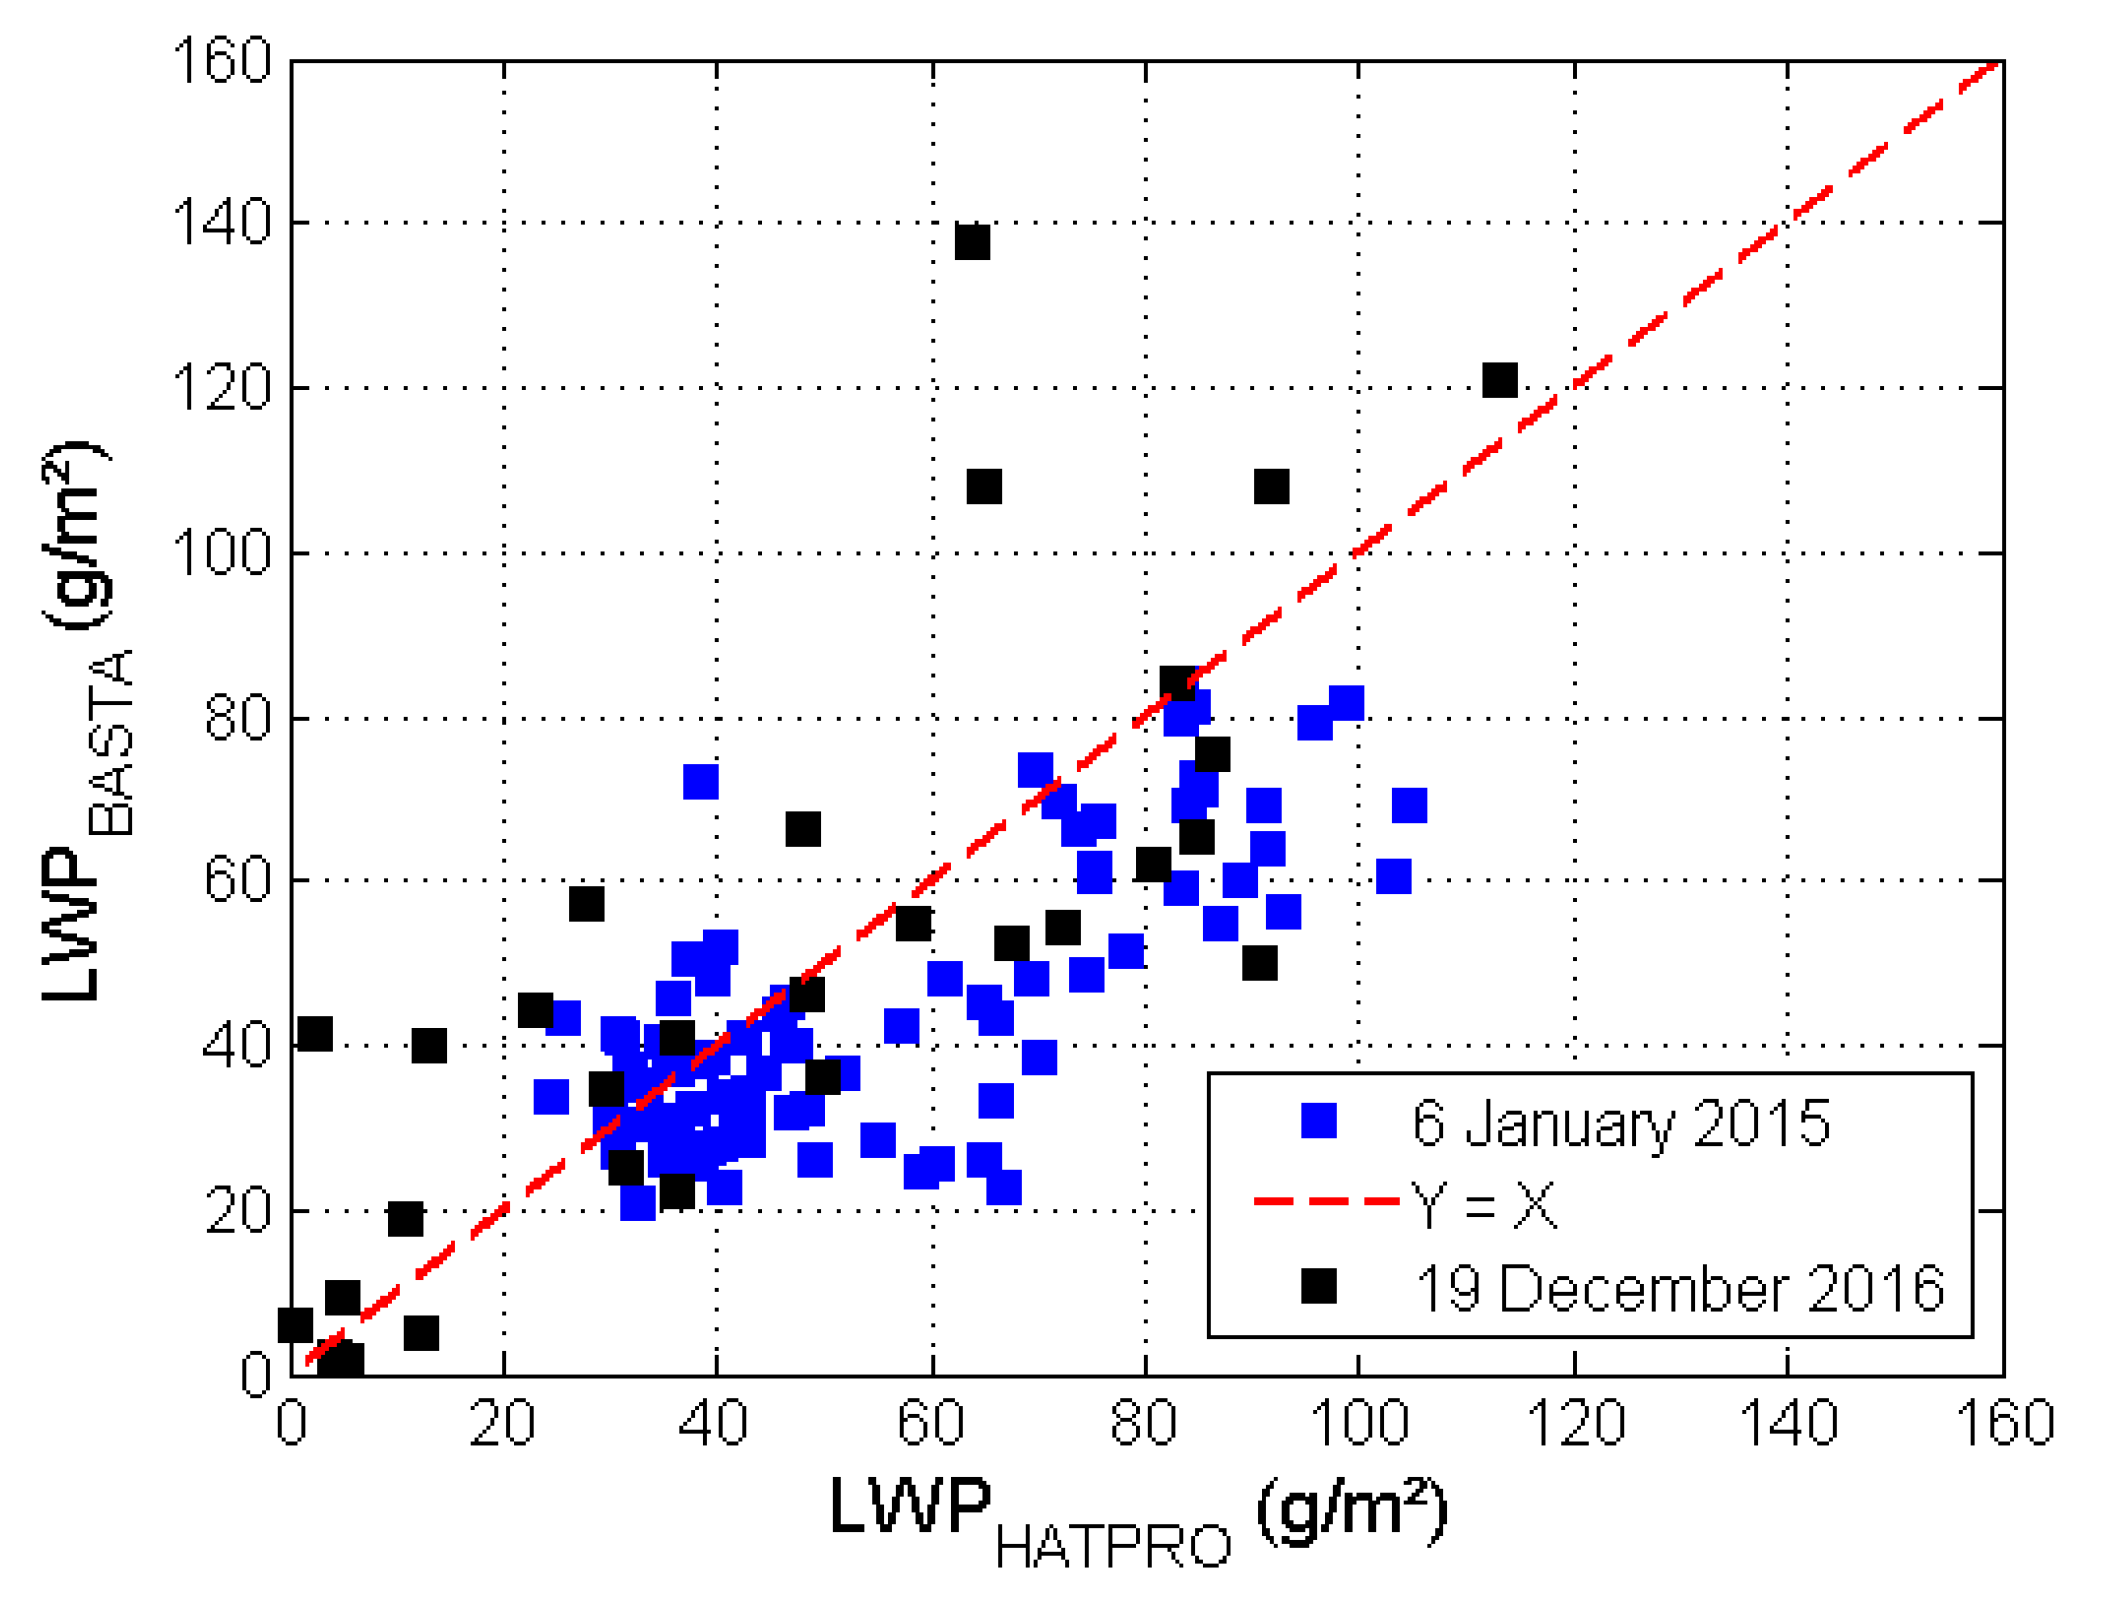
3.5. Liquid Water Closure

According to Equation (3), we can derive the liquid water content (LWC) and so derive the liquid water path (LWP) according to Equation (7).
LWP = CBH CTH LWC ( z ) dz = CBH CTH 10 Z dBZ ( z ) 10 log 10 ( α ) β dz
For the two first flights, the HATPRO microwave radiometer retrieved LWP and hence it is possible to compare the integrated LWC derived from BASTA cloud radar and Equation (7) (Figure 6).
For 6 January 2015, slope equals to 0.75, intercept is −0.7 g/m² and correlation coefficient is 0.83 for 46 10-min samples. For 19 December 2016, slope equals to 0.95, intercept is +23 g/m² and correlation coefficient is 0.91 for 35 10-min samples. This offset has been a posteriori corrected because we have observed an offset of 23 g/m² for HATPRO LWP retrieval by comparison with a clear sky period some hours before the formation of the cloud, so this value has been subtracted before the analysis.
The discrepancies of this relationship between LWP derived from Equation (7) and LWP measured by HATPRO microwave radiometer is directly linked with the validity of Equation (3) and will be discussed in the following Section 3.6.

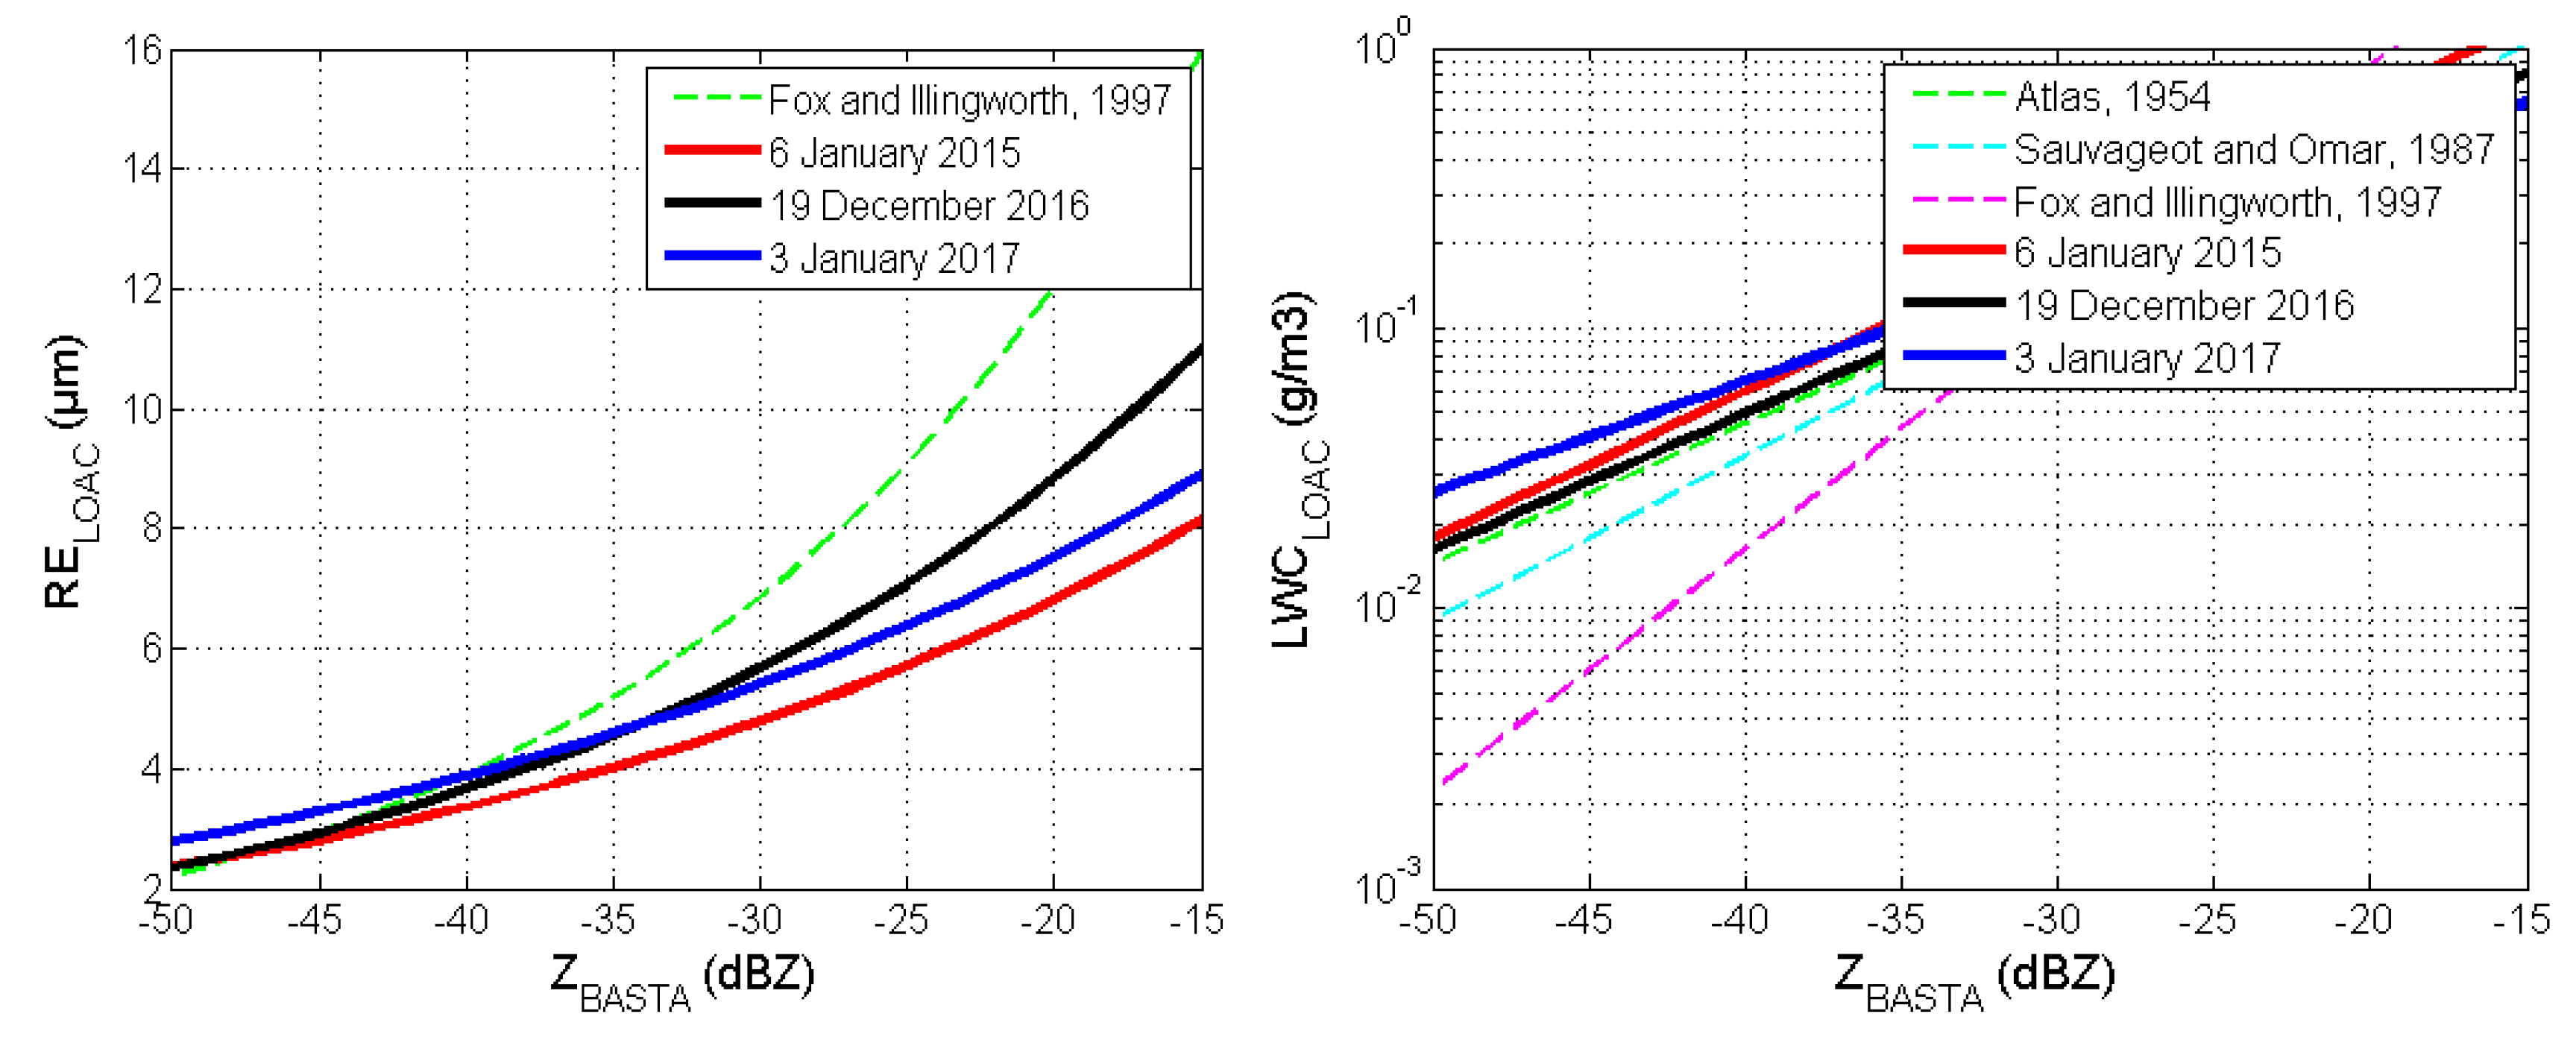
3.6. Discussion on the Validity of these Relationships

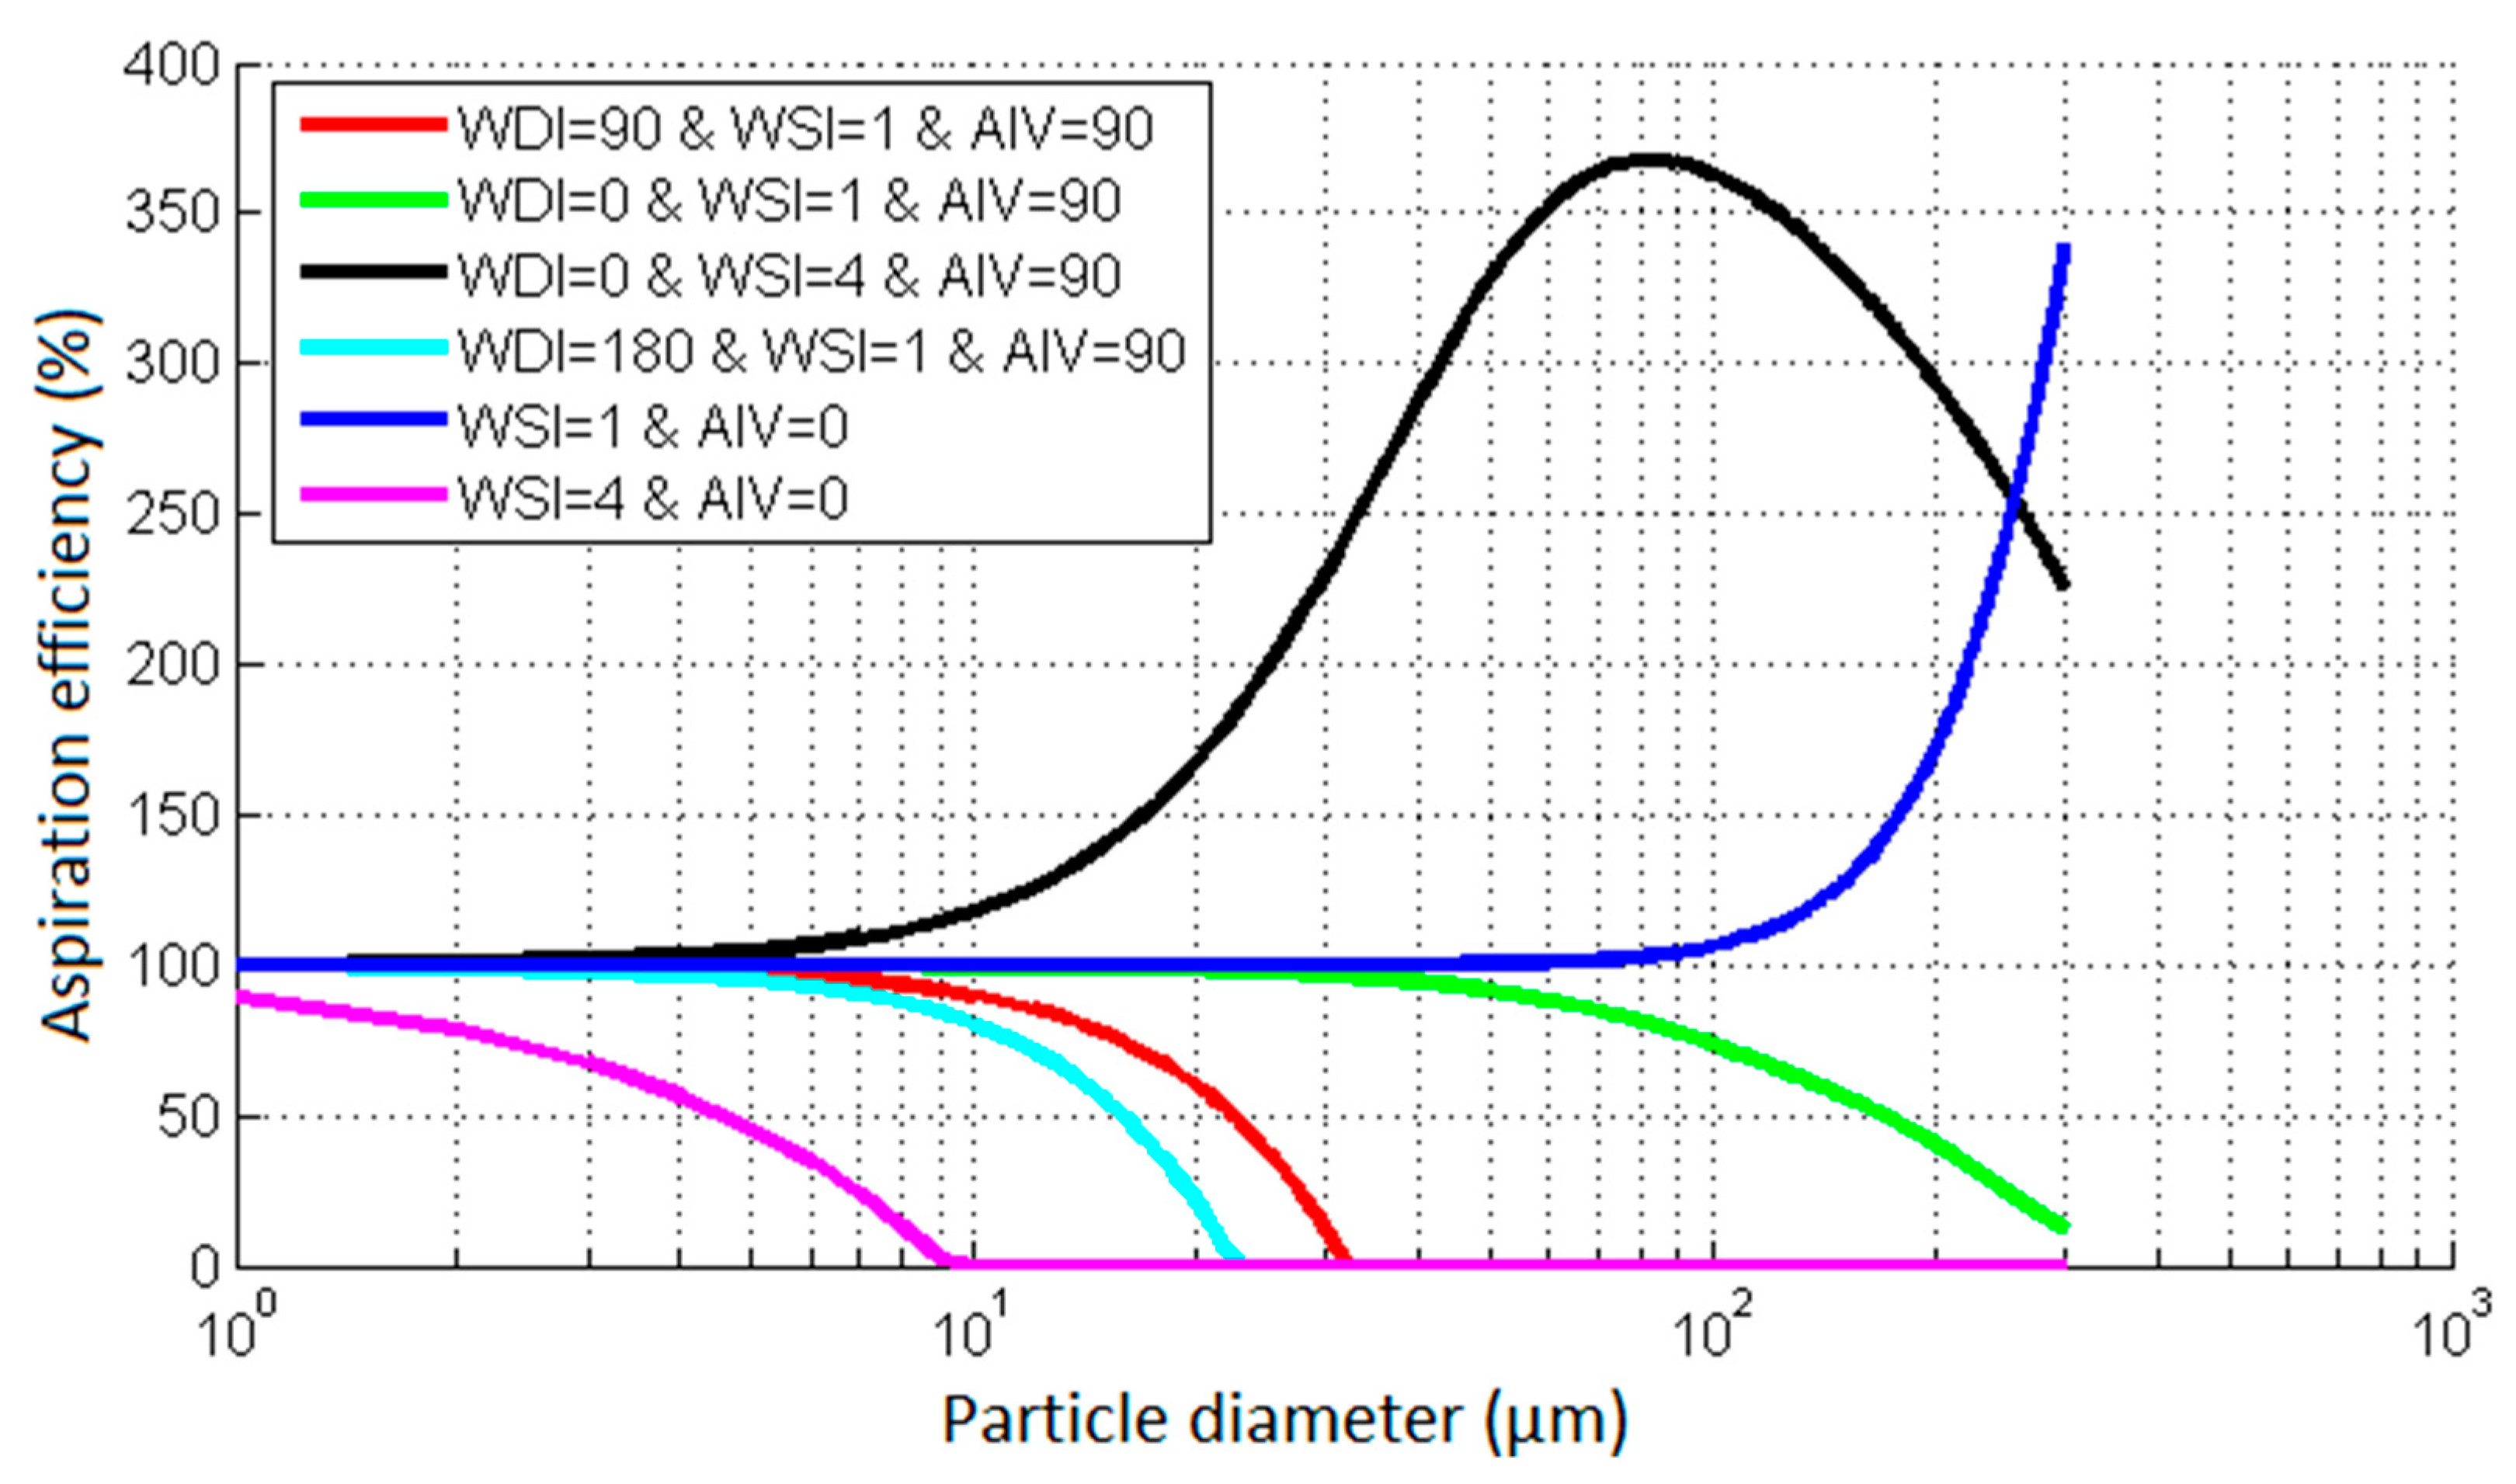
3.6.1. Impact of Aspiration Efficiency

In this part we discuss the validity of each relationship depending on the capacity of the in situ and remote-sensing instrument to characterize cloud microphysics in fog layers. In Table 3, Table 4 and Table 5, we show the range of variability for Z measured by the cloud radar BASTA but also for LWC, Re and CDNC derived with Equations (3), (5) and (6), respectively. The main limitation of this method is the tendency of the LOAC sensor to collect the biggest droplets, which lead to drizzle and precipitation.
For the three tethered balloon flights, we observed reflectivity ranges between −58 and −6 dBZ and 98% of data with Z < −15 dBZ (the final 2% correspond to the flight on 6 January 2015 around 12:00). The value of Z = −15 dBZ corresponds to the limit between the sedimentation and drizzle characterized by bigger droplets of several hundreds of micrometers [11]. These biggest drops cannot be collected by the LOAC sensor due to the low inlet flow of about 2.5 L/min; the aspiration efficiency is near 0 for these types of particles.
To better understand the impact of drizzle and dynamics on the droplet collection by the LOAC sensor, we apply the [8] methodology to derive the aspiration efficiency (AE) of a thin sampler in calm air and low velocity. For the test, we consider a temperature around 283.15 K, atmospheric pressure of 1013 hPa, particle volumic pass of 1000 kg/m3 with an inlet tube diameter of 8 mm with a sampling rate of 2.5 L/min. We quantified the relationship between the aspiration efficiency and the particle size ranging from 1–300 µm (Figure 7). We tested the sensitivity (1) to the external wind direction compared to the inlet, noted WDI; (2) to external wind speed compared to the inlet flow, noted inlet-relative wind speed (WSI); and (3) to the angle of inlet attack from the vertical, noted inlet angle of attack from the vertical (AIV).
For a low wind speed of about 1 m/s and an inlet oriented to the vertical (AIV = 0°, blue curve), the droplet settling velocity drives the aspiration efficiency reaching 350% for particle size of 300 µm. The aspiration efficiency is quasi constant at 100% until 100 µm. When the inlet angle of attack from the vertical (AIV) equals 90° (horizontal tube, green curve), AE is 100% until 20 µm to reach 19% for particle size of 300 µm: gravitational settling competes with inlet aspiration and LOAC sensor is unable to collect particles bigger than 500 µm. For an inlet turned away from the wind (cyan curve), the aspiration efficiency reaches 0% for droplet size of 23 µm. When the inlet is faced to an external wind around 4 m/s (black curve), the aspiration efficiency increases from 100% (for a particle diameter of 1 µm) to 370% at 80 µm; the external wind forces the particles to be collected by the LOAC sensor. At the opposite extreme, for a similar external wind speed of 4 m/s with an angle of 90° relative to the external wind, the aspiration efficiency drops very quickly to 0% for 10 µm.
Given these aspiration efficiency dependencies on wind direction, and that wind direction relative to inlet will vary a lot as the LOAC is turning and moving in the air, which curve we are on will change with time and cause biases that are difficult to correct for. However, improvements to the measurement setup could reduce this bias. For example, the inlet tube could be made to always point into the wind using a wind vane.

3.6.2. Variability of Droplet-Size Distribution

Figure 8 shows the particle-size distribution measured with LOAC sensor for the 19 December 2016, 3 January 2017 and 6 January 2015 along the tethered balloon path. We note a similar peak around 10 µm and a droplet distribution width depending on the case study, i.e., around 300, 100 and 30 #/cm3/µm at 30 µm of diameter for 19 December 2016, 3 January 2017, and 6 January 2015 respectively. This size distribution will have an impact on the aspiration efficiency of the in situ granulometer.
The shape of the size distribution is also important for the theoretical Z-LWC relationship itself, because the LWC is much less sensitive to the biggest droplets than the reflectivity is. The variability of the size distribution during the fog life cycle therefore has an important impact on the Z-LWC [16]. In [26], using in situ measurements at 2 m, authors found important variability in the size distribution both between fog events and during the lifecycle of each event. Therefore, they recommended measurement of the size distribution continuously near the surface as well as vertical profiles in order to obtain more data.

3.6.3. Variability of Parametrical Relationships and Impact on Profiles

To evaluate the importance of the impact of the case-to-case variability of the empirical relationships, we can compare the fits from each of the three case studies on the same data. Figure 9 shows the parametrical relationships between LWC (left) or Re (right) measured with LOAC sensor and cloud radar reflectivity for the different case studies. For a reflectivity around −40 dBZ (−20 dBZ) LWC ranges from 0.03 and 0.06 g/m3 (from 0.2 to 0.7 g/m3). The validity of the LWC-Z relationship, is −50 to −15 dBZ for Z and 0.01 to 1 g/m3 for LWC; for Re-Z relationship, Re ranges from 1 to 11 µm and Z from −50 to −15 dBZ.
Figure 10 shows the vertical profiles of LWC, Re and CDNC for 19 December 2016 between 08:00 and 09:00 derived from Equations (3b), (5) and (6). Red curves correspond to coefficients adjusted using the data from 6 January 2015, the black curve using data from 19 December 2016, and the blue curve using data from 3 January 2017. The maximum difference between each model corresponds to the reflectivity maximum at 300 m agl. The LWC difference reaches 0.17 g/m3 (max at 0.28 g/m3 and min at 0.11 g/m3), the Re difference reaches 2.3 µm (max at 6.2 µm and min at 3.9 µm), and the CDNC difference reaches 300 #/cm3 (max at 500 #/cm3 and min at 200 #/cm3). For this case study, the liquid water closure with the HATPRO microwave radiometer described in Section 3.5 allows us to validate the LWC profile fitted for the corresponding day (19 December 2016).

4. Comparison and Discussion of Two Stratus-Fog Events

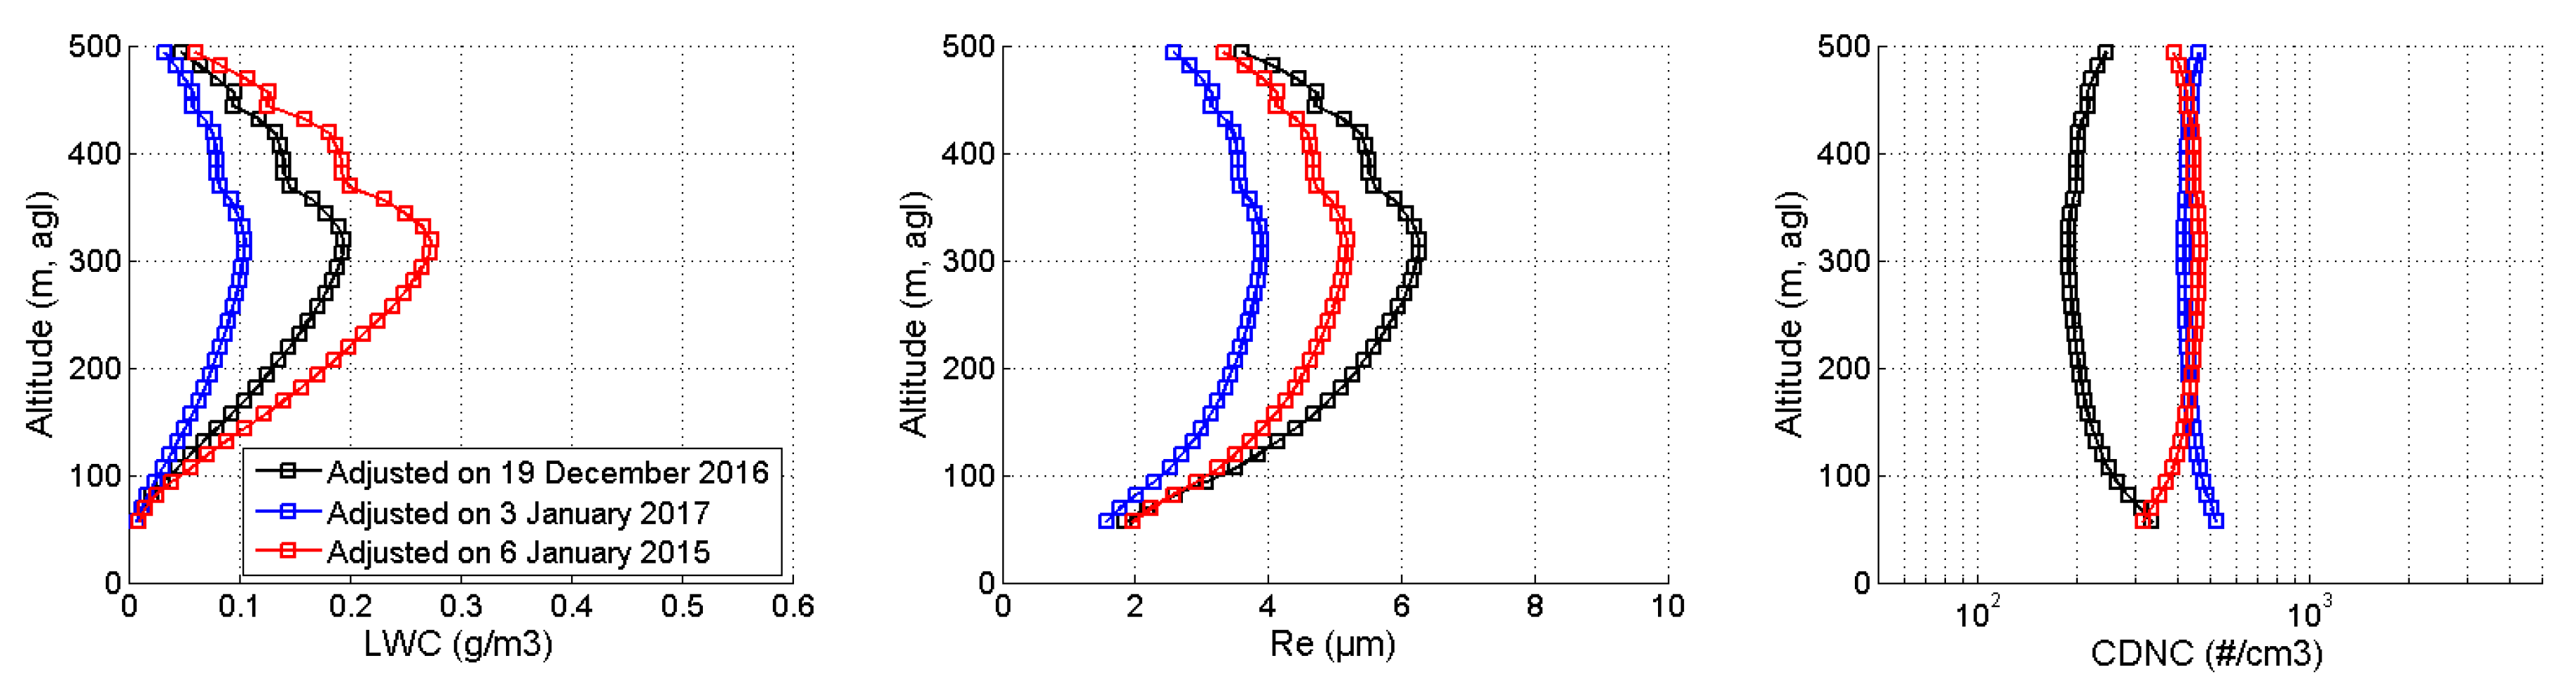
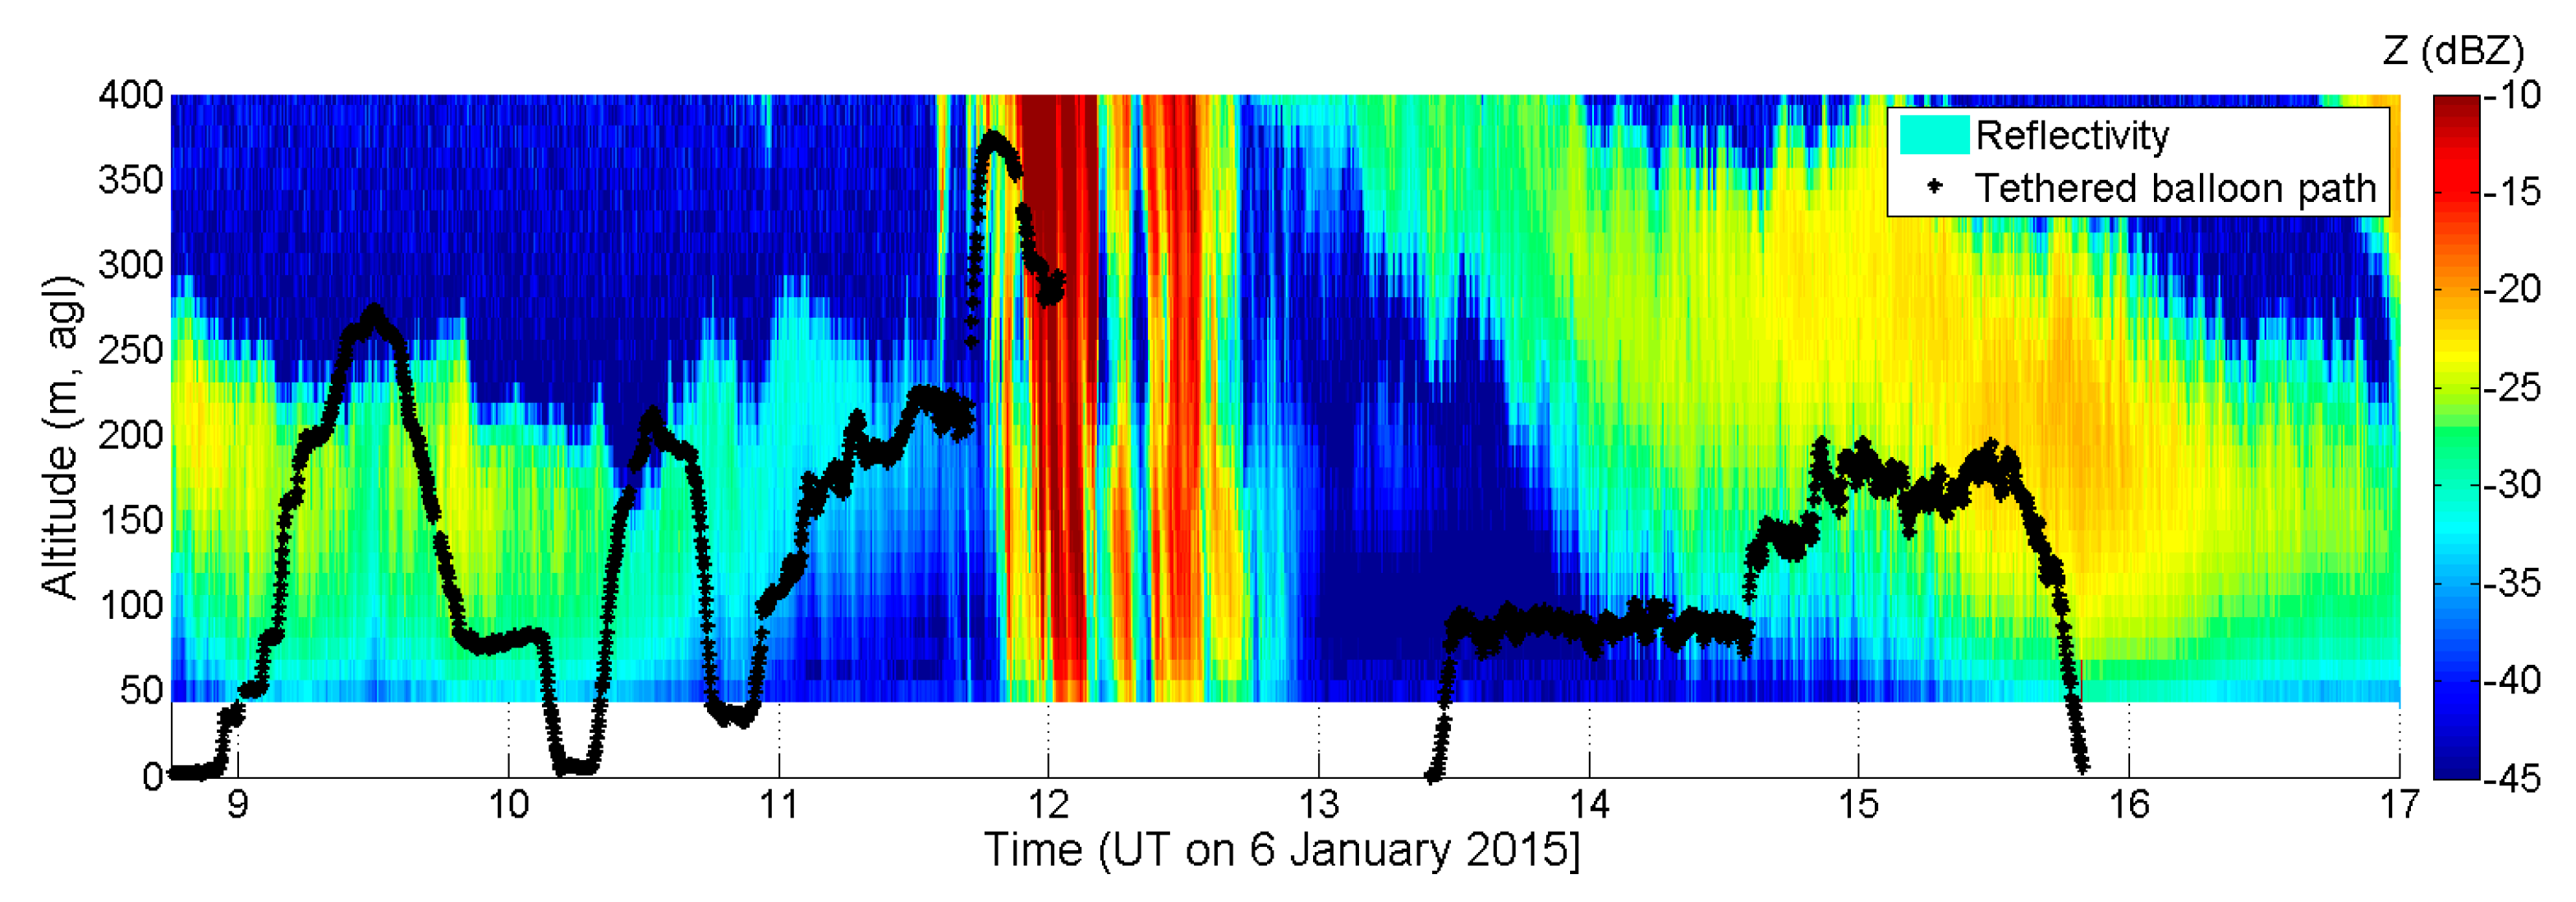
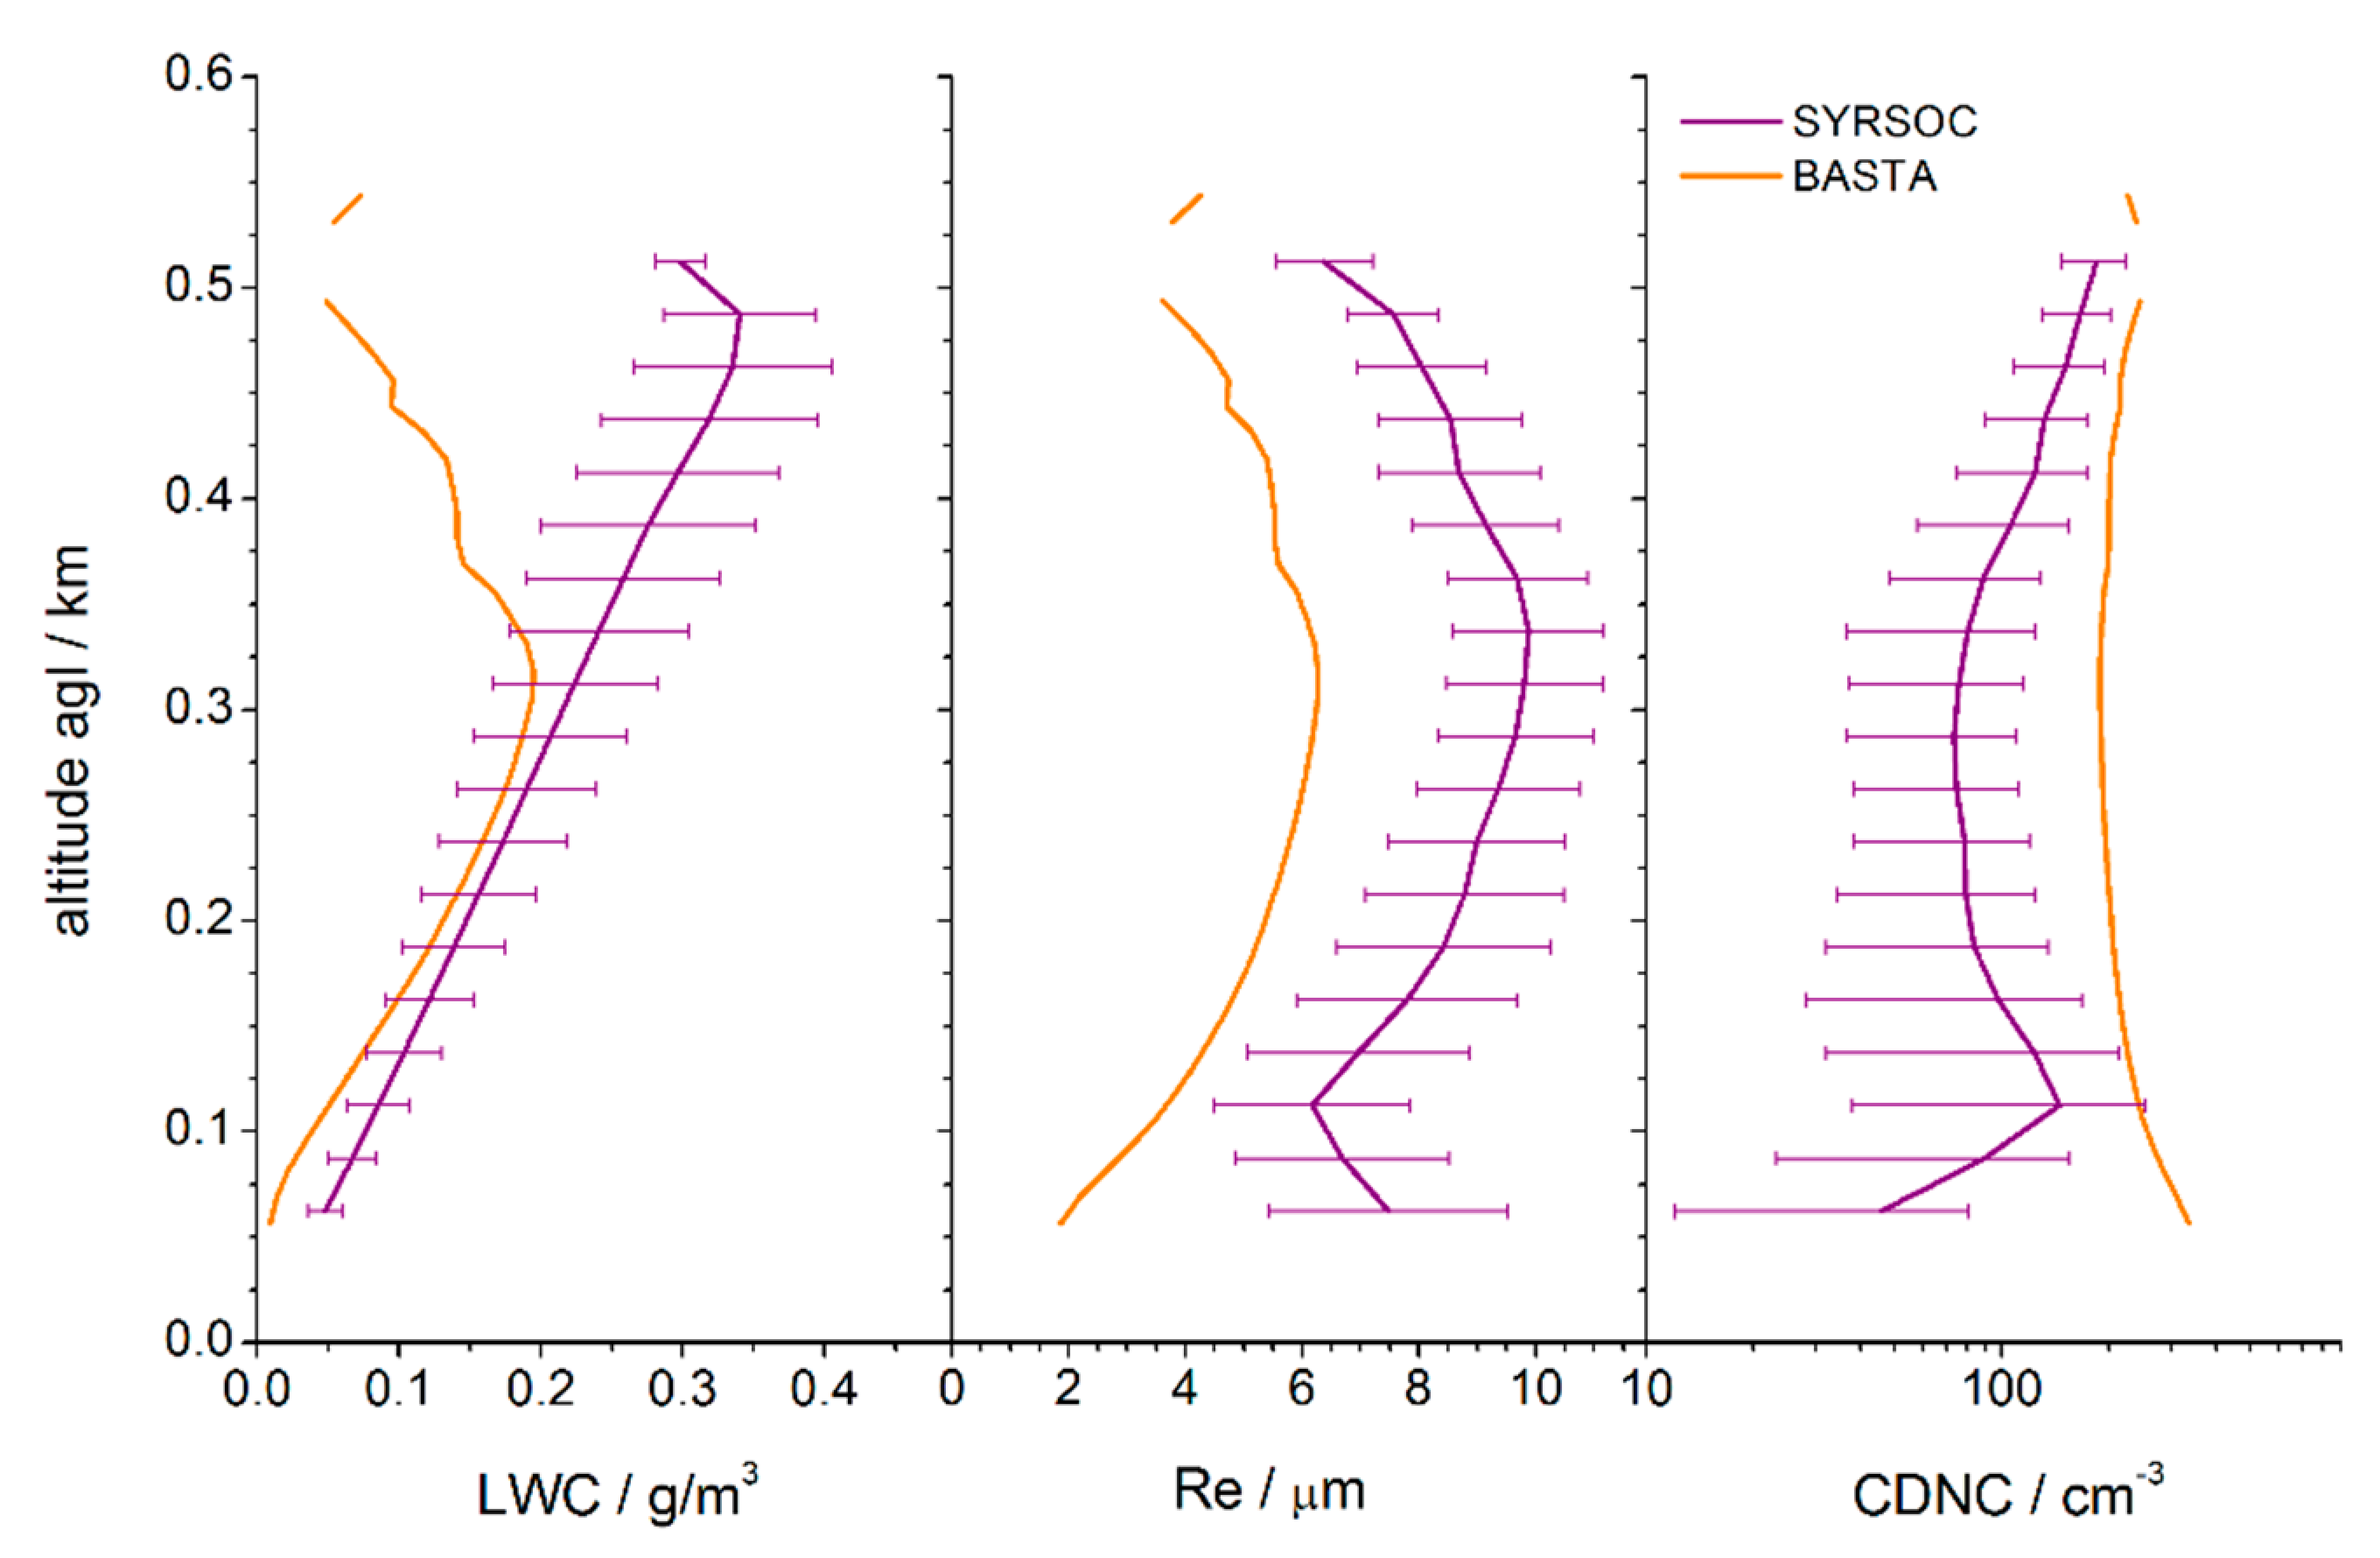
4.1. Vertical Profiles of Microphysical Properties on 6 January 2015

On 6 January 2015, a tethered balloon flight was performed during 6 h of a stratus-fog event as shown in Figure 11. 2D-color corresponds to the radar reflectivity and the black curve is the tethered balloon trajectory (altitude versus coordinated universal time (UTC)). This 6-h flight is characterized by two periods: one before 12:00 and one after 13:00, separated by one precipitation event.
In Figure 12, we show vertical profiles of liquid water content, effective radius and cloud droplet number concentration derived from LOAC (dark green), BASTA (orange), and SYRSOC algorithm (purple). For BASTA, we distinguish the coincident measurement with LOAC (dashed line), and the complete sampling during the period (solid line). LWC and Re are derived from BASTA with Equations (3) and (5) with corresponding coefficient in Table 3 and Table 4. We consider a first period between 09:00 and 10:00, when only one cloud layer was present and the SYRSOC algorithm was applied. During this period, a complete ascent and descent between the surface and almost 300 m agl has been undertaken with the tethered balloon.
Vertical profiles show a good agreement of CDNC in the center of the cloud. Re from SYRSOC agrees well with the BASTA profile, ranging from 4–8 µm. LOAC Re is lower, ranging from 2–5 µm. Large differences were found for LWC with an increase between cloud base height and cloud top height from 0.1–0.4 g/m3 for SYRSOC algorithm, whereas LOAC and BASTA retrievals do not reach 0.2 g/m3.
During the 14:00 to 16:00 period shown in Figure 13, SYRSOC CDNC and Re profiles agreed very well with LOAC measurements in the lower half of the fog layer, where LOAC profiles were available. For BASTA, we distinguish the coincident measurement with LOAC (dashed orange line), and the complete sampling during the period (solid orange line). Both BASTA profiles overestimate Re and underestimate CDNC, compared to LOAC. BASTA LWC matches LOAC LWC very well for coincident measurements. The average BASTA LWC profile for the whole period is slightly higher, as is the SYRSOC LWC. Besides, there is an increasing difference with height, of the BASTA and SYRSOC LWC, above the cloud center.

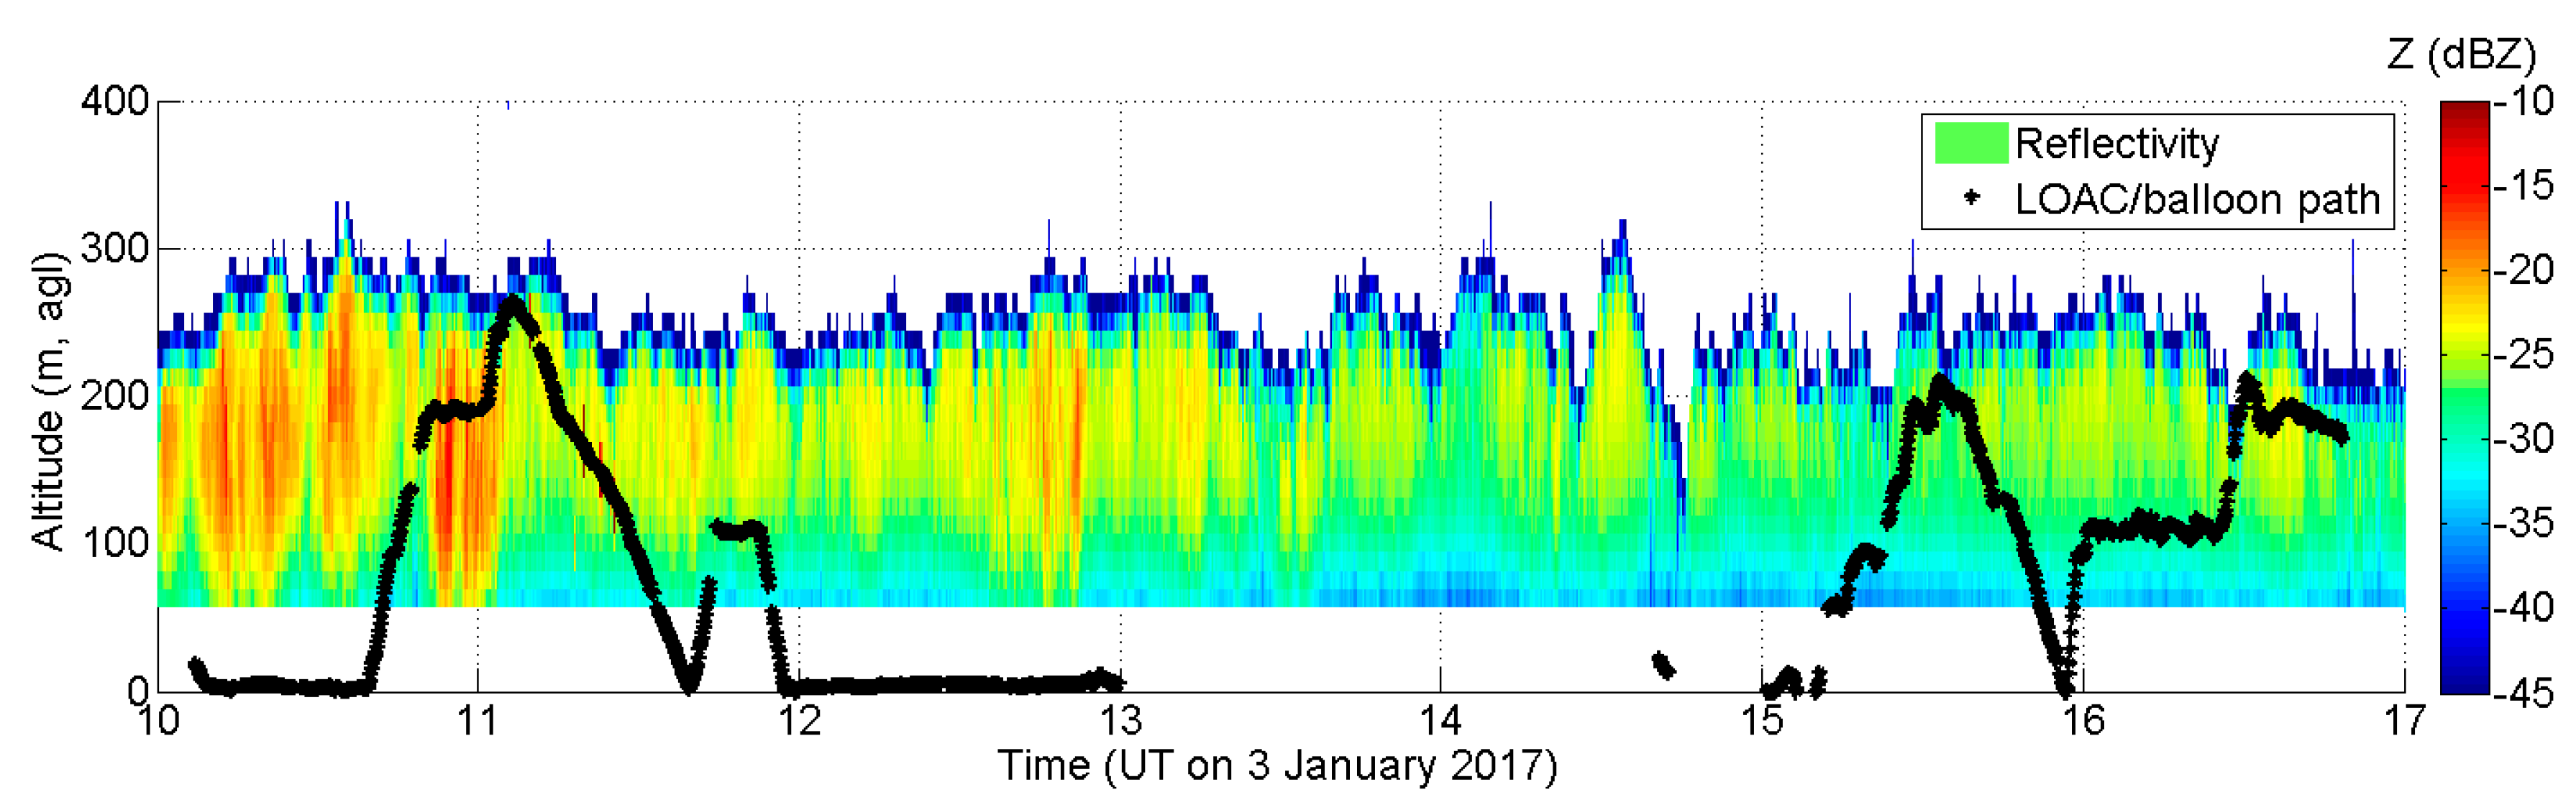
4.2. Vertical Profiles of Microphysical Properties on 19 December 2016

On 19 December 2016, another tethered balloon flight was performed between 06:00 and 08:00 but a second cloud layer at 1 km prevented the use of the SYRSOC algorithm, which requires single-layer clouds or fog. During this period, we compared the LWC calculated from LOAC (derived with droplet size distribution) and derived from BASTA reflectivity and Equation (3). We obtained a slope of 0.89, and intercept of 0.04 with a correlation factor about 0.78. After this 2-h period, the upper layer cloud stopped and SYRSOC profiles could be obtained. SYRSOC output are shown in Figure 14 (purple line) for comparison with coincident BASTA retrievals (orange line).
For this period we note a good agreement of LWC up to the center of the cloud, where the BASTA LWC profile starts decreasing towards the cloud top, but the SYRSOC LWC further increases, reaching 0.35 g/m3 near cloud top. BASTA retrievals show a peak around 300 m agl of 0.2 g/m3, decreasing to a value of 0.02 g/m3 at 500 m agl. The shape of the Re profile is well represented by SYRSOC, but there is an offset of about 2–4 µm from the BASTA Re profile. The BASTA Re profile reaches its maximum of 6 µm at around 300 m agl. At the same altitude, SYRSOC Re is 10 µm. On the other hand, SYRSOC CDNC is much smaller than BASTA CDNC in the center of the cloud (100 #/cm3 for SYRSOC and 200 #/cm3 for BASTA retrievals).

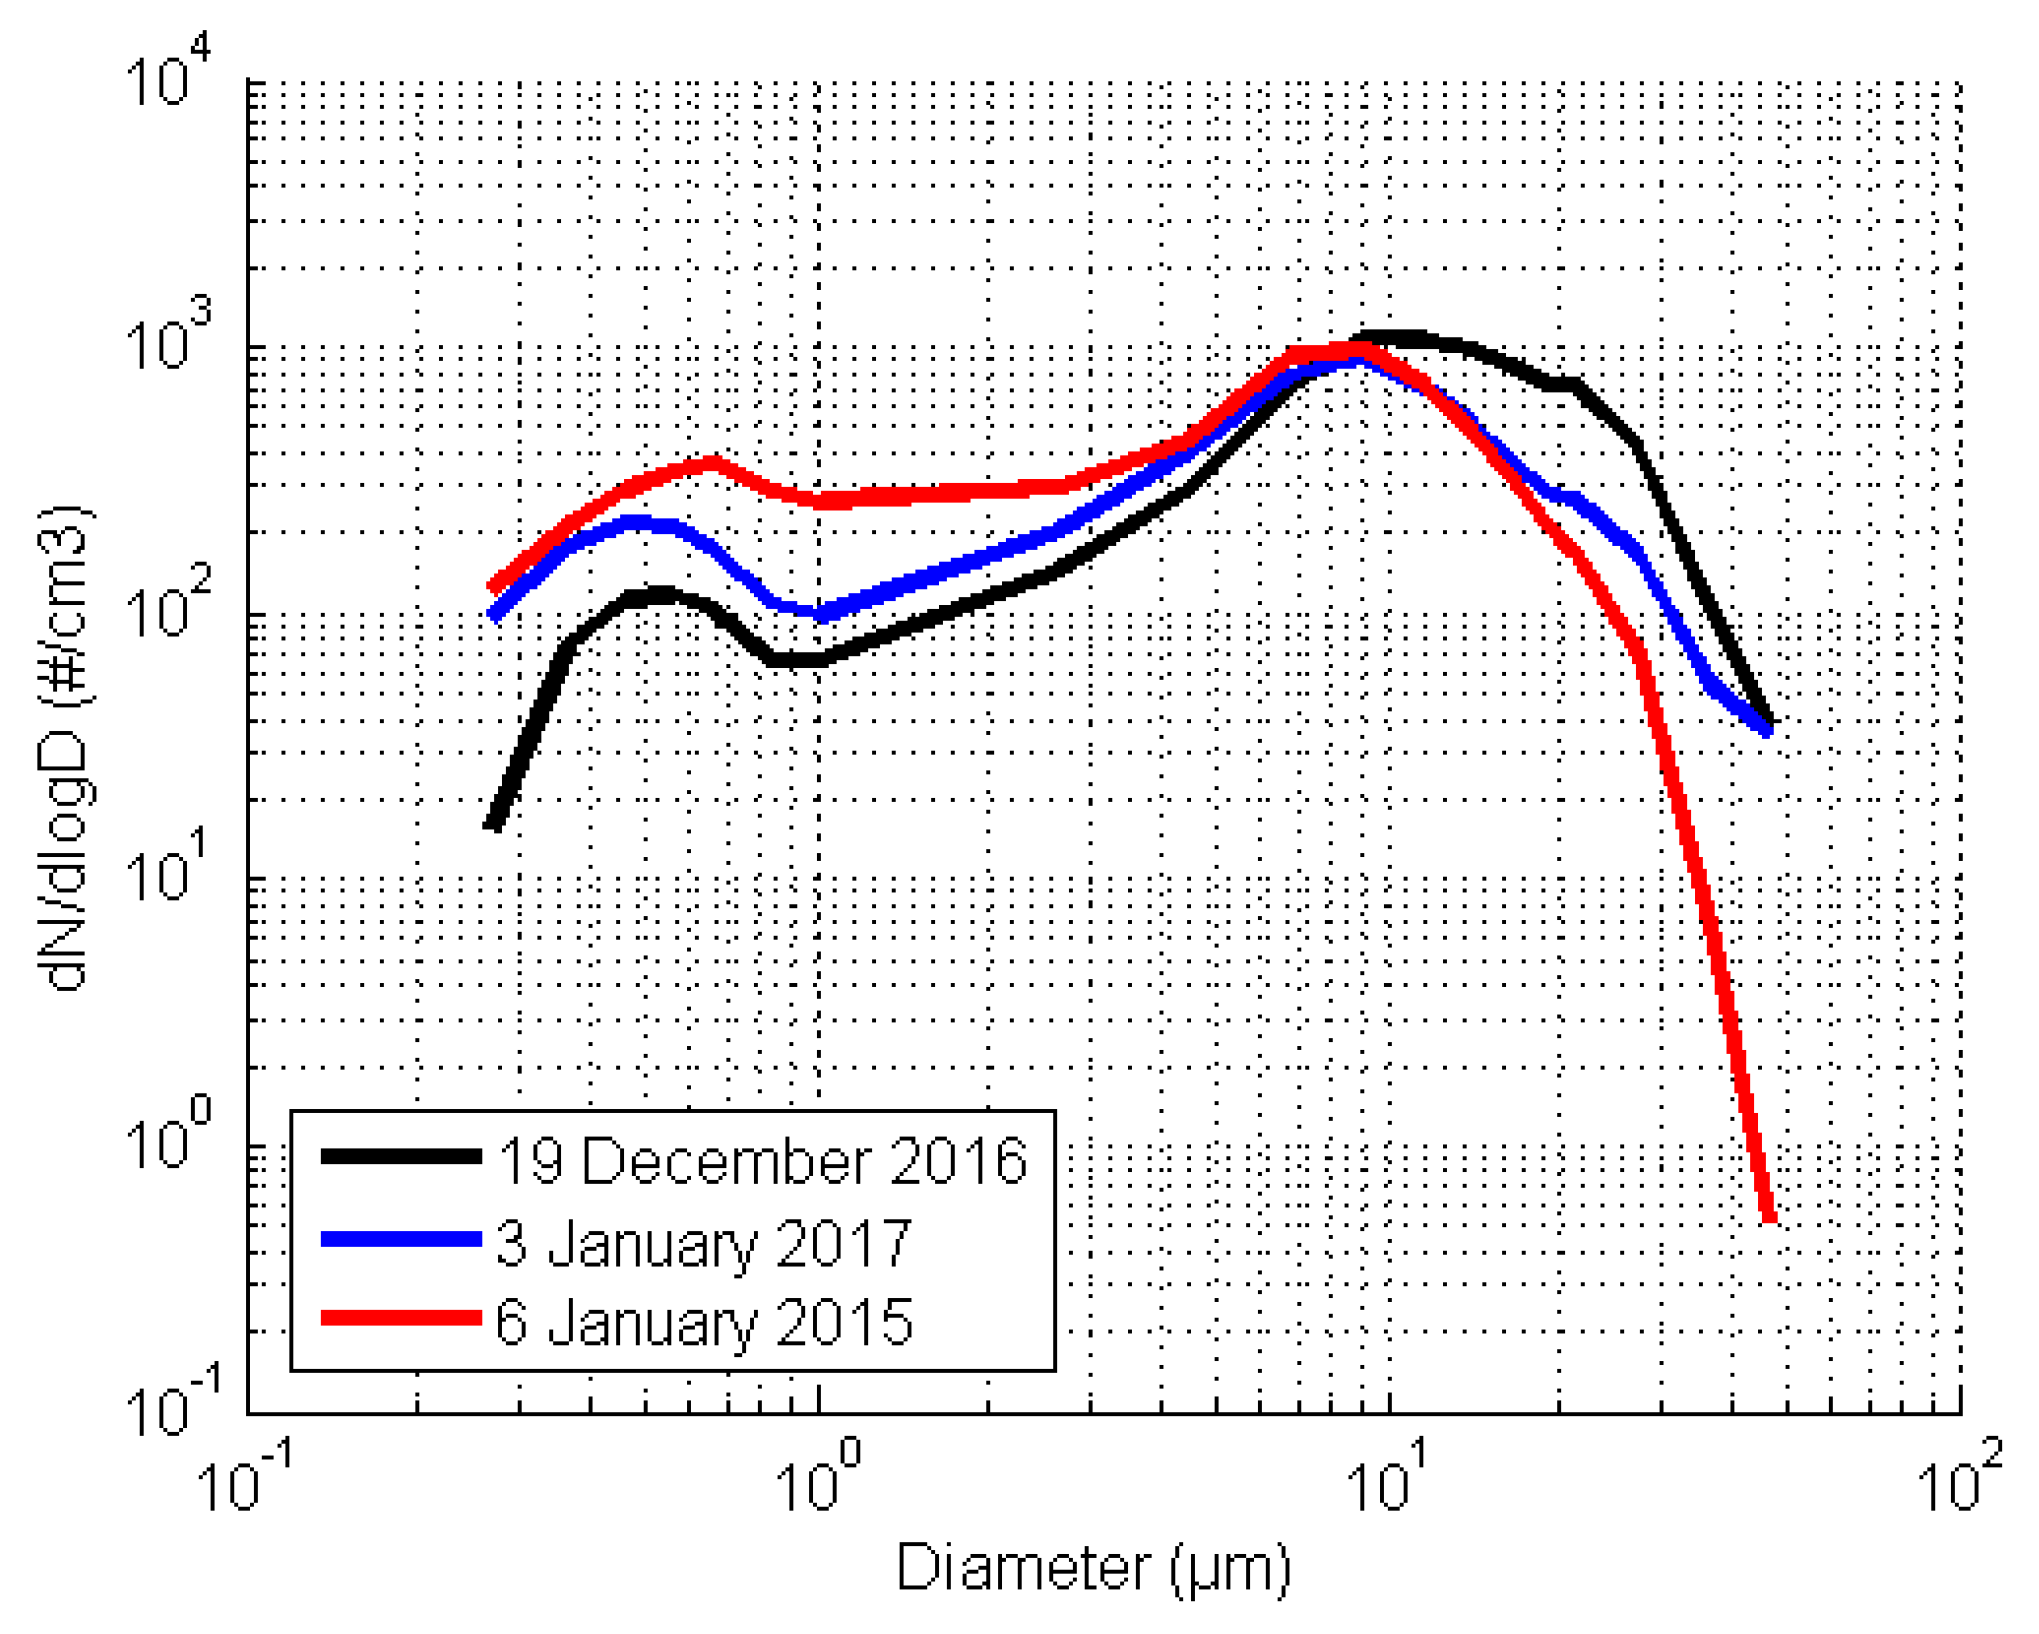
4.3. Discussion of SYRSOC Results

The cloud base in any fog layer is at ground level. However, as stated before, BASTA has a blind zone in the lowest 40 m and a height range of incomplete overlap of outgoing radiation and receiver field of view from 40 m to 240 m [2]. In the case of 19 December 2016, the cloud top was around 500 m. That means nearly half of the fog depth was affected by reduced reflectivity. The fog layer observed in the morning of 6 January 2015 was less than 300 m deep. In this case, nearly the whole layer was affected. Radar reflectivity was corrected from 120 m to 240 m. Below 120 m, reflectivity was assumed constant, using an average value. This correction introduced a discontinuity in the profiles at 120 m.
The three studied periods revealed limitations of SYRSOC, but also ways of improving the algorithm. Performance in fog was improved by correcting for the near field behavior of the cloud radar. An overall improvement of SYRSOC was the implementation of an entrainment factor, taking into account entrainment of dry air at the cloud top, causing a more realistic shape of the LWC profile, decreasing at the cloud top. However, this did not fully account for deviations in the BASTA and SYRSOC LWC profiles. An overestimation of LWC by SYRSOC in the top half of the fog layer was observed in all cases studied here. SYRSOC produces the linear LWC increase expected in water clouds, modified at the top by the entrainment factor. However, the shape of the LWC profile in fog depends on the phase in the fog lifecycle: formation phase, mature phase and dissipation phase. LWC gradients in fog can be positive, quasi-null or negative. This depends on a number of factors, like evaporation at the cloud top, precipitation or sedimentation at the cloud base, evaporation at the cloud base, and temperature and humidity gradients above the fog top. As the fog thickness is limited to some hundreds of meters, those competitive processes have a significant impact on the LWC profile throughout the fog layer. None of these factors are taken into account in SYRSOC, which explains differences between LOAC/BASTA and SYRSOC profiles, not only of LWC, but also of CDNC and Re.

5. Conclusions

The robust dataset developed at the SIRTA site during three intensive operational periods when a tethered balloon was deployed allows us to derive vertical profiles of the low stratus and fog microphysical properties based on almost 200 5-min-periods.
A methodology has been applied to normalize and validate the particle size distribution measured with the LOAC granulometer: a visible extinction closure has been undertaken by comparing the extinction coefficient measured by a diffusometer and derived from Mie theory applied to measured particle-size distribution. Correlation factors range from 0.73 to 0.93 for a dataset composed of more than 200 5-min-periods. As explained in Section 2.3 and Section 3.5, the aspiration efficiency (i.e., 0% up to 350%) and the correlation between the “true” visible extinction and “measured particle-size distribution” (i.e., 0.59 up to 8.2) is correlated with the wind speed and wind direction relative to the inlet axis.
A first relationship between the LWC (measured with the LOAC granulometer) and the Doppler cloud radar reflectivity (noted Z) has been established for our dataset: LWC = 10 Z dBZ 10 log 10 ( α ) β and, α ranges from 0.020 to 0.097 and β from 1.91 to 2.51 with an average reflectivity ranging from −33.4 to −22.7 dBZ leading to a LWC ranging from 0.07 to 0.19 g/m3. A second relationship between effective radius (Re) and Doppler cloud radar reflectivity has also been established, Re = 10 ( Z ( dBZ ) δ ) / γ with γ ranging from 52.0 to 69.2, δ from −69.2 to −80.7, for an effective radius Re ranging from 3.6 to 5.7 µm. The cloud droplet number concentration is deduced from these 2 equations, and average CDNC ranges from 13 to 113 cm−3.
In the fourth section, we applied the SYRSOC algorithm to three fog periods when the tethered balloon was deployed and we compared the LWC, CDNC and Re vertical profiles. Overall, the SYRSOC CDNC and Re profiles agreed well with either LOAC in situ, or BASTA profiles, or both. An overestimation of LWC by SYRSOC in the top half of the fog layer was observed in all of the cases studied here. This is due to dominant processes in fog layers which are not accounted for in the cloud algorithm SYRSOC.
The experiments carried out in this study confirm that the relationship between Z and LWC varies importantly from one fog event to another and that more continuous in situ measurements of the vertical profile of fog microphysics are needed. The amount of data from such measurements currently available is very limited, mainly because the tethered balloon measurements need to be carried out manually. One way to gain more continuous measurements would be to lift the instrument with an automatized drone rather than a balloon. This would allow not only measurement to be automated, but also the sensor to be kept more still in the air and to ensure that the air inlet always points in the direction of the wind, which we found in this paper to be an important issue to address in order to improve the quality of the retrievals.

Author Contributions

E.W. contributed in the experiments with the tethered balloon. J.D. and J.-B.R. analyzed the data on BASTA cloud radar and LOAC granulometer, respectively. J.P. and C.O. did the SYRSOC numerical simulations. J.-C.D. and M.H. designed and performed the experiment, analyzed the data and wrote the paper.

Acknowledgments

The authors would like to thank the technical and computer staff of the SIRTA Observatory for taking the observations and making the data set easily accessible. The authors would like to acknowledge Meteo-France for providing CL31 data, the European Union’s Horizon 2020 research and innovation programme under grant agreement No. 654109 for ACTRIS TransNational Access funding of Jana Preißler, and the Irish Environmental Protection Agency for her fellowship (2015-CCRP-FS.24).

Conflicts of Interest

The authors declare no conflict of interest.

References

  1. Bergot, T.; Terradellas, E.; Cuxart, J.; Mira, A.; Liechti, O.; Mueller, M.; Nielsen, N.W. Intercomparison of single-column numerical models for the prediction of radiation fog. J. Appl. Meteorol. 2007, 46, 504–521. [Google Scholar] [CrossRef]
  2. Delanoe, J.; Protat, A.; Vinson, J.P.; Brett, W.; Caudoux, C.; Bertrand, F.; Parent du Chatelet, J.; Hallali, R.; Barthes, L.; Haeffelin, M.; et al. BASTA: A 95-GHz FMCW Doppler radar for cloud and fog studies. J. Atmos. Ocean. Technol. 2016, 33, 1023–1038. [Google Scholar] [CrossRef]
  3. Donovan, D.P.; van Lammeren, A.C.A.P. Cloud effective particle size and water content profile retrievals using combined lidar and radar observations: 1. Theory and examples. J. Geophys. Res. 2001, 106, 27425–27448. [Google Scholar] [CrossRef]
  4. Dupont, J.C.; Haeffelin, M.; Protat, A.; Bouniol, D.; Boyouk, N.; Morille, Y. Stratus fog formation and dissipation. A 6-day case study. Bound.-Layer Meteorol. 2012, 143, 207–225. [Google Scholar] [CrossRef]
  5. Dupont, J.C.; Haeffelin, M.; Stolaki, S.; Elias, T. Analysis of Dynamical and Thermal Processes Driving Fog and Quasi-Fog Life Cycles Using the 2010–2013 ParisFog Dataset. Pure Appl. Geophys. 2016, 173, 1337–1358. [Google Scholar] [CrossRef]
  6. Elias, T.; Haeffelin, M.; Drobinski, P.; Gomes, L.; Rangognio, J.; Bergot, T.; Chazette, P.; Raut, J.C.; Colomb, M. Particulate contribution to extinction of visible radiation: Pollution, haze, and fog. Atmos. Res. 2012, 92, 443–454. [Google Scholar] [CrossRef]
  7. Fox, N.I.; Illingworth, A.J. The retrieval of stratocumulus cloud properties by ground-based cloud radar. J. Appl. Meteorol. 1997, 36, 485–492. [Google Scholar] [CrossRef]
  8. Grinshpun, S.; Willeke, K.; Kalatoor, S. A general equation for aerosol aspiration by thin-walled sampling probes in calm and moving air. Atmos. Environ. A-Gen. 1993, 27, 1459–1470. [Google Scholar] [CrossRef]
  9. Gultepe, I.; Tardif, R.; Michaelides, S.C.; Cermak, J.; Bott, A.; Bendix, J.; Müller, M.D.; PagowskiI, M.; Hansen, B.; Ellrod, G.; et al. Fog research: A review of past achievements and Future perspectives. Pure Appl. Geophys. 2007, 164, 1121–1159. [Google Scholar] [CrossRef]
  10. Haeffelin, M.; Barthès, L.; Bock, O.; Boitel, C.; Bony, S.; Bouniol, D.; Chepfer, H.; Chiriaco, M.; Cuesta, J.; Delanoe, J.; et al. SIRTA, a ground-based atmospheric observatory for cloud and aerosol research. Ann. Geophys. 2005, 23, 253–275. [Google Scholar] [CrossRef]
  11. Hogan, R.J.; Bouniol, D.; Ladd, D.N.; O’Connor, E.J.; Illingworth, A.J. Absolute calibration of 94/95-GHz radars using rain. J. Atmos. Ocean. Technol. 2003, 20, 572–580. [Google Scholar] [CrossRef]
  12. Koschmieder, H. Theorie der horizontalen Sichtweite. Beitraege Physicae Freiberger Atmos. 1924, 12, 33–55. [Google Scholar]
  13. Liao, L.; Sassen, K. Investigation of relationships between Ka-band radar reflectivity and ice and liquid water contents. Atmos. Res. 1994, 34, 231–248. [Google Scholar] [CrossRef]
  14. Löhnert, U.; Crewel, S.; Simmer, C.; Macke, A. Profiling cloud liquid water by combining active and passive microwave measurements with cloud model statistics. J. Atmos. Ocean. Technol. 2001, 18, 1354–1366. [Google Scholar] [CrossRef]
  15. Martucci, G.; O’Dowd, C.D. Ground-based retrieval of continental and marine warm cloud microphysics. Atmos. Meas. Technol. 2011, 4, 2749–2765. [Google Scholar] [CrossRef]
  16. Maier, F.; Bendix, J.; Thies, B. Simulating Z-LWC relations in natural fogs with radiative transfer calculations for future application to a cloud radar profiler. Pure Appl. Geophys. 2012, 169, 793–807. [Google Scholar] [CrossRef]
  17. Niu, S.J.; Lu, C.S.; Yu, H.Y.; Zhao, L.; Lü, J. Fog research in China: An overview. Adv. Atmos. Sci. 2010, 27, 639–661. [Google Scholar] [CrossRef]
  18. Pagowski, M.; Gultepe, I.; King, P. Analysis and modelling of an extremely dense fog event in southern Ontario. J. Appl. Meteorol. 2004, 43, 3–16. [Google Scholar] [CrossRef]
  19. Preißler, J.; Martucci, G.; Saponaro, G.; Ovadnevaite, J.; Vaishya, A.; Kolmonen, P.; Ceburnis, D.; Sogacheva, L.; Leeuw, G.; O’Dowd, C. Six years of surface remote sensing of stratiform warm clouds in marine and continental air over Mace Head, Ireland. J. Geophys. Res. Atmos. 2016, 121, 538–557. [Google Scholar] [CrossRef]
  20. Renard, J.B.; Dulac, F.; Berthet, G.; Lurton, T.; Vignelles, D.; Jégou, F.; Dupont, J.C.; Verdier, N. LOAC: A light aerosols counter for ground-based and balloon measurements of the size distribution and of the main nature of atmospheric particles, 2. First results from balloon and unmanned aerial vehicle flights. Atmos. Meas. Technol. 2016, 9, 3673–3686. [Google Scholar] [CrossRef]
  21. Renard, J.B.; Dulac, F.; Berthet, G.; Lurton, T.; Vignelles, D.; Jégou, F.; Dupont, J.C.; Verdier, N. LOAC: A light aerosols counter for ground-based and balloon measurements of the size distribution and of the main nature of atmospheric particles, 1. Principle of measurements and instrument evaluation. Atmos. Meas. Technol. 2016, 9, 1721–1742. [Google Scholar] [CrossRef] [Green Version]
  22. Sauvageot, H.; Omar, J. Radar reflectivity of cumulus clouds. J. Atmos. Ocean. Technol. 1987, 4, 264–272. [Google Scholar] [CrossRef]
  23. Sekelsky, S.M. Near-field reflectivity and antenna boresight gain corrections for millimeter-wave atmospheric radars. J. Atmos. Ocean. Technol. 2002, 19, 468–477. [Google Scholar] [CrossRef]
  24. Stolaki, S.; Pytharoulis, I.; Karacostas, T. A study of fog characteristics using a coupled WRF-COBEL model over Thessaloniki airport, Greece. Pure Appl. Geophys. 2012, 169, 961–981. [Google Scholar] [CrossRef]
  25. Tardif, R. The impact of vertical resolution in the explicit numerical forecasting of radiation fog: A case study. Pure Appl. Geophys. 2007, 164, 1221–1240. [Google Scholar] [CrossRef]
  26. Thies, B.; Egli, S.; Bendix, J. The Influence of Drop Size Distributions on the Relationship between Liquid Water Content and Radar Reflectivity in Radiation Fogs. Atmosphere 2017, 8, 142. [Google Scholar] [CrossRef]
  27. Wærsted, E.G.; Haeffelin, M.; Dupont, J.-C.; Delanoë, J.; Dubuisson, P. Radiation in fog: Quantification of the impact on fog liquid water based on ground-based remote sensing. Atmos. Chem. Phys. 2017, 17, 10811–10835. [Google Scholar] [CrossRef]
  28. Wendisch, M.; Mertes, S.; Heintzenberg, J.; Wiedensohler, A.; Schell, D.; Wobrock, W.; Frank, G.; Martinsson, B.G.; Fuzzi, S.; Orsi, G.; et al. Drop size distribution and LWC in Po Valley fog. Contrib. Atmos. Phys. 1998, 71, 87–100. [Google Scholar]
Figure 1. Cloud radar reflectivity and tethered balloon path on 3 January 2017.
Atmosphere 09 00169 g001
Figure 2. Particle-size distribution derived from LOAC sensor on 3 January 2017 at 10:00 and 11:00 UT.
Atmosphere 09 00169 g002
Figure 3. Time series of extinction coefficient derived from LOAC granulometer and DF320 diffusometer (left) and scatter plot of LOAC extinction coefficient versus DF320 extinction coefficient for 19 December 2016 (right).
Atmosphere 09 00169 g003
Figure 4. Relationship between liquid water content (LWC) measured with the LOAC sensor and radar reflectivity measured with BASTA for the three case studies (black markers for 19 December 2016, blue markers for 3 January 2017 and red markers for 6 January 2015).
Atmosphere 09 00169 g004
Figure 5. Relationship between effective radius (Re) measured with the LOAC sensor and radar reflectivity measured with BASTA for the three case studies (black markers for 19 December 2016, blue markers for 3 January 2017 and red markers for 6 January 2015).
Atmosphere 09 00169 g005
Figure 6. Liquid water path derived from Equation (7) versus liquid water path measured by HATPRO microwave radiometer (MWR).
Atmosphere 09 00169 g006
Figure 7. Sensitivity test on aspiration efficiency versus particle diameter for several configurations of inlet-relative wind direction (WDI) and speed (WSI), and angle of inlet attack from the vertical (AIV).
Atmosphere 09 00169 g007
Figure 8. Particle size distribution measured with LOAC for 19 December 2016, 3 January 2017 and 6 January 2015 along the tethered balloon path.
Atmosphere 09 00169 g008
Figure 9. Parametrical relationship between LWC (right) or Re (left) and reflectivity for these three tethered balloon flights and previous studies (Atlas, 1954, Sauvageot and Omar, 1987, and Fox and Illingworth, 1997).
Atmosphere 09 00169 g009
Figure 10. Vertical profiles of LWC, Re and CDNC for 19 December 2016 between 08:00 and 09:00, derived from Equations (3b), (5) and (6) for the 3 pairs of fitted parameters.
Atmosphere 09 00169 g010
Figure 11. Time series of cloud radar reflectivity on 6 January 2015 and tethered balloon flight trajectory in cloud layer (black markers).
Atmosphere 09 00169 g011
Figure 12. Vertical profile of LWC (left), Re (middle), CDNC (right) derived from LOAC, BASTA, and SYRSOC algorithm between 09:00 and 10:00 on 6 January 2015. Error bars on SYRSOC profiles indicate standard deviation of the mean over the 1-h period.
Atmosphere 09 00169 g012
Figure 13. Vertical profile of LWC (left), Re (middle), CDNC (right) derived from LOAC, BASTA, and SYRSOC algorithm between 14:00 and 16:00 on 6 January 2015. Error bars on SYRSOC profiles indicate standard deviation of the mean over the 2-h period.
Atmosphere 09 00169 g013
Figure 14. Vertical profile of LWC (left), Re (middle), CDNC (right), derived from BASTA, and SYRSOC algorithm between 08:00 and 09:00 on 19 December 2016. Error bars on SYRSOC profiles indicate standard deviation of the mean over the 1-h period.
Atmosphere 09 00169 g014
Table 1. Active and passive remote sensing instruments and the in-situ sensors deployed at the Instrumented Site for Atmospheric Remote Sensing Research (SIRTA) site and used for this study.
Type of InstrumentNameParametersSamplingUncertainty
Remote-sensing instrumentsBistatic Radar System for Atmospheric Studies (BASTA) cloud radar (95 GHz)Reflectivity, Doppler velocity, cloud top height12 s0.5 dBZ, 0.2 m/s
Humidity and Temperature Profiler (HATPRO) microwave radiometerLiquid water path (LWP)5 minLWP ± 20 g/m²
CL31 CeilometerCloud base height1 min7.5 m
CHM15K CeilometerCloud base height1 min7.5 m
In situ sensorsDegreane DF320 diffusometerHorizontal visibility (km) at 4 m agl1 min±10–25%
Light optical aerosol counter (LOAC) granulometerParticle-size distribution for particles ranging from 0.2 to 50 µm (in diameter)1 min
Sampling 2.5 L/min
Table 2. Coefficients used to normalize the LOAC cloud droplet number concentration (CDNC) compared to visible extinction derived from DF320 diffusometer for the four case studies at 4 m agl.
Normalization ProcedureSlope#ρAverage Temp. (°C)Average Wind Speed (m/s)Average CDNC (#/cm3)
Total, and >10 µm
Average Visibility (m)
6 January 20158.2860.93−1.22.2840/40670
19 December 20160.59760.883.40.5465/55500
3 January 20170.921570.730.91.8930/35180
17 February 2017 *4.2450.837.61.1270/110320
* This case study is used in this part solely because the LOAC was fixed at the ground next to the diffusometer, and we did not deploy the tethered balloon; # corresponds to the sample for each day.
Table 3. Parametrical coefficient to optimize Equation (3) with Z measured with cloud radar and LWC measured by LOAC sensor along the tethered balloon flight.
Equation (3)αβ#ρAverage Z (min, max) (dBZ)Average LWC (min, max) (g/m3)
Atlas, 19540.0482/ //
Sauvageot and Omar, 19870.0301.7/0.67//
Fox and Illingworth, 19970.0121.16/0.82//
Flight 1. 6 January 20150.0201.91620.79−38.4
(−57.5, −25.1)
0.07
(0.03, 0.26)
Flight 2. 19 December 20160.0492.06430.88−27.7
(−48.5, −19.8)
0.19
(0.02, 0.35)
Flight 3. 3 January 20170.0972.51810.74−25.1
(−43.4, −11.5)
0.1
(0.01, 0.85)
Table 4. Parametrical coefficient to optimize Equation (5) to derive Re with Z measured with the cloud radar and by the LOAC sensor along the tethered balloon flight.
Equation (4)γδAverage Re * (min, max) (µm)#ρAverage Z (min, max) (dBZ)Average Re (min, max) (µm)
Fox and Illingworth, 200740.9−64.24////
Flight 1. 6 January 201565.0−74.23.6
(1.1, 4.9)
620.74−38.4
(−57.5, −25.1)
4.9
(0.8, 8.6)
Flight 2. 19 December 201652.0−69.25.7
(2.1, 7.2)
430.86−27.7
(−48.5, −19.8)
6.8
(1.1, 9.4)
Flight 3. 3 January 2017 69.2−80.74.3
(1.7, 9.5)
810.78−25.1
(−43.4, −11.5)
5
(0.8, 12.6)
* Measured by the LOAC sensor.
Table 5. Cloud droplet number concentration (CDNC) derived with Equation (6) for LWC and Re derived from Equations (3) and (5).
Equation (4)CDNC *
(#/cm3)
Average Z
(min, max) (dBZ)
Average CDNC
(min, max) (#/cm3)
Flight 1. 6 January 2015108−33.4
(−52.5, −20.1)
113
(95, 166)
Flight 2. 19 December 201658−22.7
(−43.5, −14.8)
65
(62, 97)
Flight 3. 3 January 2017154−25.1
(−43.4, −11.5)
133
(5, 155)
* Measured by LOAC sensor.

