Article

Observed Correlation between Aerosol and Cloud Base Height for Low Clouds at Baltimore and New York, United States

1
NOAA Center for Atmospheric Sciences, Howard University, Washington, DC 20059, USA
2
Department of Physics & Astronomy, Howard University, Washington, DC 20059, USA
*
Author to whom correspondence should be addressed.
Atmosphere 2018, 9(4), 143; https://doi.org/10.3390/atmos9040143
Submission received: 12 February 2018 / Revised: 19 March 2018 / Accepted: 4 April 2018 / Published: 11 April 2018
(This article belongs to the Special Issue Atmospheric Aerosol Composition and its Impact on Clouds)

Abstract

:
The correlation between aerosol particulate matter with aerodynamic diameter ≤2.5 μ m (PM2.5) and cloud base height (CBH) of low clouds (CBH lower than 1.5 km a.g.l.) at Baltimore and New York, United States, for an 8 year period (2007–2014) was investigated using information from the Automated Surface Observing System (ASOS) observations and collocated U.S. Environmental Protection Agency (EPA) observations. The lifting condensation level (LCL) heights were calculated and compared with the CBH. The monthly average observations show that PM2.5 decreases from 2007 to 2014 while there is no significant trend found for CBH and LCL. The variability of the LCL height agrees well with CBH but LCL height is systematically lower than CBH (~180 m lower). There was a significant negative correlation found between CBH–LCL and PM2.5. All of the cloud cases were separated into polluted and clean conditions based on the distribution of PM2.5 values. The distributions of CBH–LCL in the two groups show more cloud cases with smaller CBH–LCL in polluted conditions than in clean conditions.

1. Introduction

The radiative forcing from aerosol–cloud interaction (RFACI) has been recognized as one of the greatest uncertainties in global climate models (GCMs) according to an IPCC report [1]. As aerosols can serve as cloud condensation nuclei (CCN), an increase in aerosol concentration was found to increase cloud droplet concentrations and decrease the size of cloud droplets with the same amount of liquid water content, increasing cloud optical depth (COD) [2]. The smaller cloud droplets suppress precipitation and enhance cloud lasting time and cover [3]. On the other hand, the absorbing aerosols may heat the air, reduce relative humidity, and increase evaporation. These cloud properties will influence the calculation of radiation balance and atmosphere heating rate, which play key roles in global climate models. Convincing evidence of RFACI has been shown in several previous studies through analysis of space- [4,5,6,7,8] and ground-based observations [4,5,6,7,8,9,10,11,12,13,14,15]. Most of them focused on the aerosols’ effects on cloud droplet number concentration, effective radius (RE), cloud optical depth (COD), and liquid water content (LWC).
Clouds cool the Earth by reflecting solar radiation and warm the Earth by absorbing thermal infrared radiation and reemitting it back to surface and space. Cloud fraction and height (base and top) influence the cloud radiative effect and are crucial for weather forecasting [16,17]. Moreover, cloud base height (CBH) is important for aviation control [18,19,20]. A cloud’s vertical structure is sensitive and intimately related to atmospheric thermodynamics and meteorological conditions, but several studies have found that aerosol loading can impact cloud top height (CTH) although the influences of aerosols on the cloud vertical structure are complex [21,22]. A positive relationship between CTH and aerosol optical depth (AOD) was found in several different regions by Koren et al. [23,24,25] using satellite-based observations. In the study by Li et al. [14], a strong aerosol invigoration effect on convection in summer was observed, leading to higher CTHs for mixed-phase clouds with low bases with higher concentration of condensation nuclei (CCN). That work was based on long-term observations at the U.S. Department of Energy’s Atmospheric Radiation Measurements (ARM) Southern Great Plains (SGP) site.
Compared with those on CTH, investigations of aerosol impact on cloud base height (CBH) are few. Passive satellite visible and thermal infrared sensors have the advantage of observing CTH over a large area but it is difficult for them to penetrate clouds to get CBH observations. Therefore, most observations of CBH use ground-based sensors or radiosonde [26,27,28,29,30,31]. In the study by Li et al. [14], there was no significant relationship between CBH and condensation nuclei concentration found based on the multiple years of observations at the ARM SGP site. On the other hand, Li [32] found that under polluted conditions, the cloud effective radius is smaller and the CBH tends to be lower and closer to the lifting condensation level (LCL); this finding was based on five summers of measurements of cloud properties and aerosol particulate matter with aerodynamic diameter ≤2.5 m (PM2.5) at the Howard University Beltsville Campus (HUBC) site. Both works used CBH observations from laser ceilometers. The ceilometer has been broadly used at National Oceanic and Atmospheric Administration (NOAA) National Weather Service (NWS) Automated Surface Observing System (ASOS) stations and become one of the most common sources of CBH in the United States.
In this study, the impacts of aerosol loading on CBH are investigated by using 8 years of observations of cloud properties and meteorological conditions from the NWS ASOS stations at Baltimore and New York, United States, and the collocated aerosol observations from the U.S. Environmental Protection Agency (EPA). The data are described in Section 2 and the results and discussions are presented in Section 3, followed by conclusions in Section 4.

2. Data

Integrated surface data provides a long-term record of hourly, subhourly, and synoptic weather observations from station networks over a large area [33]. These datasets resulted from full integration of numerous historical dataset sources and networks into one standard format which facilitates the processing of these data through one system that is network independent with standard quality assurance and quality control (QA/QC) [34]. It also helps move towards fully automated QA/QC processing for weather data and reduces processing times for final QC digital data and byproducts [34].
In this study, we investigate the aerosol impacts on CBH based on 8 years (from 2007 to 2014) of observations at two ASOS stations: one is at Baltimore–Washington International Airport, Baltimore, Unites States (BWI, 39.173° N and 76.684° W), and the other one is at LaGuardia International Airport, New York, United States (LGA, 40.779° N and 73.88° W). As a large surface observation network, the ASOS utilizes standard commercial laser ceilometers (CT12K or CL31; Vaisala Inc., Woburn, MA, USA) to observe the sky condition, such as whether the sky is clear or cloudy, and both cloud base height up to approximately 3600 m and cloud amount when the sky is cloudy. A laser ceilometer sends laser pulses vertically upward toward the sky and determines whether the return signals are from cloud bases based on the value of the return signals. Since the speed of light and the time elapsed for the signal from its launch to its return backscattered signal are known, cloud base height can be obtained from the ceilometer. Although the Vaisala ceilometers can provide CBH measurements from an altitude of 0 m [35], only cloud cases with CBH larger than 0.1 km are used in this study to avoid the possible overlap issue.
The LCL is formally defined as the height at which the relative humidity of an air parcel will reach 100% when it is cooled by dry adiabatic lifting and has long been used to estimate boundary layer cloud heights. The simultaneous observations of meteorological conditions such as surface temperature, pressure, and dew point temperature data are used to derive the LCL, which is typically calculated assuming a well-mixed boundary layer that has a dry adiabatic temperature profile and a moisture profile with a constant mixing ratio [36].
In this study, the observations of PM2.5 are used in place of aerosol loading below clouds; this is because the retrieval of AOD is not available from any passive sensor when clouds exist due to the stronger scattering of clouds on solar radiation. The collocated hourly PM2.5 data for the two ASOS stations (BWI, LGA) are the PM2.5 mass concentration measurements from EPA Federal Reference Method (FRM) or Federal Equivalent Method (FEM) instruments [37] at the nearest EPA sites (https://www.epa.gov/aqs) which are within 5 km and 2 km from BWI and LGA, respectively.
The cloud cases used in this study passed a rigorous threshold to ensure interaction between clouds and aerosols near the surface. CBH indicates the likelihood of interaction between clouds and aerosols near the surface. Li et al. [14] showed that the response of the cloud vertical structure to the aerosols measured near the ground was the most significant for low-base clouds (cloud base height <1 km) and disappeared entirely for cloud base height greater than 2 km based on the aerosol and cloud measurements at the Atmospheric Radiation Measurement (ARM) Southern Great Plains (SGP) site. That is because low-base clouds have a higher likelihood of interaction with surface aerosols. Given the stable atmosphere and lower boundary layer heights, the well-mixed aerosol layer is usually shallower at nighttime. Therefore, in this study, only daytime (from 7 a.m. to 7 p.m. local time) clouds with CBH lower than 1.5 km and with difference between CBH and LCL within 0.5 km were investigated. The constraint of the difference between CBH and LCL was used to further increase the likelihood of boundary layer clouds which interact with low-level aerosols. Precipitation and fog may attenuate the ceilometer signals [35] and clean surface aerosols. The cloud cases with precipitation, fog, CBH lower than 0.1 km, and surface relative humidity larger than 95% are excluded by considering the possible ceilometer signal uncertainties close to the ceilometer transmitter. The monthly average and anomalies of the measurements are calculated from the hourly average measurements. The monthly anomalies are calculated by subtracting the mean value of the monthly average for each month (also called “monthly climatology”) from the monthly average. To find the long-term trend, monthly anomalies are used in the time series analysis below.

3. Results and Discussion

A continuous decrease of PM2.5 from 2007 to 2014 at Baltimore, United States was found based on the monthly anomalies of PM2.5 observations calculated from the EPA hourly average PM2.5 (Figure 1). A long-term decrease of aerosol loading in the recent decade was also found at other places in the United States in previous studies using different aerosol observations—AOD, PM10, or PM2.5 [15,32,38]. Different from aerosols, there is no trend found for the CBH and LCL monthly anomalies from 2007 to 2014 (Figure 2a,b). Although LCL is thought to be a good approximation of CBH, the heights of LCLs calculated by using surface-based parcels are systematically lower than CBHs measured by ceilometer (Figure 2c). One of the explanations for this is that the mean layer parcel is likely more representative of the actual parcel associated with cloud development than the surface parcel [39]. Another possible explanation is that clouds typically do not form until the relative humidity is somewhat above 100% since the actual condensation level depends on the availability of condensation nuclei.
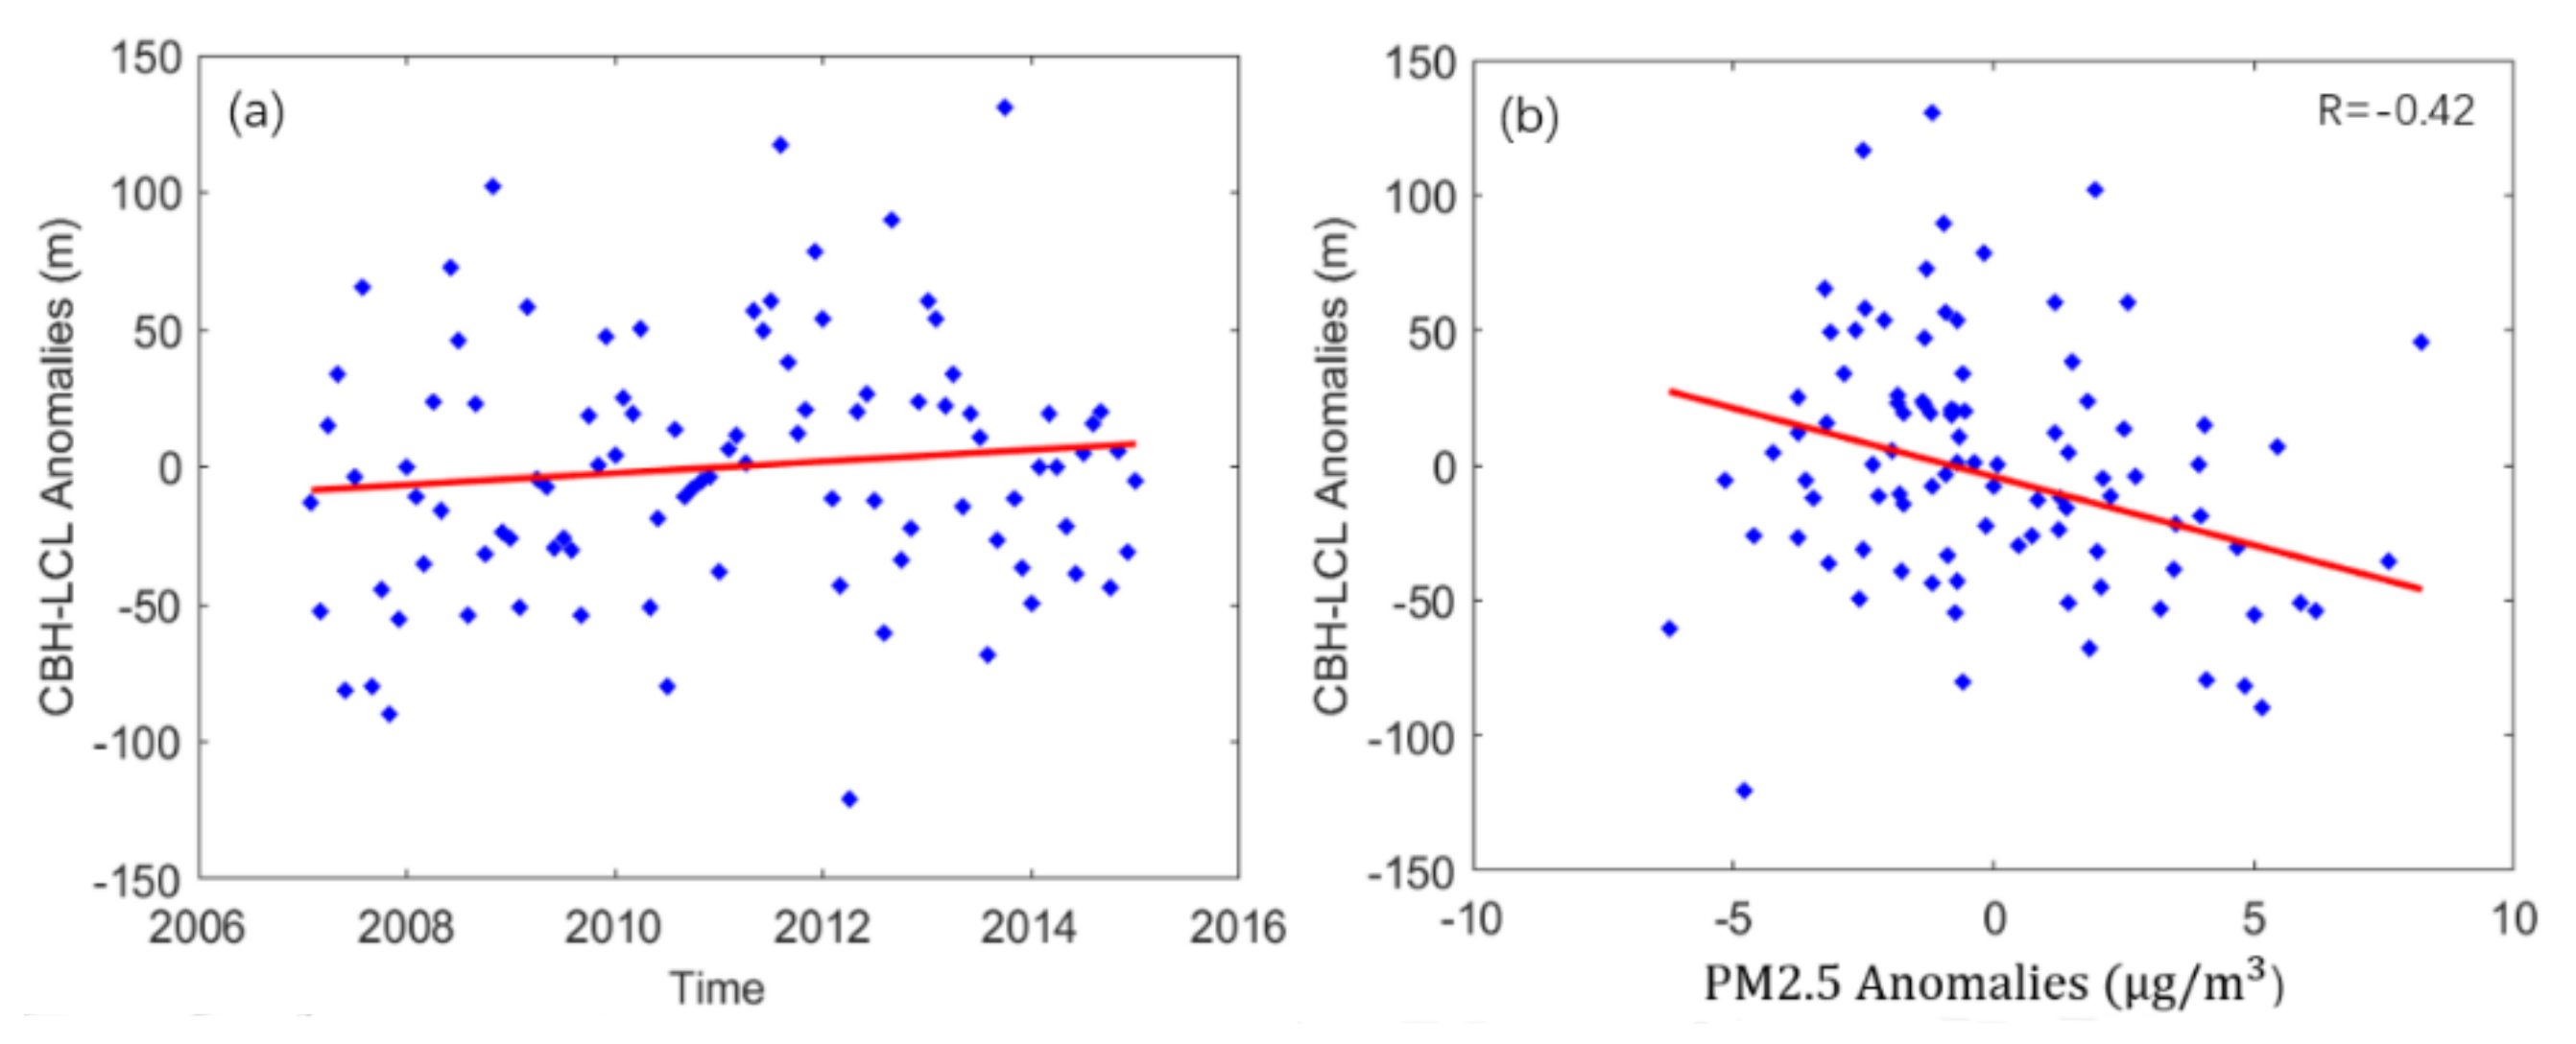
With the dry, adiabatically rising assumption, the temperature, pressure, and moisture content of the air parcel determine the LCL and the CBH. To investigate the potential effects of aerosols in addition to temperature, pressure, and moisture content on CBHs, the difference between CBH and LCL (CBH–LCL) was analyzed. The monthly anomalies of CBH–LCL illustrate a slight increasing trend of CBH–LCL from 2007 to 2014 by inspection (Figure 3a), but this trend does not pass the F-test at 95% level while the PM2.5 trend is significant (Figure 1). To distinguish the relationship between PM2.5 and CBH–LCL, the relationship of monthly anomalies of PM2.5 and CBH–LCL is illustrated in Figure 3b. The significant negative relationship between monthly PM2.5 and CBH–LCL (R = −0.42, passes the F-test at 95% level) implies that an increase in aerosols may decrease the actual CBH while the LCL is fixed.
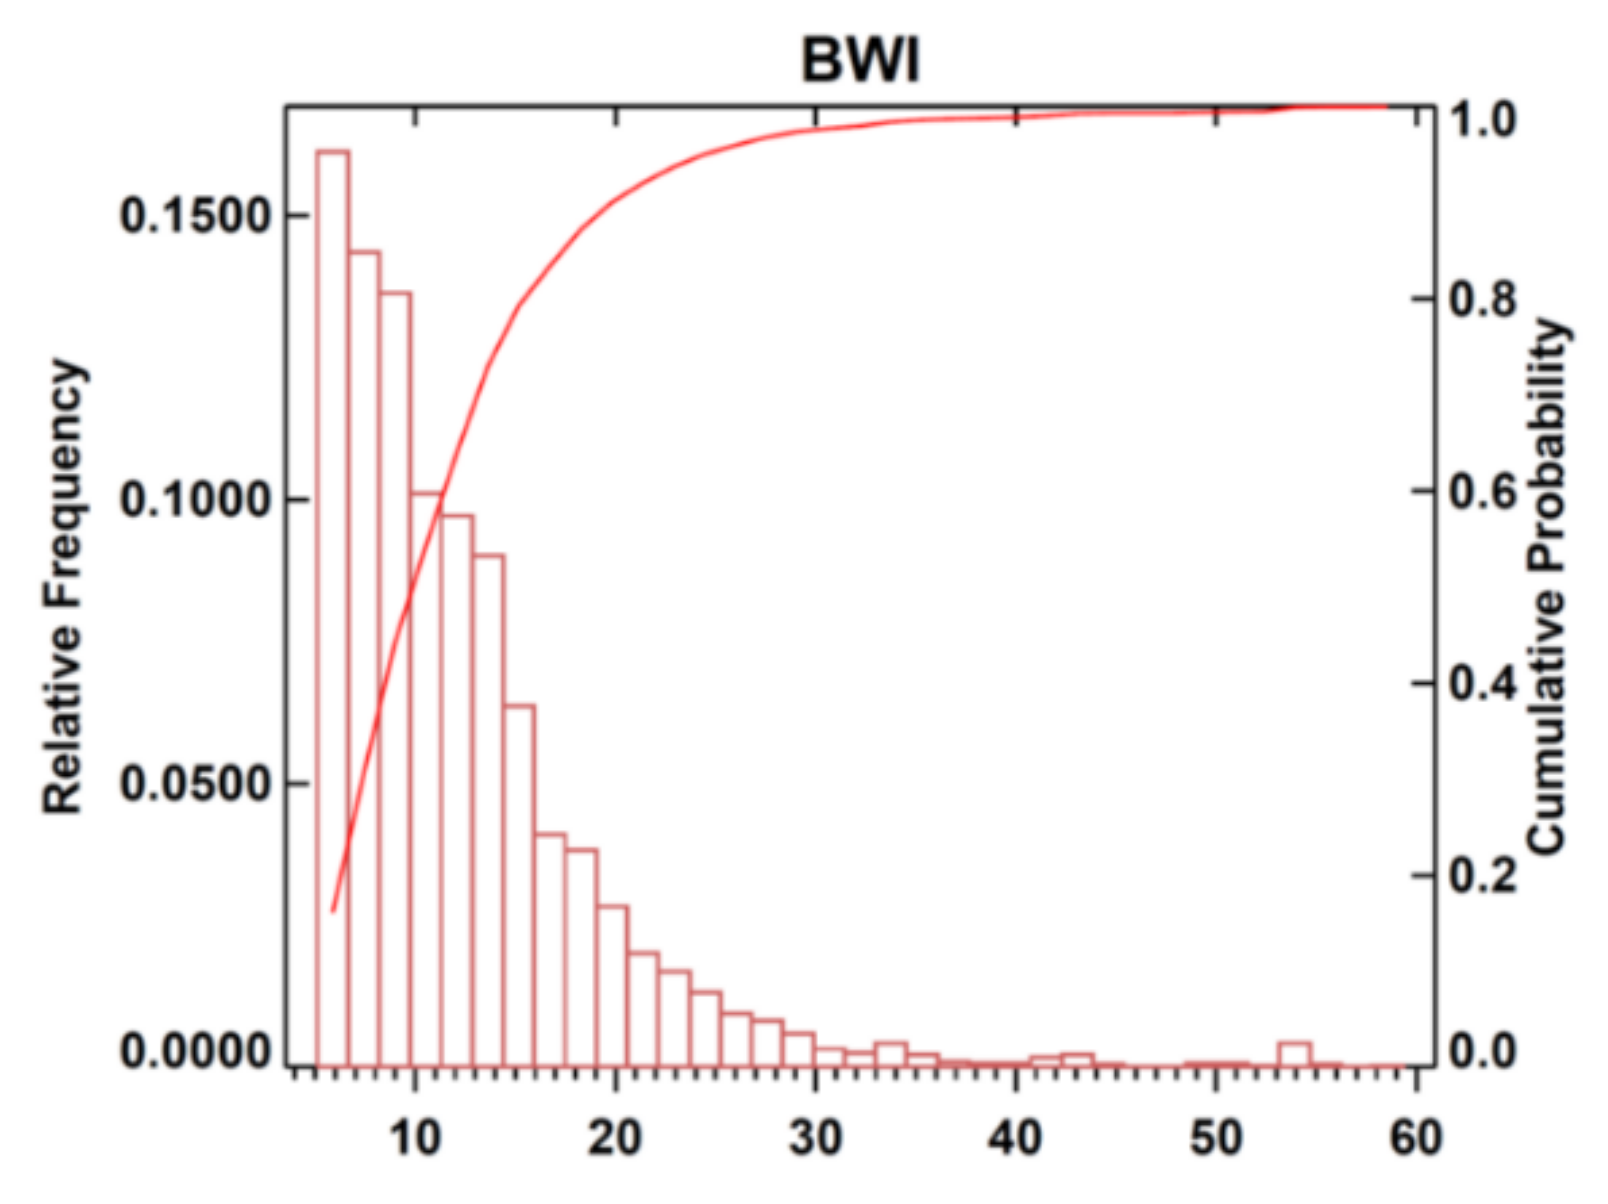
To further investigate the impacts of aerosols on CBH, all the cloud cases were segregated into two groups based on the National Ambient Air Quality Standards [40] and the observed PM2.5 concentrations under clouds for all available cloud cases (Figure 4).
The first group is defined for cloudy cases in clean aerosol conditions, for which the PM2.5 value is smaller than 10 μ g / m 3 and larger than 5 μ g / m 3 . The second group is defined for cloud cases in polluted conditions, for which the PM2.5 value is larger than 20 μ g / m 3 . The distributions of CBH and LCL under polluted and clean conditions are illustrated in Figure 5. It is shown that there are more cloud cases with lower CBH and LCL in polluted conditions than there are in clean conditions. The similarity of the distributions of CBH and LCL agrees with the cloud formation theory: cloud condensation determines the CBH and the height of LCL is related to atmospheric thermodynamic conditions, e.g., temperature and humidity profiles. The lower CBH and LCL under polluted conditions implies that clouds are less able to form with low surface relative humidity in polluted conditions than in clean conditions. The increased nuclei will increase the competition for liquid water, so large liquid droplets will be less able to form under limited water conditions (15). In other words, the formation of cloud under polluted conditions requires higher moisture content below, which is accompanied by lower LCL and CBH. Moreover, the distribution of the CBH–LCL shows that there are more cloud cases with smaller CBH–LCL value (−0.1 km to 0.1 km) but less cloud cases with larger CBH–LCL value (larger than 0.1 km) in polluted conditions compared with in clean conditions (Figure 5c). Given that the height of LCL can be considered as CBH based on atmospheric thermodynamics for boundary layer clouds, the relationship between PM2.5 and CBH–LCL implies that the actual CBH could be impacted by aerosol loading.
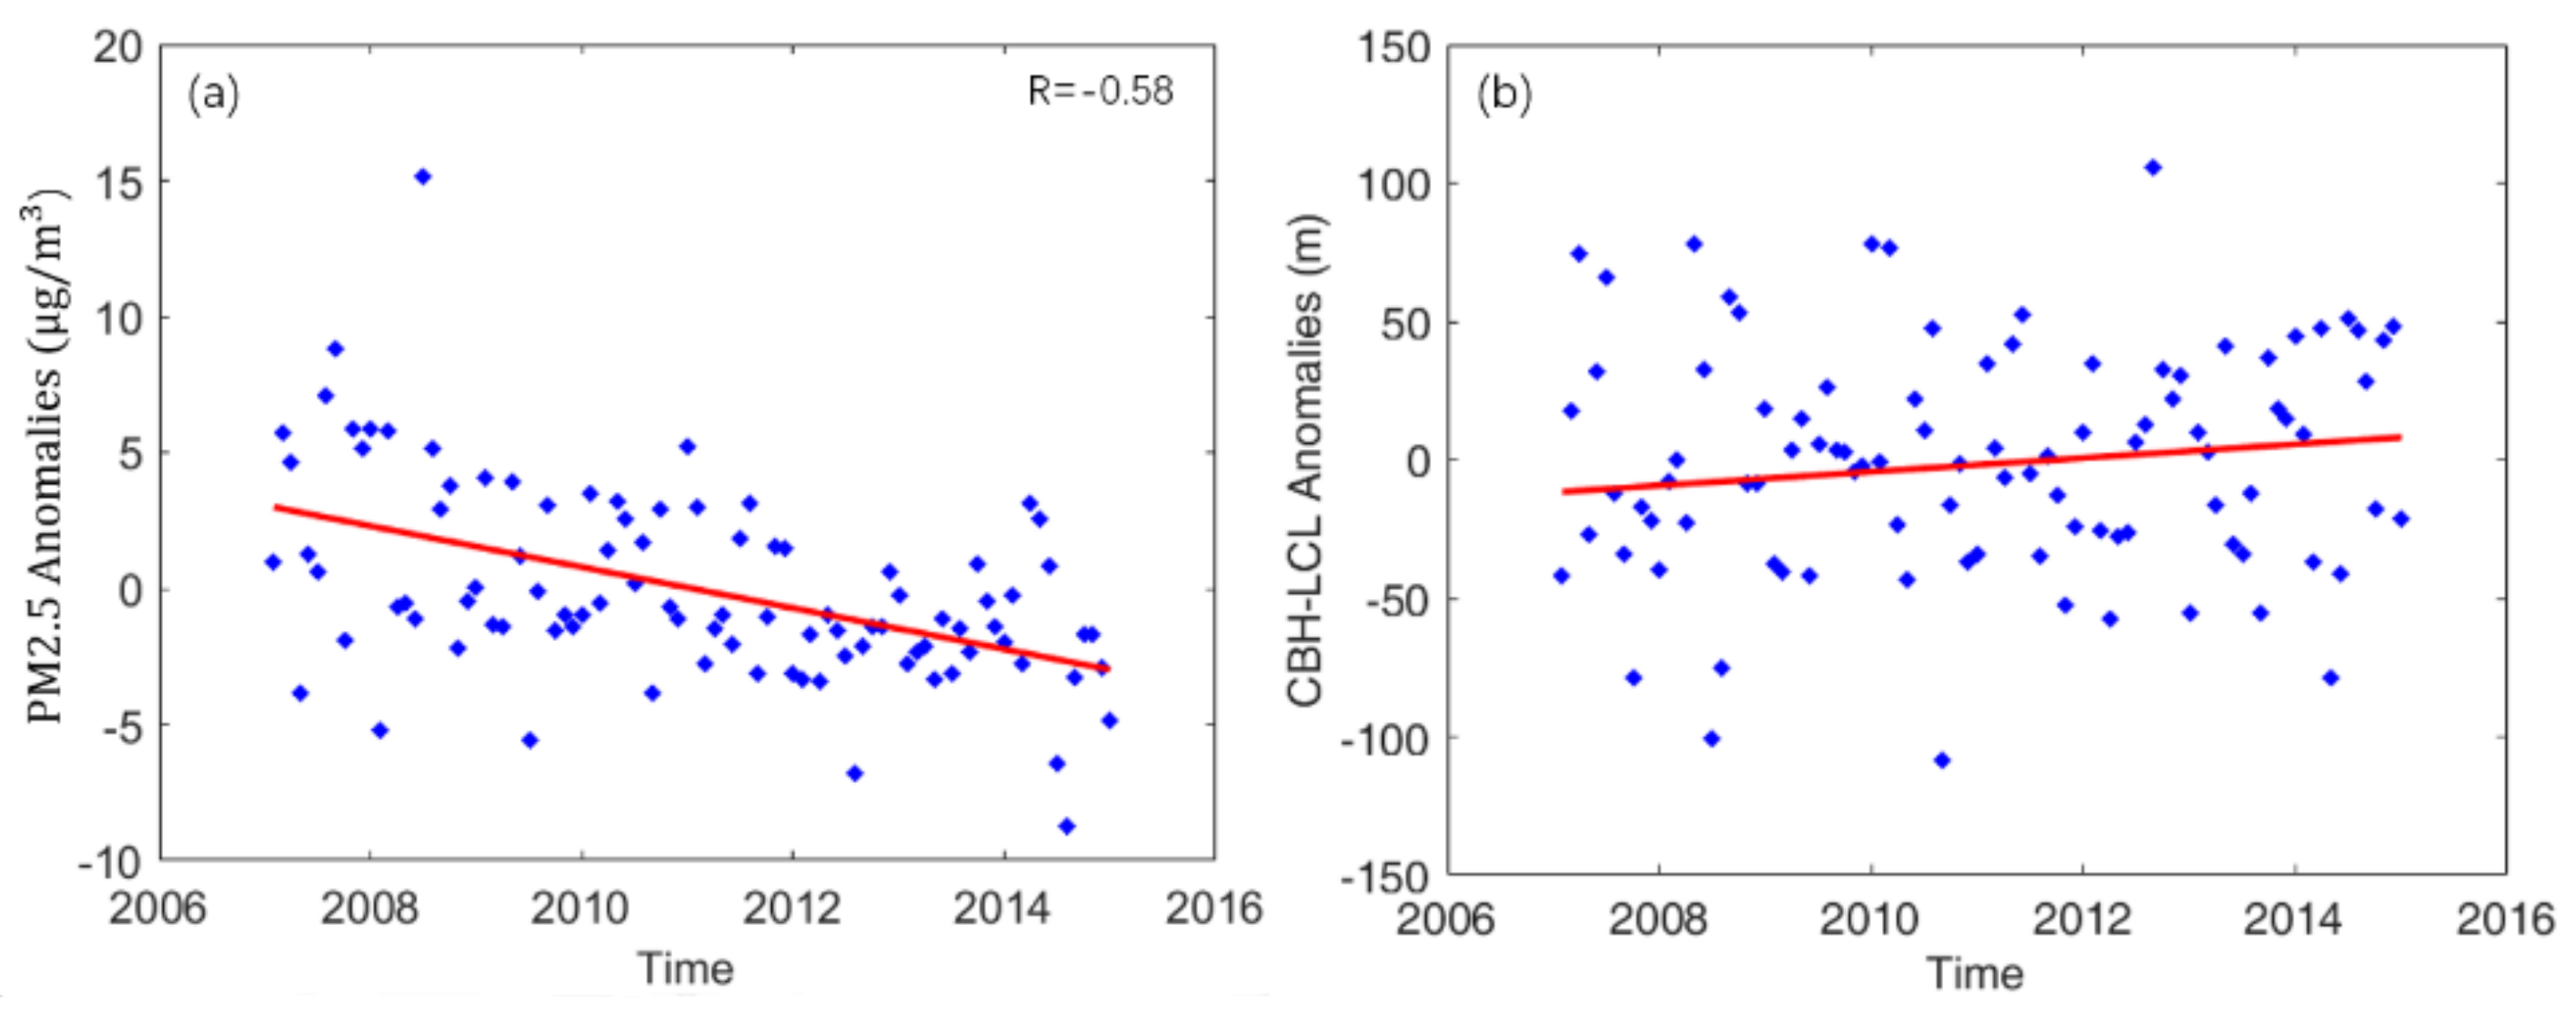
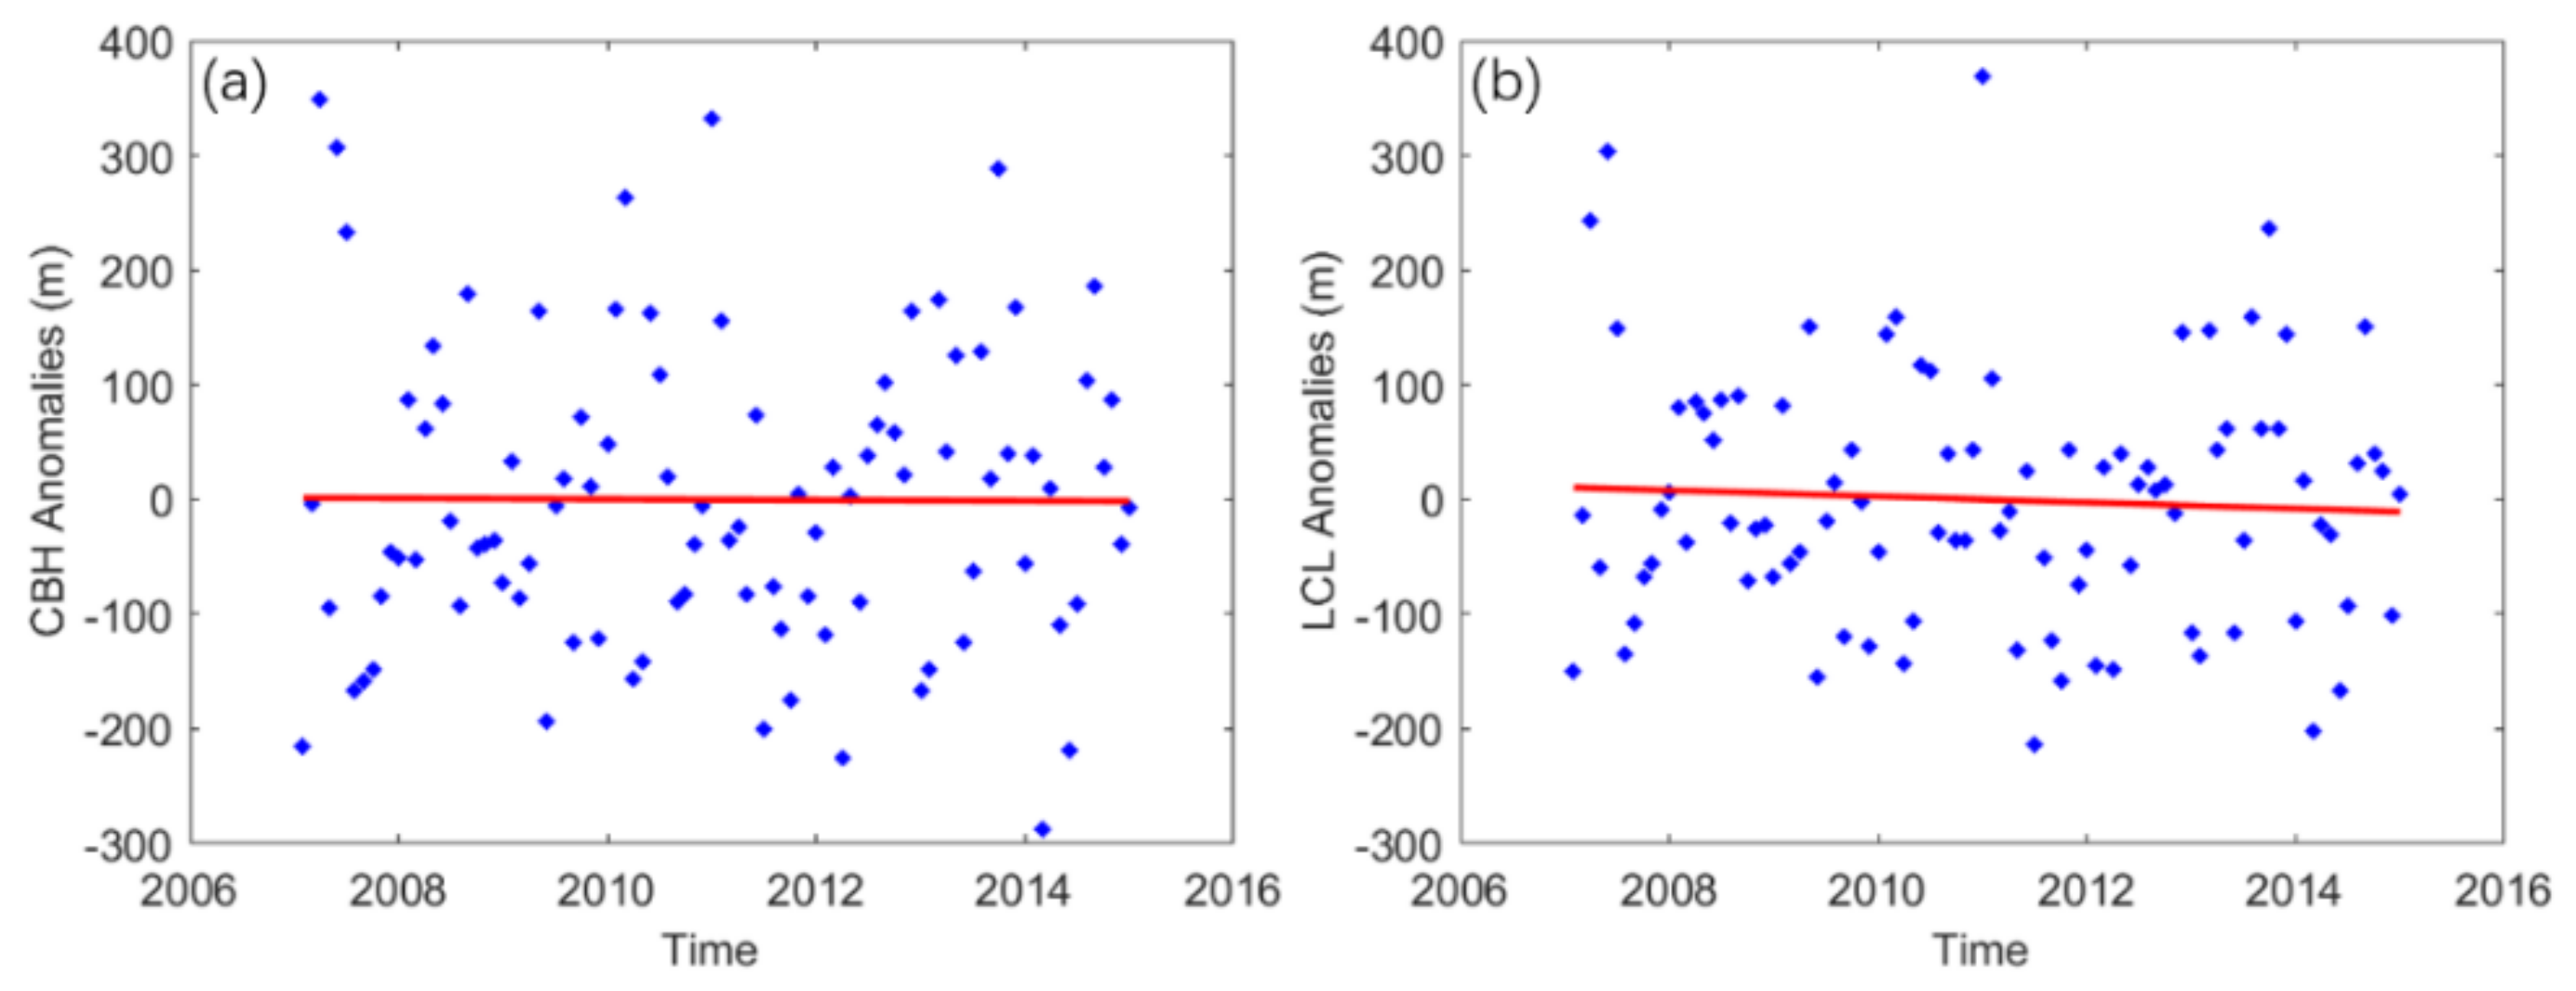
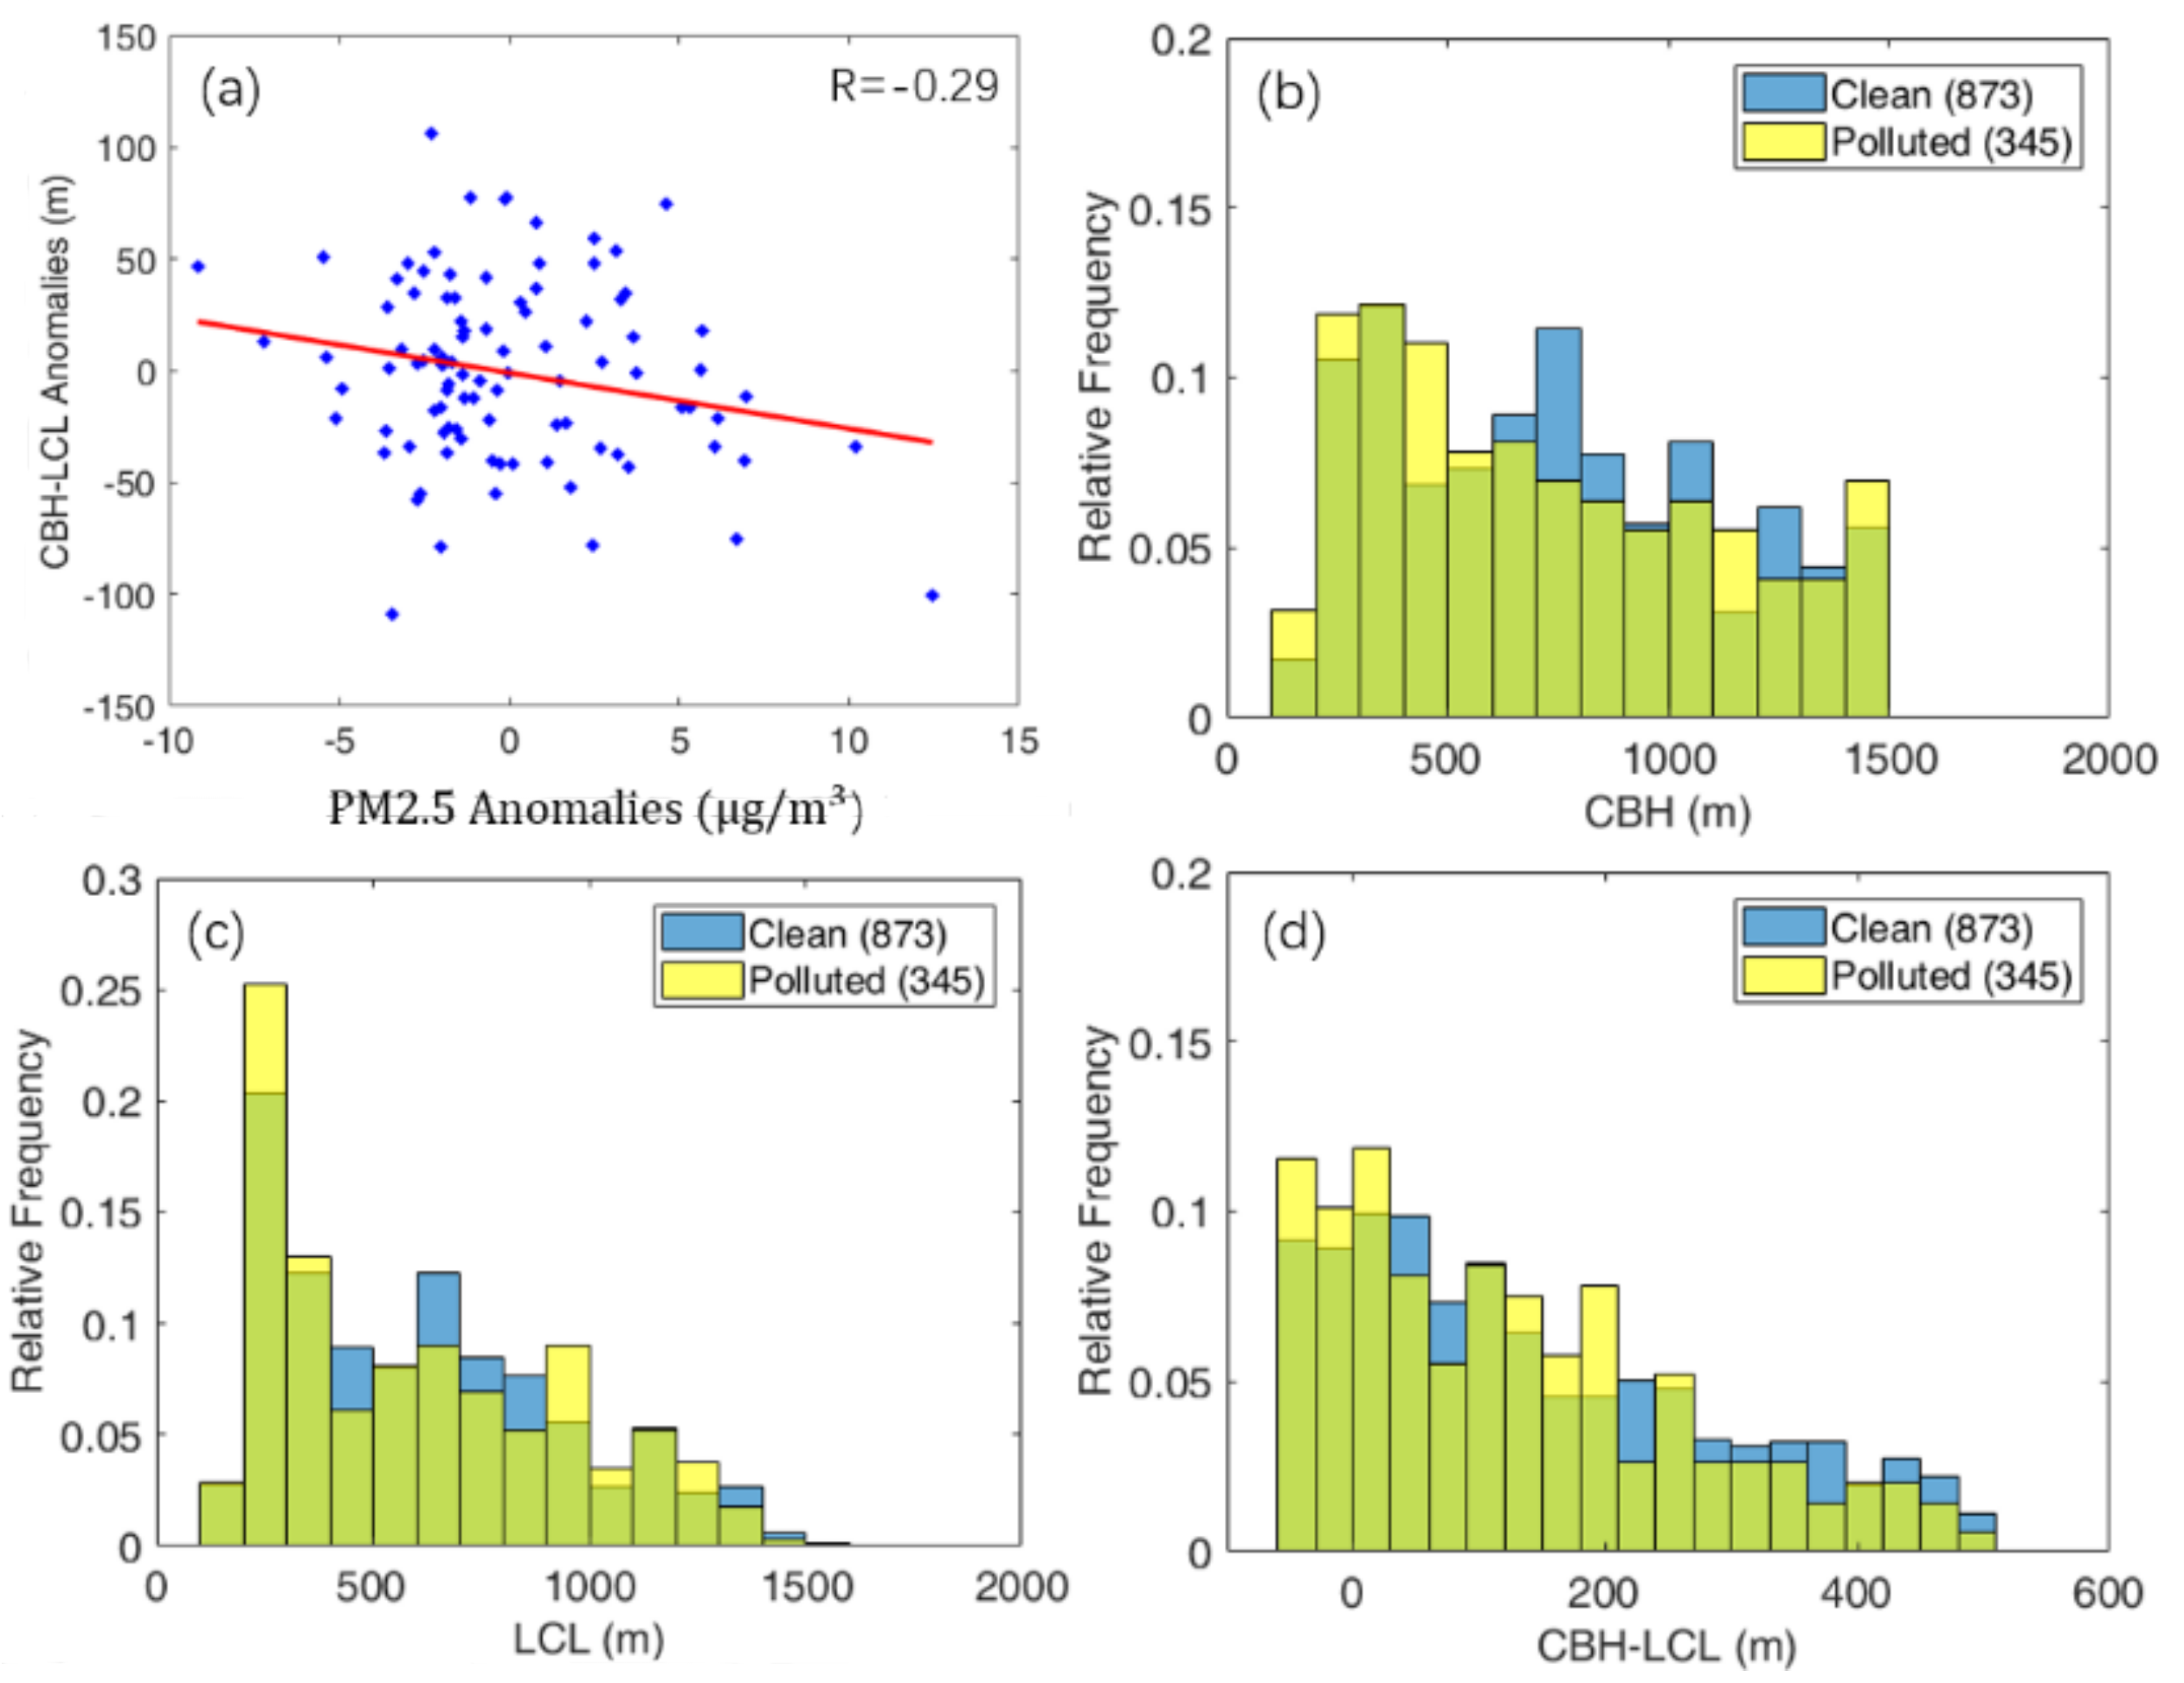
The results shown above are based on 8 years of hourly measurements at the ASOS BWI station with collocated PM2.5 measurements from EPA. They agree with results from the studies by Li et al. [15,32] which were based on 5 years (from 2006 to 2010) of summer measurements at the Howard University Beltsville Campus (HUBC) site. The HUBC site is located at a rural–suburban transition region between Washington, DC and Baltimore, MD urban centers and is around 30 m away from the ASOS BWI station. To investigate whether this phenomenon only occurs at this specific region, the analysis was also conducted on 8 years (from 2007 to 2014) of observations from the ASOS LGA station located in New York, United States, around 300 miles to the northeast of the ASOS BWI station. As a big city, New York is impacted more by anthropogenic activities, which makes it suitable for an investigation of aerosol impact on CBH. The monthly anomalies of PM2.5 also show a significant decreasing trend from year 2007 to 2014 (Figure 6a) while the monthly anomalies of CBH–LCL show a slightly increasing trend (Figure 6b). Similar to the results found at the BWI station, there is no trend found for CBH and LCL during the years studied (Figure 7), but the relationship between monthly anomalies of PM2.5 and CBH–LCL shows a significant negative relationship with R = −0.29 (Figure 8a). Moreover, the distributions of CBH, LCL, and CBH–LCL illustrate that all the CBH, LCL, and (CBH–LCL) values tend to be smaller under polluted conditions compared with under clean conditions (Figure 8b–d). The statistical study at the ASOS LGA station further supports our hypothesis that increasing aerosol loading may decrease the CBH.
From a different angle, this study investigates the potential impact of aerosols on CBH based on long-term observation of CBH, surface meteorological conditions, and aerosol loading at two different regions.

4. Conclusions

This study statistically analyzed the relationship between aerosol loading and CBH based on 8 years of observations of CBH, aerosols, and surface meteorological conditions at ASOS BWI station and LGA station. A significant decrease of PM2.5 from 2007 to 2014 was found at both stations, while neither an increasing nor decreasing trend was found for CBH or LCL. The variation in monthly average LCL is highly consistent with the variation in monthly average CBH. That can be explained by cloud formation theory, in which cloud condensation determines the CBH. Meanwhile, CBH was found to be systematically higher than LCL. Since the actual condensation level depends on the availability of condensation nuclei, clouds typically do not form until the relative humidity is somewhat above 100%, which determines LCL. To investigate aerosol impact on the actual CBH with the same LCL, the relationship between the monthly anomalies of PM2.5 and CBH–LCL was analyzed. A significant negative relationship was found between PM2.5 and CBH–LCL. In addition, when cloud cases are separated into two groups—polluted and clean aerosol conditions—based on the total of 8 years of hourly averaged PM2.5 concentrations, more cloud cases were found with smaller CBH–LCL under polluted conditions than under clean conditions. That indicates that under the same atmospheric thermodynamic conditions, CBH tends to be lower under polluted conditions than under clean conditions. This phenomenon was found at both the ASOS BWI station and the LGA station.
In conclusion, this study shows the possible impacts of aerosols on CBH. An increase in aerosols may decrease the CBH under the same atmospheric thermodynamic conditions. Abundant cloud nuclei with sufficient water supplies could facilitate the formation of clouds at lower altitudes.

Acknowledgments

This work was supported by the National Oceanic and Atmospheric Administration, Educational Partnership Program, US Department of Commerce, under agreement no. NA11SEC4810003, and supported by the National Aeronautics and Space Administration grant nos. NNX08BA42A and NNX10AQ11A.

Author Contributions

Siwei Li conceived and designed the study; Sium Gebremariam performed data analysis; Mengsteab Weldegaber contributed on cloud physics discussion and model simulations; Siwei Li and Sium Gebremariam wrote the paper.

Conflicts of Interest

The authors declare no conflict of interest.

References

  1. Intergovernmental Panel on Climate Change (IPCC). Climate Change 2013: The Physical Science Basis. Contribution of Working Group I to the Fifth Assessment Report of the Intergovernmental Panel on Climate Change; Stocker, T.F., Qin, D., Plattner, G.-K., Tignor, M., Allen, S.K., Boschung, J., Nauels, A., Xia, Y., Bex, V., Midgley, P.M., Eds.; Cambridge University Press: Cambridge, UK, 2013. [Google Scholar] [CrossRef]
  2. Twomey, S. Pollution and the planetary albedo. Atmos. Environ. 1974, 8, 1251–1256. [Google Scholar] [CrossRef]
  3. Albrecht, B.A. Aerosol, cloud microphysics, and fractional cloudiness. Science 1989, 245, 1227–1230. [Google Scholar] [CrossRef] [PubMed]
  4. Han, Q.; Rossow, W.B.; Chou, J.; Welch, R.M. Global variation of cloud effective droplet concentration of low-level clouds. Geophys. Res. Lett. 1998, 25, 1419–1422. [Google Scholar] [CrossRef]
  5. Wang, T.; Wang, H.J.; Otterå, O.H.; Gao, Y.Q.; Suo, L.L.; Furevik, T.; Yu, L. Anthropogenic agent implicated as a prime driver of shift in precipitation in eastern China in the late 1970s. Atmos. Chem. Phys. 2013, 13, 12433–12450. [Google Scholar] [CrossRef]
  6. Pan, Z.; Gong, W.; Mao, F.; Li, J.; Wang, W.; Li, C.; Min, Q. Macrophysical and optical properties of clouds over East Asia measured by CALIPSO. J. Geophys. Res. Atmos. 2015, 120. [Google Scholar] [CrossRef]
  7. Pan, Z.; Mao, F.; Gong, W.; Wang, W.; Yang, J. Observation of clouds macrophysical characteristics in China by CALIPSO. J. Appl. Remote Sens. 2016, 10. [Google Scholar] [CrossRef]
  8. Rosenfeld, D.; Sherwood, S.; Wood, R.; Donner, L. Climate effects of aerosol-cloud interactions. Science 2014, 343, 379–380. [Google Scholar] [CrossRef] [PubMed]
  9. Feingold, G.; Eberhard, W.; Veron, D.; Previdi, M. First measurements of the Twomey indirect effect using ground-based remote sensors. Geophys. Res. Lett. 2003, 30, 1287. [Google Scholar] [CrossRef]
  10. Huang, J.-P.; Wang, T.; Wang, W.; Li, Z.; Yan, H. Climate effects of dust aerosols over East Asian arid and semiarid regions. J. Geophys. Res. Atmos. 2014, 119, 11398–11416. [Google Scholar] [CrossRef]
  11. Kim, B.G.; Schwartz, S.E.; Miller, M.A.; Min, Q. Effective radius of cloud droplets by ground-based remote sensing: Relationship to aerosol. J. Geophys. Res. 2003, 108, 4740. [Google Scholar] [CrossRef]
  12. Kim, B.G.; Miller, M.A.; Schwartz, S.E.; Liu, Y.; Min, Q. The role of adiabaticity in the aerosol first indirect effect. J. Geophys. Res. 2008, 113, D05210. [Google Scholar] [CrossRef]
  13. Kim, Y.; Kim, B.; Miller, M.; Min, Q.; Song, C. Enhanced aerosol-cloud relationships in more stable and adiabatic clouds. Asia-Pac. J. Atmos. Sci. 2012, 48, 283–293. [Google Scholar] [CrossRef]
  14. Li, Z.; Niu, F.; Fan, J.; Liu, Y.; Rosenfeld, D.; Ding, Y. Long-term impacts of aerosols on the vertical development of clouds and precipitation. Nat. Geosci. 2010, 4, 888–894. [Google Scholar] [CrossRef]
  15. Li, S.; Joseph, E.; Min, Q.; Yin, B. Multi-year ground-based observations of aerosol-cloud interactions in the Mid-Atlantic of the United States. J. Quant. Spectrosc. Radiat. Transf. 2017, 188, 192–199. [Google Scholar] [CrossRef]
  16. Pan, Z.; Mao, F.; Gong, W.; Min, Q.; Wang, W. The Warming of Tibetan Plateau Enhanced by 3D Variation of Low-level Clouds during Daytime. Remote Sens. Environ. 2017, 198, 363–368. [Google Scholar] [CrossRef]
  17. Mao, F.; Min, Q.; Liu, G.; Feng, S.; Jin, S.; Hu, J.; Gong, W.; Li, C. Assimilating moderate resolution imaging spectroradiometer radiance with the weather research and forecasting data assimilation system. J. Appl. Remote Sens. 2017, 11. [Google Scholar] [CrossRef]
  18. Ellrod, G.P.; Gultepe, I. Inferring low cloud base heights at night for aviation using satellite infrared and surface temperature data. Pure Appl. Geophys. 2007, 164, 1193–1205. [Google Scholar] [CrossRef]
  19. Mittermaier, M. A critical assessment of surface cloud observations and their use for verifying cloud forecasts. Q. J. R. Meteorol. Soc. 2012, 138, 1794–1807. [Google Scholar] [CrossRef]
  20. Vislocky, R.L.; Fritsch, J.M. An automated, observations-based system for short-term prediction of ceiling and visibility. Weather Forecast. 1997, 12, 31–43. [Google Scholar] [CrossRef]
  21. Gryspeerdt, E.; Stier, P.; Grandey, B.S. Cloud fraction mediates the aerosol optical depth-cloud top height relationship. Geophys. Res. Lett. 2014, 44, 3622–3627. [Google Scholar] [CrossRef]
  22. Stevens, B.; Feingold, G. Untangling aerosol effects on clouds and precipitation in a buffered system. Nature 2009, 461, 607–613. [Google Scholar] [CrossRef] [PubMed]
  23. Koren, I.; Kaufman, Y.J.; Rosenfeld, D.; Remer, L.A.; Rudich, Y. Aerosol invigoration and restructuring of Atlantic convective clouds. Geophys. Res. Lett. 2005, 32, 10–1029. [Google Scholar] [CrossRef]
  24. Koren, I.; Remer, L.A.; Altaratz, O.; Martins, J.V. Aerosol-induced changes of convective cloud anvils produce strong climate warming. Atmos. Chem. Phys. 2010, 10, 5001–5010. [Google Scholar] [CrossRef]
  25. Kourtidis, K.; Stathopoulos, S.; Georgoulias, A.K.; Alexandri, G.; Rapsomanikis, S. A study of the impact of synoptic weather conditions and water vapor on aerosol–cloud relationships over major urban clusters of China. Atmos. Chem. Phys. 2015, 15, 10955–10964. [Google Scholar] [CrossRef]
  26. An, N.; Wang, K.C.; Zhou, C.L.; Pinker, R.T. Observed variability of cloud frequency and cloud-base height within 3600 m above the surface over the contiguous United States. J. Clim. 2017, 30, 3725–3742. [Google Scholar] [CrossRef]
  27. Costa-Surós, M.; Calbó, J.; González, J.; Long, C.N. Comparing the cloud vertical structure derived from several methods based on radiosonde profiles and ground-based remote sensing measurements. Atmos. Meas. Tech. 2014, 7, 2757–2773. [Google Scholar] [CrossRef] [Green Version]
  28. Chernykh, I.V.; Alduchov, O.A.; Eskridge, R.E. Trends in low and high cloud boundaries and errors in height determination of cloud boundaries. Bull. Am. Meteorol. Soc. 2001, 82, 1941–1947. [Google Scholar] [CrossRef]
  29. Minnis, P.; Yi, Y.; Huang, J.; Ayers, K. Relationships between radiosonde and RUC-2 meteorological conditions and cloud occurrence determined from ARM data. J. Geophys. Res. 2005, 110, D23204. [Google Scholar] [CrossRef]
  30. Wang, J.; Rossow, W.B. Determination of cloud vertical structure from upper-air observations. J. Appl. Meteorol. 1995, 34, 2243–2258. [Google Scholar] [CrossRef]
  31. Zhang, J.; Chen, H.; Bian, J.; Xuan, Y.; Duan, Y.; Cribb, M. Development of cloud detection methods using CFH, GTS1, and RS80 radiosondes. Adv. Atmos. Sci. 2012, 29, 236–248. [Google Scholar] [CrossRef]
  32. Li, S. Aerosol indirect effect and cloud-based height observations in the North East of the United States. Int. J. Earth Environ. Sci. 2017, 2, 128. [Google Scholar] [CrossRef]
  33. Smith, A.; Lott, N.; Vose, R. The Integrated Surface Database: Recent Developments and Partnerships. Bull. Am. Meteorol. Soc. 2011, 92, 704–708. [Google Scholar] [CrossRef]
  34. Del Greco, S.A.; Lott, J.N.; Ray, R.; Dellinger, D.; Smith, F.; Jones, P. Surface data processing and integration at NOAA’s National Climatic Data Center. In Proceedings of the 23rd Conference on Interactive Information Processing Systems for Meteorology, Oceanography, and Hydrology (IIPS), San Antonio, TX, USA, 14–18 January 2007; American Meteorological Society: Boston, MA, USA, 2007; p. 116367. [Google Scholar]
  35. Vaisala. Technical Manual: Laser Ceilometer CT12K; Vaisala Report; Vaisala: Vantaa, Finland, 1989; p. 304. [Google Scholar]
  36. Office of the Federal Coordinator for Meteorology (OFCM). Surface Weather Observations and Reports; Federal Meteorological Handbook, No. 1; OFCM: Silver Spring, MD, USA, 1982; p. 82.
  37. Noble, C.A.; Vanderpool, R.W.; Peters, T.M.; McElroy, F.F.; Gemmill, D.B.; Wiener, R.W. Federal reference and equivalent methods for measuring fine particulate matter. Aerosol. Sci. Technol. 2001, 34, 457–464. [Google Scholar] [CrossRef]
  38. Cusworth, D.H.; Mickley, L.J.; Leibensperger, E.M.; Iacono, M.J. Aerosol trends as a potential driver of regional climate in the central United States: Evidence from observations. Atmos. Chem. Phys. 2017, 17, 13559–13572. [Google Scholar] [CrossRef]
  39. Craven, J.P.; Jewell, R.E.; Brooks, H.E. Comparison between observed convective cloud-base heights and lifting condensation level for two different lifted parcels. Weather Forecast. 2002, 17, 885–890. [Google Scholar] [CrossRef]
  40. United States Environmental Protection Agency. EPA: Lists of Potential Control Measures for PM2.5 and Precursors; Draft Version1.0; U.S. Environmental Protection Agency, Office of Air Quality Planning and Standards, Office of Transportation and Air Quality, Office of Atmospheric Programs, and Office of Policy Analysis and Review: Washington, DC, USA, 2007.
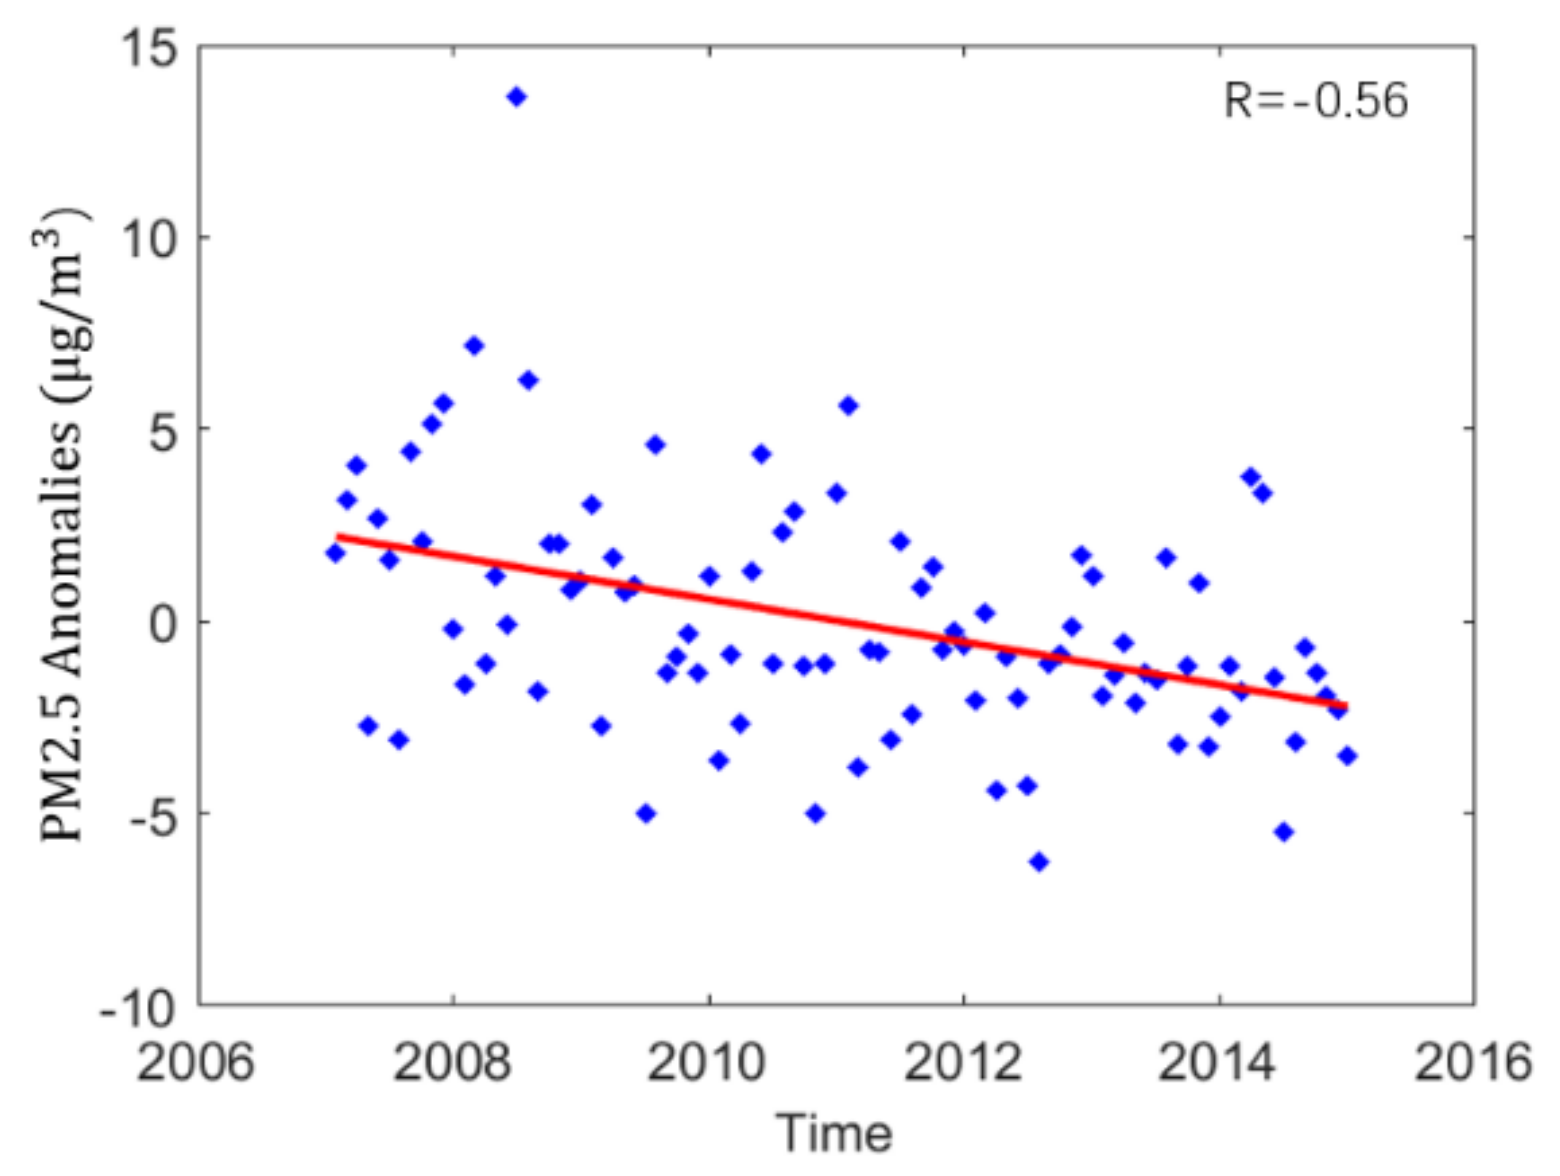
Figure 1. Eight years of monthly anomalies in aerosol particulate matter with aerodynamic diameter ≤2.5 μ m (PM2.5) at Baltimore–Washington International Airport (BWI) station. The red line shows the linear regression.
Atmosphere 09 00143 g001
Figure 2. Monthly anomalies of (a) cloud base height (CBH); (b) lifting condensation level (LCL); and (c) monthly average cloud base height and lifting condensation level at BWI station.
Atmosphere 09 00143 g002
Figure 3. (a) Monthly CBH–LCL anomalies and (b) the relationship between CBH–LCL and PM2.5 at BWI station.
Atmosphere 09 00143 g003
Figure 4. Distribution of hourly average PM2.5 below clouds at BWI station.
Atmosphere 09 00143 g004
Figure 5. Distributions of (a) cloud base height; (b) lifting condensation level; and (c) the difference between cloud base height and lifting condensation level CBH–LCL at BWI station under clean and polluted aerosol conditions. The number in the parentheses is the number of cloud cases. The light-green color shows overlap in the relative frequencies of the two conditions.
Atmosphere 09 00143 g005
Figure 6. Monthly anomalies of (a) PM2.5 and (b) CBH–LCL at LaGuardia International Airport (LGA) station.
Atmosphere 09 00143 g006
Figure 7. Monthly anomalies of (a) cloud base height and (b) lifting condensation level at LGA station.
Atmosphere 09 00143 g007
Figure 8. (a) The relationship between CBL–LCL and PM2.5; (b) distribution of cloud base height; (c) distribution of lifting condensation level; and (d) distribution of CBH–LCL. The number in the parentheses in (bd) is the number of cloud cases. The light-green color shows overlap in the relative frequencies for the clean and polluted aerosol conditions.
Atmosphere 09 00143 g008