Article

Remarkable Impacts of Indian Ocean Sea Surface Temperature on Interdecadal Variability of Summer Rainfall in Southwestern China

1
Chinese Academy of Meteorological Sciences, Beijing 100081, China
2
University of Chinese Academy of Sciences, Beijing 100049, China
3
Laboratory for Climate Studies & CMA-NJU Joint Laboratory for Climate Prediction Studies, National Climate Center, CMA, Beijing 100081, China
4
Department of Atmospheric Science, School of Environmental Studies, China University of Geoscience, Wuhan 430074, China
*
Author to whom correspondence should be addressed.
Atmosphere 2018, 9(3), 103; https://doi.org/10.3390/atmos9030103
Submission received: 2 February 2018 / Revised: 4 March 2018 / Accepted: 5 March 2018 / Published: 13 March 2018
(This article belongs to the Section Meteorology)

Abstract

:
During the boreal summer from June to August, rainfall in Southwestern China shows substantial interdecadal variabilities on timescales longer than 10 years. Based on observational analyses and numerical modeling, we investigated the characteristics of interdecadal Southwestern China summer rainfall (SWCSR) and its dynamic drivers. We find that the SWCSR is markedly impacted by the interdecadal Indian Ocean basin mode (ID-IOBM) of the sea surface temperature (SST), which may induce anomalous inter-hemispheric vertical circulation. During the cold phase of the ID-IOBM, an enhanced lower-level divergence and upper-level convergence exist over the tropical Indian Ocean. The simultaneous lower-level outflow anomalies further converge over the Indo-China peninsula, resulting in an anomalous ascending motion and a lower-level cyclone that contribute to strengthening the eastward moisture transport from the Bay of Bengal to Southwestern China. The joint effects of the anomalous ascending motion and the above-normal moisture transport play a key role in increasing the SWCSR. In summers during the warm phase of the ID-IOBM, the situation is approximately the same, but with opposite polarity. After the beginning of the 1970s, the impacts of interdecadal Indian Ocean dipole (ID-IOD) on SWCSR is strengthening. The anomalous vertical circulation associated with the positive (negative) phase of ID-IOD is in favor of decreased (increased) rainfall in SWC. However, the impacts of ID-IOD on SWCSR is relatively weak before the 1970s, indicating that the ID-IOD is the secondary driver of the interdecadal variability of SWCSR. Modeling results also indicate that the ID-IOBM of SST anomalies is the main driver of interdecadal variability of SWCSR.

1. Introduction

Southwestern China (SWC) is one of the most populated agricultural regions in China, providing approximately 16% of the national food supply [1]. It contains the headwaters of many important rivers, including the Yangtze, Lancang, and Nujiang rivers, which provide as much as 46% of China’s available water resources [
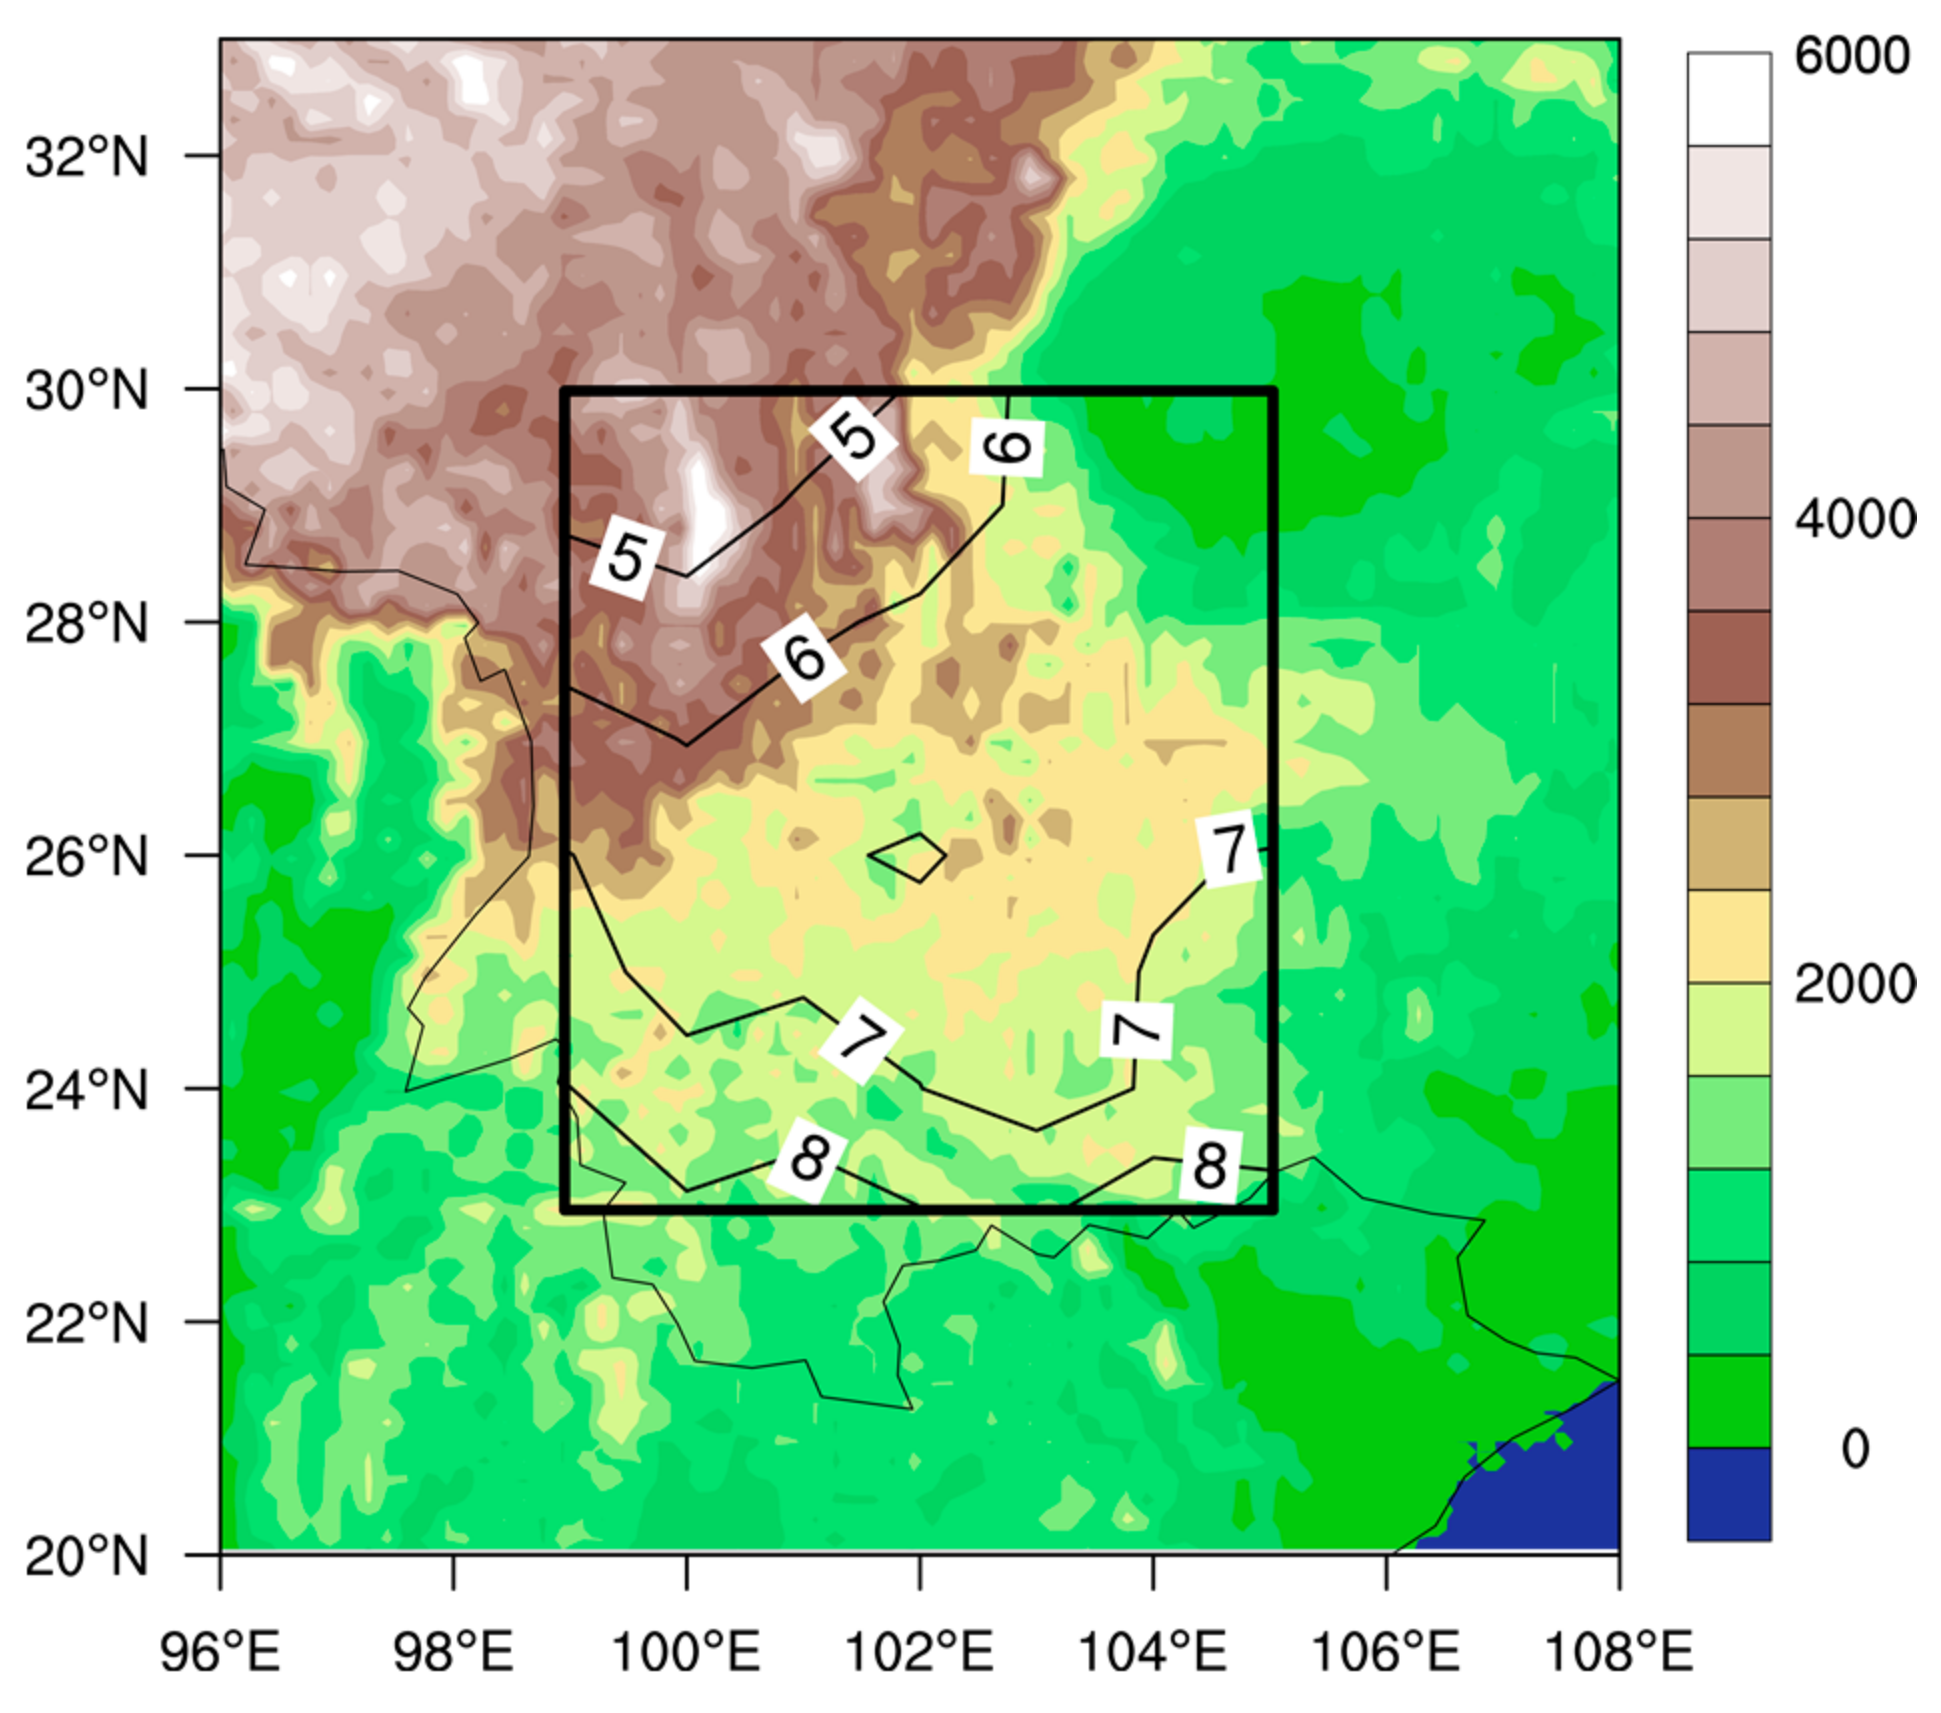
1]. The terrain in this area is very complex. The average altitude in SWC (about 23–30° N and 99–105° E) exceeds 1500 m above sea level, shown in the rectangle in Figure 1. The climatological summer rainfall in SWC gradually decreases from southeast to northwest, with values ranging between 5 mm day−1 and 8 mm day−1 (Figure 1). Unlike flatlands, agriculture and ecosystems in this region are quite vulnerable to summer rainfall variability in low-latitude highlands [2,3].
Southwestern China summer rainfall (SWCSR) exhibits variability on a broad range of timescales. Large interannual variability often causes rainfall to vary from year to year [4], whereas the interdecadal variability always results in persistent droughts and floods, which considerably impact the socio-economic development and the natural environment [5]. Since 2006, the frequency of extreme droughts increased significantly in SWC. Record-breaking droughts hit SWC in the summer of 2006 [6], the autumn of 2009 [7], and the late summer of 2011 [8], which have caused concern among the Chinese government, the public, and the academic sector. Most previous studies focused on the characteristics and the physical causes of SWCSR on interannual timescale [2,7,8,9,10]. Therefore, understanding the primary features of the interdecadal variability of SWCSR and the associated mechanisms is both urgent and valuable.
With the Indian Ocean (IO) located southwest of SWC, some studies emphasized the strong influence of the IO on the decadal variability in East Asian summer climate, especially the Southeastern China summer rainfall (SECSR) [11,12]. The climatological SECSR is different from that in SWC. It gradually decreases from south to north with more abundant rainfall ranging between 6 mm day−1 and 11 mm day−1. Wu et al. [11] revealed that the equatorial IO sea surface temperature (SST) had been increasing since the early 1990s, which led to the development of an anomalous lower-level anticyclone over the South China Sea and the Philippines. As a result, the SECSR increased. Zhang et al. [12] revealed that the southern IO SST considerably impacted the interdecadal changes of the East Asian summer monsoon, which was featured by a decrease in the late 1970s and an increase in the early 1990s. An interdecadal cooling in the south IO triggered anomalous vertical overturning circulation, which led to a lower-level anticyclonic anomaly over the tropical northwestern Pacific. This pattern of circulation anomalies resulted in additional moisture transport into Southeastern China and subsequent rainfall increase. Cao et al. [2] revealed that the subtropical Indian Ocean dipole was the main driver of the interannual variability of SWCSR. To date, the impacts of the IO on the interdecadal variability of SECSR have been extensively studied, whereas the impacts of the IO on the interdecadal variability of SWCSR are less understood. Therefore, the present study focused on the characteristics of interdecadal variability of SWCSR and their connections with the IO SST.
The rest of this paper is organized as follows: Section 2 describes the datasets, methods, and model used in this study. Section 3 investigates the relationship between interdecadal variability of SWCSR and the IO SST. Section 4 describes the mechanisms used to connect the SST anomalies (SSTA) in the IO with the SWCSR. Finally, the discussionand summary are presented.

2. Datasets, Model, and Experiments

2.1. Datasets and Methods

In this study, 116 years of monthly rainfall data (1901–2016) were used to examine the interdecadal variability of summer (June to August, JJA) rainfall in SWC. The monthly rainfall data include monthly mean rainfall from the Global Rainfall Climatology Centre (GPCC) [13] with a spatial resolution of 1.0° × 1.0°, and monthly rainfall in China provided by the National Meteorological Information Center (NMIC) of the China Meteorological Administration on a grid of 2.0° × 2.0° for the period of 1901 to 2016 [14]. Monthly mean sea surface temperature data was provided by the Hadley Centre of the U.K. Met Office (HadISST) [15] for the period of 1847 to 2016. Monthly mean atmospheric fields were extracted from the NOAA-CIRES 20th Century Reanalysis products (20CR) [16] for the period of 1851 to 2014. The spatial resolutions of the 20CR datasets and the HadISST datasets were 2° × 2° and 1° × 1°, respectively. As SST observations in the tropical ocean are sparse prior to 1920 [17], analyses of the present study focused on the period of 1921 to 2016.
To extract interdecadal signal, linear trends were first removed from all the data. Variabilities on timescales shorter than 11 years were then filtered out using the Lanczos filter method [18]. As the most updated 20CR ends in 2014, thereafter, the anomalies of each dataset were calculated relative to the climatology for the period of 1921 to 2014.
The significance test of the correlation coefficient uses the Monte Carlo method [19]. Considering time series A and B, the original time series A was randomly rearranged to obtain a new time series at each grid point. The correlation between this new time series and time series B was then calculated. This process was repeated 1000 times and a distribution of the correlation values at each grid point was finally obtained. The quoted significance level of the correlation between time series A and B indicates the percentage of randomized correlation coefficients that exceed the value being tested. The significance of the regression coefficient was tested using the same method.

2.2. Model and Experimental Setup

The atmospheric general circulation model (AGCM) used was the Community Atmospheric Model version 5.3 (CAM5) developed by the National Center for Atmospheric Research (NCAR, Boulder, CO, USA). CAM5 is coupled to the Community Land Model (CLM version 4.0), and a version with 1.9° latitude by 2.5° longitude resolution and 30 vertical levels was used in this study. Li et al. [20] showed that CAM5 model could effectively capture the spatial features of the summer climate over the IO and East Asia. We conducted three experiments using the CAM5 model. In the control experiment (CTRL run), the model was forced with the climatological mean seasonal cycle of SST (1921–2014). Parallel to the control experiment, two sensitivity experiments were performed with an imposed JJA IO SST anomalous pattern, which we refer to here as the ID-IOBM in the region of 30° S–25° N and 40° E–105° E. One experiment was imposed with the climatological seasonal cycle of SST plus the cold phase of the ID-IOBM (CIO run), and the other with the climatological seasonal cycle of SST minus the cold phase of the ID-IOBM (WIO).

3. Association of Interdecadal Variability of SWCSR with IO SST

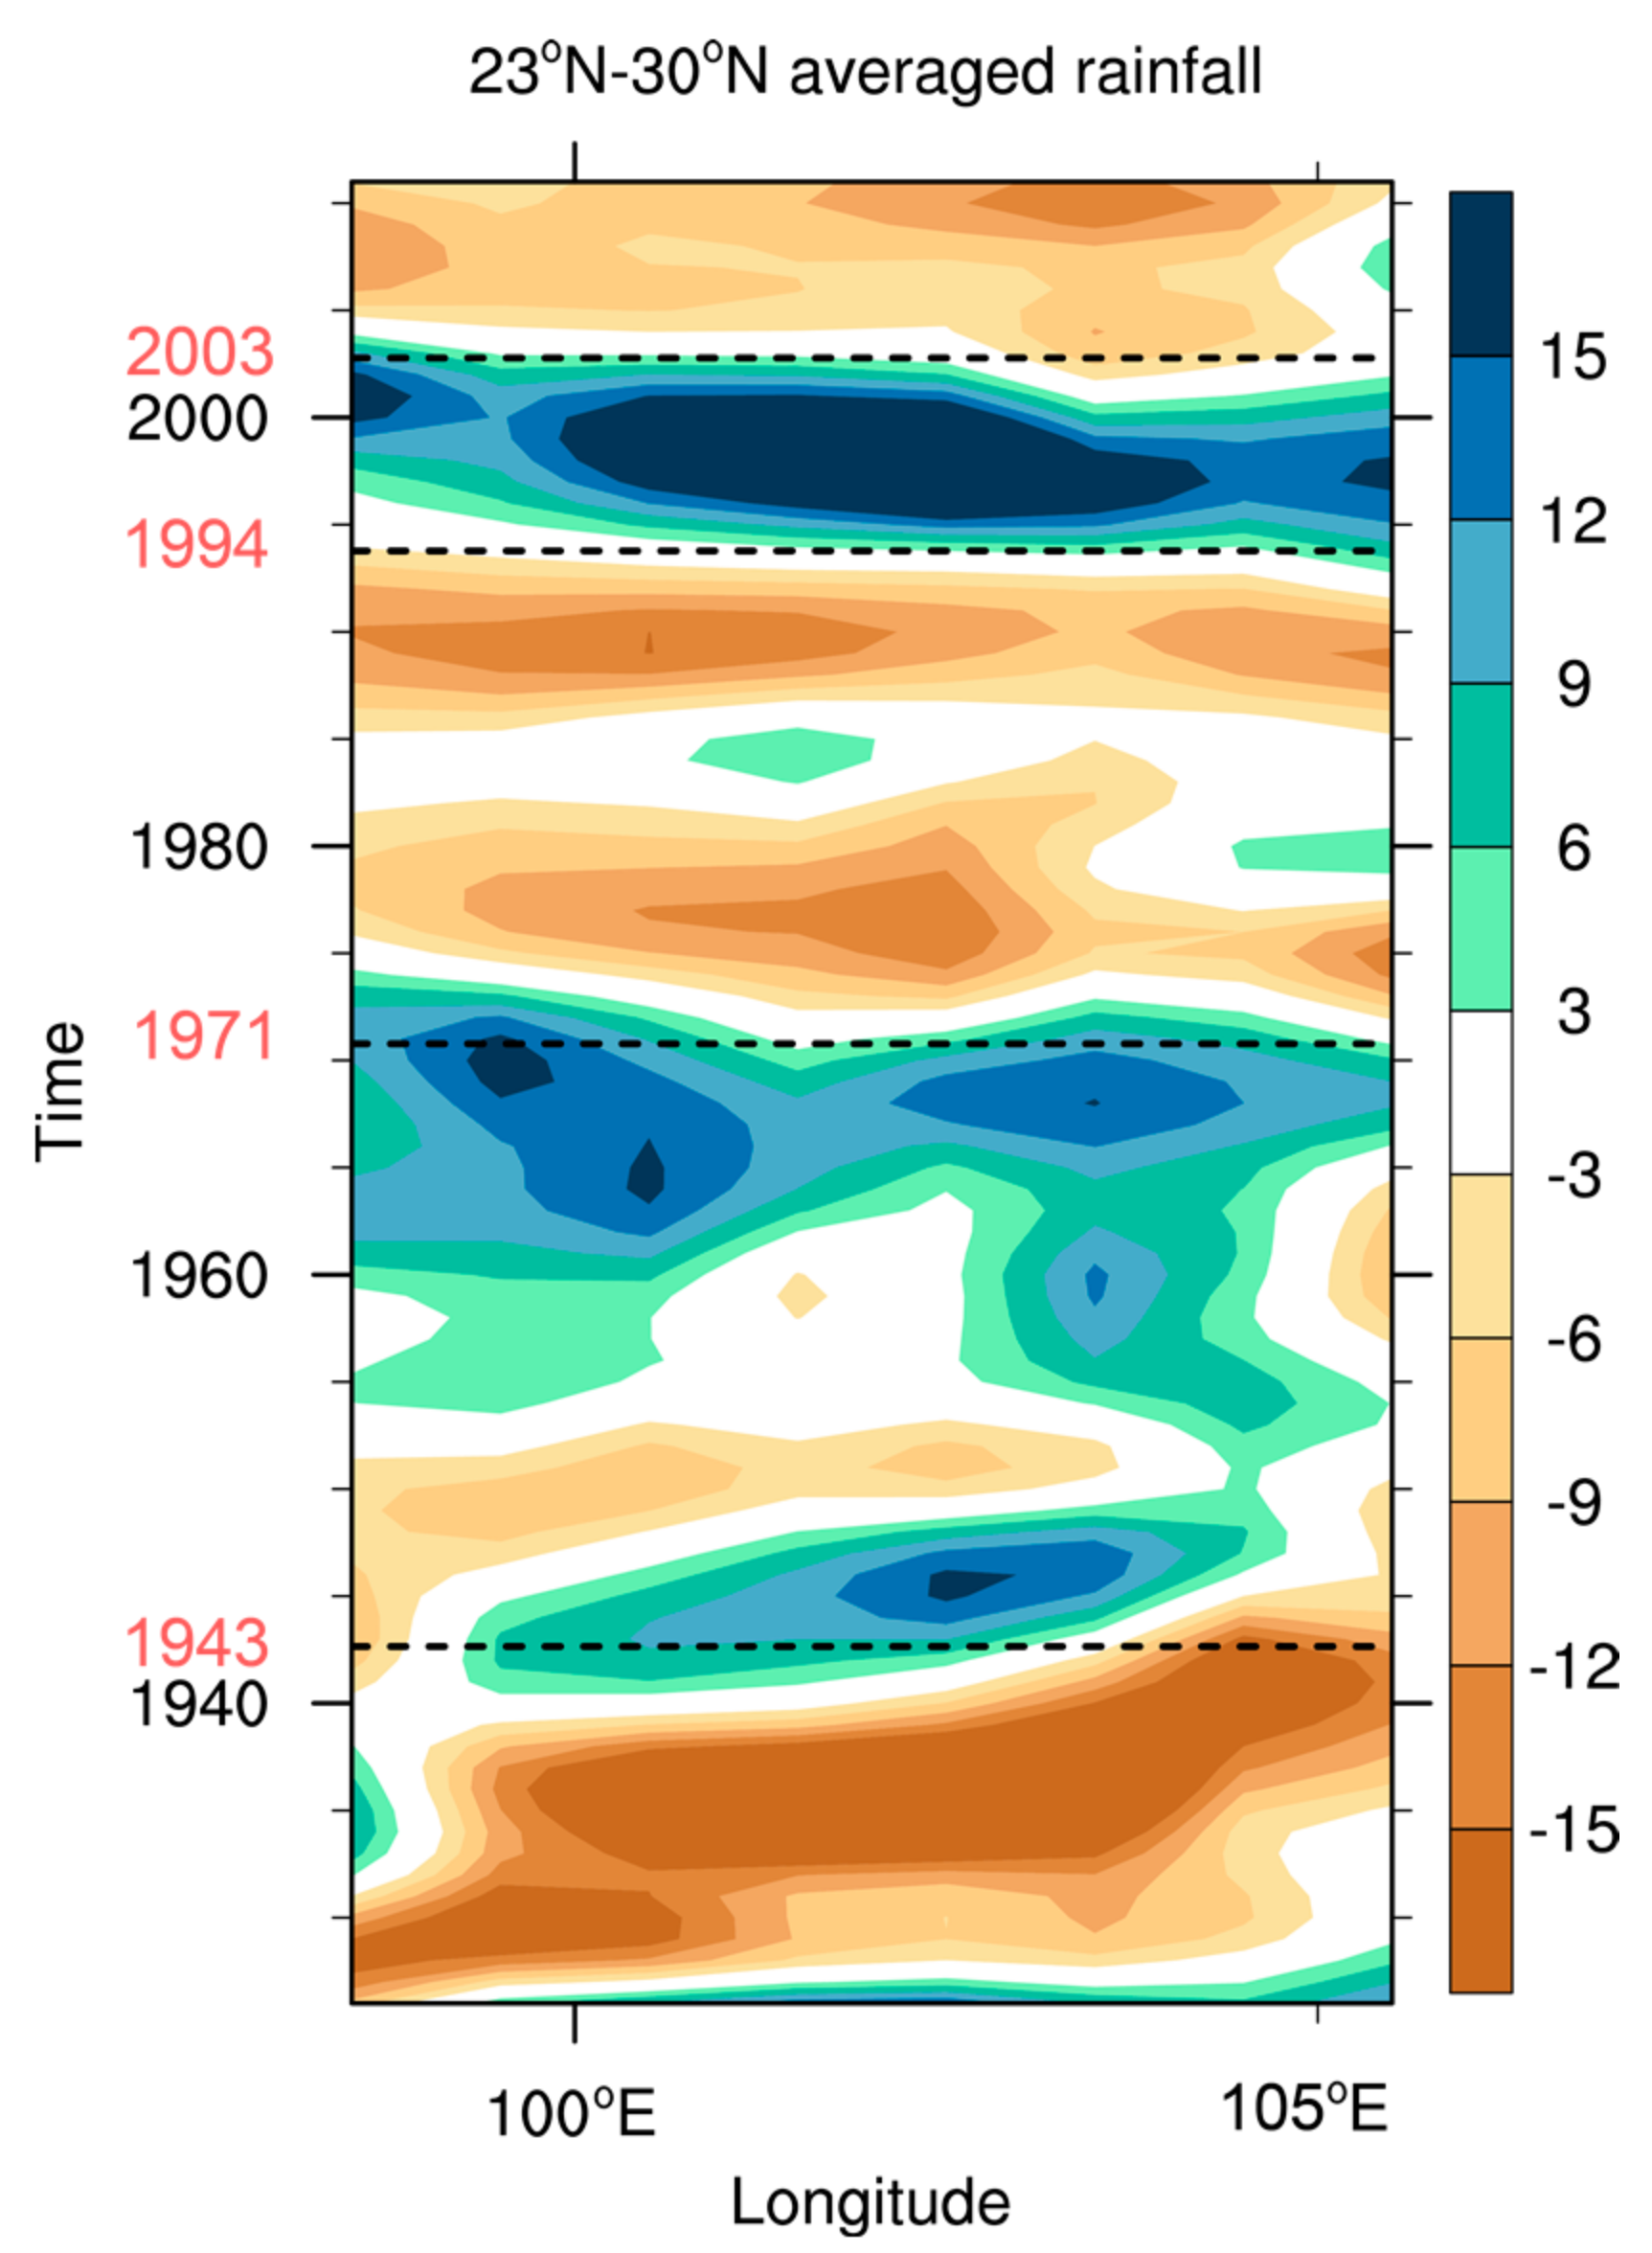
The longitude-time cross-section of observed SWCSR averaged between 23° N and 30° N is provided to reveal the temporal evolution characteristics of interdecadal SWCSR. As shown in Figure 2, the SWCSR displays apparent drought and flood periods during 1926 to 2011, which indicates an evident interdecadal signal in the SWCSR. Flood periods occurred from 1944 to 1971 and 1994 to 2003, whereas drought periods occurred from 1926–1943, 1972–1993, and 2004–2011. The positive (negative) phase of the SWCSR is characterized by increased (decreased) rainfall in SWC. Notably, since the beginning of the 2000s, SWCSR transitioned into a negative phase, which could be considered the interdecadal background of frequent extreme droughts during the past decade [8]. Hereafter, the average rainfall anomalies in SWC, highlighted by the rectangle in Figure 1, is defined as the SWCSR index for further analyses. We aimed to determine the mechanisms responsible for the interdecadal variability of SWCSR.
SSTA play crucial roles in the interdecadal variability in rainfall and the associated large-scale atmospheric circulation over East Asia [21,22]. 
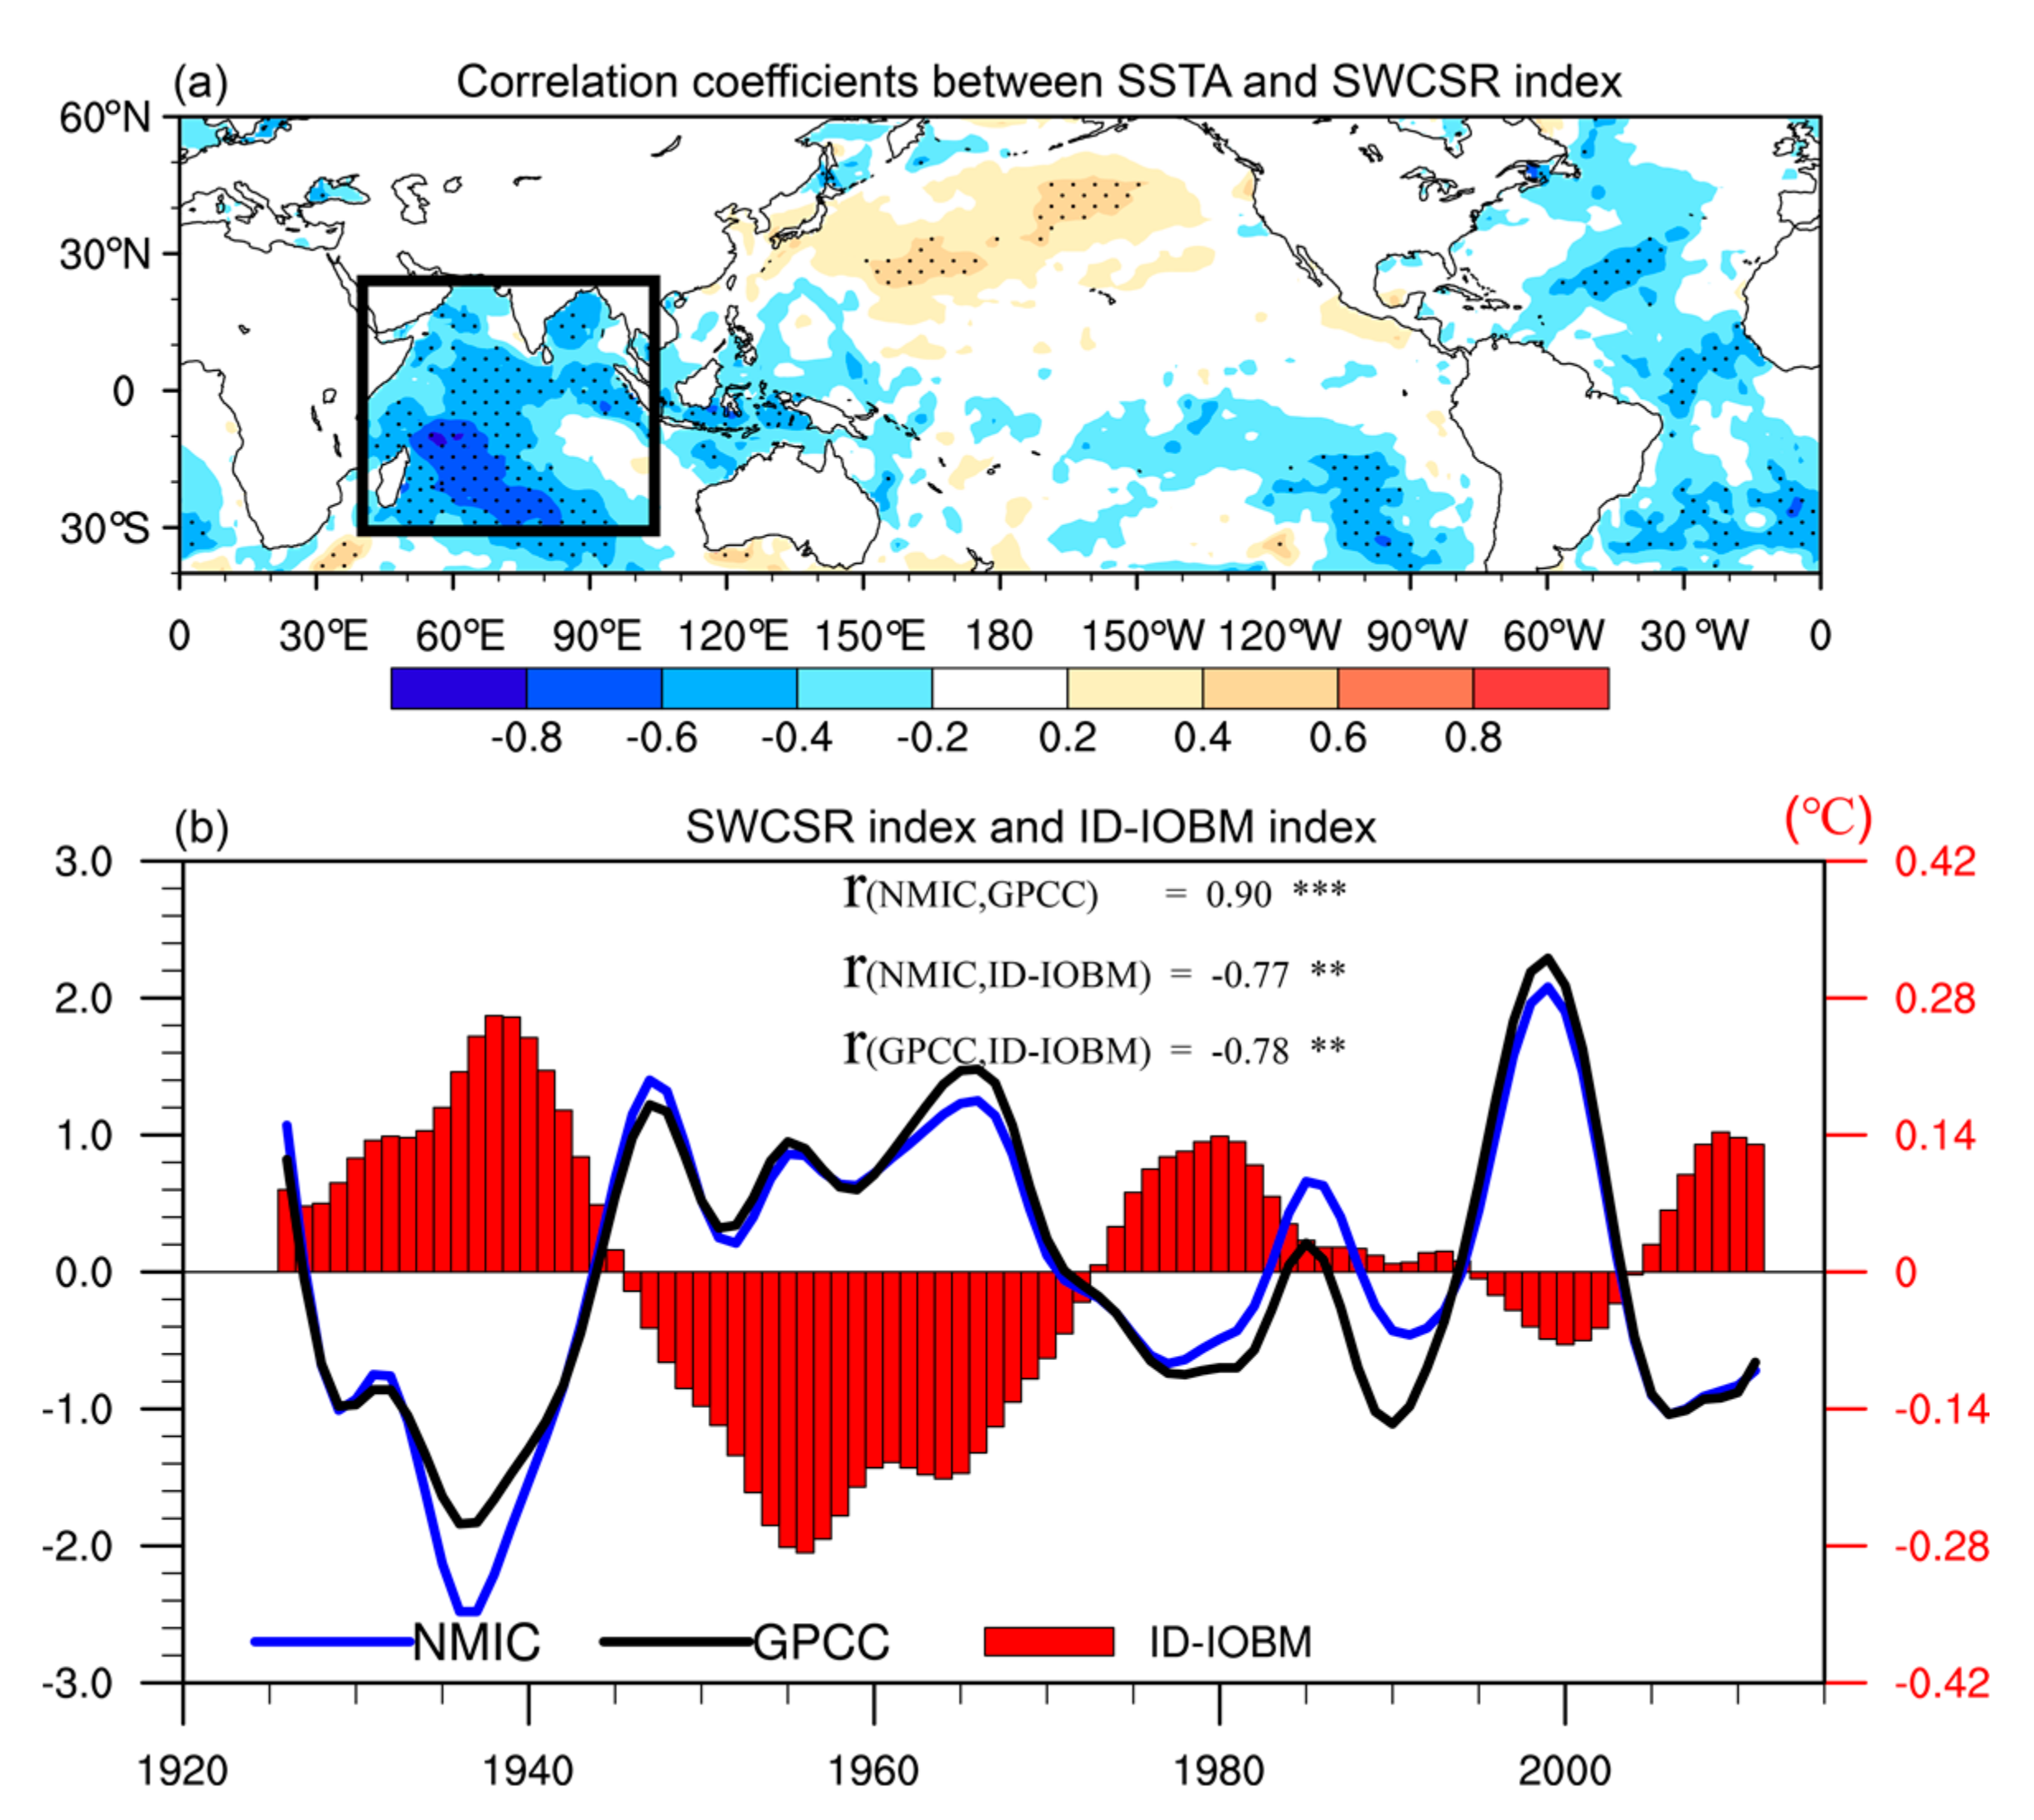
Figure 3a shows the correlation coefficients between SSTA and the SWCSR index for the period of 1926 to 2011. The most significant correlation is found in the IO, which exhibits a basin-wide monopole pattern, whereas an only limited significant correlation area was observed in the Pacific and the Atlantic. This SST pattern in the IO is similar to the conventional IO basin mode (IOBM) that was defined on interannual timescale [23,24]. Given this resemblance, the interdecadal basin-wide mode of IO SST is termed the ID-IOBM in this study. The warm (cold) phase of the ID-IOBM is characterized by warming (cooling) in the entire IO. The average SST anomaliesin the IO is calculated, which is defined as the ID-IOBM index, shown by the red bars in Figure 3b.
Figure 3b also shows the SWCSR and the ID-IOBM indices. The correlation coefficient between the SWCSR index derived from GPCC data (the black line in Figure 3b) and the ID-IOBM index is –0.78 for the period of 1926 to 2011, which is significant at the 95% confidence level, suggesting that the ID-IOBM is closely negatively correlated with the SWCSR. When the ID-IOBM is in its cold phase with below-normal SST over the entire IO, summer rainfall tends to be abundant in SWC. To further confirm the results, the SWCSR index was also calculated using the NMIC observed grid data, shown by the blue line in Figure 3b. The correlation coefficient between the two SWCSR indices, derived from GPCC and NMIC data, is 0.90 for the period of 1926 to 2011, which is significant at the 99% confidence level, indicating that the interdecadal variability of SWCSR is robust in observational rainfall data. The correlation coefficient between the SWCSR index derived from the NMIC data and the ID-IOBM index is −0.77, which is significant at the 95% confidence level, showing a steady relationship between the ID-IOBM and the SWCSR, irrespective of the rainfall data used. Hereafter, the SWCSR index derived from the NMIC data is used for further analyses.
Previous studies demonstrated that the interdecadal variation of rainfall is always accompanied by atmospheric circulation variability [25,
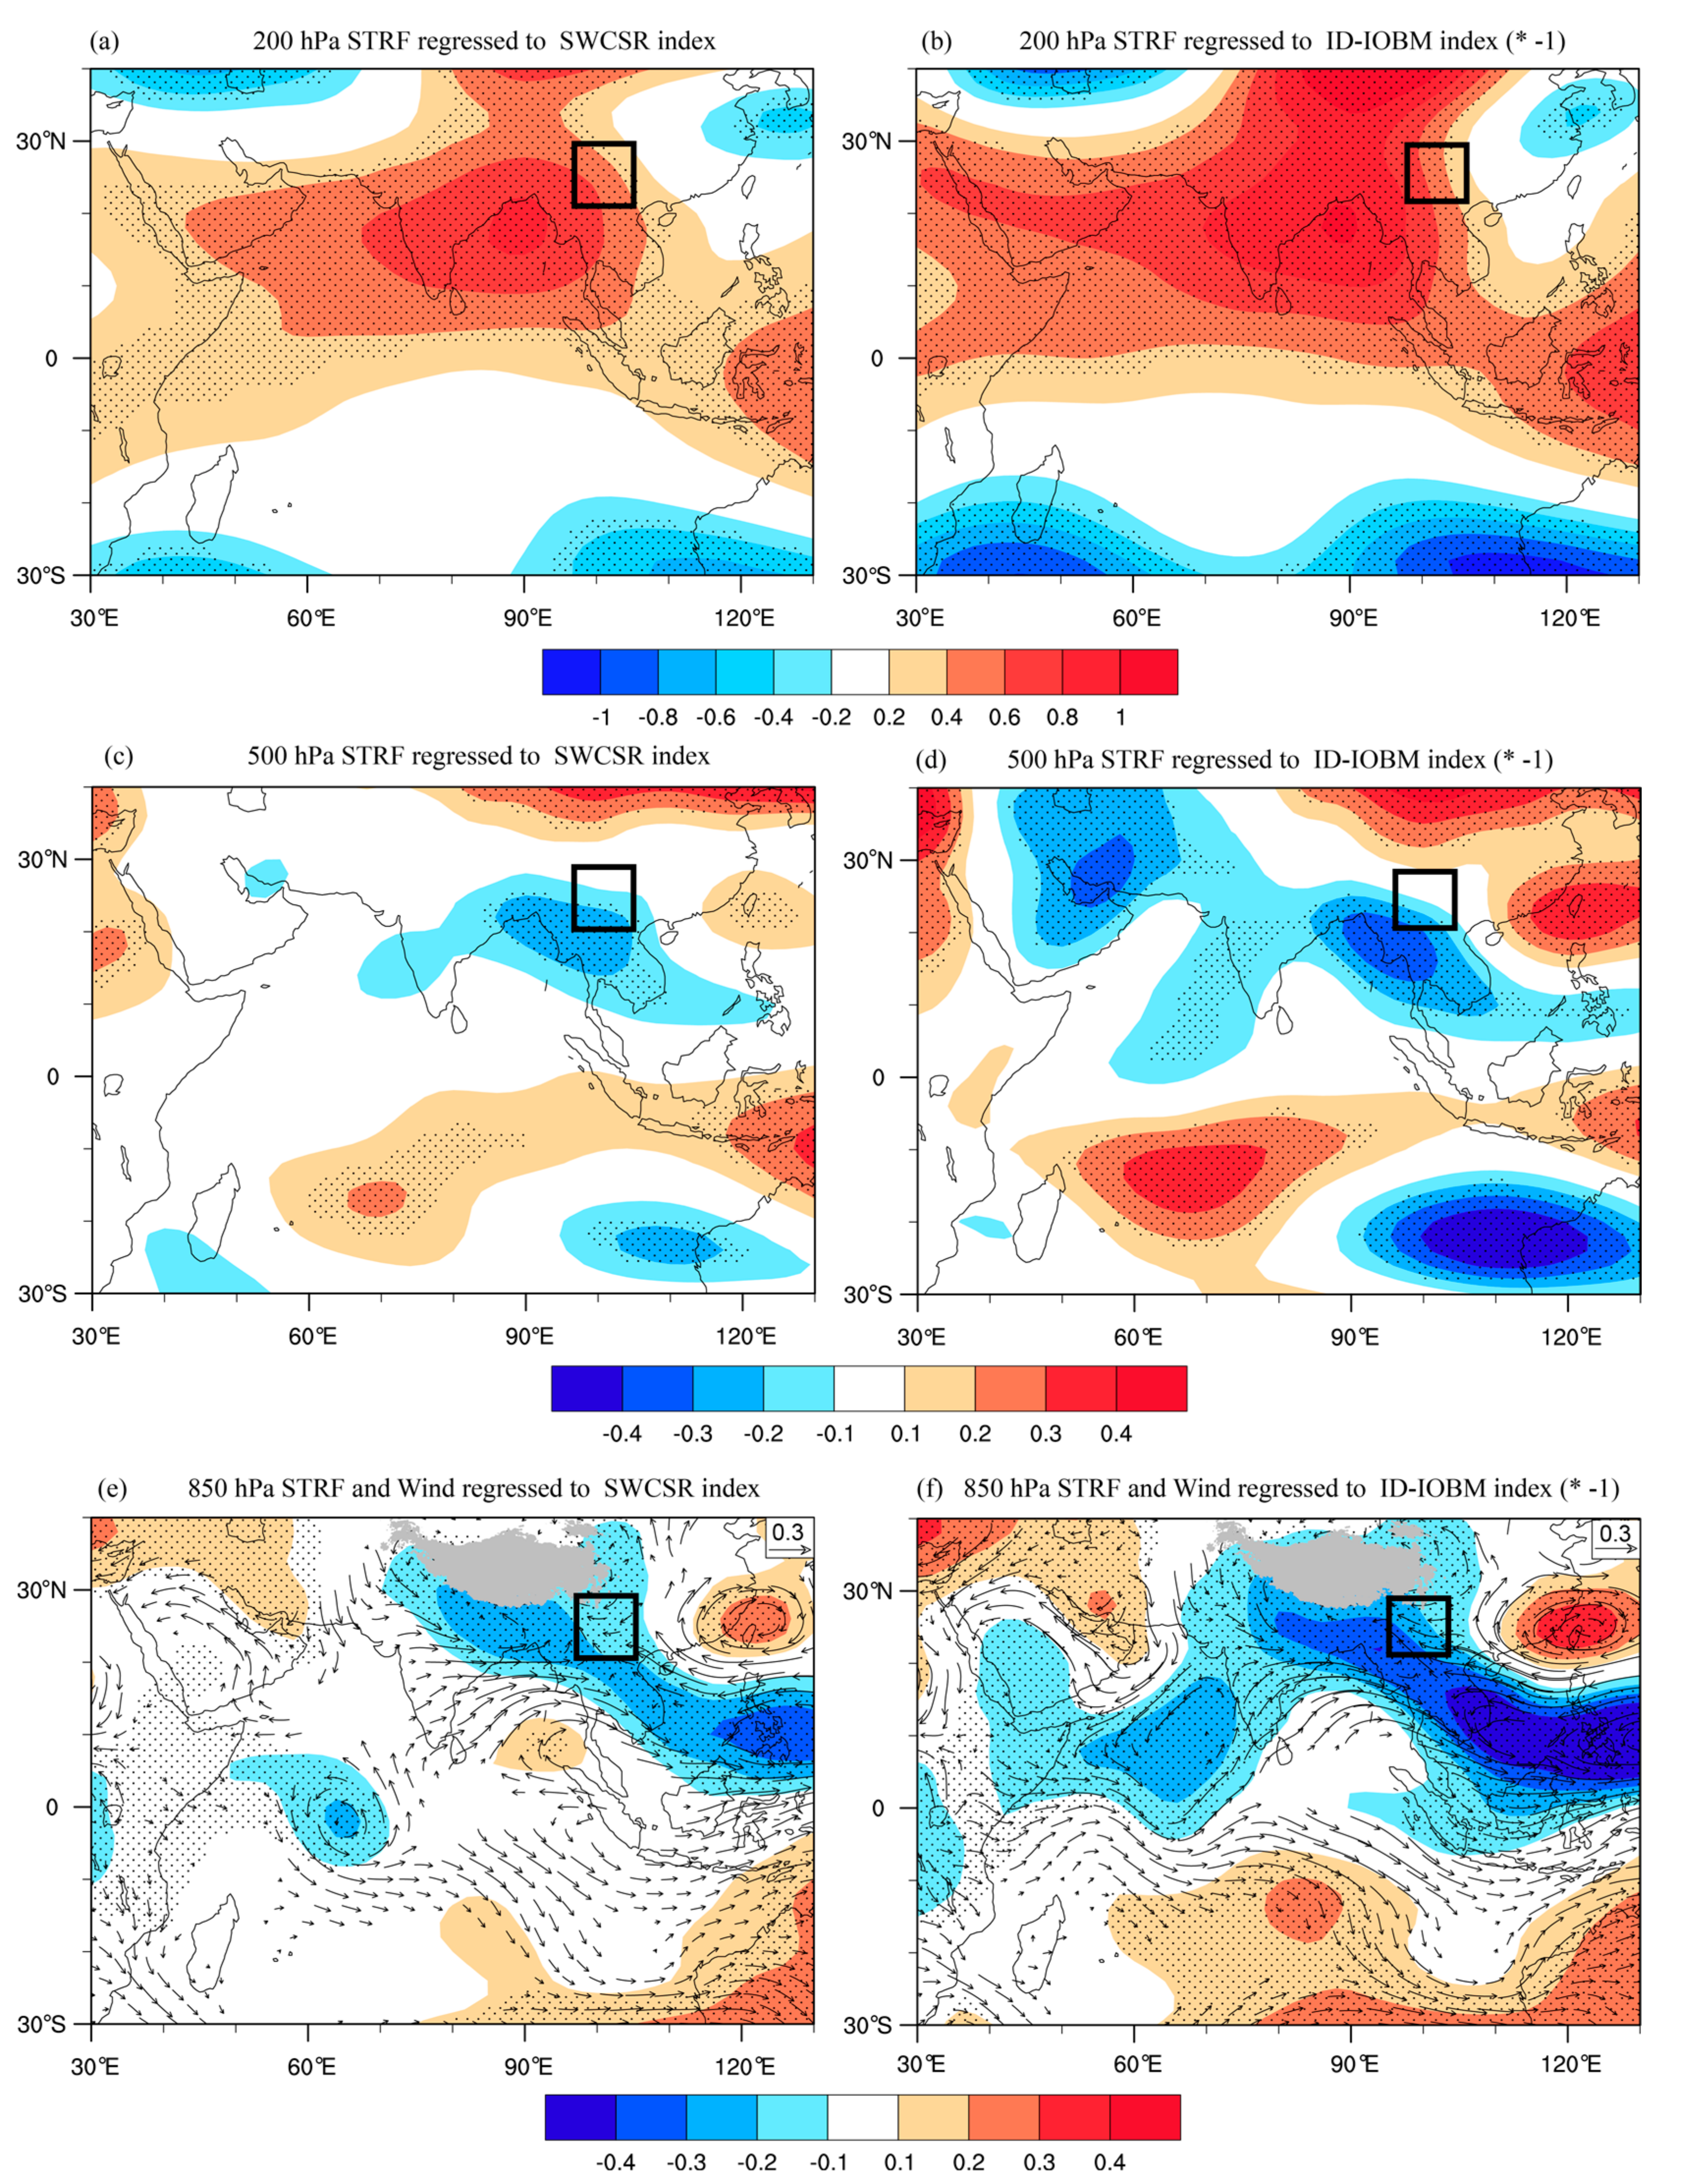
26]. Therefore, summer atmospheric circulation patterns associated with the SWCSR and the ID-IOBM indices were investigated to verify the interdecadal connection between the SWCSR and the ID-IOBM (Figure 4). Note that the sign of the ID-IOBM index is reversed during regression analyses to represent the impacts of the cold phase of the ID-IOBM.
The stream function patterns regressed against the SWCSR index and the ID-IOBM index at 200 hPa are shown in Figure 4a,b, respectively. From Figure 4a, the most distinct signal associated with the SWCSR was the positive action center (above-normal center of stream function) located over the Indo-China peninsula, which is favorable for upper-level divergence and the accompanying ascending motion. The highly similar features are outlined in Figure 4b. Figure 4c,d show the regressed stream function patterns at 500 hPa. The common characteristics between Figure 4c,d are the significant positive action center located over the Indo-China peninsula and the negative action center over IO, indicating an anomalous ascending motion over the Indo-China peninsula and a descending motion over the tropical IO. The lower-level circulation anomalies associated with the SWCSR index, as shown in Figure 4e, exhibit opposite patterns to the upper level, including prevailing westerly wind anomalies over the entire tropical IO and an anomalous cyclone over the Indo-China peninsula. Significant westerly anomalies are observed at the west flank of the cyclone, which may strengthen the moisture transport from the Bay of Bengal (BOB) to SWC. The lower-level circulation anomalies associated with the ID-IOBM index (Figure 4f) have a similar pattern to that shown in Figure 4e.
Based on these circulation results, we inferred that the anomalous cyclone over the Indo-China peninsula at 850 hPa may impact the SWCSR by strengthening the moisture transport from the BOB to SWC. The anomalous negative action center at 500 hPa and the positive action center at 200 hPa favor the anomalous ascending motion over the Indo-China peninsula, corresponding well with the anomalous cyclone at 850 hPa. The combined effects of the anomalous ascending motion and the above-normal moisture transport are favorable for above-normal SWCSR. Notably, the anomalous circulation patterns associated with the cold phase of the ID-IOBM (Figure 4b,d,f) and the positive phase of the SWCSR (Figure 4a,c,e) are very similar. Therefore, these circulation anomalies may act as the bridge connecting the SWCSR with the ID-IOBM.

4. Possible Mechanisms of the Impacts of IO SST on SWCSR

To further confirm the above-mentioned physical processes of the impacts of the ID-IOBM on the SWCSR, observational diagnoses and model simulation experiments were performed. The results are shown in terms of the positive phase of the SWCSR and the cold phase of the ID-IOBM.

4.1. Observational Analyses

First, Figure 5 shows the regressed divergent wind and velocity potential against the SWCSR index and the ID-IOBM index. A notable lower-level divergence and upper-level convergence associated with the cold phase of the ID-IOBM is found over the tropical IO, as seen in Figure 5b,d. At the lower level, anomalous outflows from the tropical IO converge over SWC, corresponding to a regional ascending motion. An accompanying upper-level divergence center is located over SWC, and the corresponding outflows converge over the tropical IO. Therefore, an inter-hemispheric anomalous vertical circulation cell emerges between the tropical IO and SWC. Figure 5b,d show that the regressed divergent wind patterns associated with the ID-IOBM index are highly consistent with those associated with the SWCSR index, indicating that the anomalous inter-hemispheric vertical circulation cell, induced by the ID-IOBM in its cold phase, may be an important driver that increases SWCSR. Such a mechanism shares some similarity with that presented by Krishnamurthy and Goswami [27], who showed that the anomalous vertical circulation also acted as the bridge connecting the interdecadal variability of Indian summer monsoon rainfall and tropical eastern Pacific SST.
To further verify the linkage between the ID-IOBM and the SWCSR, Figure 6 displays the two highly similar vertical circulation patterns associated with the two indices along the chosen cross-section, shown by the black line in Figure 5a. The most significant feature is the anomalous vertical circulation located between B (around 5° S, 65° E) and C (around 25° N, 100° E). The ascending motions over C (SWC) are accompanied by lower-level southwestern moisture transport from the BOB, both of which favor increased rainfall in SWC. The descending motions over B (tropical IO) are associated with the underlying cold phase of the ID-IOBM. The similar pattern in Figure 6b further confirms that the anomalous inter-hemispheric vertical circulation cell induced by the ID-IOBM in its cold phase is an important factor that leads to increased SWCSR.

4.2. Model Simulation

To demonstrate the possible driving effect of IO SST on the circulation anomalies associated with the SWCSR, three numerical experiments described in Section 2 were completed with CAM5: the CTRL run, the CIO run, and the WIO run. The CTRL run used the climatological seasonal cycle of SST. The CIO (WIO) run was completed with the climatological seasonal cycle of SST plus (minus) JJA SSTA regressed against the SWCSR index, which we refer to here as the cold phase of the ID-IOBM in the region of 30° S–25° N and 40° E–105° E (Figure 7a,b). The ID-IOBM pattern was scaled by a factor of four and used to drive the model. For each experiment, the model was integrated for 50 years. The first 10 years of output were discarded to exclude any possible transient spin-up effects. A time mean was then calculated by averaging the output for the remaining 40 years for each JJA season. The linear response to the SST forcing was defined as the difference between the time means for the CIO (WIO) run and the CTRL run. The response was scaled by a factor of 0.25 to allow a comparison with the observed results.
The difference of atmospheric response between the CIO and CTRL experiments is shown in Figure 7c,e. In response to the cold phase of the ID-IOBM, the descending motion over the tropical IO tends to intensify, whereas the ascending motion developments were observed over the Indo-China peninsula, accompanied by outflows to the tropical IO at the upper level (Figure 7c). The consequent increase in the divergence at 200 hPa over the Indo-China peninsula was accompanied by an anomalous lower-level convergence (Figure 7e). The difference in atmospheric response between the WIO and CTRL experiments is shown in Figure 7d,f. The atmospheric responses were approximately the same, but with opposite polarity, highlighting the symmetric impacts of the ID-IOBM on the SWCSR. These atmospheric responses are similar to the observational regressions in Figure 5, though the location of atmospheric circulation anomalies over the IO displays some small differences from observations. We can see that the model results confirm our hypothesis that the circulation anomalies induced by the ID-IOBM connect the SWCSR with the ID-IOBM.

5. Discussion

In Figure 3b, it is interesting to note that the amplitude of ID-IOBM is gradually decreasing after the beginning of 1970s, while the variability of SWCSR does not show such a change. Are there any other potential factors that can have impacts on the SWCSR?
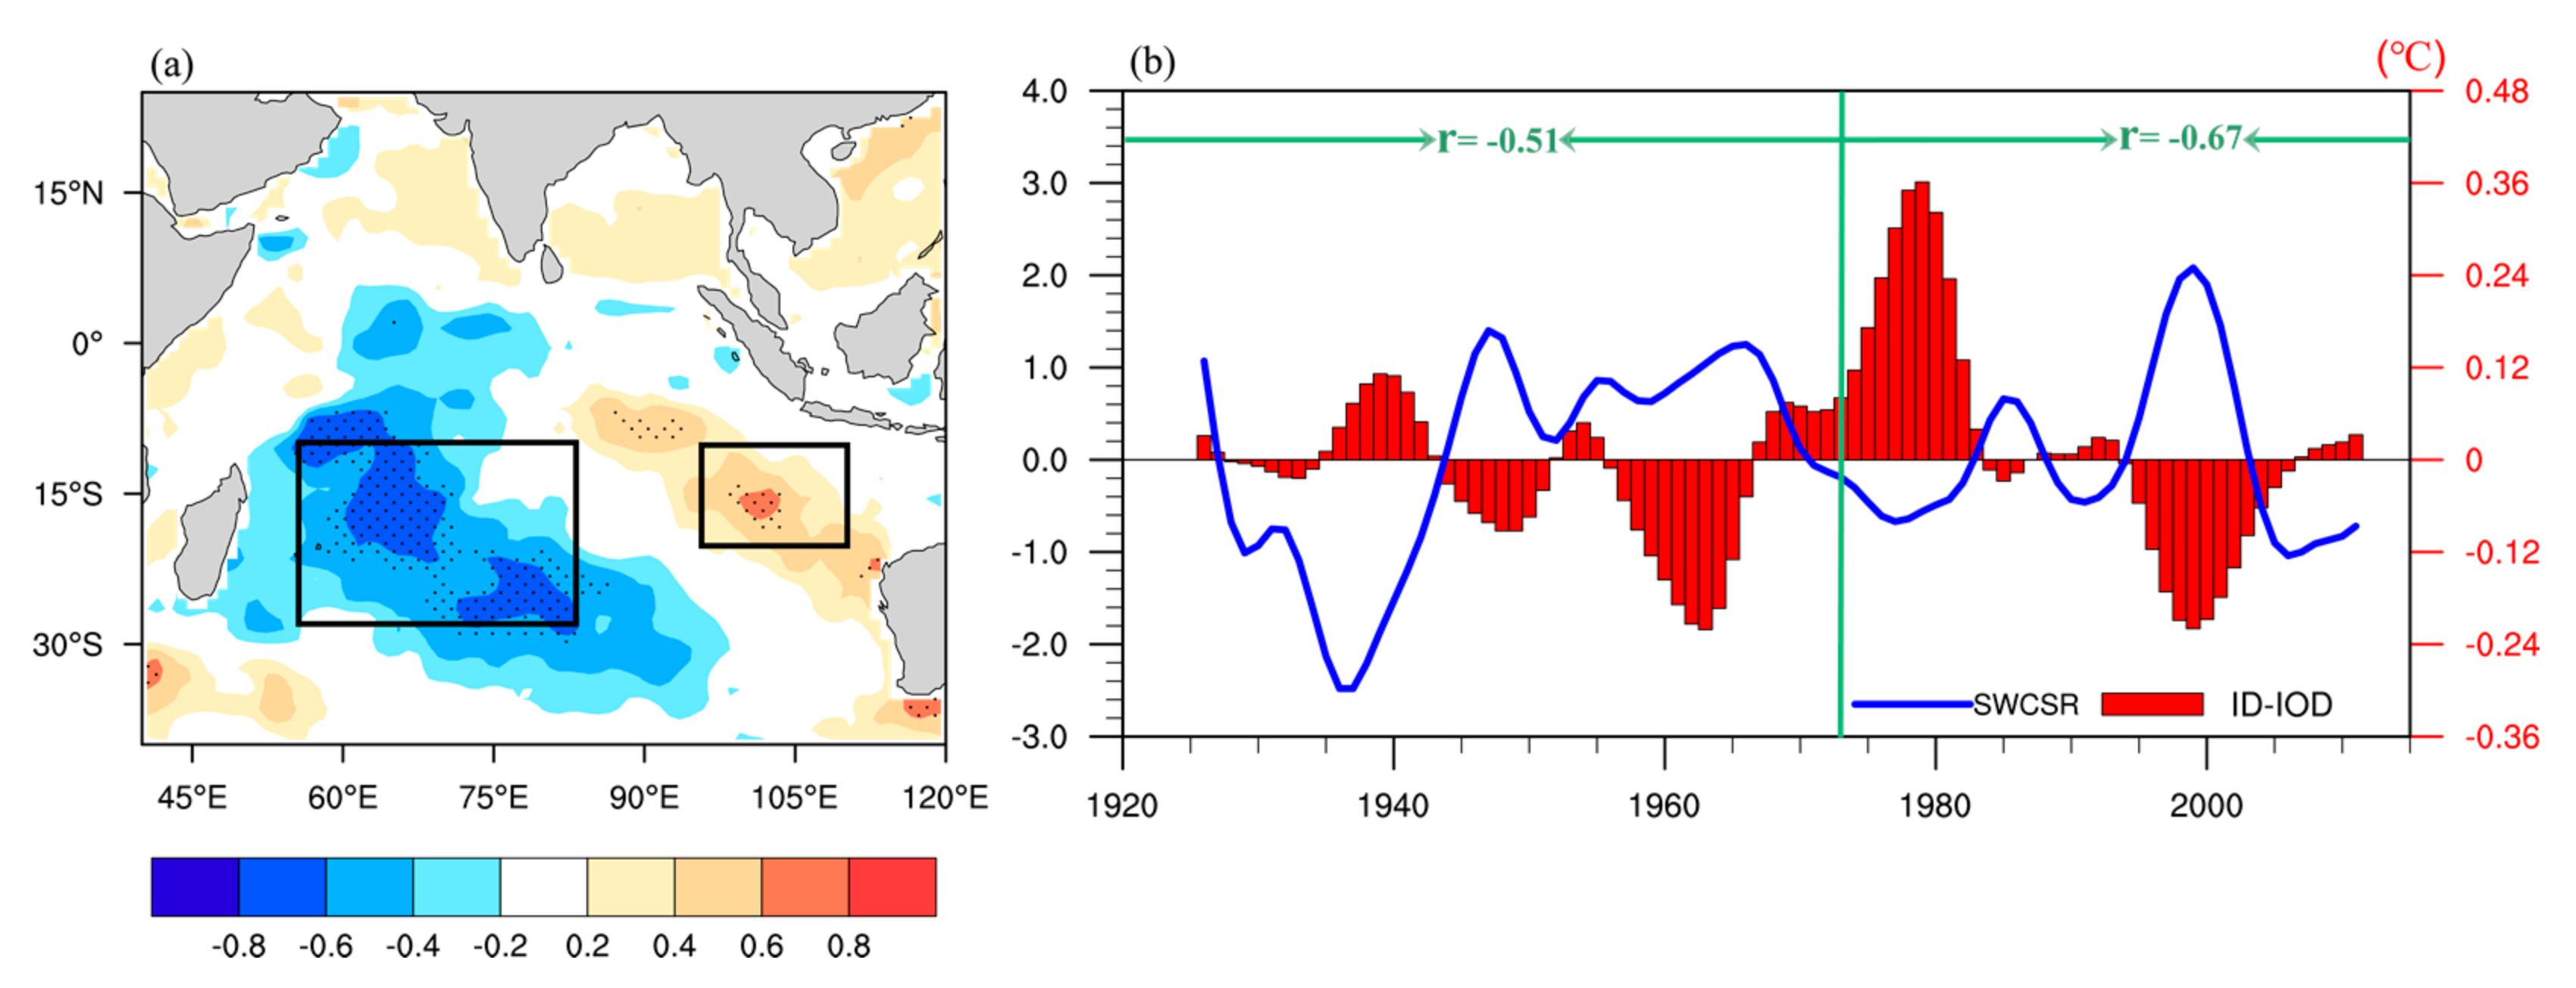
To explain such a phenomenon, we calculate the correlation coefficients between the IO SSTA and the SWCSR index after remove the ID-IOBM from the IO SSTA, which displays a significant dipole pattern (Figure 8a). The SSTA in the southwestern (southeastern) Indian Ocean is negatively (positively) correlated with the SWCSR index. This pattern is termed the interdecadal Indian Ocean dipole (ID-IOD) hereafter. The positive phase of the ID-IOD is characterized by above-normal (below-normal) SSTA in the southwestern (southeastern) IO, and vice versa. The ID-IOD is quite different from the conventional IOD, which is active mainly in the tropical IO on interannual timescale in boreal autumn [28,29]. The difference between the average SSTA in 28° S–10° S, 55° E–83° E and 20° S–10° S, 95° E–110° E (rectangles in Figure 8a) is defined as the ID-IOD index (Figure 8b). The amplitude of ID-IOD is increasing after the beginning of 1970s, which may be responsible for the decreasing amplitude of ID-IOBM in the recent past decades.
To investigate the possible relationship between ID-IOD and SWCSR, the correlation coefficient between the SWCSR index and the ID-IOD index is calculated, which is −0.51 (not significant) for the period of 1926–1972 and is −0.67 (significant at the 90% confidence level) for the period of 1973–2011, indicating that the SWCSR is more closely associated with the ID-IOD after the beginning of 1970s. The relatively low correlation between the SWCSR index and the ID-IOD index before 1970s is possibly due to the weak amplitude of simultaneous ID-IOD.
To further investigate the possible influence of the ID-IOD on the SWCSR and associated physical processes, we analyzed SSTA and circulation anomalies associated with the ID-IOD. 
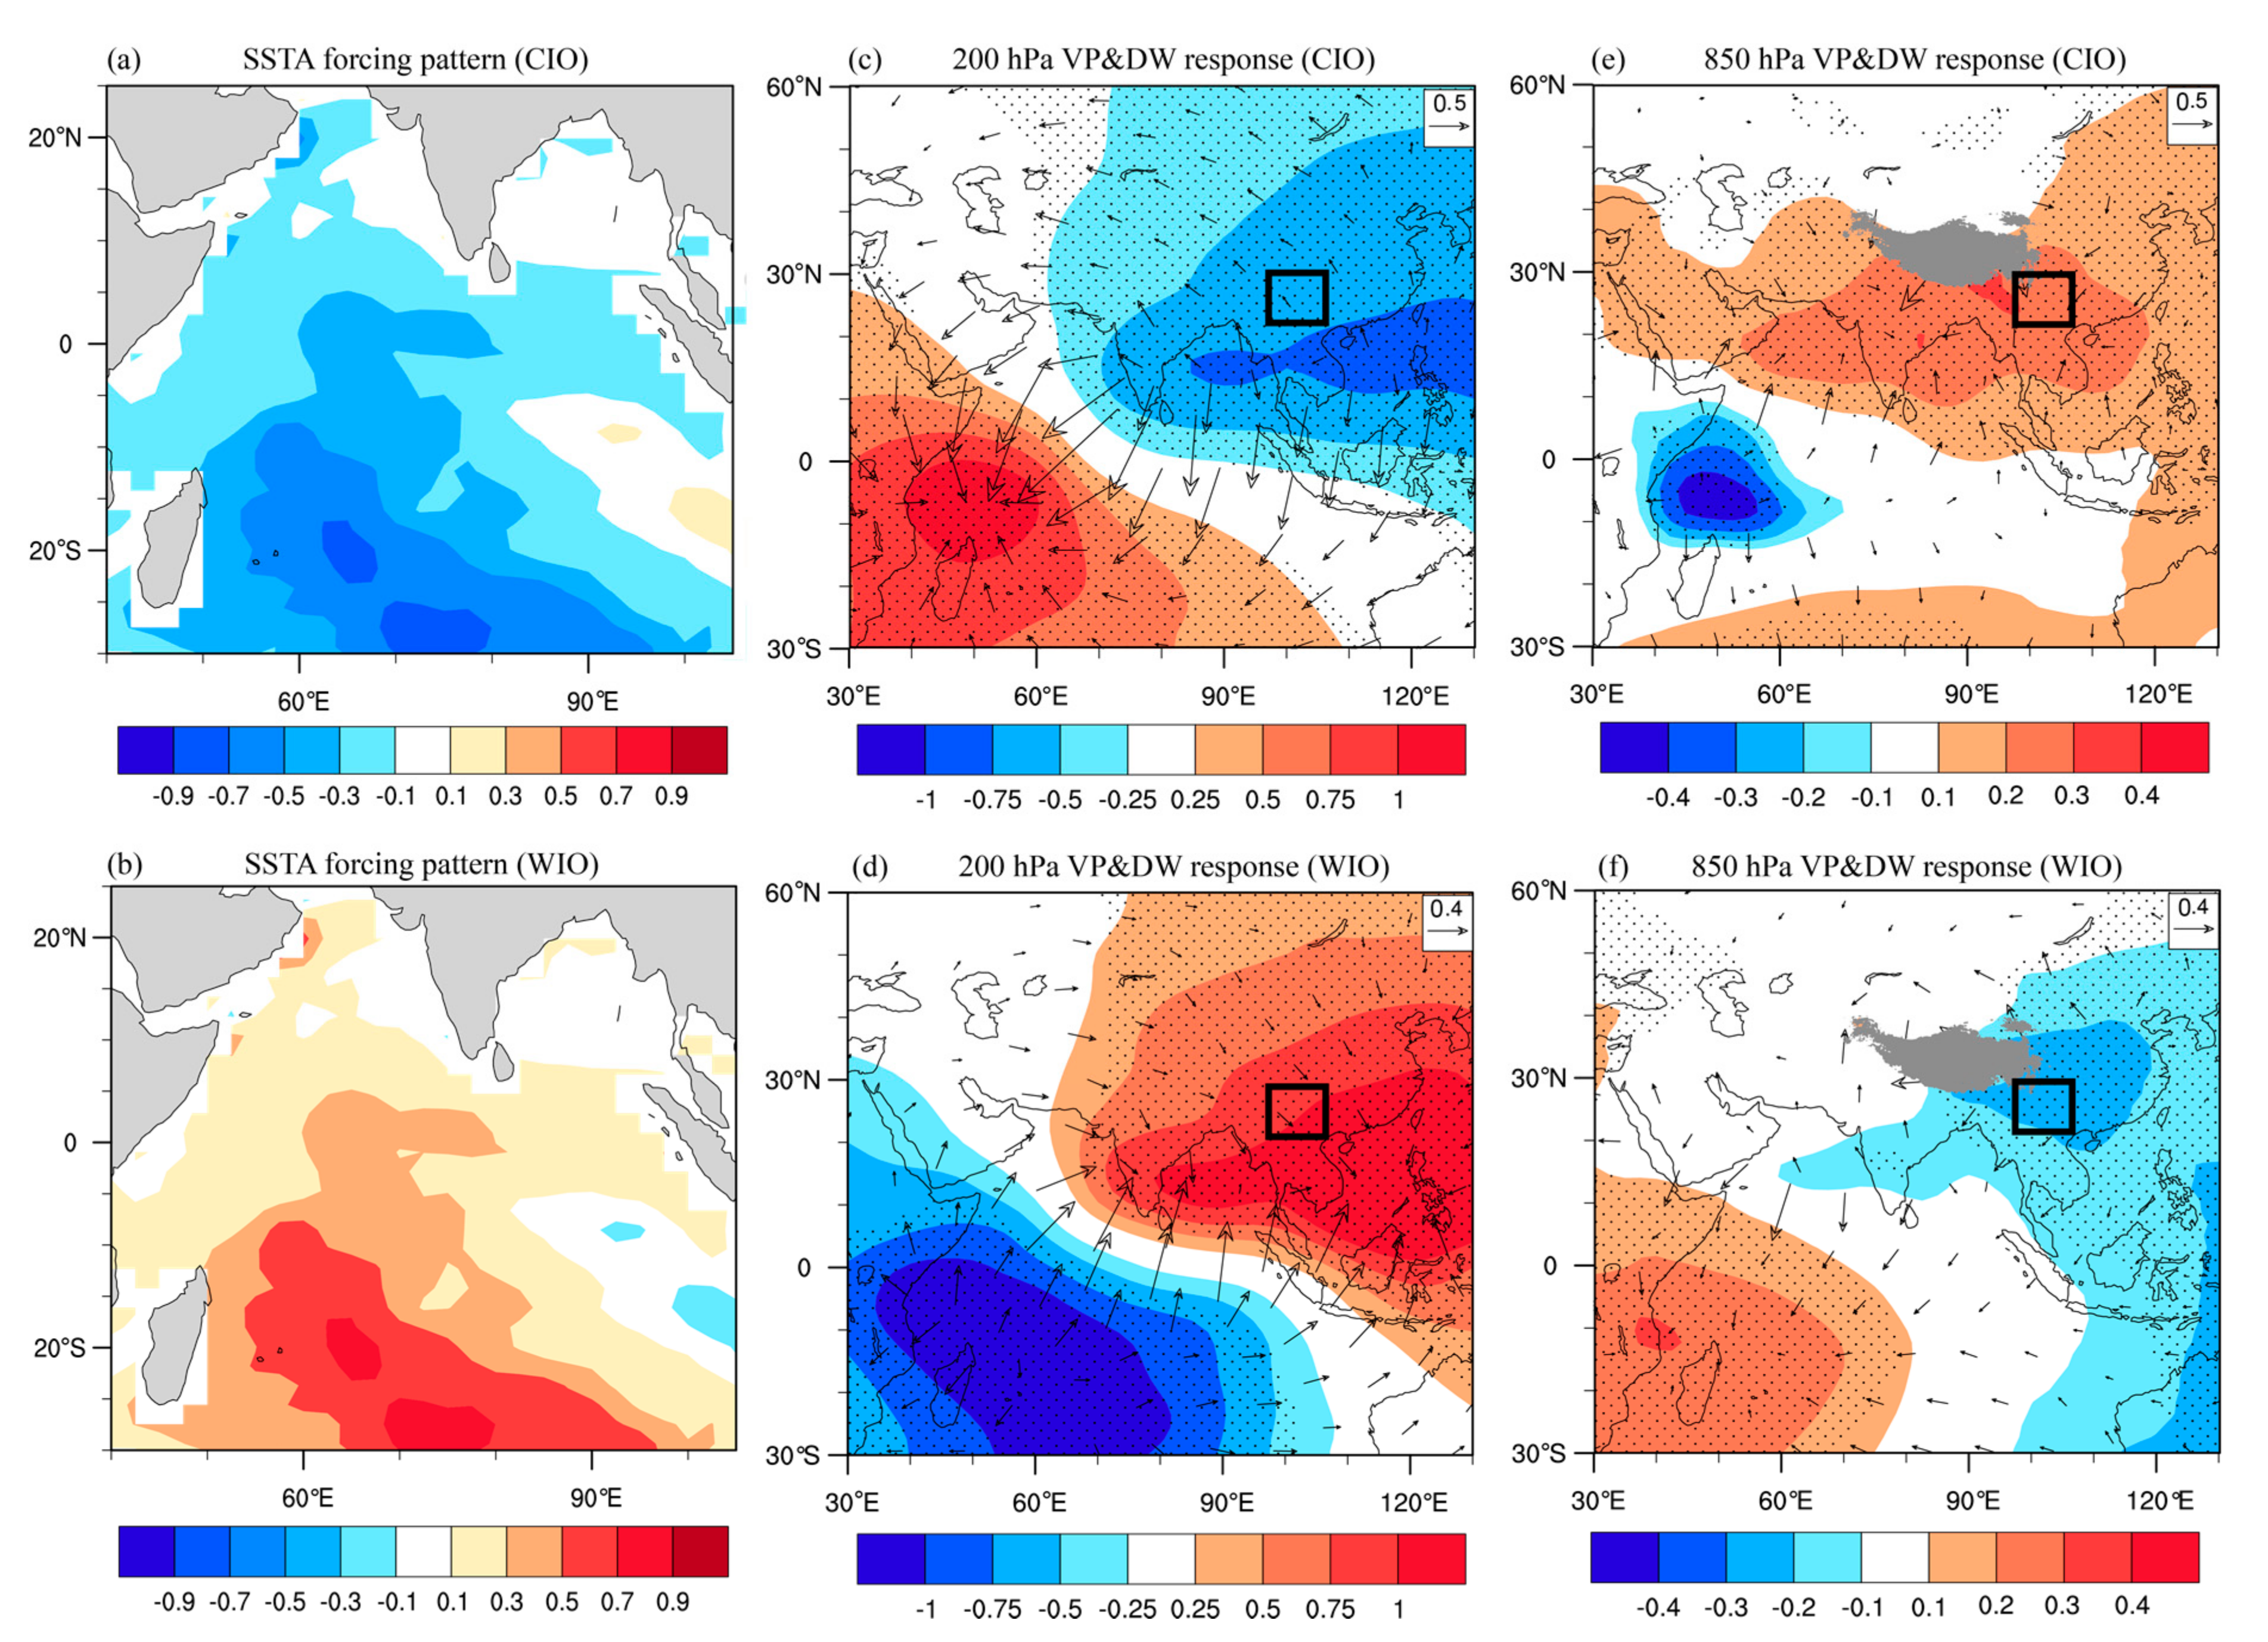
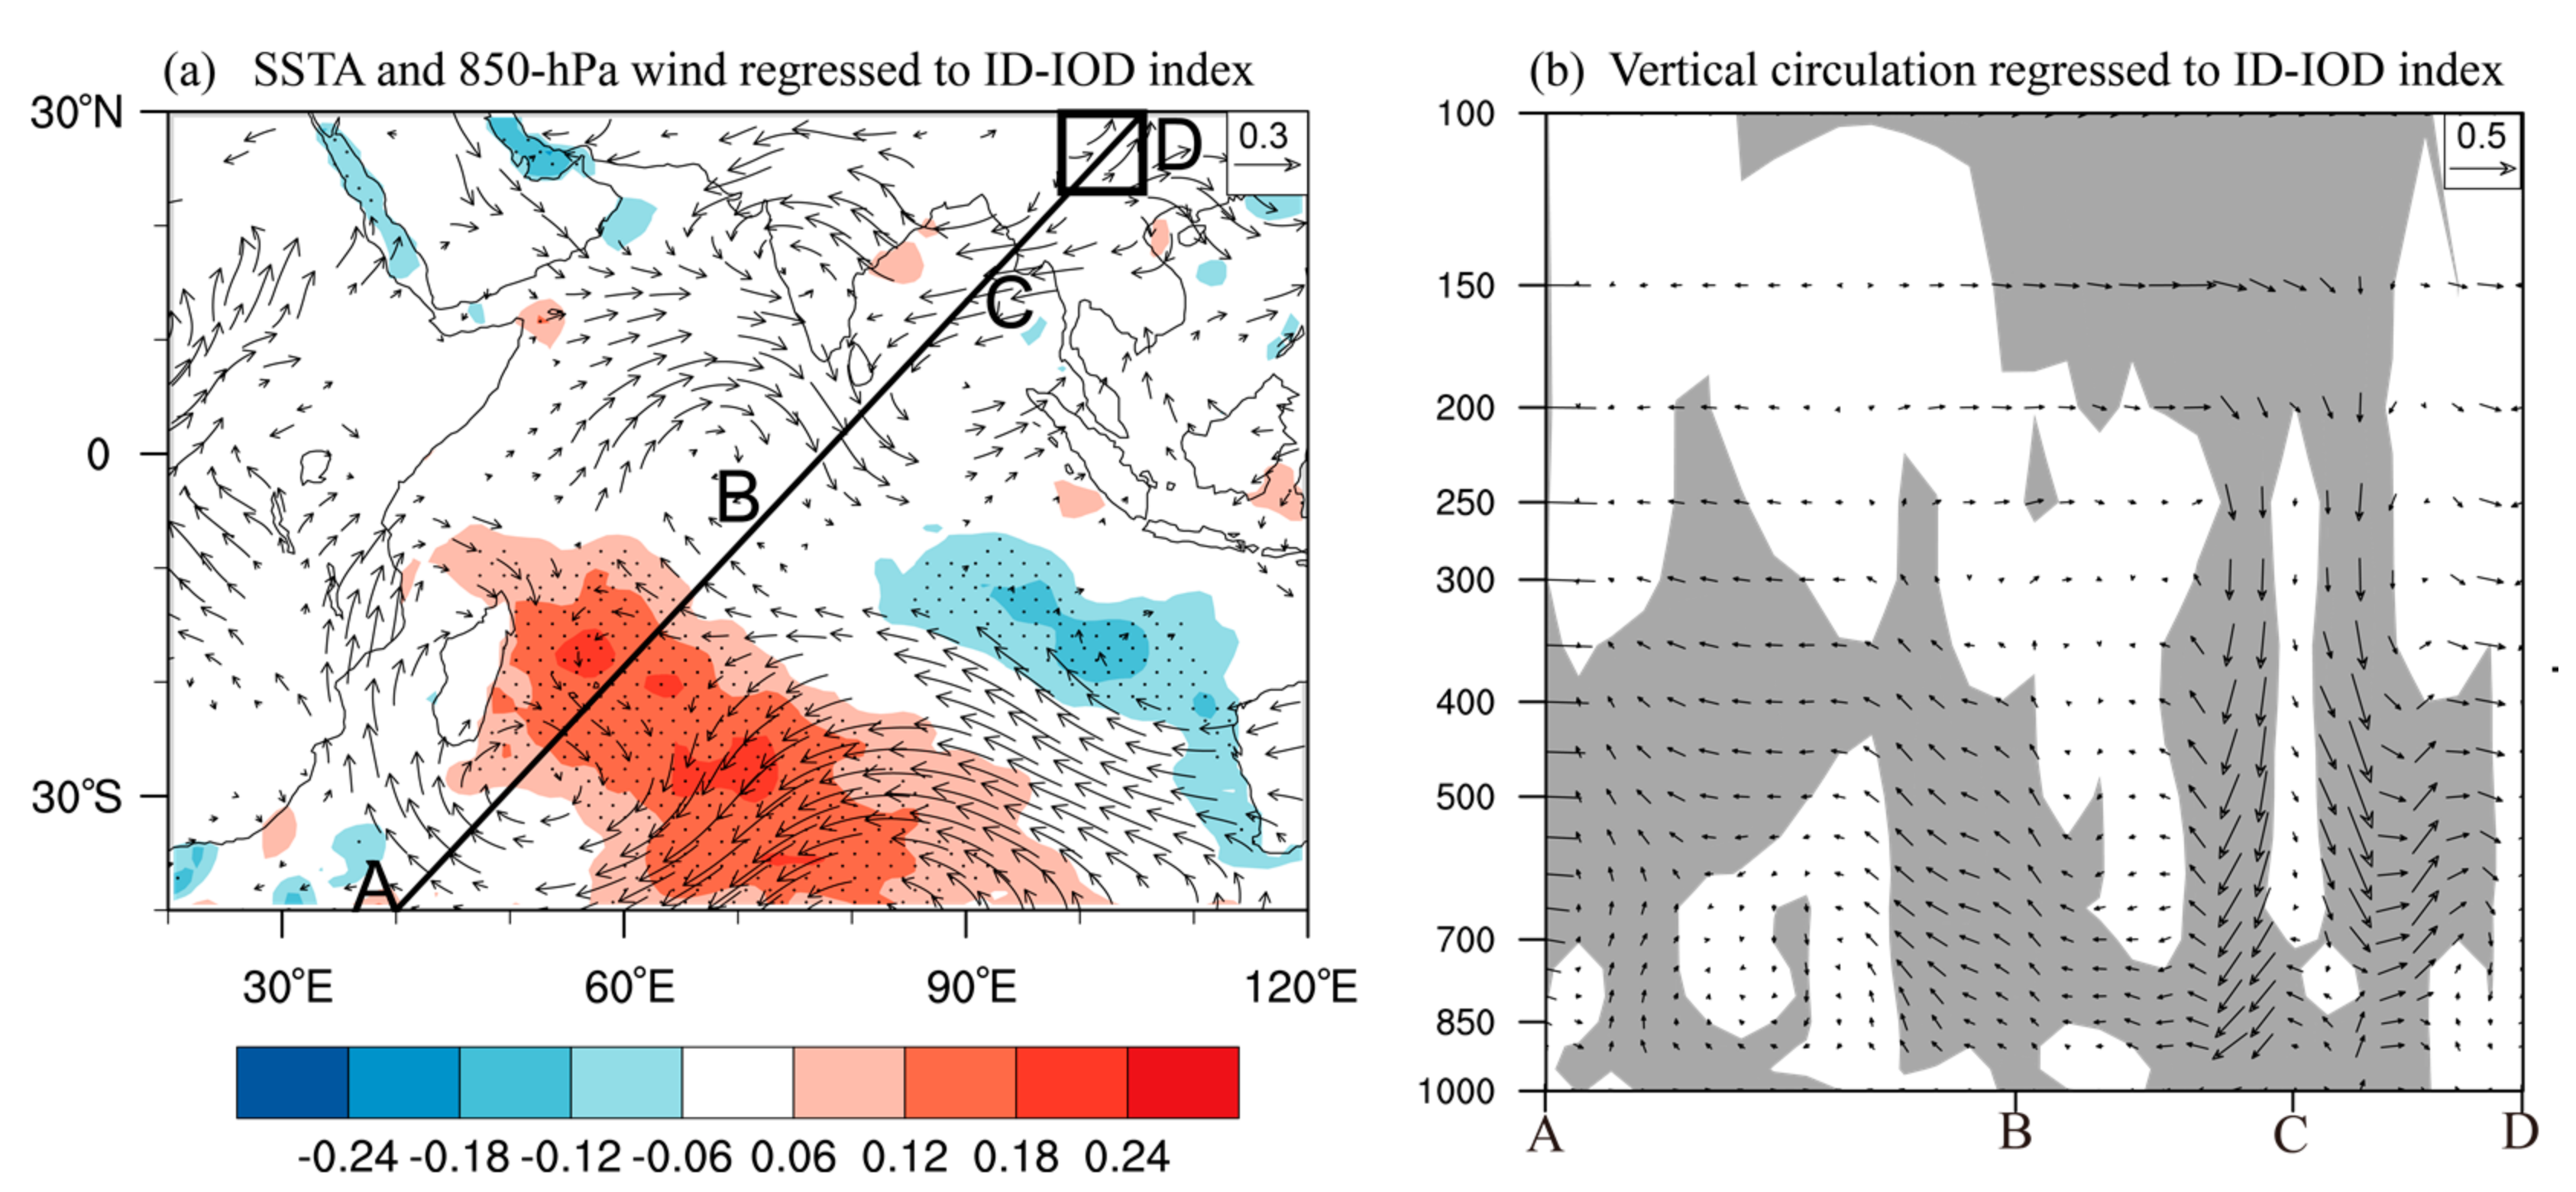
Figure 9a shows that the regressed SSTA against the ID-IOD index in the IO displays an apparent dipole pattern in the southern IO, which is similar to the conventional subtropical Indian Ocean dipole defined on interannual timescale [30]. The anomalous easterlies prevail over the subtropical south IO, resulting in anomalous convergence over the southwestern IO and the central tropical IO, corresponding to a regional ascending motion. Figure 9b shows that the anomalous ascending motion over the central tropical IO is accompanied with anomalous upper-level divergence. One branch of the corresponding upper-level outflows converges over the Indo-China peninsula, which is favorable for anomalous descending motion and lower-level northeasterly anomalies, both of which favor decreased rainfall in SWC. This is consistent with the results revealed by Cao et al. [2], who showed that the summer rainfall in SWC is negatively connected with the subtropical Indian Ocean dipole on interannual timescale. The positive subtropical Indian Ocean dipole facilitated easterly anomalies off the eastern coast of BOB and weakened climatological water vapor flux to the northern BOB. As a result, anomalous water vapor divergence and less rainfall was observed over the SWC.
Therefore, the decreasing amplitude of ID-IOBM in the recent past may be related to the increasing amplitude of ID-IOD. After the beginning of 1970s, the impacts of ID-IOD on SWCSR is strengthening. The combined impacts of ID-IOBM and ID-IOD sustained the variability of SWCSR. The ID-IOBM is closely associated with the SWCSR for the whole period of 1926–2011. However, the impacts of ID-IOD on SWCSR is relatively weak before 1970s, indicating that the ID-IOD is the secondary driver of the interdecadal variability of SWCSR.
Though the SECSR and SWCSR are neighboring regions, the relationship between ID-IOBM and SECSR are quite different from the ID-IOBM and SWCSR relationship. We studied the relationship between ID-IOBM and SECSR separately [31], which is beyond the scope of this work.
These results provide an efficient prediction potential for summer rainfall variations, especially for extreme droughts and floods over SWC. With the Tibetan Plateau to the northwest of the SWC, the influence on the interdecadal variability of SWCSR is worth studying in the future. Our efforts in this study were dedicated to studying the historical changes and causes of SWC; however, the future changes in drought risk in SWC under global warming need to be further studied. This information is crucial to advance planning for agricultural adaptation and water resource management. Therefore, a multimodel projection of future rainfall in SWC will be completed in the future.

6. Summary

In this study, we focused on the characteristics of the intedecadal variability of SWCSR and its relationship with the IO SST through observational analyses and model simulation experiments. We found a remarkable negative correlation between the SWCSR and the ID-IOBM in summer. The dynamic processes linking the SWCSR to the ID-IOBM were then examined.
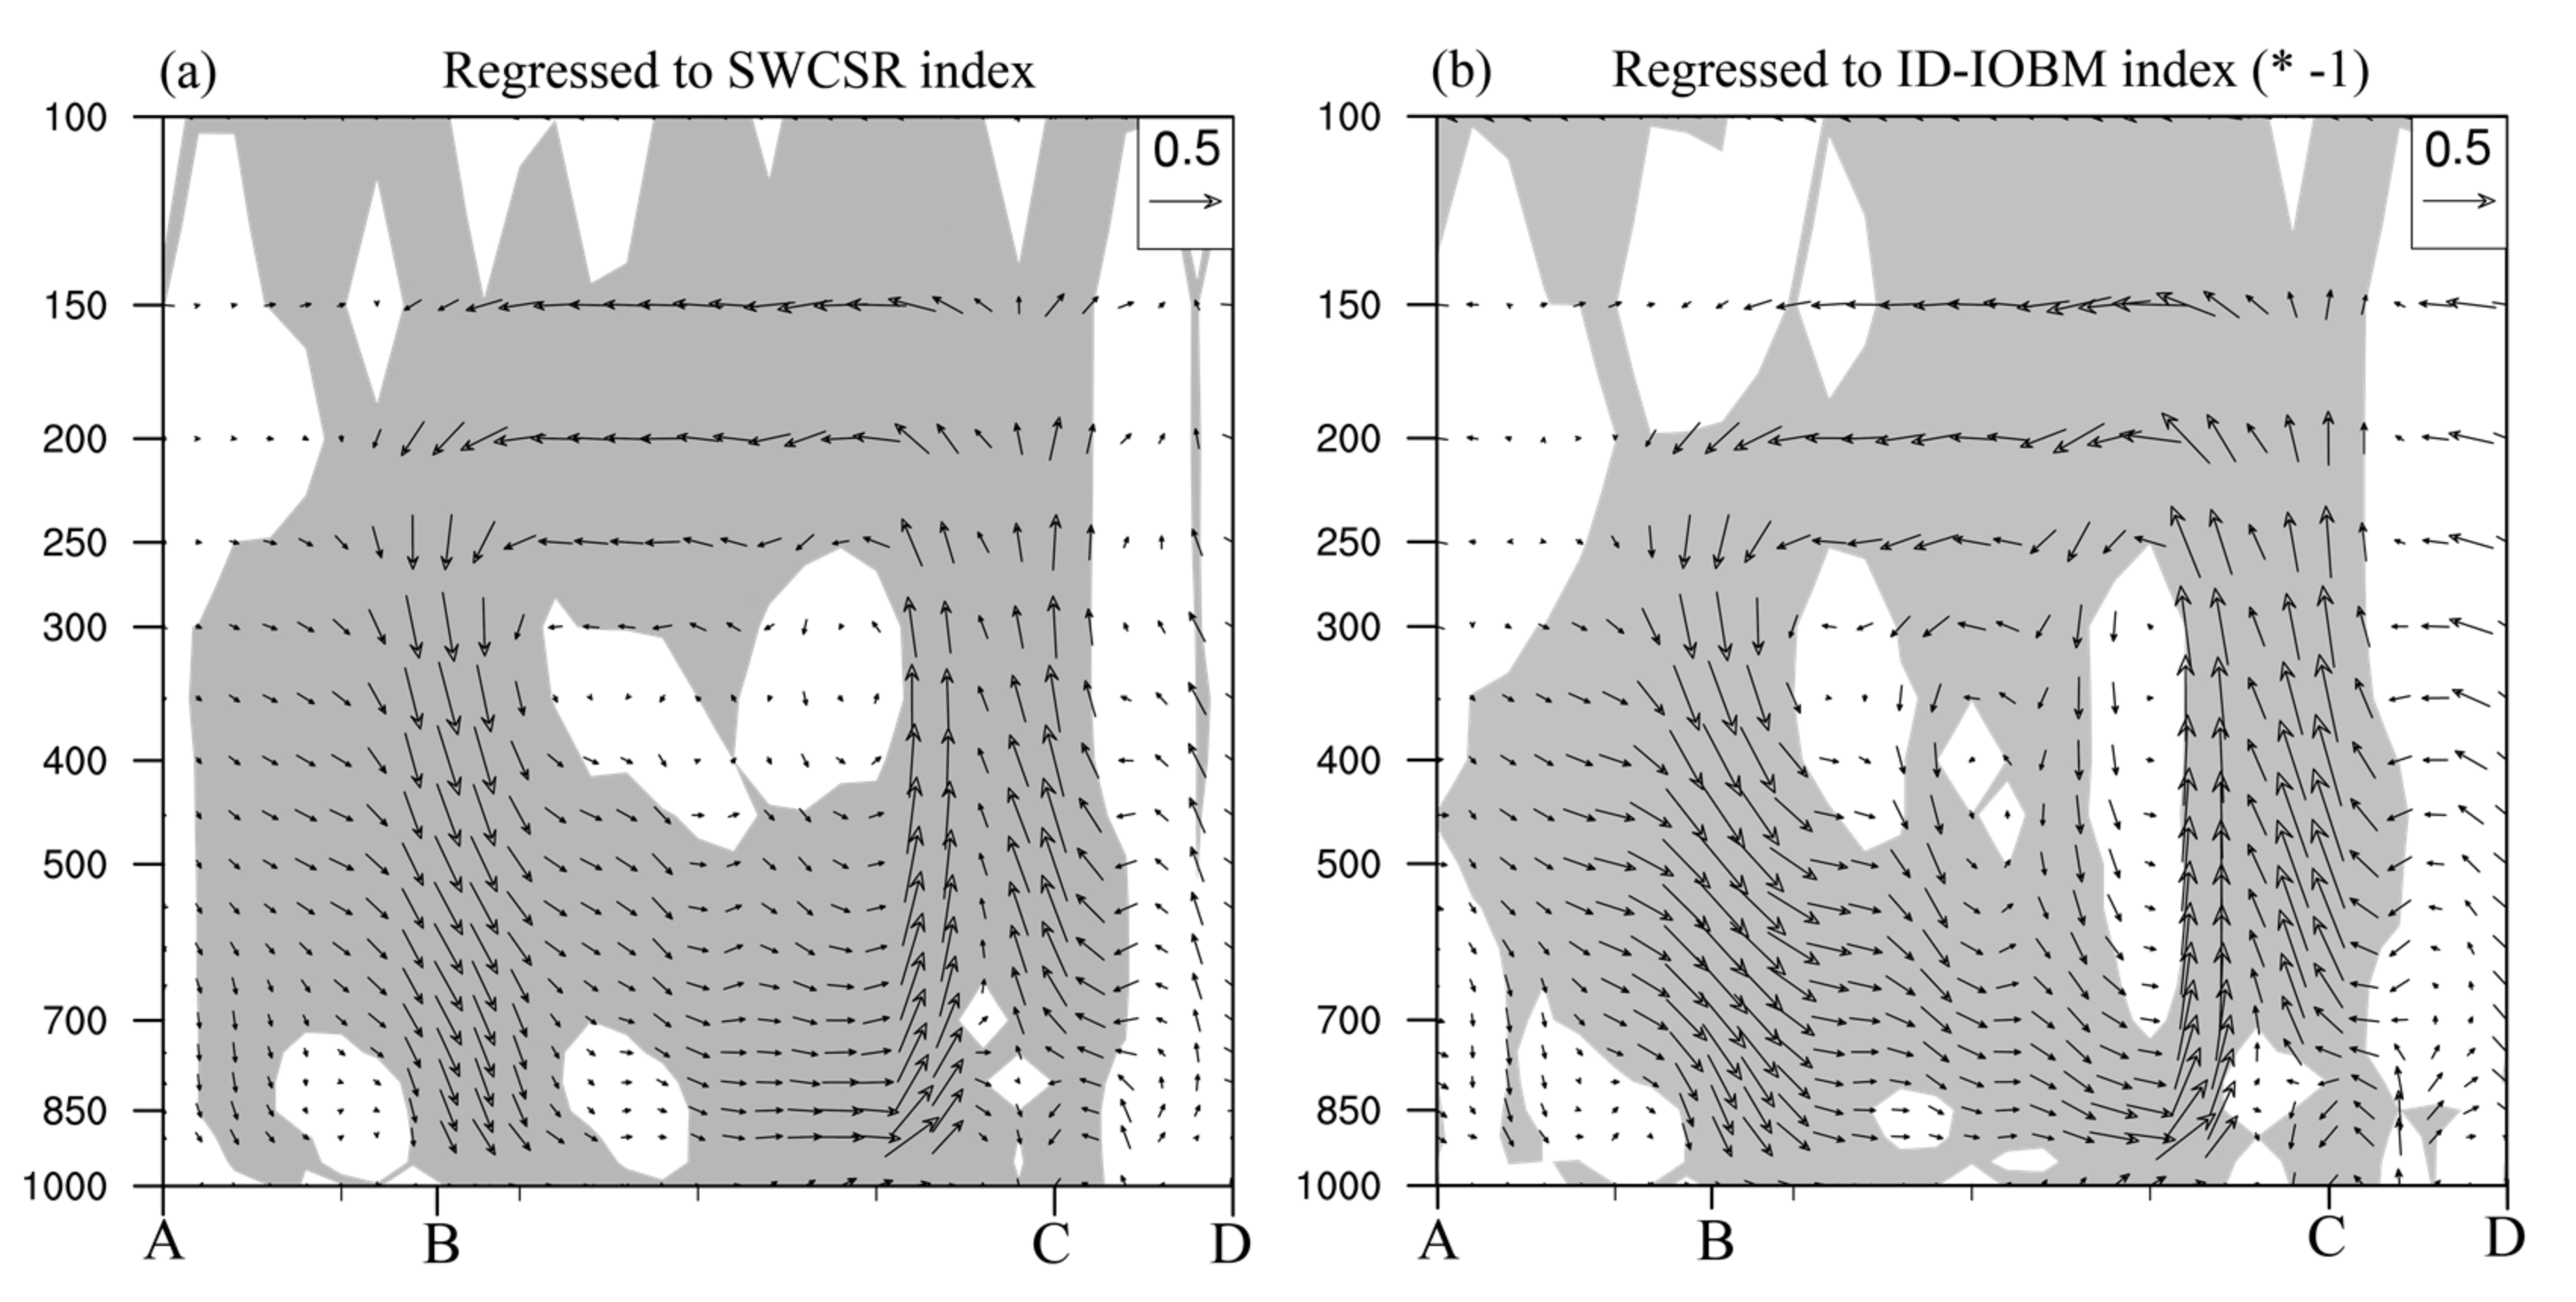
The SWCSR displays apparent drought and flood periods during 1926–2011, which indicates an evident interdecadal signal in the SWCSR. Flood periods were 1944–1971 and 1994–2003, whereas drought periods were 1926–1943, 1972–1993, and 2004–2011. The SWCSR was negatively correlated with the ID-IOBM, which induced the anomalous inter-hemispheric vertical circulation between the tropical IO and the Indo-China peninsula. During the cold phase of the ID-IOBM, an enhanced lower-level divergence and an upper-level convergence occurred over the tropical IO. The corresponding lower-level outflow anomalies from the tropical IO converged over the Indo-China peninsula, corresponding to a lower-level anomalous cyclone that contributed to the increase in the eastward moisture transport from the BOB into SWC. Therefore, the increased moisture transport, and the anomalous ascending motion associated with the inter-hemispheric vertical circulation over SWC, increased SWCSR. In summer during the warm phase of the ID-IOBM, the situation is approximately the same, but with opposite polarity.
After the beginning of 1970s, the impacts of ID-IOD on SWCSR is strengthening. During the warm (cold) phase of the ID-IOD, an anomalous vertical circulation located between the tropical central IOand Indo-China peninsula is in favor of decreased (increased) rainfall in SWC. However, the impacts of ID-IOD on SWCSR is relatively weak before the 1970s, indicating that the ID-IOD is the secondary driver of the interdecadal variability of SWCSR.
The impacts of the ID-IOBM on the circulation anomalies associated with the interdecadal variability of SWCSR were further verified using numerical modeling experiments. The results of the sensitivity experiments showed an apparent anomalous inter-hemispheric circulation response to both the cold and warm phases of the ID-IOBM pattern, though the location of the anomalies over the IO displayed small differences from observations, and the amplitude of the response was somewhat greater than that found in the observations.

Acknowledgments

The authors are grateful to the anonymous reviewers for their insightful comments, which helped improve the quality of this paper. We also acknowledge the supports from the National (Key) Basic Research and Development (973) Program of China (no. 2013CB430203), China Meteorological Special Project (no. GYHY201506013) and the National Key Research Program and Development of China (no. 2017YFC1502302).

Author Contributions

J.L. and W.L. conceived and designed the experiments; J.L. performed the experiments; J.L. and H.-L.R. analyzed the data and wrote this paper; W.L. and J.Z. provided the instructions to this article. All authors have read and approved the final manuscript.

Conflicts of Interest

The authors declare no conflict of interest.

References

  1. Wang, L.; Chen, W.; Zhou, W.; Huang, G. Drought in Southwest China: A review. Atmos. Ocean. Sci. Lett. 2015, 8, 339–344. [Google Scholar] [CrossRef]
  2. Cao, J.; Yao, P.; Wang, L.; Liu, K. Summer rainfall variability in low-latitude highlands of China and subtropical Indian Ocean dipole. J. Clim. 2014, 27, 880–892. [Google Scholar] [CrossRef]
  3. Tao, Y.; Cao, J.; Hu, J.; Dai, Z. A cusp catastrophe model of mid–long-term landslide evolution over low latitude highlands of China. Geomorphology 2013, 187, 80–85. [Google Scholar] [CrossRef]
  4. Yao, S.X.; Huang, Q.; Zhao, C. Variation characteristics of rainfall in the pre-flood season of South China and its correlation with sea surface temperature of Pacific. Atmosphere 2016, 7, 5. [Google Scholar] [CrossRef]
  5. Liu, Y.; Huang, G.; Huang, R.H. Inter-decadal variability of summer rainfall in Eastern China detected by the Lepage test. Theor. Appl. Climatol. 2011, 106, 481–488. [Google Scholar] [CrossRef]
  6. Peng, J.B.; Zhang, Q.Y.; Bueh, C. On the characteristics and possible causes of a severe drought and heat wave in the Sichuan-Chongqing region in 2006. Clim. Environ. Res. 2007, 12, 464–474. [Google Scholar]
  7. Yang, J.; Gong, D.; Wang, W.; Hu, M.; Mao, R. Extreme drought event of 2009/2010 over Southwestern China. Meteorol. Atmos. Phys. 2012, 115, 173–184. [Google Scholar] [CrossRef]
  8. Wang, L.; Chen, W.; Zhou, W.; Huang, G. Understanding and detecting super-extreme droughts in Southwest China through an integrated approach and index. Q. J. R. Meteorol. Soc. 2016, 142, 529–535. [Google Scholar] [CrossRef]
  9. Feng, L.; Li, T.; Yu, W. Cause of severe droughts in Southwest China during 1951–2010. Clim. Dyn. 2014, 43, 2033–2042. [Google Scholar] [CrossRef]
  10. Wang, L.; Chen, W.; Zhou, W.; Huang, G. Teleconnected influence of tropical Northwest Pacific sea surface temperature on interannual variability of autumn precipitation in Southwest China. Clim. Dyn. 2015, 45, 2527–2539. [Google Scholar] [CrossRef]
  11. Wu, R.; Wen, Z.; Yang, S.; Li, Y. An interdecadal change in Southern China summer rainfall around 1992/93. J. Clim. 2010, 23, 2389–2403. [Google Scholar] [CrossRef]
  12. Zhang, H.; Wen, Z.; Wu, R.; Chen, Z.; Guo, Y. Inter-decadal changes in the East Asian summer monsoon and associations with sea surface temperature anomaly in the South Indian Ocean. Clim. Dyn. 2017, 48, 1125–1139. [Google Scholar] [CrossRef]
  13. Schneider, U.; Becker, A.; Finger, P.; Meyer-Christoffer, A.; Rudolf, B.; Ziese, M. GPCC Full Data Reanalysis Version 6.0 at 1.0: Monthly Land-Surface Precipitation from Rain-Gauges Built on GTS-Based and Historic Data; Global Precipitation Climatology Centre: Offenbach, Germany, 2011. [Google Scholar]
  14. Li, Q.X.; Peng, J.; Shen, Y. Development of China homogenized monthly precipitation dataset during 1900–2009. J. Geogr. Sci. 2012, 22, 579–593. [Google Scholar] [CrossRef]
  15. Rayner, N.; Parker, D.E.; Horton, E.; Folland, C.; Alexander, L.; Rowell, D.; Kent, E.; Kaplan, A. Global analyses of sea surface temperature, sea ice, and night marine air temperature since the late nineteenth century. J. Geophys. Res. Atmos. 2003, 108. [Google Scholar] [CrossRef] [Green Version]
  16. Compo, G.P.; Whitaker, J.S.; Sardeshmukh, P.D.; Matsui, N.; Allan, R.J.; Yin, X.; Gleason, B.E.; Vose, R.; Rutledge, G.; Bessemoulin, P. The twentieth century reanalysis project. Q. J. R. Meteorol. Soc. 2011, 137, 1–28. [Google Scholar] [CrossRef]
  17. Dai, A. The influence of the inter-decadal Pacific oscillation on US precipitation during 1923–2010. Clim. Dyn. 2013, 41, 633–646. [Google Scholar] [CrossRef]
  18. Duchon, C.E. Lanczos filtering in one and two dimensions. J. Appl. Meteorol. 1979, 18, 1016–1022. [Google Scholar] [CrossRef]
  19. Livezey, R.E.; Chen, W. Statistical field significance and its determination by Monte Carlo techniques. Mon. Weather Rev. 1983, 111, 46–59. [Google Scholar] [CrossRef]
  20. Li, W.J.; Ren, H.C.; Zuo, J.Q.; Ren, H.L. Early summer Southern China rainfall variability and its oceanic drivers. Clim. Dyn. 2017, 1–15. [Google Scholar] [CrossRef]
  21. Ding, Y.; Wang, Z.; Sun, Y. Inter-decadal variation of the summer precipitation in East China and its association with decreasing Asian summer monsoon. Part I: Observed evidences. Int. J. Climatol. 2008, 28, 1139–1161. [Google Scholar] [CrossRef]
  22. Si, D.; Ding, Y. Oceanic forcings of the interdecadal variability in East Asian summer rainfall. J. Clim. 2016, 29, 7633–7649. [Google Scholar] [CrossRef]
  23. Yang, J.; Liu, Q.; Xie, S.P.; Liu, Z.; Wu, L. Impact of the Indian Ocean SST basin mode on the Asian summer monsoon. Geophys. Res. Lett. 2007, 34. [Google Scholar] [CrossRef]
  24. Yang, J.; Liu, Q.; Liu, Z.; Wu, L.; Huang, F. Basin mode of Indian Ocean sea surface temperature and Northern Hemisphere circumglobal teleconnection. Geophys. Res. Lett. 2009, 36. [Google Scholar] [CrossRef]
  25. Xu, Z.; Fan, K.; Wang, H. Decadal variation of summer precipitation over China and associated atmospheric circulation after the late 1990s. J. Clim. 2015, 28, 4086–4106. [Google Scholar] [CrossRef]
  26. Zhu, Y.; Wang, H.J.; Zhou, W.; Ma, J.H. Recent changes in the summer precipitation pattern in East China and the background circulation. Clim. Dyn. 2011, 36, 1463–1473. [Google Scholar] [CrossRef]
  27. Krishnamurthy, V.; Goswami, B.N. Indian monsoon-ENSO relationship on interdecadal timescale. J. Clim. 2000, 13, 579–595. [Google Scholar] [CrossRef]
  28. Saji, N.H.; Goswami, B.N.; Vinayachandran, P.N.; Yamagata, T. A dipole mode in the tropical Indian Ocean. Nature 1999, 401, 360–363. [Google Scholar] [CrossRef] [PubMed]
  29. Wu, R.G.; Yeh, S.W. A further study of the tropical Indian Ocean asymmetric mode in boreal spring. Subtropical SST dipole events in the southern Indian Ocean. J. Geophys. Res. 2010, 115, D08101. [Google Scholar] [CrossRef]
  30. Behera, S.K.; Yamagata, T. Subtropical SST dipole events in the southern Indian Ocean. Geophys. Res. Lett. 2001, 28, 327–330. [Google Scholar] [CrossRef]
  31. Liu, J.; Ren, H.; Li, W.; Zuo, J. Diagnosing the leading mode of interdecadal covariability between the Indian Ocean sea surface temperature and summer precipitation in Southern China. Theor. Appl. Climatol. 2018. [Google Scholar] [CrossRef]
Figure 1. Climatological mean of summer precipitation (contour; mm day−1) for the period of 1921–2016 and the terrain (shading; m) of Southwestern China. The rectangle denotes the studied region for Southwestern China.
Atmosphere 09 00103 g001
Figure 2. Longitude-time cross-section of the anomalous Southwestern China summer rainfall (SWCSR) for the period of 1926 to 2011 averaged between 23° N and 30° N using the Global Rainfall Climatology Centre (GPCC) datasets. An 11-year filter was applied. Dashed lines denote the transition years between drought and flood periods.
Atmosphere 09 00103 g002
Figure 3. (a) Correlation coefficients between sea surface temperature anomalies and the SWCSR index. Black dots indicate areas significant at the 95% confidence level. The rectangle denotes the studied region for Indian Ocean; (b) the SWCSR index (lines) and the interdecadal Indian Ocean basin mode (ID-IOBM) index (red bars). Blue (black) line denotes the SWCSR index derived from the National Meteorological Information Center (NMIC) (GPCC) data. ** and *** indicate correlation coefficients significant at the 95% and 99% confidence level, respectively.
Atmosphere 09 00103 g003
Figure 4. Stream function (STRF, shading; 106 m2/s) regressed against the SWCSR index and the ID-IOBM index at (a,b) 200 hPa and (c,d) 500 hPa; and (e,f) regressed STRF (shading; 106 m2/s) and wind field (vectors; m/s) anomalies at 850 hPa in June, July, and August (JJA). “*” denotes “multiply by”. Black dots denote areas significant at the 95% confidence level.
Atmosphere 09 00103 g004
Figure 5. Regressed divergent winds (vectors; m/s) and velocity potentials (shading; 106 m2/s) at (a,b) 200 hPa and (c,d) 850 hPa against (a,c) the SWCSR index and (b,d) the ID-IOBM index. Line ABCD in (a) is the location for slice in height analysis hereafter. The rectangles indicate Southwestern China. “*” denotes “multiply by”. Black dots denote areas significant at the 95% confidence level.
Atmosphere 09 00103 g005
Figure 6. Regressed vertical circulation against (a) the SWCSR index and (b) the ID-IOBM index along line ABCD (m/s, vertical speeds are multiplied by 50 for visual clarity). “*” denotes “multiply by”. Shading indicates the areas significant at the 90% confidence level.
Atmosphere 09 00103 g006
Figure 7. The SSTA specified in (a) the cold phase of the ID-IOBM (CIO) run and (b) the warm phase of the ID-IOBM (WIO) run; divergent winds (vectors; m/s) and velocity potentials (shading; 106 m2/s) responses to (c,e) the CIO run and (d,f) the WIO run in JJA. The rectangle indicates Southwestern China. Black dots denote areas significant at the 95% confidence level.
Atmosphere 09 00103 g007
Figure 8. (a) Correlation coefficients between the IO SSTA and the SWCSR index. The average SSTA in the Indian Ocean were removed from SSTA before calculation. The rectangles indicate the key region used to calculate the ID-IOD index. Black dots indicate areas significant at the 95% confidence level; (b) the SWCSR index (blue line) and the interdecadal Indian Ocean dipole (ID-IOD) index (red bars). The green line denotes the transition year after which the amplitude of ID-IOBM is gradually decreasing. The correlation coefficient between the SWCSR index and the ID-IOD index is −0.51 (r = −0.51, not significant) for the period of 1926–1972 and is −0.67 (r = −0.67, significant at the 90% confidence level) for the period of 1973–2011.
Atmosphere 09 00103 g008
Figure 9. (a) Regressions of SSTA (shading; °C) and wind anomalies (vectors; m/s) against the ID-IOD index at 850 hPa in JJA for the period of 1926–2009. Line ABCD is the location for slice in height analysis hereafter. Black dots indicate areas significant at the 95% confidence level; (b) regressed vertical circulation against the ID-IOD index along line ABCD (m/s, vertical speeds are multiplied by 50 for visual clarity). Shading indicates the areas significant at the 90% confidence level.
Atmosphere 09 00103 g009

