1. Introduction
Atmospheric blocking is one of the most dramatic phenomena of large-scale circulation in the middle troposphere at mid and high latitudes [
1,
2]. One of the basic conditions when detecting a blocking is, according to D. F. Rex, the westerly jet separation into two branches enveloping the blocking region [
3]. At present, it is also accepted that a necessary blocking component is the presence of a large-amplitude equivalent-barotropic anticyclone [
4]. Depending on the pressure field configuration, there are two main types of blockings [
4]: monopole and dipole. A monopole blocking (Omega-blocking, Ω) represents an intensified high pressure ridge, at whose basis, there are two atmospheric troughs on either side. A dipole blocking (Rex-blocking) resembles the numeral “8”, and comprises a blocking anticyclone and a cyclone, in the northern and in the southern parts of the blocking, respectively (in the Northern Hemisphere). During blocking events, the westerly flow and the eastward displacement of the weather systems are interrupted. The temperature and precipitation, as well as the air composition, change significantly [
1,
2,
4,
5,
6]. Thereby, blockings essentially affect the weather conditions both in the blocking region and in the adjacent one. The blocking lifetime varies from several days to several weeks, and, therefore, blockings may be responsible for various extreme weather phenomena, such as long-term droughts and frosts. In the paper of Mokhov and Semenov [
2], a close relation between extremely cold winters and atmospheric blocking events during the first decade of the 21st century was revealed.
Western Siberia is not a region with a high atmospheric blocking frequency. Nevertheless, even at low frequency, atmospheric blockings may affect weather and living conditions of people there. Therefore, there is an essential necessity for more detailed investigations into the variability of blocking events in the region. In this paper, we investigate wintertime blocking events identified over Western Siberia (60° E–90° E) and their relation with the surface temperature in this region over the period 2004 through 2016. We define wintertime as the time interval from 1 November to 1 March.
2. Data and Methods
We use four times daily (at 0000, 0600, 1200, and 1800 UTC) data from the ECMWF ERA-Interim (1979–2016) [
7]. Daily averages were computed for data.
We use a blocking index algorithm as in Cheung et al. [
5]. According to Antokhina et al. [
8], this criterion is optimal for autodetecting blockings in Western Siberia:
where
Z is the 500 hPa geopotential height,
ϕn = 80 N ± Δ,
ϕ0 = 60 N ± Δ,
ϕs = 40 N ± Δ, Δ = −5°, −2.5°, 0°, 2.5° or 5°. GHGN and GHGS are the 500 hPa geopotential height gradients (GHG) north and south of latitude
ϕ0, respectively.
This algorithm is based on the criterion GHGS proposed in Austin [
9] and in Lejenäs and Økland [
10]. The criterion was subsequently supplemented by [
11], which imposed the GHGN gradient to exclude cutoff lows displaced poleward. Tibaldi and Molteni [
11] set the northern, southern and
ϕ0 points as 80 N, 40 N, and 60 N, respectively, whereas Barriopedro et al. [
12] used the five values of delta as given above, instead of only −4°, 0° and 4°, as suggested by Tibaldi and Molteni [
11].
The situation in which GHGS > 0, GHGN < −10 m/deg lat is referred to as blocking. A longitude is considered blocked when both GHGN and GHGS satisfy these conditions for at least one of the five Δ values, while the ϕ0 height anomaly is simultaneously positive.
We calculated the blocking event frequency as a percentage. The product of days in a wintertime (t = 120 or 121) and the number of grid points (l = 13) within the 60° E–90° E range at the 2.5° grid step was taken as 100% (the greatest possible number of realizations). The frequency was calculated as the ratio of the total of the blocking days (with 5-day and longer blockings) to the greatest possible number of realizations.
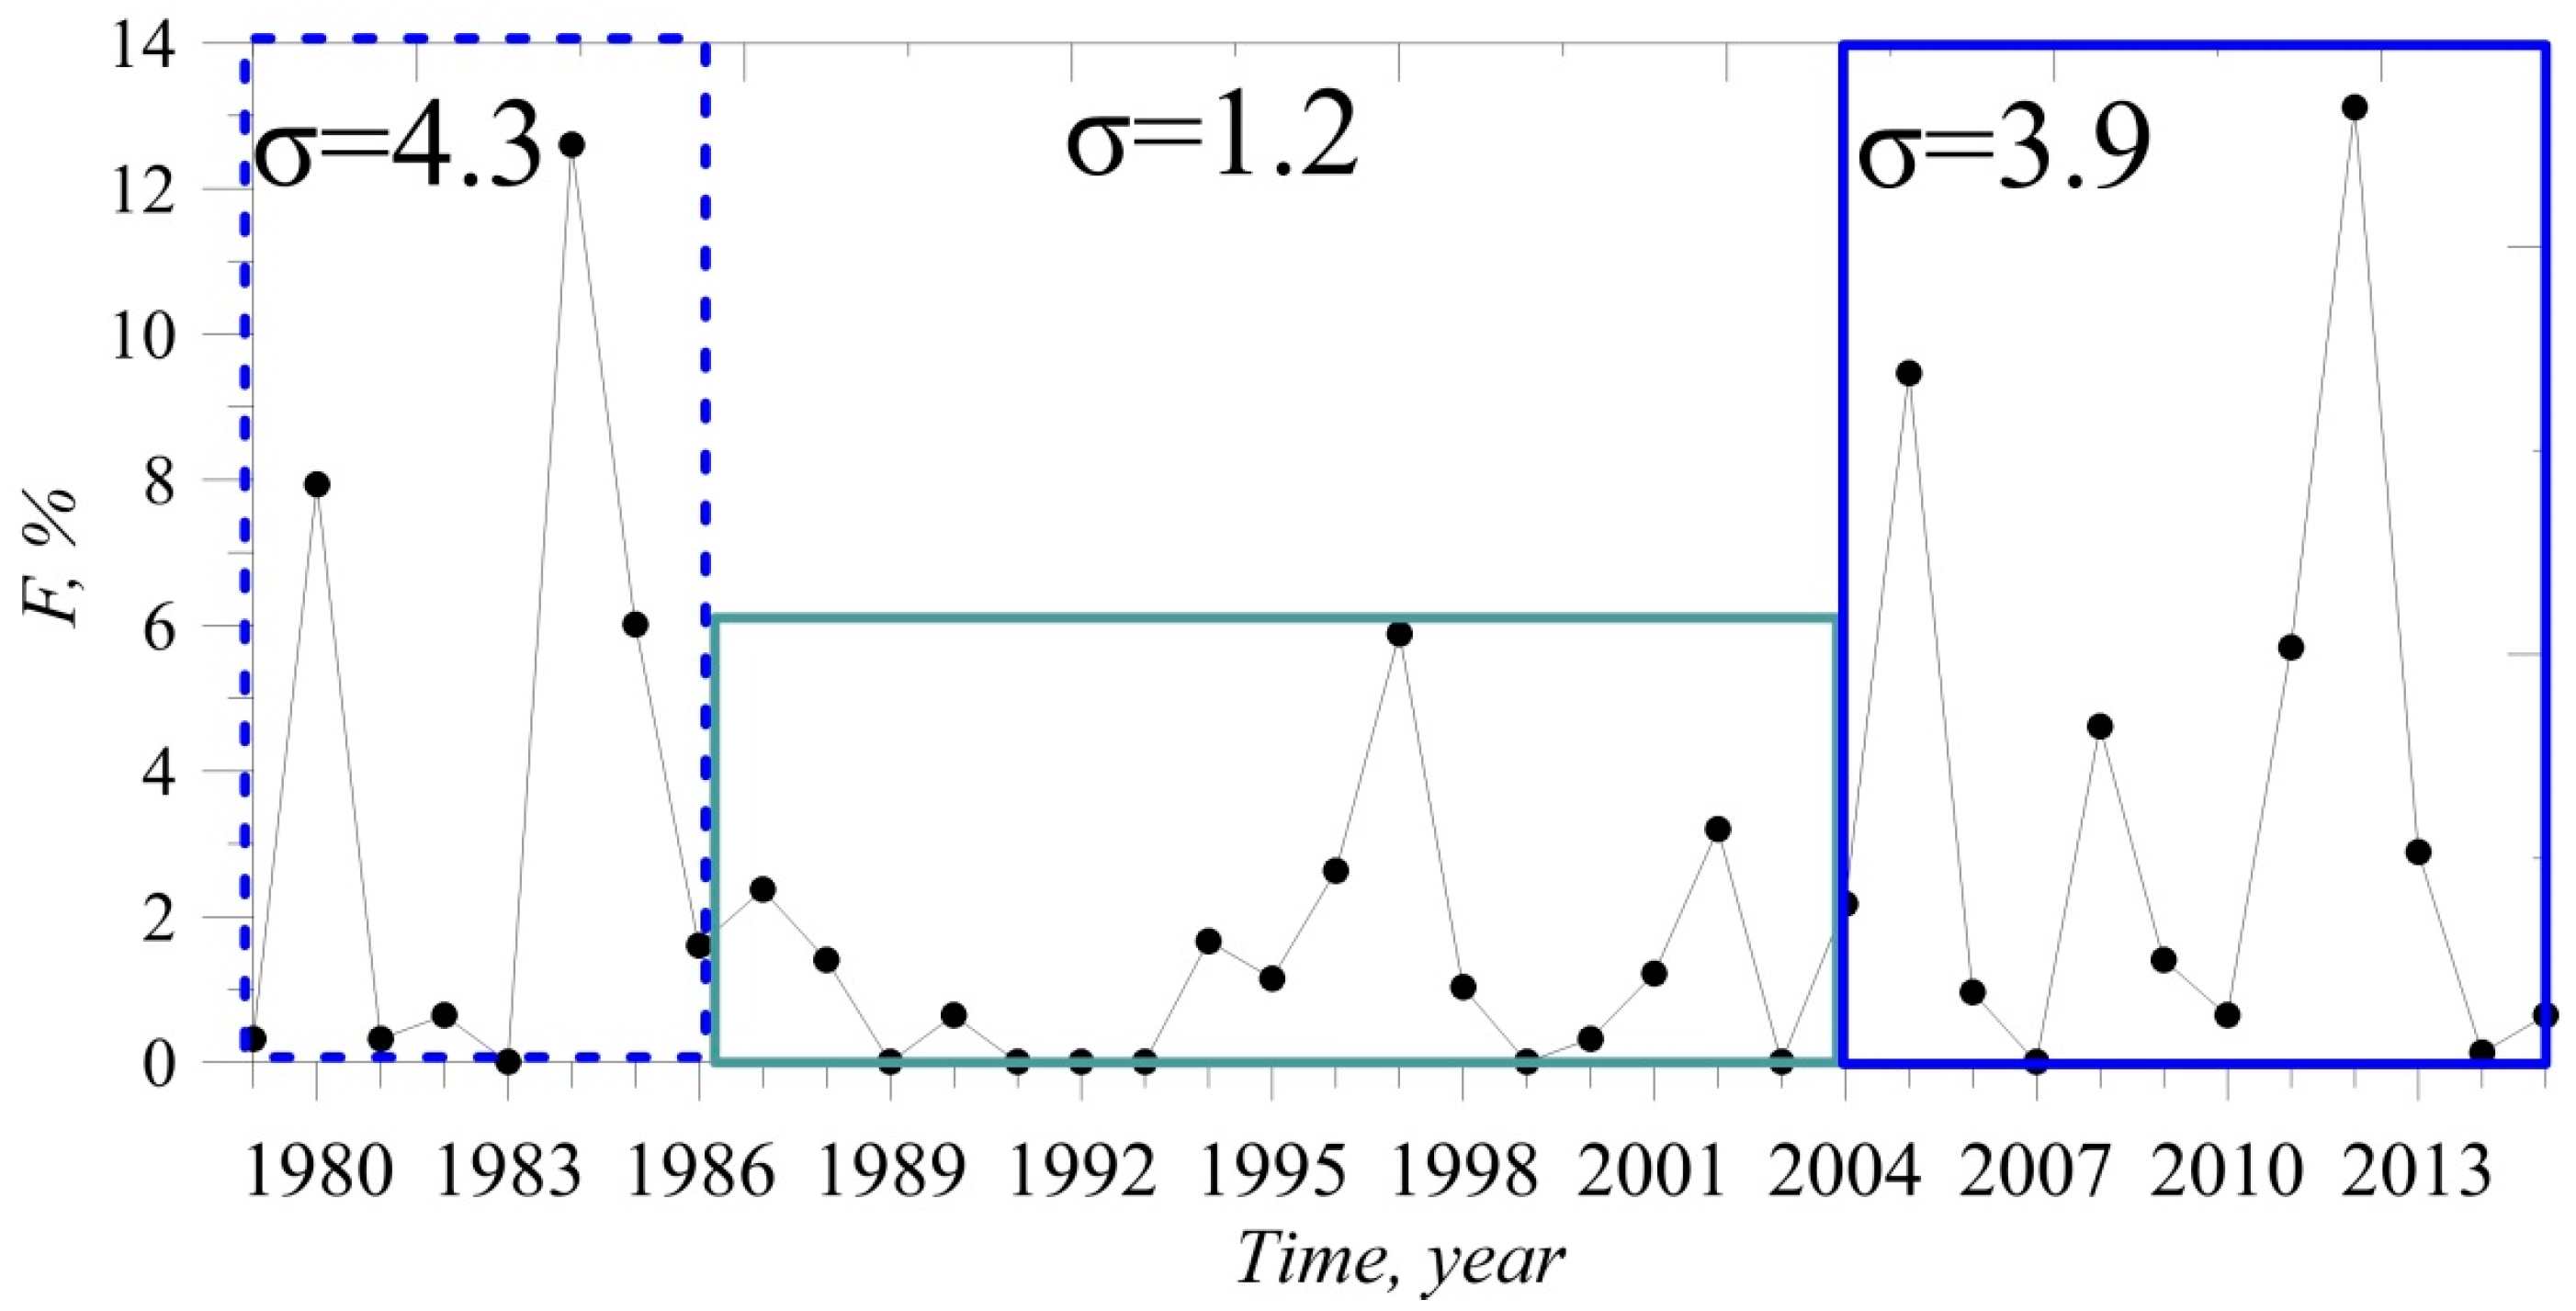
Figure 1 shows interannual time-series of the wintertime blocking event frequency over Western Siberia for 1979–2016. We see that since 2004, the amplitude of inter-annual variations in the winter blocking frequency over Western Siberia has notably increased as compared with that of the previous decade. Standard deviation for 1989–2003 is 1.2; and for 2004–2016, 3.9. In this paper, we investigate winter blocking events and their driving the surface temperature in this region during the period 2004 through 2016. When choosing the study period, we also rely on information from Mokhov et al. [
13], which refers to an increase in the duration of NH blockings since 2004.
We investigate blocking events with a 5-day (or more) duration during wintertime (1 November through 1 March). We assume that 5 “unblocked” days should lie between the events identified as two events. There are 14 blocking events: December 2004, January–February 2005, December 2005, November 2006 (two events), January 2008, December 2008, December 2010–January 2011, January 2011, February 2011, December 2011, January–February 2012, December 2012, December 2015–January 2016. So, we studied 12 winters. Only three winters (of 12) had no blocking events (2009/2010, 2013/2014, and 2014/2015) over Western Siberia. Four winters featured a high blocking frequency: 2004/2005 (2 events), 2006/2007 (2), 2010/2011 (3), 2011/2012 (2). Five winters had one event each: 2005/2006, 2007/2008, 2008/2009, 2012/2013, 2015/2016.
During each of the 14 blocking events, we calculated the surface temperature anomalies over the southern and northern parts of Western Siberia. The anomalies were calculated as deviations of the daily surface temperature values from the daily value averaged over 1979–2016.
To estimate the advective factor, we analyzed the data on the potential temperature at the dynamic tropopause (PV2-θ) [
4,
7] for each of the 14 events.
3. Results
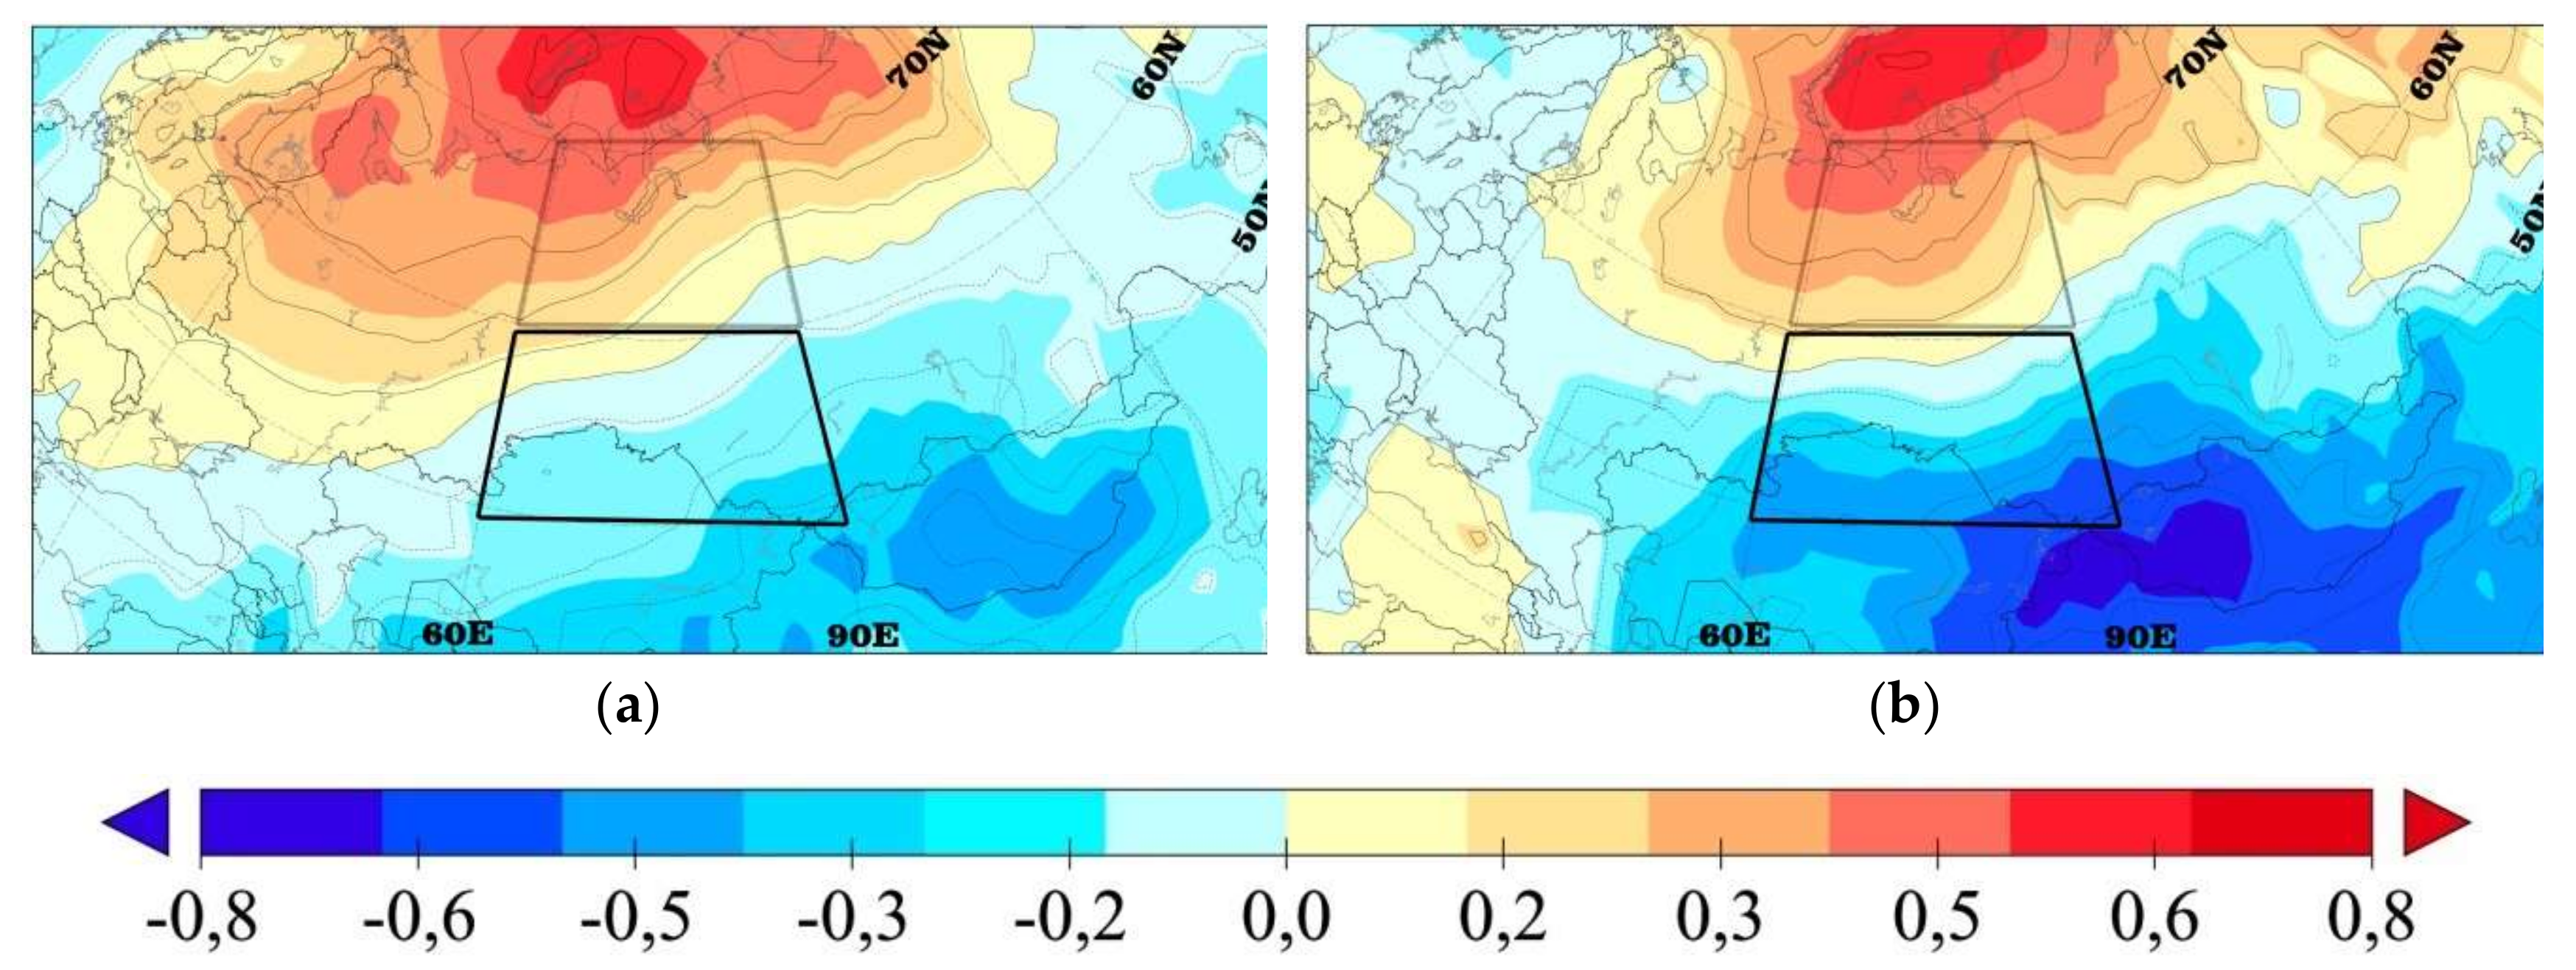
Figure 2 demonstrates correlation maps between the blocking frequency over Western Siberia and the surface temperature at the grid points for November–December (
Figure 2a) and January–February (
Figure 2b). The blockings detected over Western Siberia determine the temperature anomalies over a large territory considerably exceeding the size of the region. One can see that the correlation field over Western Siberia has a dipole pattern. In the north of the region, an increase in the surface temperature corresponds to the increase in the blocking frequency, whereas in the south, the surface temperature decrease corresponds to the increase in the blocking frequency. The solid and the dashed curves outline the southern part of Western Siberia (60° E–90° E; 50° N–60° N) and the northern part of Western Siberia (60° E–90° E; 60° N–70° N), respectively.
Figure 2 shows only the most general features. Addressing now blocking events and the variations in the surface temperature accompanying them more closely, we expect to see specific features of evolution of these circulation processes and to realize how blockings may affect the surface temperature. We hope that studying separate events will help us see how this occurs. Additionally, the features revealed and described in this paper could further be used to evaluate Western Siberian blocking dynamics in model simulations of different (e.g., future) climate regimes.
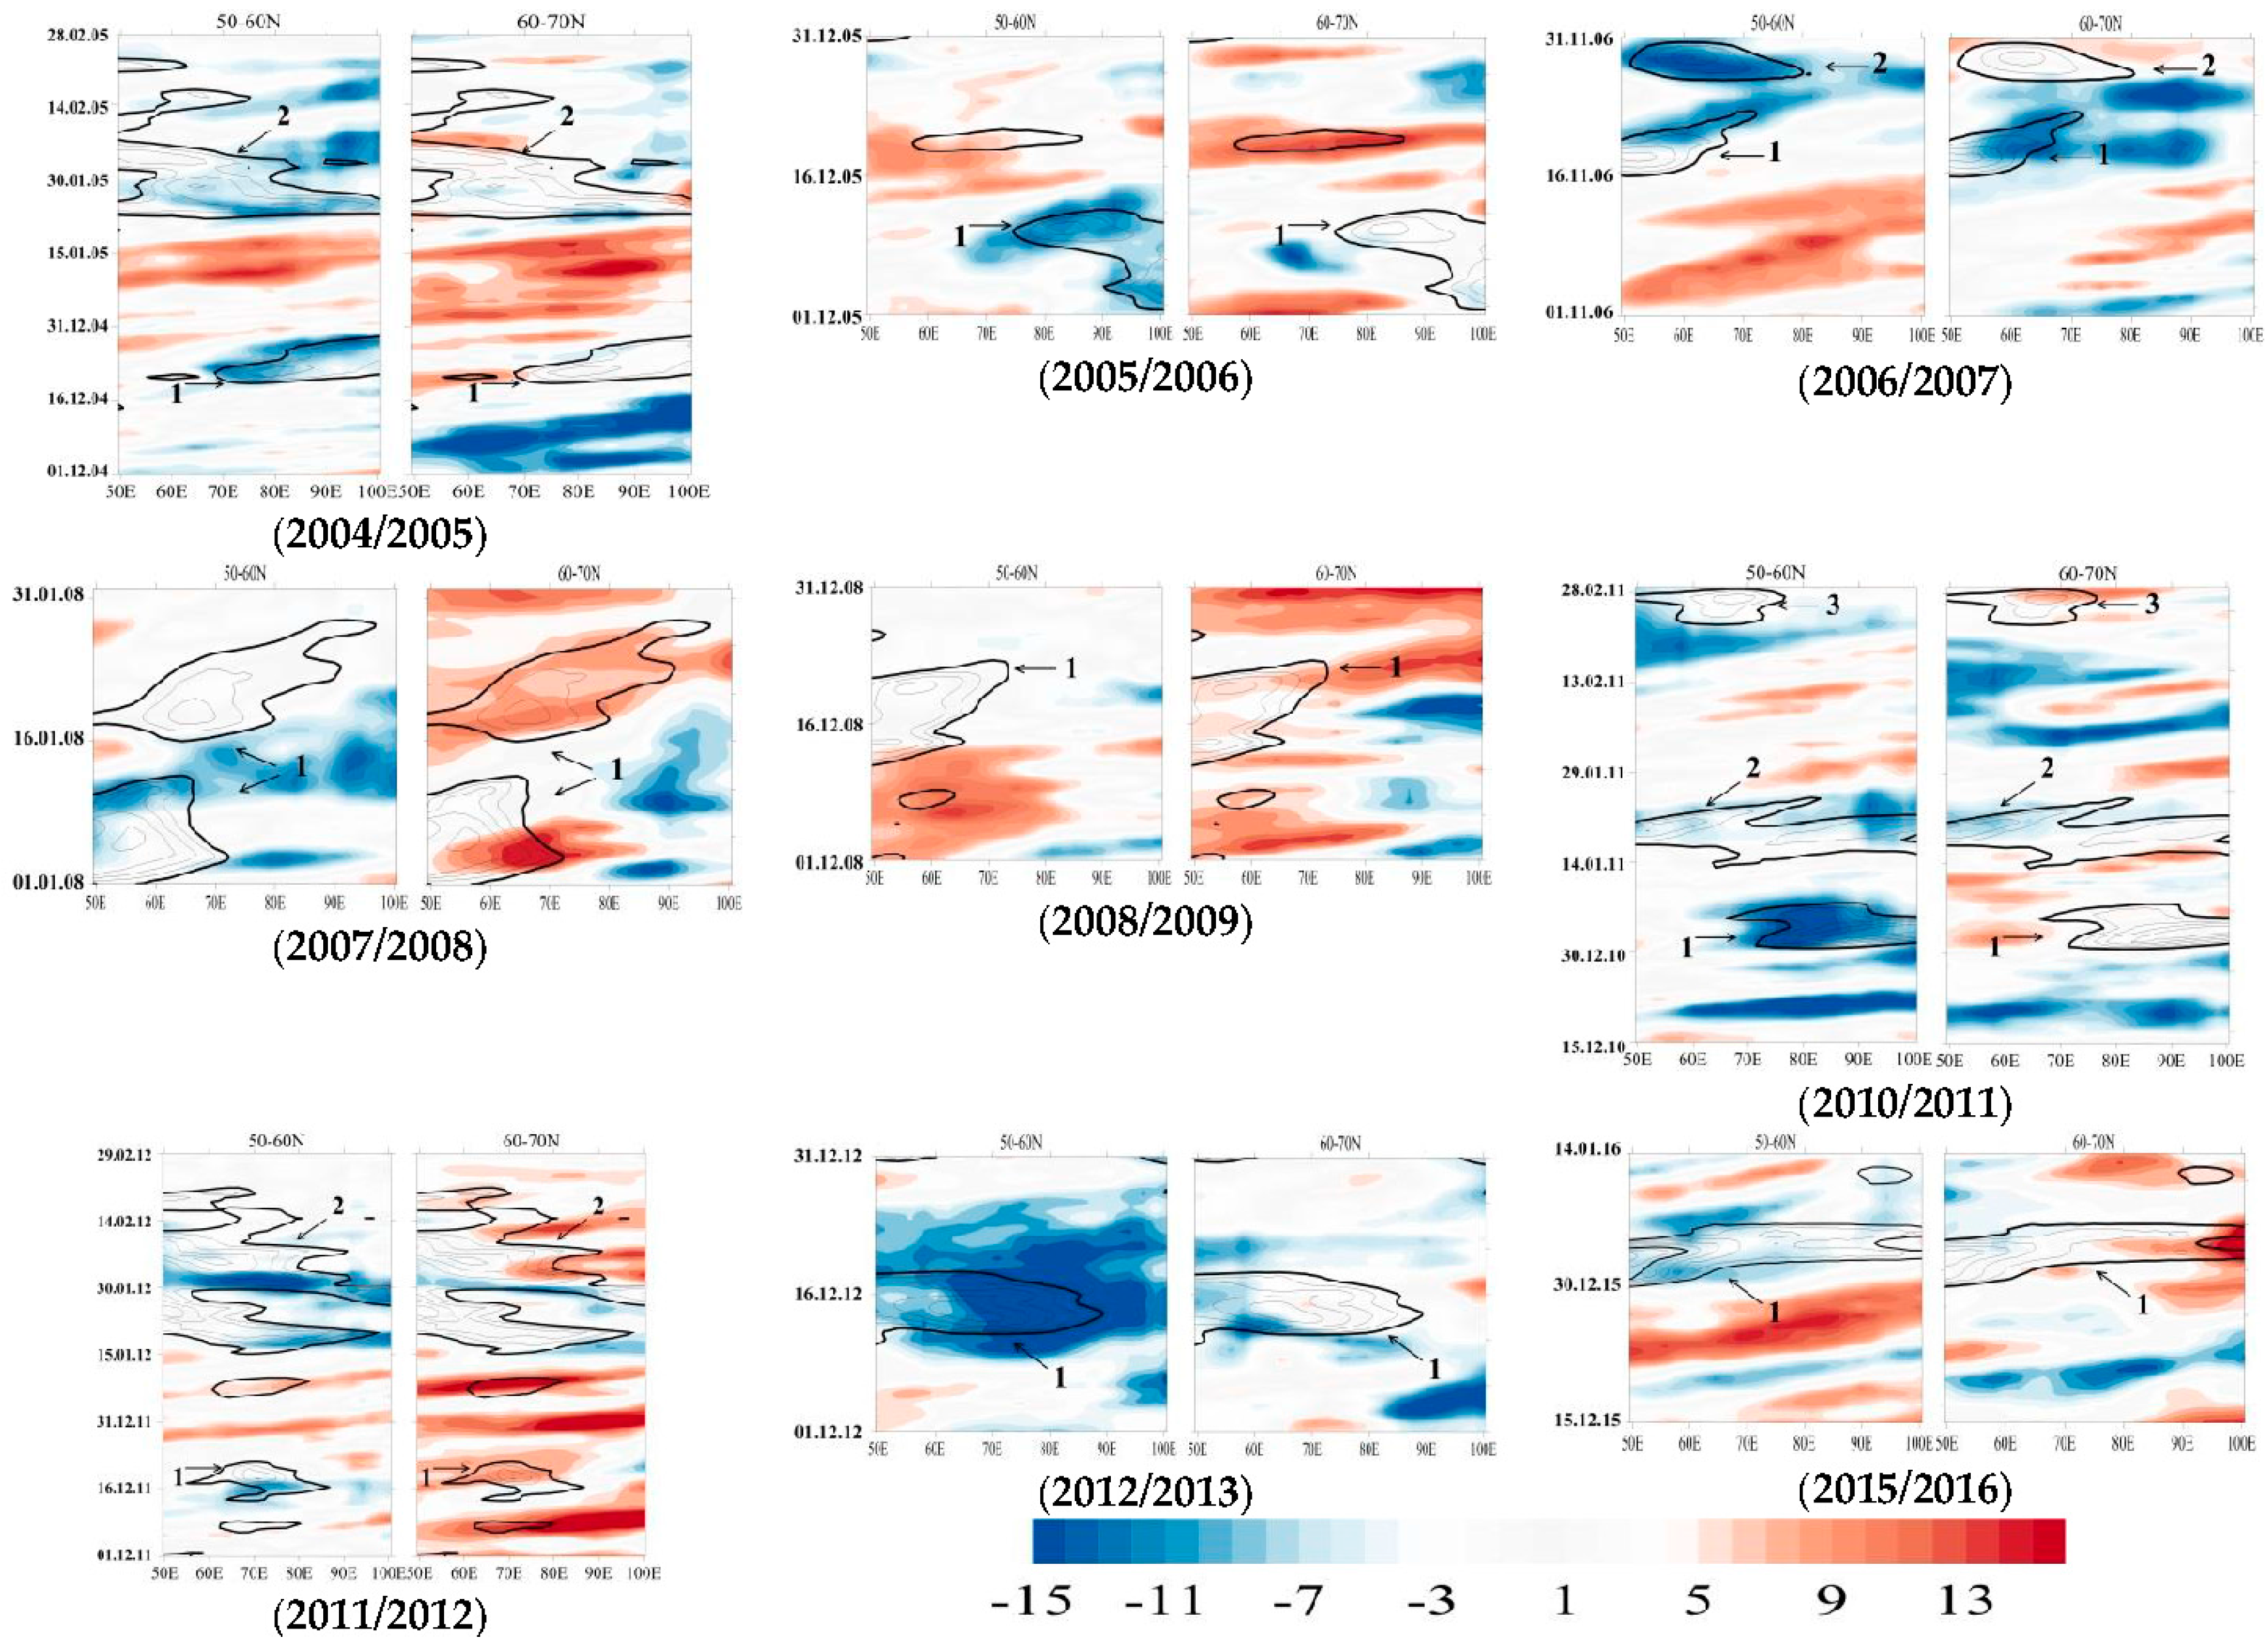
Figure 3 shows nine time-longitude cross sections of the surface temperature anomalies for 14 winter blocking events over Western Siberia. The calculations were carried out separately for the southern part of Western Siberia (left panels) and the northern part of Western Siberia (right panels). Negative surface temperature anomalies in the south of Western Siberia during blockings were detected in 12 cases of 14. During two blocking events, the temperature anomaly in the south of the region are close to the norm (event 2008/2009; the third blocking within 2010/2011). Thus, the temperature anomalies in the south of Western Siberia accompanying these blockings are negative or close to norm.
Positive surface temperature anomalies in the north of Western Siberia during blockings were detected in six cases out of 14. Those were 2007/2008, both 2008/2009 blockings, the third blocking within 2010/2011, the first blocking within 2011/2012, and the event in 2015/2016). For five events in the north (both 2004/2005 and 2005/2006 events, the second blocking within 2006/2007, and the first blocking within 2010/2011) temperature anomalies were close to the norm. During four blocking events, the temperature anomalies in the north of the region differ from the expected warming. During the second blocking within 2010/2011, in the west of the region’s northern part, a negative temperature anomaly was detected, whereas, in the east, there were values close to the norm. During the second blocking within 2011/2012 (unprecedentedly long), the temperature anomalies in the north of the region had changed their sign several times. Negative temperature anomalies in the north corresponded to two blockings (the first blocking within 2006/2007 and the 2012/2013 event). Thus, the analysis results for the temperature anomalies accompanying the blockings are less unambiguous in the north of the region. Nevertheless, in most cases (10 of 14), the surface temperature in the north of the region either grows or does not change during the blocking events.
Based on the complex analysis of the diagrams in
Figure 3, we divide the distributions of the surface temperature anomalies into two groups:
Group 1. Western Siberia dipole that had a similarity with the correlation pattern in
Figure 2. This includes 10 events. Of them, three were with positive temperature anomalies in the north and negative in the south (event 2007/2008, the first blocking within 2011/2012, event 2015/2016). Four events were with close-to-norm temperature anomalies in the north and the negative anomalies in the south (both 2004/2005 blockings, 2005/2006, the second blocking within 2006/2007, the first blocking within 2010/2011). Two events were with positive temperature anomalies in the north and close-to-norm temperature anomalies in the south (event 2008/2009, the third blocking within 2010/2011).
Group 2. “Non-dipole” situations. To the latter, we related 4 events described above and caused by the surface temperature anomalies in the region’s north, which were different from the expected ones. Those were: the first blocking within 2006/2007 and the event within 2012/2013 (negative temperature anomaly in the north); the second blocking in 2010/2011 (temperature anomalies have different signs in the west and in the east of the region’s northern part), and the second blocking of 2011/2012 (temperature anomalies in the north changed their sign during the blocking).
Let us reveal what drove the surface temperature anomalies that we detected during blocking events over Western Siberia. A blocking is a dynamic phenomenon. Therefore, it seems obvious that dynamic, advective factors should play the main role in surface temperature variations. For the advection analysis, we used the potential temperature at the dynamic tropopause (PV2-θ) [
4,
14,
15]. The dynamic tropopause, with some assumptions [
15], may be considered a quasi-material surface along which air masses are transported. Therefore, the PV2-θ is a convenient characteristic for analyzing their origin [
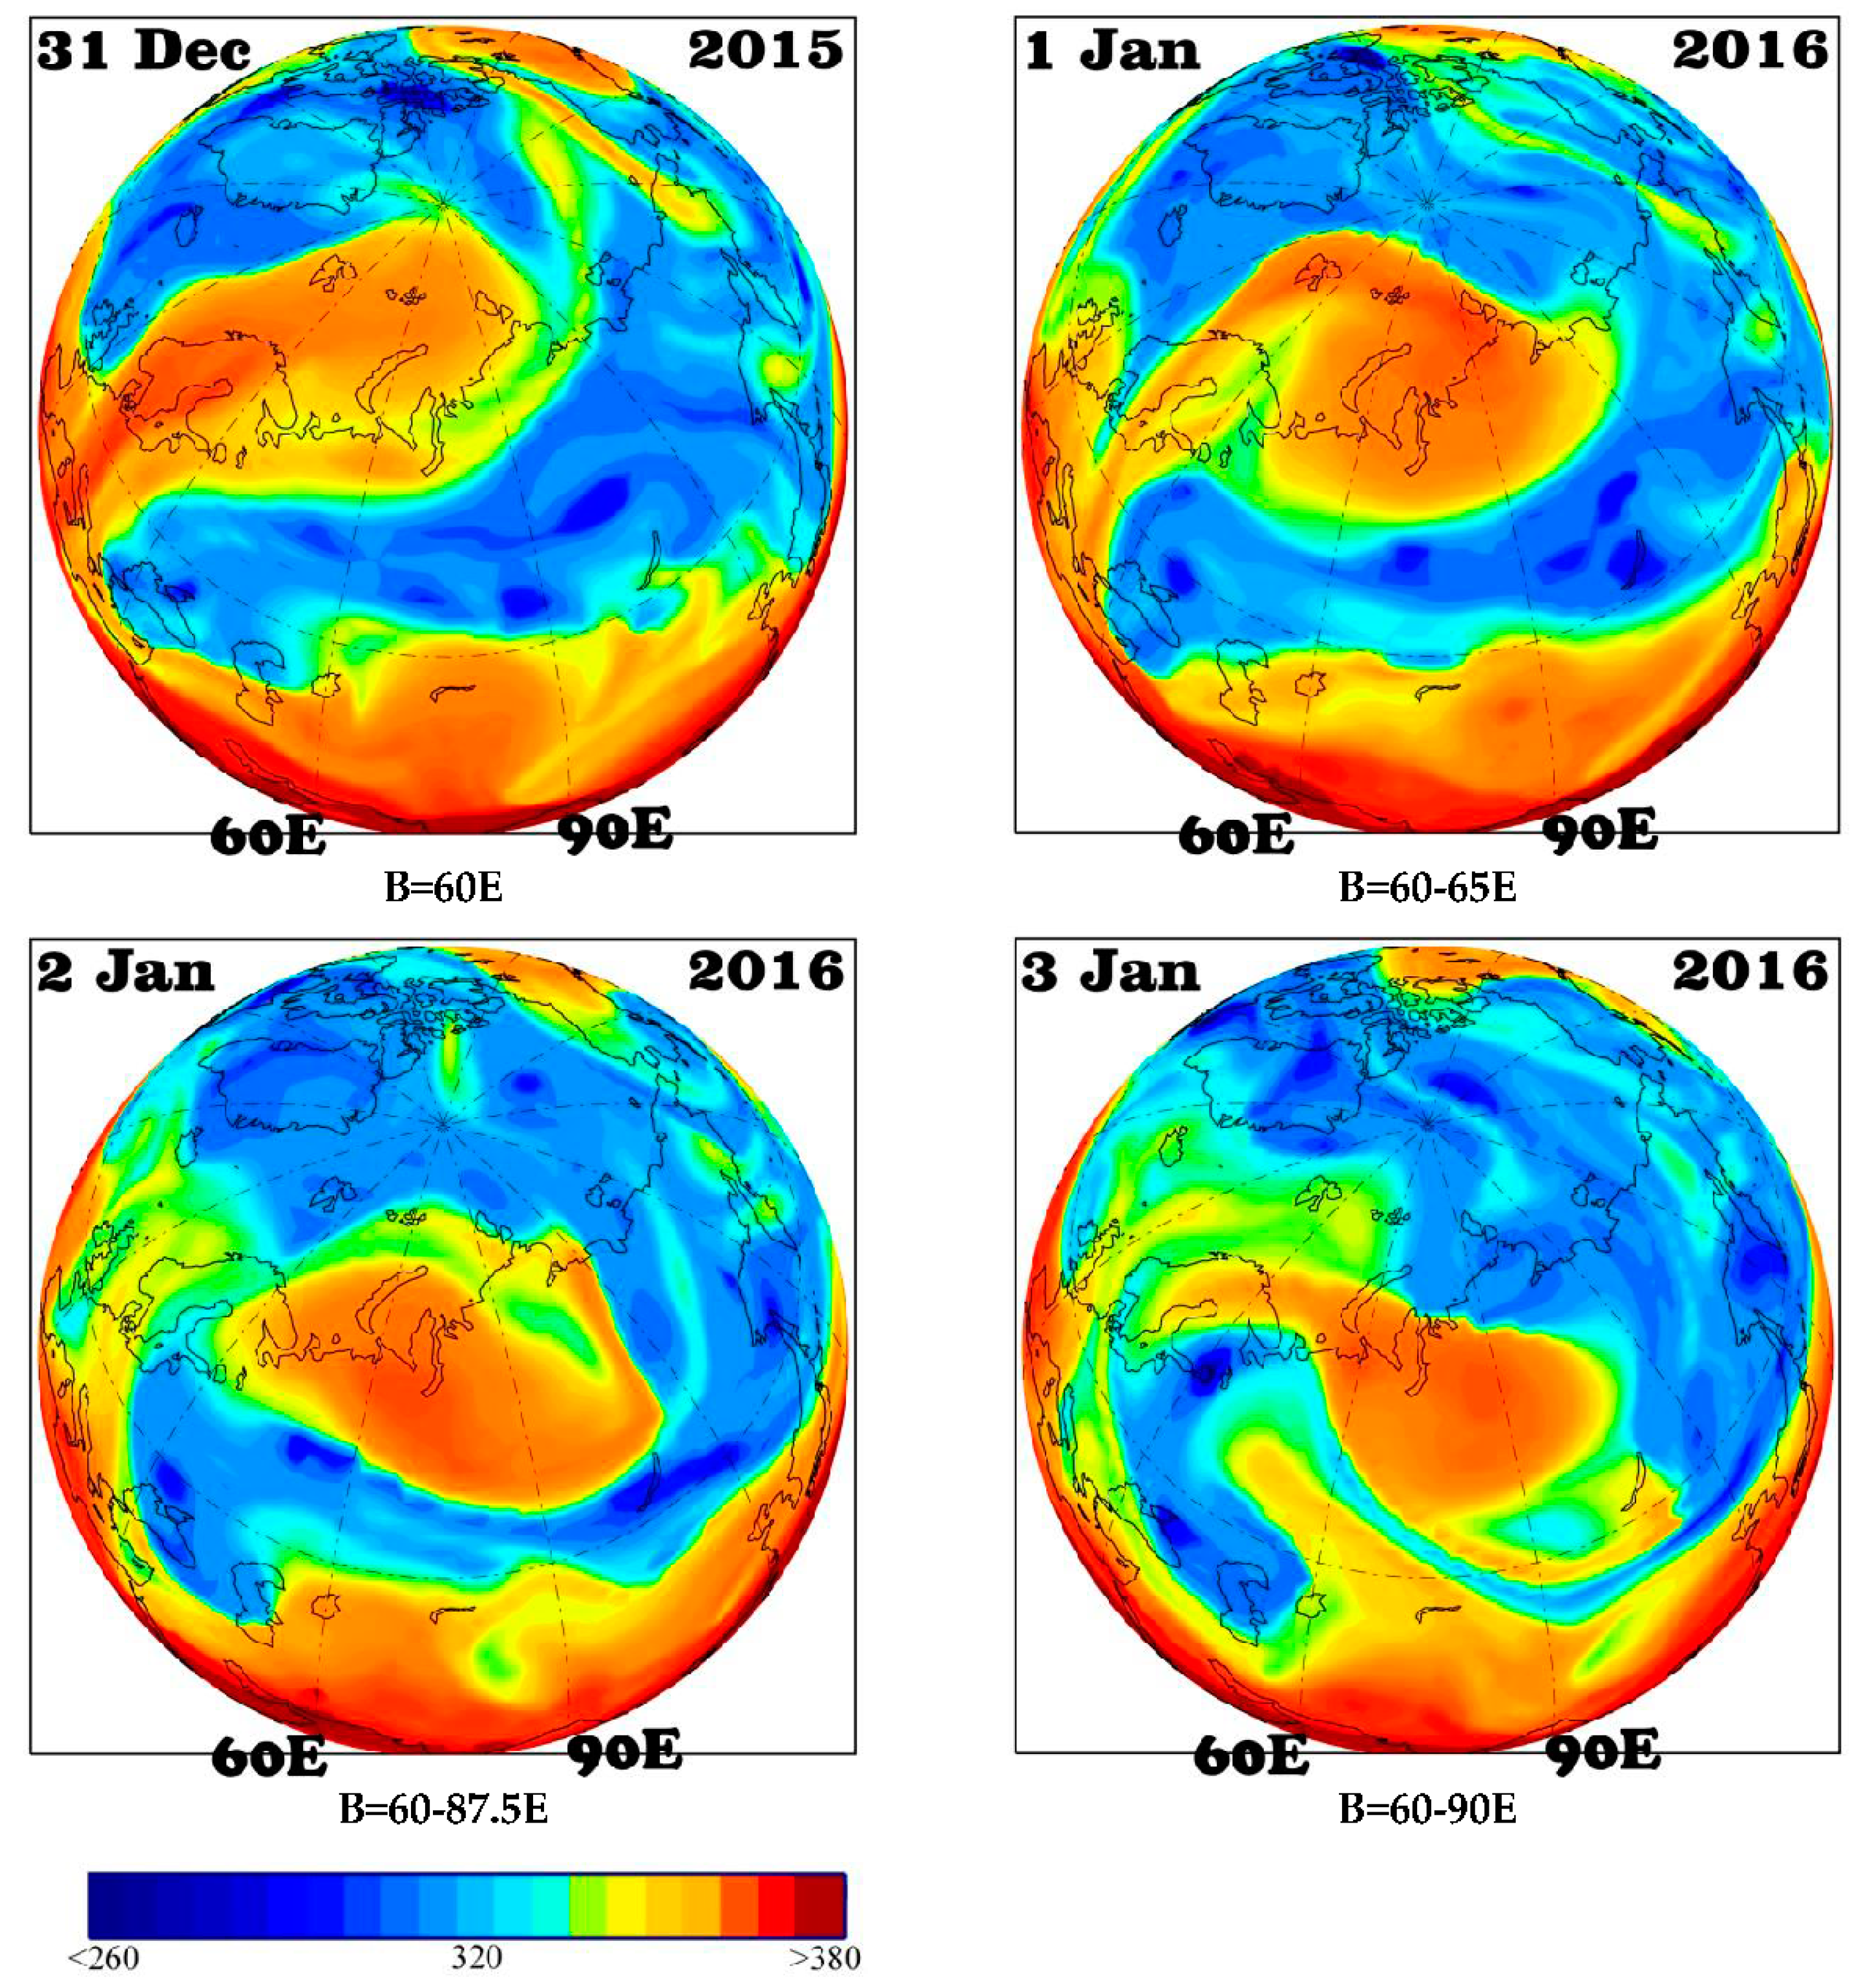
14]. We analyzed the PV2-θ fields for all the 14 blocking events. To present in figures, we selected only two events that reflect most fully all the main features of the dynamics of the investigated blockings. Those were the second blocking within 2010/2011, and the 2015/2016 blocking. A dipole pattern of the surface temperature anomalies corresponds to the 2015/2016 blocking.
Figure 4 shows the PV2-θ distributions for this event.
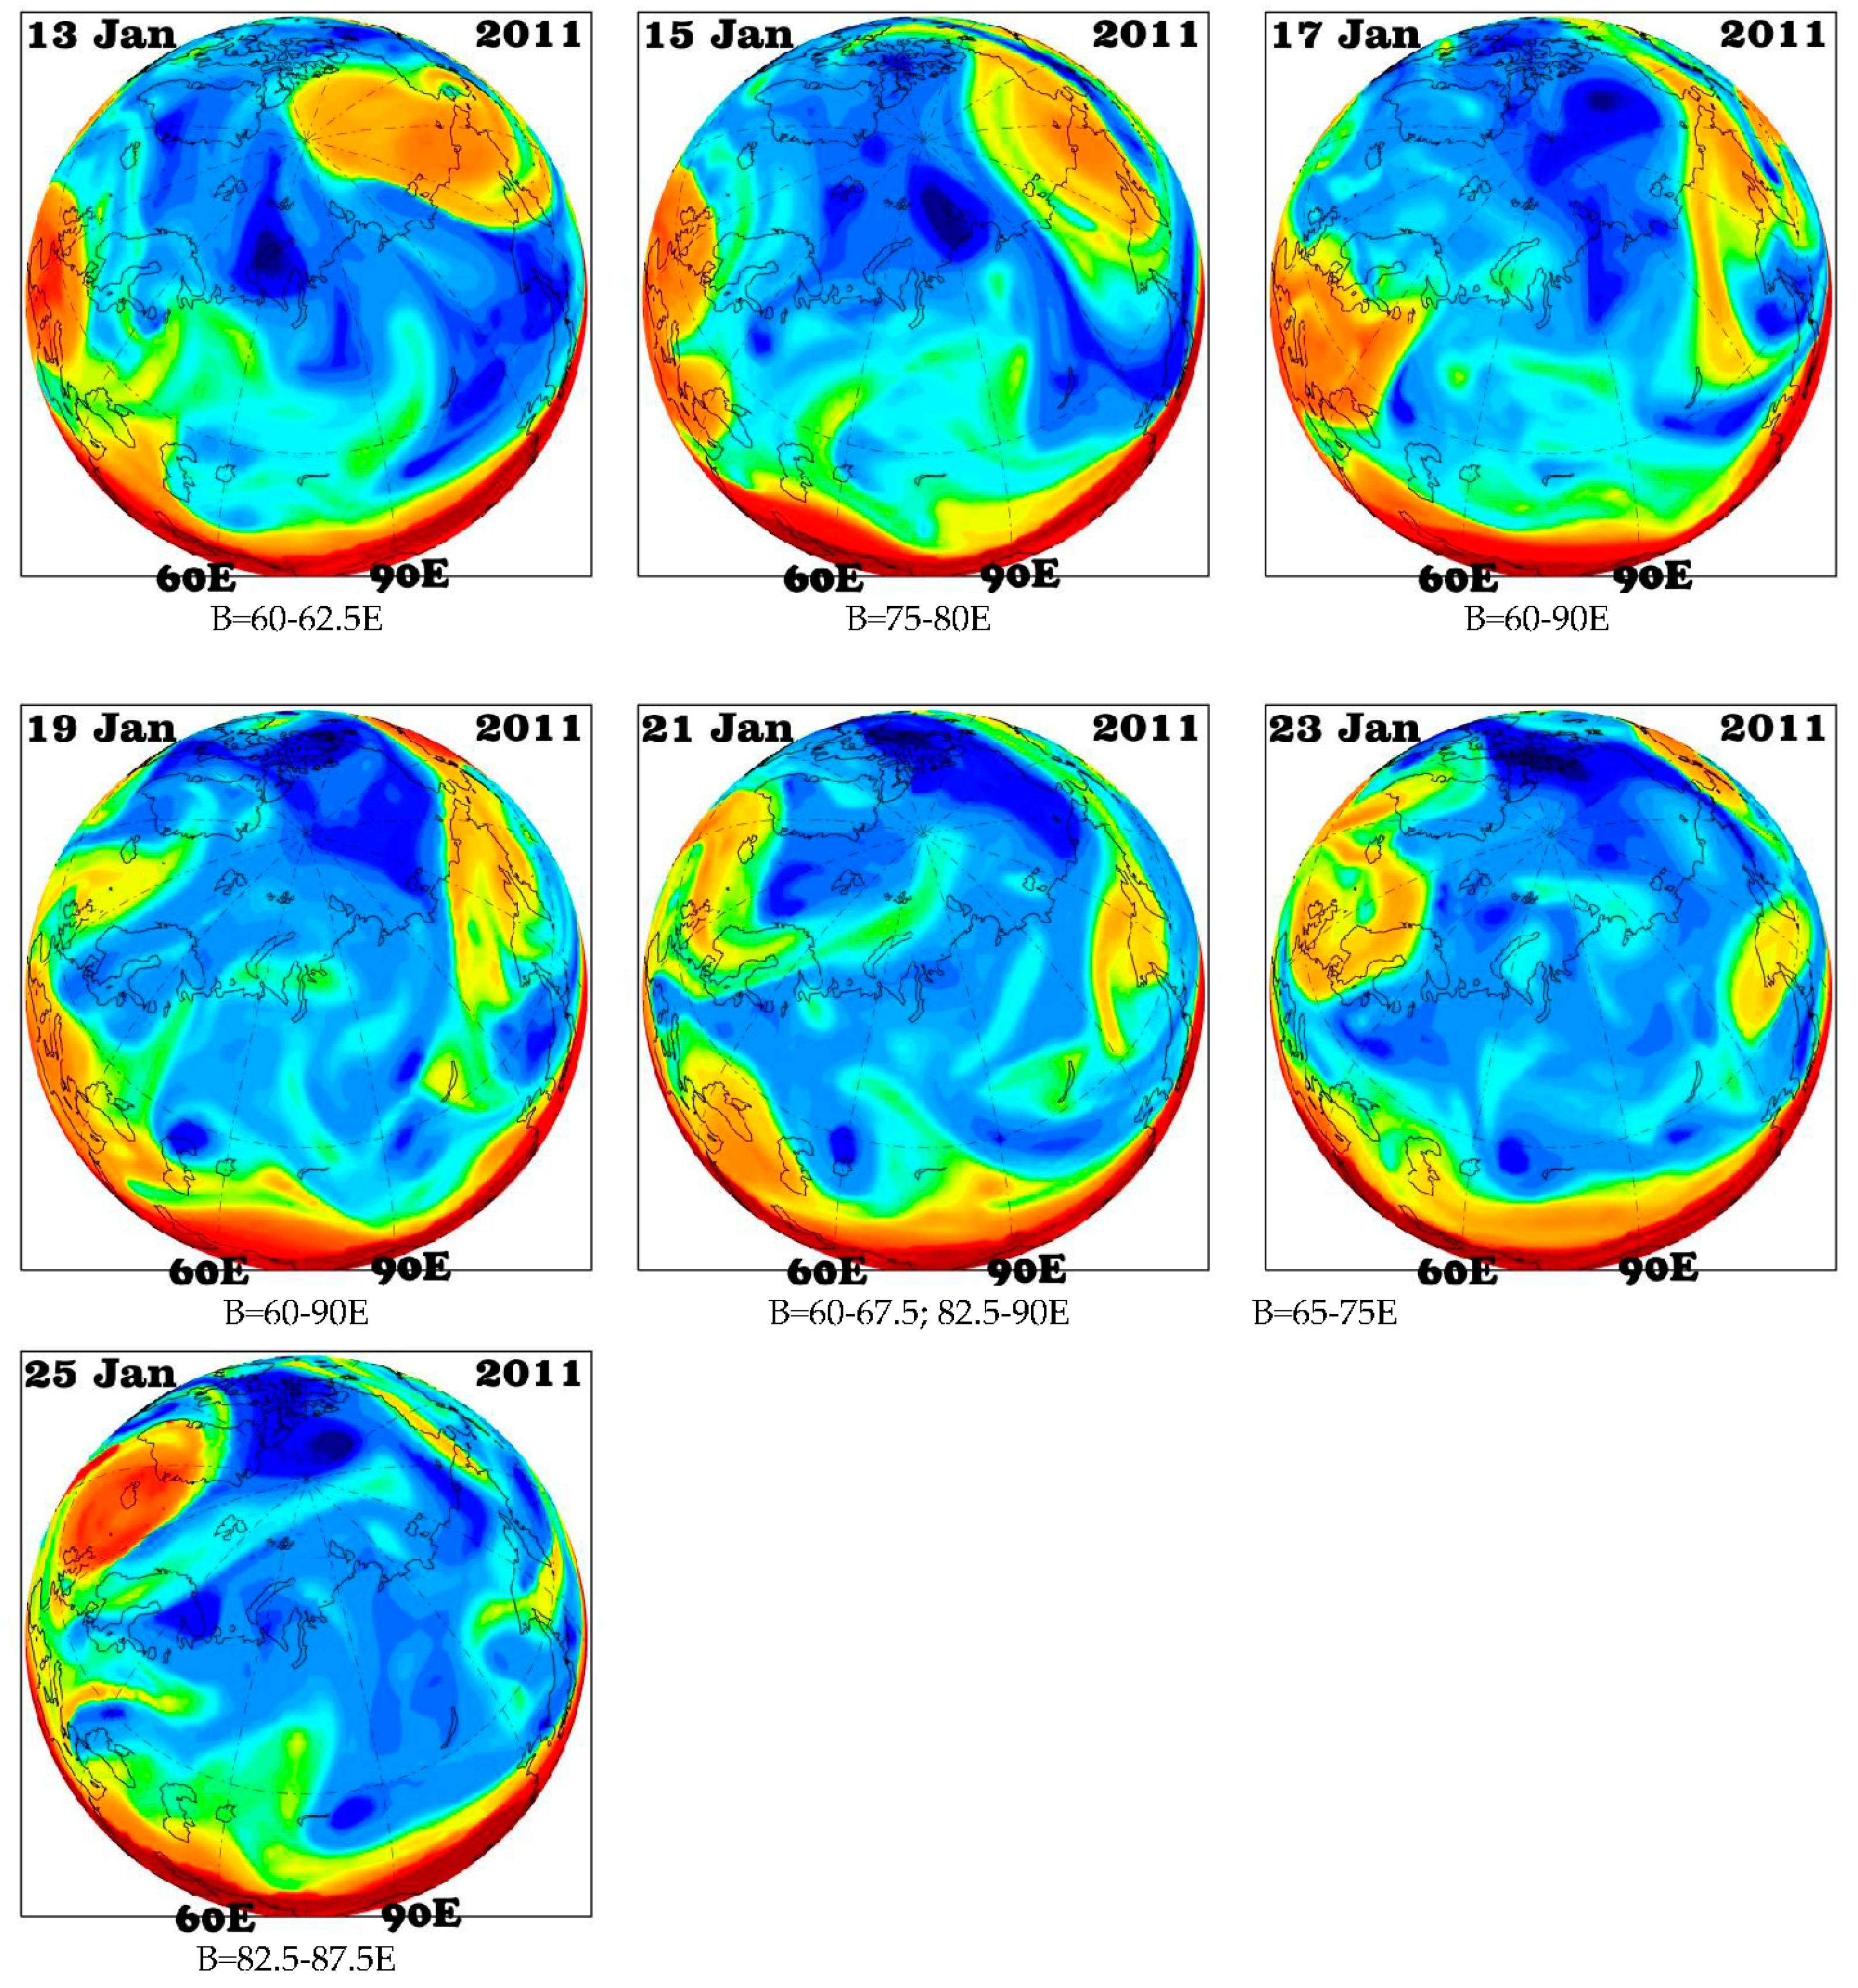
Figure 5 provides the PV2-θ fields for a “non-dipole” situation, which was the second blocking of 2010/2011.
The analysis of
Figure 4 and the analysis of the corresponding diagram in
Figure 3 show that the 2015/2016 blocking is only a part of a larger-scale event evolving in a large area comprising Europe, the Ural Mountains, and all of Siberia. Strong advection is characteristic of this event. Warm air penetrates deeply northward, into the Arctic region, through the western flank of the blocking. At the same time, cold arctic air propagates through the eastern flank of the blocking across Western Siberia far south-west, up to and including the Black Sea. All of the other 9 events (not shown) with a dipole pattern of the surface temperature anomalies over Western Siberia corresponded, generally, to this scenario. The events, for which positive surface temperature anomalies in the north and negative anomalies in the south have values close to the norm, feature less intensive advective transports. Warm/cold air masses do not penetrate so deeply north-/southward, like in the example shown in
Figure 4.
The blocking in
Figure 5 and on the corresponding diagram of
Figure 3 evolves differently. From 13 through 17 January, there evolves a weak (as compared with the previous case) advection of warm air over Western Siberia. Simultaneously, a strong blocking event evolves over the Russian Far East and Alaska (up to about 19 January 2011). Additionally, from about 18 January 2011, advective transports over Europe intensify, and a strong blocking evolves there. Although Western Siberia in the addressed case has a local advection, these processes nevertheless occur insignificantly, because the main processes of the warm air advection occur over the North Pacific and Europe. Through the territory of Western Siberia, there is an intense cold air advection: first, into the system of the Far East blocking, and then, into the system of the European one. There is an attempt of warm air transport directly over Western Siberia in January 2011. However, this transport is too weak to provide a steady dipole pattern in the PV2-θ and in the surface temperature anomalies.
4. Discussion
We wrote in Antokhina et al. [
8] that detecting blockings purely over Western Siberia (or another sufficiently narrow longitudinal sector) is a formal procedure. Addressing those processes as independent processes is, strictly speaking, incorrect. Most of the cases that we addressed in this paper (see
Figure 3,
Figure 4 and
Figure 5) also testify to this. Intensive dynamic processes over Western Siberia appear, as a rule, either to be a part of larger-scale events or the periphery of the latter. In all of the 14 cases investigated, there was, preferentially, a cold inflow from Arctic through Western Siberia into the southern regions. One can also see some signatures of the advective heat transport over Western Siberia (see, for example,
Figure 5). But such transports (although they facilitate the blocking evolution within certain periods) are too weak to provide a steady dipole pattern in temperature anomalies. In all four “non-dipole” situations that we detected, Western Siberia was away from strong blocking evolving either over Europe or over the Far East.
Analyzing the PV2-θ distributions in
Figure 4 and
Figure 5, one should also note an obvious role of blockings in warm air transport into the polar region. This fact implies the possibility that blockings participate in Arctic warming [
16]. On the PV2-θ distributions, one can also see the Arctic cold air advection (caused by blockings) into lower latitudes is preferably implemented over Western Siberia. This results in a strong cooling of southern Siberia. Which, in turn, may lead to a surface anticyclone formation. This fact testifies to the idea stated in Wang et al. [
6] about the strong effect of winter Siberian blockings on the Asian high intensity.
In the future, it would be interesting to expand the study of winter blocking episodes over Western Siberia by examining their surface temperature impacts in terms of additional variables (e.g., precipitable water or cloud cover modulating outgoing longwave radiation). Similar work has been carried out in Trigo et al. [
17], which presents comprehensive multivariable characterization of the climatic impacts of winter blocking and strong zonal-flow (non-blocking) episodes over the Euro-Atlantic sector.
5. Conclusions
We investigated 14 events of winter atmospheric blocking over Western Siberia within 2004–2016 (12 winter seasons) and studied their effect on the surface temperature in this region. Within three winters out of twelve, there were no blocking events over the region: 2009/2010, 2013/2014, and 2014/2015. Four winters featured a high blocking frequency: 2004/2005 (2 events), 2006/2007 (2), 2010/2011 (3), 2011/2012 (2). Five winters had one event each: 2005/2006, 2007/2008, 2008/2009, 2012/2013, 2015/2016.
For each of the 14 events, we calculated the surface temperature anomalies in the northern and in the southern parts of Western Siberia. Upon analyzing all the events, we separated the temperature anomaly distributions into two groups: dipole distributions (10 events) and “non-dipole” situations (4 events). A dipole pattern represents a positive anomaly (or values close to the norm) of the surface temperature in the region’s north and a negative anomaly (or values close to the norm) in the south.
The PV2-θ analysis (advection characteristics) showed that strong advection is characteristic of the events with a dipole pattern of the surface temperature anomalies. Warm air penetrates deeply northward (into the Arctic) in such processes through the blocking western periphery. Cold arctic air propagates through the blocking eastern periphery via Western Siberia far southwest. In each of the four “non-dipole” situations that we detected, Western Siberia appeared away from strong blocking events evolving either over Europe or over the Far East. Generally, the analysis of all the 14 events showed that the blockings calculated over Western Siberia may not, strictly speaking, be addressed as an independent phenomenon. They appear, as a rule, either a part of larger-scale events or at the periphery of the latter. In each of the 14 cases investigated, there was an inflow of cold air from Arctic into the southern regions through Western Siberia. There were also signatures for the heat advective transport over Western Siberia. However, such transports are too weak to provide a steady dipole pattern in the PV2-θ and in the surface temperature anomalies.


