Abstract
Micro-scale cold-air flow along a gentle slope was analyzed using thermal infrared imaging (TIR), focusing exclusively on the lowermost 2 m above ground. Cold-air pulses were analyzed with regard to their vertical temperature stratification as well as flow characteristics, such as flow speed. Analyses on the transition zone between the near-surface very stable inversion layer and the less stable, warmer air above highlight turbulent situations and detrainment effects at the cold-air inversion top. Using thermal imaging in a high spatiotemporal resolution with up to 90 vertical data points and TIR pixels for 1.5 m cold-air depth, a high-precision cold-air flow analysis was realized.
1. Introduction and Research Questions
Cold-air flow locally influences ecosystems by evoking a decoupled micro-climate and thus potentially suppressing vegetation growth [1]. The formation of cold-air pools is a central aspect in the development of air pollution situations [2,3]. In addition, the cooling of urban heat islands by nocturnal cold-air flow and cold-air pools is a relevant effect, especially with respect to climate change adaption in urban areas and urban air pollution [2,4,5].
The boundary layer is directly influenced by the Earth’s surface [4]. Differences in surface conditions like albedo, exposure, slope, and solar radiation incidence lead to variability in the near-surface radiation budget over time and to the development of temperature gradients. In particular, an air temperature inversion usually forms at night as the radiation balance at the Earth’s surface becomes negative [4]. Differences in vertical air temperature and density as well as topography lead to cold-air flow along pressure and elevation gradients and gravity-induced downslope flow, especially flows along rims and valleys [6]. Cold-air flow mostly occurs during clear and calm weather conditions without major wind systems above (cf. [7]). The development of nocturnal cold-air flow with regard to cold-air flow dynamics in complex terrain and its cooling effect on the environment has been studied, collecting data in field experiments since the first half of the 20th century [6,8]. Analyses of cold-air processes that occur in the boundary layer generally focus on the lowermost hundreds of meters above the surface and mostly skip the lowermost 2 m.
A great number of analyses confirm that cold air does not flow continuously. Instead, particularly because of surface-dependent local differences in cold-air development, cold-air pulses frequently occur and interrupt the flow (cf. [9,10]). The development of this phenomenon may be aided by differences in the density and flow speed of the layers meeting at the inversion top, as well as the resulting turbulence. This in turn results in a detrainment of cold air into the overlying warm air [11]. Downslope cold-air flow speed generally varies between 2 and 4 m/s, depending on the terrain gradient [6], where a longer flow distance leads to both a higher flow speed and greater inversion height [12]. A high variance in cold-air pulse frequency over the night was detected in different studies (e.g., [12,13]).
Cold-air flow characteristics are often assumed to be scale-invariant, including the formation of cold-air pulses, turbulence, and cold-air pool formation (cf. [7,14,15]). Thus, findings on cold-air flow in one scale should be transferable to other scales. As mentioned above, analyses of micro-scale processes in the boundary layer generally focus on the atmosphere above 2 m. However, the inversion height is sometimes below 2 m above ground [7,16,17], especially in the initial stages of cold-air development and on gentle slopes. There is a gap in the knowledge of turbulence characteristics in low-lying areas in gently undulating terrain [18]. Even if the fluxes in thin drainage flow layers are small, “they completely determine the exchange between the atmosphere and the surface” [18]. In their study, Soler et al. (2002) [18] found that (i) the depth of the drainage flow and the wind speed maximum is highest when the wind speed of the air above is less than 2 m/s, (ii) the inversion height of the drainage flow is lowest when the stratification within the flow is stronger and the external flow is weaker, and (iii) weak fluxes in thin drainage flows “determine minimum nocturnal air temperature as well as the dispersion of surface releases”. Also, Mahrt et al. (2001) [17] found that the temperature stratification reaches a maximum when the wind speed within the nocturnal flow reaches a minimum. They detected a temperature difference of 4 °C between the bottom and the top of the analyzed gully side slopes (8 m in height). Additionally, they determined the jet maximum location to be between 2 and 3 m height. Nauta (2011) [19] analyzed the lowermost meters of drainage flows and confirmed the oscillation pattern of nocturnal drainage flow with strengthening and weakening episodes, also for less than 2 m height. In their study, the cold-air pulses were found to act in various time scales of 1 to 3 min within an observation height of 2 m, in which the onset of cold-air flow pulses was frequently characterized by cold-air micro-fronts with wind shifts and strong temperature drops [19].
The insights summarized above were mostly obtained based on spatially distributed point measurements. There are a few studies that introduce high-resolution analyses of nocturnal cold-air flow characteristics. Fiber-optic measurement systems in combination with standard measurements allow for high precision cold-air stratification analyses, e.g., [20]. The data resolution obtained was 1 s and 0.125 m within a 8 m × 8 m fiber-optics array. Additionally, this method was used for the cold-air flow observation along a grass-covered gentle slope transect [21], collecting high precision data along the fiber lines.
With the infrared-based technique presented in [22], a spatially coherent imaging of cold air phenomena in the lowermost 2 meters has become possible and is used in the present study. Looking at the micro-scale cold-air flow in this way will allow for analyses on the fine structure of the cold-air atmosphere over time. A detailed look at vertical air temperature profiles, cold-air dynamics, and the transition zone between the near-surface very stable inversion layer and the less stable, warmer air above is expected to lead to new insights into and a better understanding of the cold-air flow process. Individual cold-air pulses can be analyzed with respect to flow characteristics and vertical air temperature profile development over time.
In this way, the present study pursues a combined approach of standard and thermal infrared (TIR) measurements to analyze the nocturnal micro-scale cold-air flow patterns at high spatial and temporal vertical precision, focusing on the lowermost 2 m above a grass-covered gentle slope.
The following questions are addressed:
- How do drainage flow patterns develop after sunset?
- How pronounced is the vertical separation of flow layers, i.e. which vertical temperature profile characteristics can be found in the pulsing flow oscillation patterns over time?
- Do vertical temperature profile characteristics change over the life cycle of a cold-air pulse flowing downslope?
- What are the characteristics of the vertical temperature profile in the transition zone between the near-surface very stable inversion layer and the less stable, warmer air above?
2. Approach
To address the research questions, a site allowing for downslope flow development was needed. This situation was found at the northern fringe of the Rhenish Massif in Bochum, Germany in a tributary valley of the Ruhr River, adjacent to an existing weather station. The gentle slope (average inclination about 10%) and the vegetated surfaces (grass) appear suitable to generate gentle cold-air drainage flow.
2.1. Data Collection
Data collection followed the approach described in Grudzielanek and Cermak (2015) [22]; the general setup is shown in Figure 1.
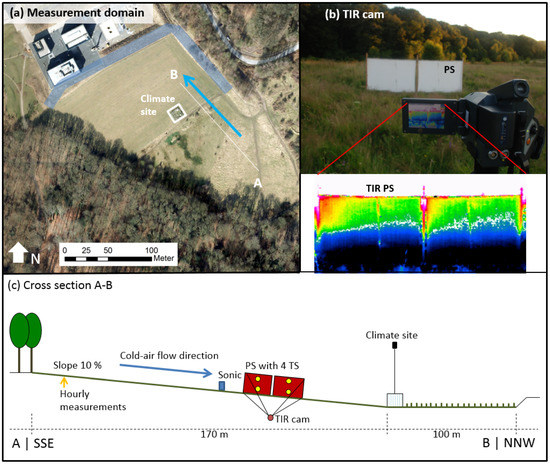
Figure 1.
Measurement setup on 23 July 2012, Bochum, Germany; 51°26′45.74″ N, 7°16′28.57″ E. (a) Measurement domain with cold-air flow direction (blue arrow), cold-air pool bordering slopes (transparent blue), and cross-section A-B for c; (b) view of the thermal infrared (TIR) camera capturing the projection screen (PS) (distance 10 m)—photo (top)and TIR image (bottom); (c) cross-section A-B through setup. TS = temperature sensors; aerial image source for a: modified from Reference [23].
All instruments were installed in the expected and pretested cold-air flow direction in line with the existing weather station. Measurements included the following parameters: air temperature measurements at several heights (ultrasonic anemometer 3D, 30 cm above ground and 3 m upslope from the projection screen, interval 1 s, Thies, Göttingen, Germany; weather station, 5 cm and 2 m above ground, interval 10 s, Thies, Göttingen, Germany; individual sensors, two heights at projection screen (PS), interval 1 s, GeoPrecision, Ettlingen, Germany), as well as wind direction and speed (sonic, weather station), see Figure 1. A TIR camera (VarioCam, InfraTec, Dresden, Germany) was directed towards the projection screen (PS), which was installed as a vertical surface along the cold-air flow direction. This TIR camera measured the thermal signal of the PS, which was converted into surface temperatures (referred to as ‘PS surface temperatures’ throughout the text) and is shown in TIR images (ground surface temperatures were not considered in this study). The TIR camera has a spectral range from 7.5 to 14.0 µm, a resolution of 384 × 288 TIR pixels, a measurement range from −40 °C to +1200 °C, and a precision of ±1.5 K. With its low-noise detector the thermal resolution at a temperature of 30 °C is specified as better than 0.035 K. TIR images were collected in 1-s intervals. The measurement campaign took place on 23 July 2012, a day with a clear sky, low wind speed, and calm situation at night.
2.2. Thermal Imaging Analyses
The approach and its suitability have been demonstrated in Grudzielanek and Cermak (2015) [22] partly using the same data analyzed here. Therefore, infrared-derived PS surface temperature changes were systematically compared with air temperatures measured a few tens of mm away by the temperature sensors in diagrams and in time series analyses [22]. Correlation analyses showed a good agreement in temperature time series [22]. Using autocorrelation analysis, a rapid response of the screen material to air temperature changes was confirmed. In some situations, TIR observations could record air temperature changes more quickly than standard air temperature sensors [22]. Calculating the power spectrum of the PS surface temperature data, temperature fluctuations within several seconds could be resolved, limited by the TIR measurement range of 1 s [22].
Figure 2 shows the PS sections within which the TIR data were used. The surrounding areas are either outside of the PS, influenced by turbulence produced by the PS itself, or show the surface of installation elements or of the overlaying air temperature sensors installed in the middle of both PS parts. Looking at the PS, TIR data were collected nearly at a 90° angle and a distance of 10 m from the PS, which minimizes errors caused by perspective deformation and different TIR view angles [22]. The PS emissivity was assumed to be 0.94; no atmospheric correction was performed because of the small distance between the TIR camera and the PS and the relatively low humidity.
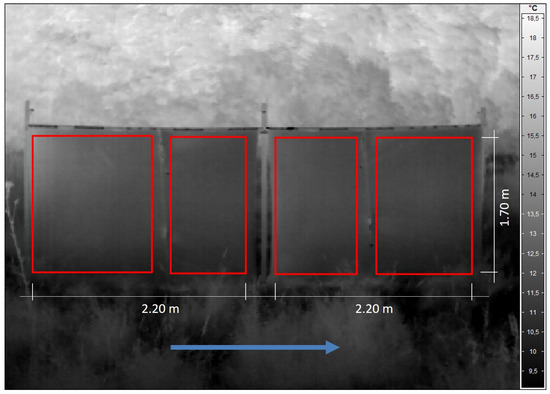
Figure 2.
TIR image of the PS. Blue arrow = cold-air flow direction; red boxes = usable TIR data at the PS, starting at 20 cm above ground; parts outside the red boxes: air temperature sensor locations and PS installation elements.
Extracting TIR data over time allows for time series data analyses, such as correlation analyses. Therefore, the vertical PS surface temperature profiles extracted from the TIR data at the PS allow for the analysis of temporal patterns in inversion development.
For this, the vertical profiles from the bottom to the top of the usable PS contained up to 90 TIR pixels and thus 90 data points, for the indirect measurement of air temperature changes over a vertical distance of up to 1.70 m.
Additionally, TIR images and TIR time-lapse videos allow for a detailed qualitative analysis of cold-air flow dynamics. These types of qualitative analyses were also performed here and are part of some cold-air flow analyses steps, partly shown in TIR time-lapse videos found in the Supplementary Materials (Videos S1–S3).
3. Results and Discussion
3.1. Measurement Period Overview
On 23 July 2012, the air temperature increased to a maximum of 27.0 °C and a nightly cool-off of 13.5 °C occurred, bringing the air temperature down to a minimum of 13.5 °C, measured at the weather station at 2 m above ground (Stevenson screen). The wind slowed in the evening, as wind speed measurements at 10 m above ground showed low wind speeds ≤0.5 m s−1, thereby allowing the decoupling of the near surface stable boundary layer (SBL), measured at the climate station and shown in Figure 3. about 19:50 LT (local time, UTC + 1) a relatively stable near-surface inversion was measured a few meters upslope the sonic sensor using hand-held sensors at different heights above ground, being about one hour before pre-sunset shadowing by buildings and trees reached the PS. Subsequently, the air temperature decrease weakened, the wind slowed down to as little as 0.5 m/s and the wind direction turned to persist in the expected and pretested cold-air flow direction—South to Southsoutheast.
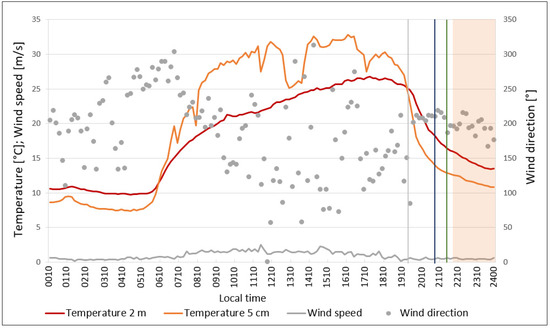
Figure 3.
Temperature and wind conditions at the weather station on 23 July 2012, 00:10–24:00 local time (LT). Grey line: moment of inversion at the weather station; blue line: shadowing of the operation area at 20:50 LT; green line: sunset in Bochum at 21:33 LT; orange box: TIR measurement period (started at 20:50 LT, technical problems allowed continuous data from 21:50 LT on).
In Figure 4, the sonic air temperature and wind speed data are shown (top). Additionally the vertical temperature differences at TIR profile 1 (profile location in Figure 5) and the standard deviation of TIR profile 1 are shown for the surface temperatures at the PS for every time step of the TIR measurement period (bottom). A permanent shallow cold-air flow was observed with oscillations, indicating the occurrence of cold-air pulses with turbulence (cf. [7,10,22]) and frequency variance (cf. [12,13,19]).
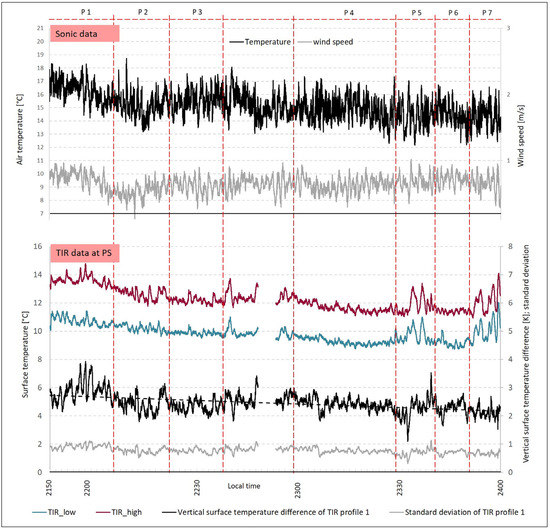
Figure 4.
Top: Sonic data on 23 July 2012, 21:50–24:00 local time (LT); air temperature and wind speed were measured 2 m upslope from the PS. Bottom: TIR data on 23 July 2012, 21:50–24:00 LT; the PS surface temperature of the TIR data points (TIR_low and TIR_high), the vertical PS surface temperature difference at profile location TIR_profile 1 (location in Figure 5), and the standard deviation of TIR_profile 1 for each time step. Data are not detrended; Red dashed lines: division of the measurement period in subperiods P1–P7.
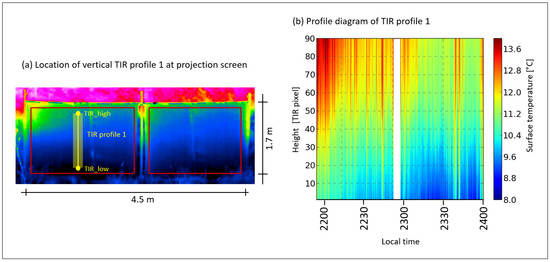
Figure 5.
PS data overview on 23 July 2012: (a) PS TIR image from the location of vertical TIR profile 1 and TIR data points TIR_low and TIR_high (from Figure 4), usable PS surface starts at 20 cm above ground; (b) profile diagram of TIR profile 1 from 21:50–24:00 LT with 90 TIR data points (pixel) for a height of 150 cm starting at 20 cm above ground, TIR interval = 1 s, white color means no data.
To underline the oscillation pattern of the nocturnal drainage flow, PS surface temperature profiles were plotted over time. In Figure 5a, the profile location on the PS is marked with a yellow line (representing the mean of 10 TIR pixels in one row). This location was chosen because of its representative PS area and because of a relatively undisturbed cold-air flow at the beginning of the PS passing. In Figure 5b, the diagram of the TIR profile 1 as a vertical PS surface temperature profile (color) is shown for the whole TIR measurement period. In every time step an inversion is visible, and later in the evening, the colder the near-surface atmosphere becomes. This development is interrupted by fluctuations, which show individual cold-air pulses and confirm the oscillations of the cold-air flow reported in the literature.
Addressing research question 1 (looking at the cold-air flow patterns over time), several periods with different flow characteristics over time arose. Periods with higher or lower variances in PS surface temperatures at TIR_high and TIR_low are separated from each other. Also, the vertical PS surface temperature differences of TIR profile 1 over time were considered for this separation. The periods are delineated either by interruptions in data collection or by changes in the data curves identified via visual inspection. On this basis the similarity of flow periods with respect to possibly similar connections of flow characteristics, is tested with correlation analyses in Section 3.2.2. With this approach, seven flow characteristic periods (P1–P7) were identified (as shown in Figure 4 and summarized in Table 1).

Table 1.
Attributes of flow characteristic periods P1–P7: Mean value of vertical surface temperature difference of TIR profile 1 = ΔTTIRprofile1, mean value of standard deviation of vertical surface temperature difference of TIR profile 1 = σΔT TIRprofile1.
3.2. Cold-Air Pulse Analyses
Due to the meteorological conditions, measured at the weather station, of very low wind speeds (nearly 0 m/s) at 10 m above ground, all PS surface temperatures and thus indirect changes in air temperature measured using TIR imagery could be explained by the near-surface cold-air flow.
3.2.1. Cold-Air Pulse Identification
Individual cold-air pulses are identified by an air temperature dropdown at the cold-air pulse maximum and an increasing air temperature afterwards, e.g., described by Whiteman (2000) and Mahrt (2014) [9,10]. One cold-air pulse is defined here as the air flowing in a period between two PS surface temperature maxima at near-surface air flow from South to Southeast (wind direction verified by standard measurements). By this definition, 71 individual cold-air pulses were observed over the whole TIR measurement period on 23 July 2012 from 21:50 to 24:00 LT, partly with inversion heights within the PS and partly, suspected above the PS. The inversion height is defined as the height at which the temperature increase reverses to a temperature decrease or shows nearly constant temperature with increasing height.
When considering sequences with a duration of about 10 min, individual cold-air pulses become more visible, e.g., from 23:35 to 23:45 LT, as shown in Figure 6. This figure shows the organization of the oscillating air flow into pulses in unprecedented detail.
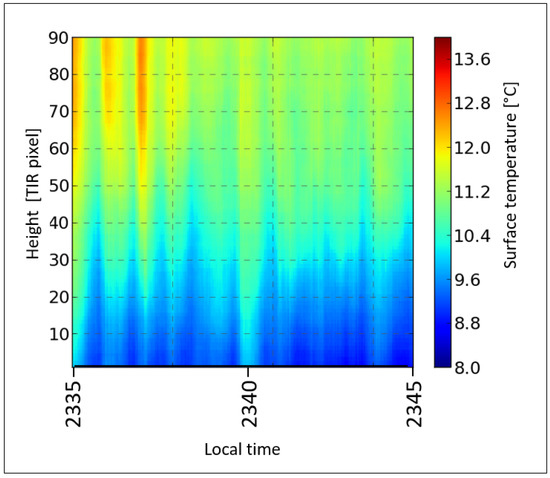
Figure 6.
Profile diagram of TIR profile 1 (location in Figure 5) with 90 TIR data points (pixel) for a height of 150 cm starting at 20 cm above ground, 10-min cold-air pulse period measured on 23 July 2012 from 23:35 to 23:45 LT.
3.2.2. Cold-Air Pulse Characterization
For the analysis of the cold-air pulse characteristics, addressing research question 2, sonic and TIR data are visualized in Figure 4 and a correlation analysis was performed for the detrended data series:
- (i)
- wind speed (sonic) with vertical surface temperature difference of TIR profile 1 (ΔTTIRprofile1): testing the relation, if low wind speed results in strong cold-air stratification and thus in a high ΔTTIRprofile1,
- (ii)
- wind speed (sonic) with standard deviation of vertical surface temperature difference of TIR profile 1 (σΔT_TIRprofile1): testing the relation, if higher wind speed results in a more turbulent flow and thus in a higher variance of the vertical temperature,
- (iii)
- wind speed (sonic) with PS surface temperature minimum at TIR_low (TminTIR_low): testing the relation, if lower wind speed results in stronger cold-air stratification, restricting the identification of stratification rate to TminTIR_low,
- (iv)
- PS surface temperatures at TIR_low (TTIR_low) with TIR_high (TTIR_high): checking the consistence of the near-surface inversion and testing the similarity of temperature increases and decreases at these two PS heights.
All correlations were calculated for the flow characteristic periods P1–P7, as shown in Table 2. No lag correction was performed for consistency with the approach introduced in [22] and considering the very close spacing of the instruments. In addition, the inversion heights of cold-air pulses occurring within each period were taken into account.

Table 2.
Results of correlation analysis for the flow characteristic periods P1–P7; *r is statistically significant.
Because of technical problems the TIR measurement started after sunset. Thus, owing to the fact that a stable inversion occurred already at 19:50 LT, according to the data of the standard measurements taken earlier in the evening, the initial cold-air flow was not measured using the TIR method here. Thus, P1 represents the TIR data recorded after the initiation of the cold-air flow.
During P1 there is a high variance in the wind speed (sonic) as well as in the PS surface temperature data (TIR) for TIR_high and TIR_low, as seen in Figure 4. In addition, the vertical PS surface temperature difference of profile 1 varies significantly over time. The highest mean value (2.88 K) is shown in this period compared to P2–P7. In addition, the standard deviations within the profiles show the highest mean value (0.92) in this period compared to P2–P7. P1 is the only period where a positive correlation of r = 0.43 between the wind speed (sonic) and the PS surface temperature minimum (at TIR_low) confirms the assumption that low flow speed correlates with cold-air minima [17,18]. In comparison to P4–P7, P1 shows a relatively low correlation (r = 0.35) between PS surface temperatures at TIR_low and TIR_high, which eventually confirms the high vertical stratification in addition to the low wind speed and temperature minimum. The numbers of pulses with inversion heights within and above 2 m are similar.
Periods P5 and P7 seem to have a similar high variance in the wind speed (sonic) and in the PS surface temperature data (TIR) for TIR_high and TIR_low, similar to P1. The biggest difference separating P5 and P7 from P1 is the higher correlation between PS surface temperatures at TIR_low and TIR_high (P5, r = 0.76; P7, r = 0.96). This could mean that the cold-air pulse stratification strength is highly relevant for complex flow and temperature profile characteristics. Notice that the low wind speed over the whole measurement period below 1 m/s could smooth this effect; at these low wind speeds, a cold-air sorting and thus a maximal stratification could be possible.
Regarding P2, P3, P4, and P6 as periods with smoother variations in the data of wind speed (sonic), PS surface temperature data (TIR) for TIR_high and TIR_low, and vertical PS surface temperature difference (TIR) (see Figure 4), there are no clear or remarkable correlations between these aforementioned parameters. Indeed, it is very interesting that all of these periods (P2, P3, P4, and P6) have a significant occurrence of cold-air pulses with an inversion height lower than 2 m above ground and low PS surface temperature difference mean values. This indicates a strong stratification of the cold-air pulse atmosphere.
With the application of the TIR method here, the size of the cold-air pulses could be detected as a horizontal length with a downslope cold-air flow. Horizontal cold-air pulses with lengths from 3 m up to 20 m occurred, which correlates with none of the parameters analyzed above. These lengths occurred with time periods of 0.2 to 2.0 min (influenced by cold-air pulse volume, form, and flow speed), agreeing very well with the findings of Nauta (2011) [19].
No significant correlations were found between the sonic measurements and the PS surface temperatures (items (i), (ii), and (iii) above). Given the high autocorrelation in PS surface temperatures documented in Grudzielanek and Cermak (2015) [22], it was expected that temporal lag between the sonic and the PS (3 m apart) plays only a minor role and did not cause a marked decrease in correlation coefficients. The number of data time steps (n) in the periods P1–P7 were not similar, which could weaken the significance of the correlation analysis. Additionally, the microtopography with small-scale variations in the vegetation height (amounting to a few cm) could generate strong turbulence effects that influence the near-surface cold-air flow characteristics. The position of the PS itself may have influenced the cold-air flow, even though it was installed downslope.
The very low cold-air flow speed (less than 1 m/s) for the whole measurement period does not allow for a confirmation or falsification of the assumptions made concerning the low flow speed and flow characteristics, as mentioned above. In the measurements shown in this study, a high stratification of the drainage flow could be present in general because of that. Deduced from the data of P2, P3, P4, and P6, the flow speed seems to be not only highly relevant for a high cold-air stratification, but also a low flow speed variance over time, which possibly reduces flow turbulence.
The results show that the micro-scale cold-air flow within the lowermost 2 m above ground underlies a complex interaction between different factors and that parameters, such as the stratification rate and vertical temperature profile, appear with high variance.
3.2.3. Cold-Air Pulse Temperature Profiles while Passing the PS
To answer research question 3, vertical PS surface temperature gradients of profile 1 (see Figure 5) of selected single cold-air pulse episodes, as well as temporal nearby cold-air pulse maxima (PS surface temperature minima) were extracted from the time series and are depicted in Figure 7. These four pulses represent the main four different types of profile change over time observed while flowing along the PS.
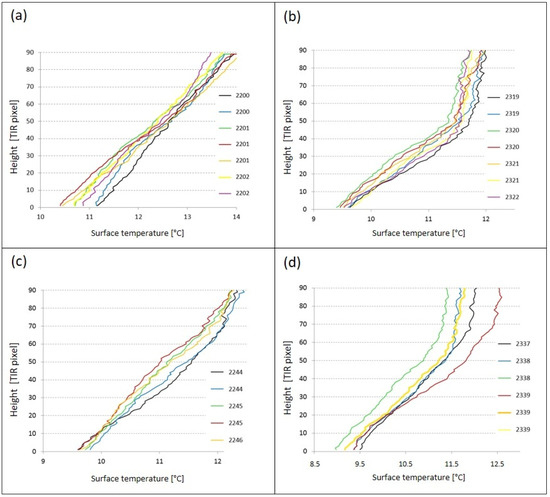
Figure 7.
Selected cold-air pulses with vertical PS surface temperature profiles (profile 1, for location see Figure 5) at different time steps while passing the PS on 23 July 2012 with 90 TIR data points (pixel) for a height of 150 cm starting at 20 cm above ground: (a) pulse maximum at 22:12 local time (LT); (b) pulse maximum at 23:23 LT; (c) pulse maximum at 22:45 LT; (d) pulse maximum at 23:38 LT. Note that there are different x-axis values.
By flowing along the PS, the vertical temperature profile of the cold-air pulse (a) exhibits higher PS surface temperatures in the upper part of the PS and lower PS surface temperatures in the lower part. The graph tilts to a slightly steeper slope while it remains nearly linear. The vertical temperature profile of the cold-air pulse (b) remains constant, and the PS surface temperature level exhibits a decrease (with a short decrease in inversion height at 2319 LT, blue graph) and subsequently increases nearly back to the start conditions. This shows that cold-air pulse vertical temperature profiles can remain consistent within the flowing process, while simply exhibiting fluctuations in the temperature level. The vertical temperature profile shows a PS surface temperature decrease only in the middle part of the vertical axis, as the cold-air pulse (c) passes the PS. The existence of a cold-air near-surface layer (assumed to be the coolest layer), which does not allow the influence from the air above, could be an explanation for this flow characteristic. The cold-air pulse (d) shows a vertical temperature profile with very low PS surface temperatures near the ground. This indicates a characteristic stratification within the cold-air pulse with a strong cold core near the ground and a strong separation of cold-air sublayers inside. For this effect to be achieved, less air exchange within the cold-air pulse is necessary. As such the occurrence of this kind of strong stratification is rare.
As described, the vertical PS surface temperature profiles of different cold-air pulses do not look similar when passing the PS. Either a scenario in which different cold-air stratifications within the cold-air pulse generate the differences while passing the screen, or an alternative scenario in which flow dynamics result in variances of the vertical PS surface temperature profile over time, could apply. Some cold-air pulses show less variation in their vertical temperature pattern flowing downslope, characterized by the slope of the graph and the existing inversion height. Others may be more influenced by factors such as the surface roughness of the ground, possibly resulting in a higher PS surface temperature variance near the ground. Very strong cold-air layers at the bottom of cold-air pulses eventually could minimize this influence of the ground surface roughness. This assumption could not be confirmed finally with the measurement setup used here.
3.2.4. Cold-Air Pulse Transition Zone
Regarding the transition zone between the near-surface very stable inversion layer and the less stable, warmer air above the cold-air pulses, different profiles of the vertical temperature stratification were expected due to the differences in physical air properties and surface roughness (cf. [10,11,19]), addressing research question 4. These profiles describe the mixing processes of cold and warm air at the transition zone. With the setup presented here, the transition zone of cold-air pulses with a lower inversion height than the height of the PS can be analyzed (2 m). Most cold-air pulses showed a similar relatively sharp break at the inversion zone, such as cold-air pulse (b) in Figure 7 at TIR pixel 50 (nearly no further temperature increase with height). This could indicate a relatively laminar air flow without much mixing or major turbulence within the inversion layer. Cold-air pulse (d) (Figure 7) does not show strong turbulence at the inversion (low variation to lower or higher temperatures with height), but the PS surface temperature change from cold to warm air above seems to be smoother.
Some specific turbulent situations of the cold-air pulse transition zone can be seen in Figure 8. Three exemplary turbulent flow situations, generated by cold-air pulses passing the PS, are shown as TIR images with corresponding graphs. In order to understand the motion of turbulent cold-air flow and the transition zone characteristics, TIR movies are helpful. Hence, the three cold-air flow turbulent situations shown in Figure 8 were generated as TIR videos and can be found online in the Supplemental Material, including Video S1 (related to Figure 8a), Video S2 (related to Figure 8b), and Video S3 (related to Figure 8c). Note that there is a fixed dip at the upper left side of the right PS half. This is due to an installation problem, which creates wrong PS surface temperatures in this part of the PS. For the description and interpretation of Figure 8 and the TIR videos, this was taken into account. Additionally the TIR profile in Figure 8b was located to the right of the dip to ensure the profile was not affected by this problem.
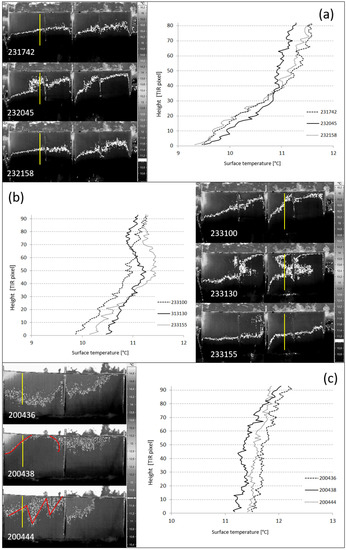
Figure 8.
Cold-air pulse transition zones. Three exemplary situations, each with three moments of local time (hour:min:sec): (a,b) on 23 July 2012; (c) on 22 September 2010, a previous measurement campaign with the same setup and similar clear and calm weather conditions. Yellow line = profile diagram location for graphs with different heights, starting at different heights above ground; red line: micro-front at 20:04:38 LT and detrainment at 20:04:44 LT in (c).
Figure 8a shows three moments of cold-air pulse at 23:20 LT while passing the PS, (profile locations are marked with the yellow line). PS Surface temperatures from 11.0 °C to 11.1 °C (marked with white color) approximately show the inversion height, thus the top end of the cold-air pulse. This cold-air pulse shows moderate turbulence in the transition zone while passing the PS. With increasing inversion height, thus approaching the cold-air pulse maximum, the transition zone becomes more turbulent. The formally measured and suggested friction between warm- and cold-air masses (e.g., [11]) were directly visualized for the first time without interpolation or numerical simulation methods. The detrainment of cold air into the upper warm air was detected at this special cold-air pulse, which was found in former studies as well, albeit on other scales [11]. The visible detrainment at this cold-air pulse (upper part of the PS location at 23:20:45 LT, solid graph) can be described as a cold-air parcel, which extends into the warm air above and disappears by mixing processes. In the corresponding graph, this parcel becomes more noticeable due to the lower PS surface temperatures from TIR pixels 35 to 70 and less PS surface temperature variation at this height.
The cold-air pulse at 23:31 LT (Figure 8b) also shows turbulence in the transition zone to the warm air around and a detrainment of cold into warm air. However, the detrainment of the cold-air parcel seems to be a part of the remaining cold-air layer of the departing cold-air pulse. The detrainment is initially visualized as a flag-like cold-air parcel and disappears by a mixing process. In the corresponding graph at 23:31:30 LT (solid line), this effect becomes visible by a double oscillating graph (two inversions), which shows a second cold-air sublayer from TIR pixel 70 to 80.
Another type of turbulence in the cold-air flow can be seen in the transition zone of the flow situation in Figure 8c. This flow situation occurs during the measurement campaign on 22 September 2010 with a similar setup, as mentioned above. Here, a wave-like frontal cold-air region, as described and drafted by Monti et al. (2002) [11], but for a larger scale, occurs (red line at 20:04:38 LT, solid graph on the right). Mahrt (2010) described micro-fronts as common at the surface in the nocturnal boundary layer and characterized by sharp changes of wind and temperature [24]. Nauta (2011) collected micro-fronts in near-surface parts of drainage flow, on the same scale as that employed in the present study [19]. Moreover, the flow momentum in Figure 8c seems to push up the cold air, so that single smaller detrainments remain. The wave-like frontal region has a very sharp cold-air border without major turbulences, as shown in the solid graph with TIR pixels above 70 (Figure 8c). It can be generated by the leading edge of the cold-air pulses of drainage flows [24]. Finally it is not clear, if this flow characteristic can be identified as a cold-air micro-front, as described by [11,19,24], or is rather a mechanically induced phenomenon created by the surface roughness or the CAP downslope.
Distinct profiles of vertical temperature in the transition zone between the near-surface very stable inversion layer of cold-air pulses and the less stable, warmer air above were found in the micro-scale drainage flow analysis here, as well as confirmed by the results of former studies, measuring in other scales. This does not finally confirm the scale-invariance of detrainment air motions and the occurrence of micro-fronts, previously detected and described by, e.g., [11,19]; but the results with the TIR method indicate that transition zone phenomena in the micro-scale are similar to the ones of the meso-scale.
With TIR imagery, these profiles of the vertical temperature stratification could be analyzed in an unprecedented high-precision form and with visual components, which help to elucidate interesting processes using TIR image series and TIR videos.
4. Summary and Conclusions
This study applies a combined approach of standard and TIR measurements to analyze the nocturnal micro-scale cold-air flow patterns with high spatial and temporal precision. Focusing on the lowermost 2 m above the surface, the cold-air flow over a grass-covered gentle slope was characterized. A measurement setup was installed along the cold-air flow axis, consisting of standard instruments as well as one TIR camera. The TIR camera was pointed at an artificial projection screen (PS), monitoring the vertical PS surface temperature profile of the cold-air flowing downslope. The measurements were recorded on 23 July 2012. Besides numerical and single-image TIR analyses, TIR videos for different cold-air flow aspects were generated; these videos are presented in the Supplementary Materials online. By monitoring the PS using TIR imaging, the PS surface temperature changes indirectly show the near-surface air temperature changes, as evaluated by Grudzielanek and Cermak (2015) [22]. Looking at the vertical PS surface temperature profiles at the PS, typical cold-air flow oscillations were found, representing cold-air pulses flowing downslope, as expected from the literature (cf. [7,10,19]). Therefore, cold-air pulses with inversion heights within the height of the PS (about 2 m), as expected at gentle and length-limited slopes (cf. [7,16]), as well as PS overtopping cold-air pulses occurred. Cold-air pulse periods of 0.2 to 2.0 min were collected, which correlates very well with the findings of former studies (e.g., [19]).
These subperiods were characterized by different flow properties, addressing research question 1, based on higher or lower flow speeds and variances in PS surface temperatures and vertical PS surface temperature differences over time.
To address research question 2, some assumptions, mentioned in Section 1, could not be tested in this study. Already the very low cold-air flow speed (less than 1 m/s) over the complete measurement period limits a comparison to other studies. A strong stratification of the cold-air atmosphere could arise throughout the measurement period because of that.
It was found that not only the flow speed seems to be highly relevant for a high cold-air stratification of the cold-air pulses (e.g., [17,18]), but also a low flow speed variance over time, based on the data of measurement periods P2, P3, P4, and P6.
The results of the PS surface temperature profile analysis of the cold-air pulses show that the micro-scale cold-air flow within the lowermost 2 m above the ground also depends on different factors and their interaction, thus giving rise to very complex characteristics, such as stratification rate and vertical temperature profile variance over time in comparison to meso-scale drainage flow.
Additionally, it was found that the vertical PS surface temperature profiles of different cold-air pulses do not look similar when passing the PS, thus addressing research question 3. Different types of profile change over time occur, pointing out different cold-air pulse stratification rates and pulses with, e.g., a very strong, cool layer at the bottom.
The detrainment of the pulses’ cold-air into the warm air above, as formally detected in the meso-scale, were found here as well in the transition zone analysis, addressing research question 4. Additionally, micro-fronts at cold-air pulse onsets confirmed the findings of Monti et al. (2002) [11], Mahrt (2010) [24] and Nauta (2011) [19].
For future work on micro-scale cold-air flow analyses, methods should be combined (e.g., with further standard measurements, such as a high-precision spatial temperature, air pressure and wind sensor ensemble, as well as the fiber-optic method) to create a detailed three-dimensional (3D) impression of cold-air flow and cold-air oscillation with pulses. Using a method ensemble, limitations or data inaccuracy could be balanced. E.g., while the fiber-optic method is permeable to air, the TIR method is able to collect higher resolution data. In addition, vertical velocity could be used in the analysis of temperature profiles.
In the setup of the current study, the horizontal axis in the cold-air flow direction was observed. However, in addition to the inversion height and the length of the pulses downslope, the width is also interesting, especially for the calculation of cold-air volumes.
Furthermore, the next step for micro-scale cold-air flow analyses using TIR imaging should include the development of statistical methods on the vertical inversion stratification, transition zone parameters, and different impact factors, e.g., the surface roughness and the air temperature gradient between cold and warm air. Methods for automated analyses of the spatial TIR data should be developed. Moreover, data of different TIR camera perspectives should be combined as well as paired with an ensemble of standard measurements to gain a more representative dataset for future investigations.
Supplementary Materials
The following are available online at http://www.mdpi.com/2073-4433/9/12/498/s1. Video S1: Cold-air pulse transition zone related to Figure 8a; on 23 July 2012, 23:18–23:19 LT; TIR interval 1 s; video 10 Hz; Video S2: Cold-air pulse transition zone related to Figure 8b; on 23 July 2012, 23:31–23:32 LT; TIR interval 1 s; video 10 Hz; Video S3: Cold-air pulse transition zone related to Figure 8c; on 22 September 2010, 20:04–20:05 LT; TIR interval 1 s; video 5 Hz.
Author Contributions
A.M.G. proposed the topic, designed and performed the experimental study, performed the analyses, and wrote the paper. J.C. helped with the statistical analyses and data interpretation. All authors read and approved the final manuscript.
Funding
This research received no external funding.
Acknowledgments
The authors would like to thank the two anonymous reviewers and the editor for advice and encouragement. In addition, we acknowledge support by the DFG Open Access Publication Funds of the Ruhr-Universität Bochum.
Conflicts of Interest
The authors declare no conflict of interest.
References
- Novick, K.A.; Oishi, A.C.; Miniat, C.F. Cold air drainage flows subsidize montane valley ecosystem productivity. Glob. Chang. Biol. 2016, 22, 4014–4027. [Google Scholar] [CrossRef] [PubMed]
- Chemel, C.; Burns, P. Pollutant dispersion in a developing valley cold-air pool. Bound. Layer Meteorol. 2015, 154, 391–408. [Google Scholar] [CrossRef]
- Chemel, C.; Arduini, G.; Staquet, C.; Largeron, Y.; Legain, D.; Tzanos, D.; Paci, A. Valley heat deficit as a bulk measure of wintertime particulate air pollution in the Arve River Valley. Atmos. Environ. 2016, 128, 208–215. [Google Scholar] [CrossRef]
- Oke, T.R. The Heat Island of the Urban Boundary Layer: Characteristics, Causes and Effects. In Wind Climate in Cities; Cermak, J.E., Davenport, A.G., Plate, E.J., Viegas, D.X., Eds.; Springer: Dordrecht, The Netherlands, 1995; pp. 81–107. [Google Scholar]
- Fernando, H.J.S.; Zajic, D.; Di Sabatino, S.; Dimitrova, R.; Hedquist, B.; Dallman, A. Flow, turbulence, and pollutant dispersion in urban atmospheres. Phys. Fluids 2010, 22. [Google Scholar] [CrossRef]
- Defant, F. Zur Theorie der Hangwinde, nebst Bemerkungen zur Theorie der Berg- und Talwinde. Arch. Meteorol. Geophys. Bioklim. A 1949, 1, 421–450. [Google Scholar] [CrossRef]
- Mahrt, L. The near-calm stable boundary layer. Bound. Layer Meteorol. 2011, 140, 343–360. [Google Scholar] [CrossRef]
- Wagner, A. Theorie und Beobachtung der periodischen Gebirgswinde. In Gerlands Beiträge zur Geophysik; Akademische Verlagsgesellschaft: Leipzig, Germany, 1938; pp. 408–449. [Google Scholar]
- Whiteman, C.D. Mountain Meteorology. Fundamentals and Applications; Oxford University Press: New York, NY, USA, 2000. [Google Scholar]
- Mahrt, L. Stably stratified atmospheric boundary layers. Annu. Rev. Fluid Mech. 2014, 46, 23–45. [Google Scholar] [CrossRef]
- Monti, P.; Fernando, H.J.S.; Princevac, M.; Chan, W.C.; Kowalewski, T.A.; Pardyjak, E.R. Observations of flow and turbulence in the nocturnal Boundary Layer over a slope. J. Atmos. Sci. 2002, 59, 2513–2534. [Google Scholar] [CrossRef]
- Franke, J.; Tetzlaff, G. Zum Auftreten Interner Schwerewellen im Kaltluftfluss. In Meteorologische Rundschau; Deutsche Meteorologische Gesellschaft: Berlin, Germany, 1987; pp. 118–126. [Google Scholar]
- Aichele, H. Kaltluftpulsationen. In Meteorologische Rundschau; Deutsche Meteorologische Gesellschaft: Berlin, Germany, 1953; pp. 53–54. [Google Scholar]
- Lareau, N.P.; Horel, J.D. Dynamically induced displacements of a persistent cold-air pool. Bound. Layer Meteorol. 2015, 154, 291–316. [Google Scholar] [CrossRef]
- Foster, C.S.; Crosman, E.T.; Horel, J.D. Simulations of a Cold-Air Pool in Utah’s Salt Lake Valley: Sensitivity to Land Use and Snow Cover. Bound. Layer Meteorol. 2017, 164, 63–87. [Google Scholar] [CrossRef]
- Smedman, A.-S. Observations of a multi-level turbulence structure in a very stable atmospheric boundary layer. Bound. Layer Meteorol. 1988, 44, 231–253. [Google Scholar] [CrossRef]
- Mahrt, L.; Vickers, D.; Nakamura, R.; Soler, M.R.; Sun, J.; Burns, S.; Lenschow, D.H. Shallow Drainage Flows. Bound. Layer Meteorol. 2001, 101, 243–260. [Google Scholar] [CrossRef]
- Soler, M.R.; Infante, C.; Buenestado, P.; Mahrt, L. Observations of nocturnal drainage flow in a shallow gully. Bound. Layer Meteorol. 2002, 105, 253–273. [Google Scholar] [CrossRef]
- Nauta, L. Shallow Drainage Flows over Light Sloping Terrain during BLLAST 2011: Two Case Studies. Master’s Thesis, Wageningen University, Wageningen, The Netherlands, 2013. [Google Scholar]
- Zeeman, M.J.; Selker, J.S.; Thomas, C.K. Near-Surface Motion in the Nocturnal, Stable Boundary Layer Observed with Fibre-Optic Distributed Temperature Sensing. Bound. Layer Meteorol. 2015, 154, 189–205. [Google Scholar] [CrossRef]
- Pfister, L. Novel Insights into the Dynamics of Cold-Air Drainage and Pooling on a Gentle Slope from Fiber-Optic Distributed Temperature Sensing. Available online: http://www.bayceer.uni-bayreuth.de/meteo/en/top/diss/138327/MSc_thesis_Lena_Pfister.pdf (accessed on 24 August 2017).
- Grudzielanek, A.M.; Cermak, J. Capturing cold-air flow using thermal imaging. Bound. Layer Meteorol. 2015, 157, 321–332. [Google Scholar] [CrossRef]
- Geoportal NRW. DOP20. In Web Map Service; Für den Abdruck Gilt Die Datenlizenz Deutschland–Version 2.0; Geoportal NRW: Köln, Germany, 2017. [Google Scholar]
- Mahrt, L. Common microfronts and other solitary events in the nocturnal boundary layer. Q. J. R. Meteorol. Soc. 2010, 136, 1712–1722. [Google Scholar] [CrossRef]
© 2018 by the authors. Licensee MDPI, Basel, Switzerland. This article is an open access article distributed under the terms and conditions of the Creative Commons Attribution (CC BY) license (http://creativecommons.org/licenses/by/4.0/).