Temporal Dynamics of Nitrous Oxide Emission and Nitrate Leaching in Renovated Grassland with Repeated Application of Manure and/or Chemical Fertilizer

 , ,
, , 
Abstract
1. Introduction
2. Materials and Methods
2.1. Site Description
2.2. Experimental Designs and Management Practices
2.3. Gas Sampling and Analysis
2.4. Leachate Sampling and Analysis
2.5. Soil Sampling and Analysis
2.6. Meteorological Data Collection, Drainage, and NO3−–N Leaching Estimation
2.7. Plant N Uptake and Estimation of N Mineralization, Total Mineral N Input, and Mineral N Surplus
2.8. Statistical Analysis
3. Results
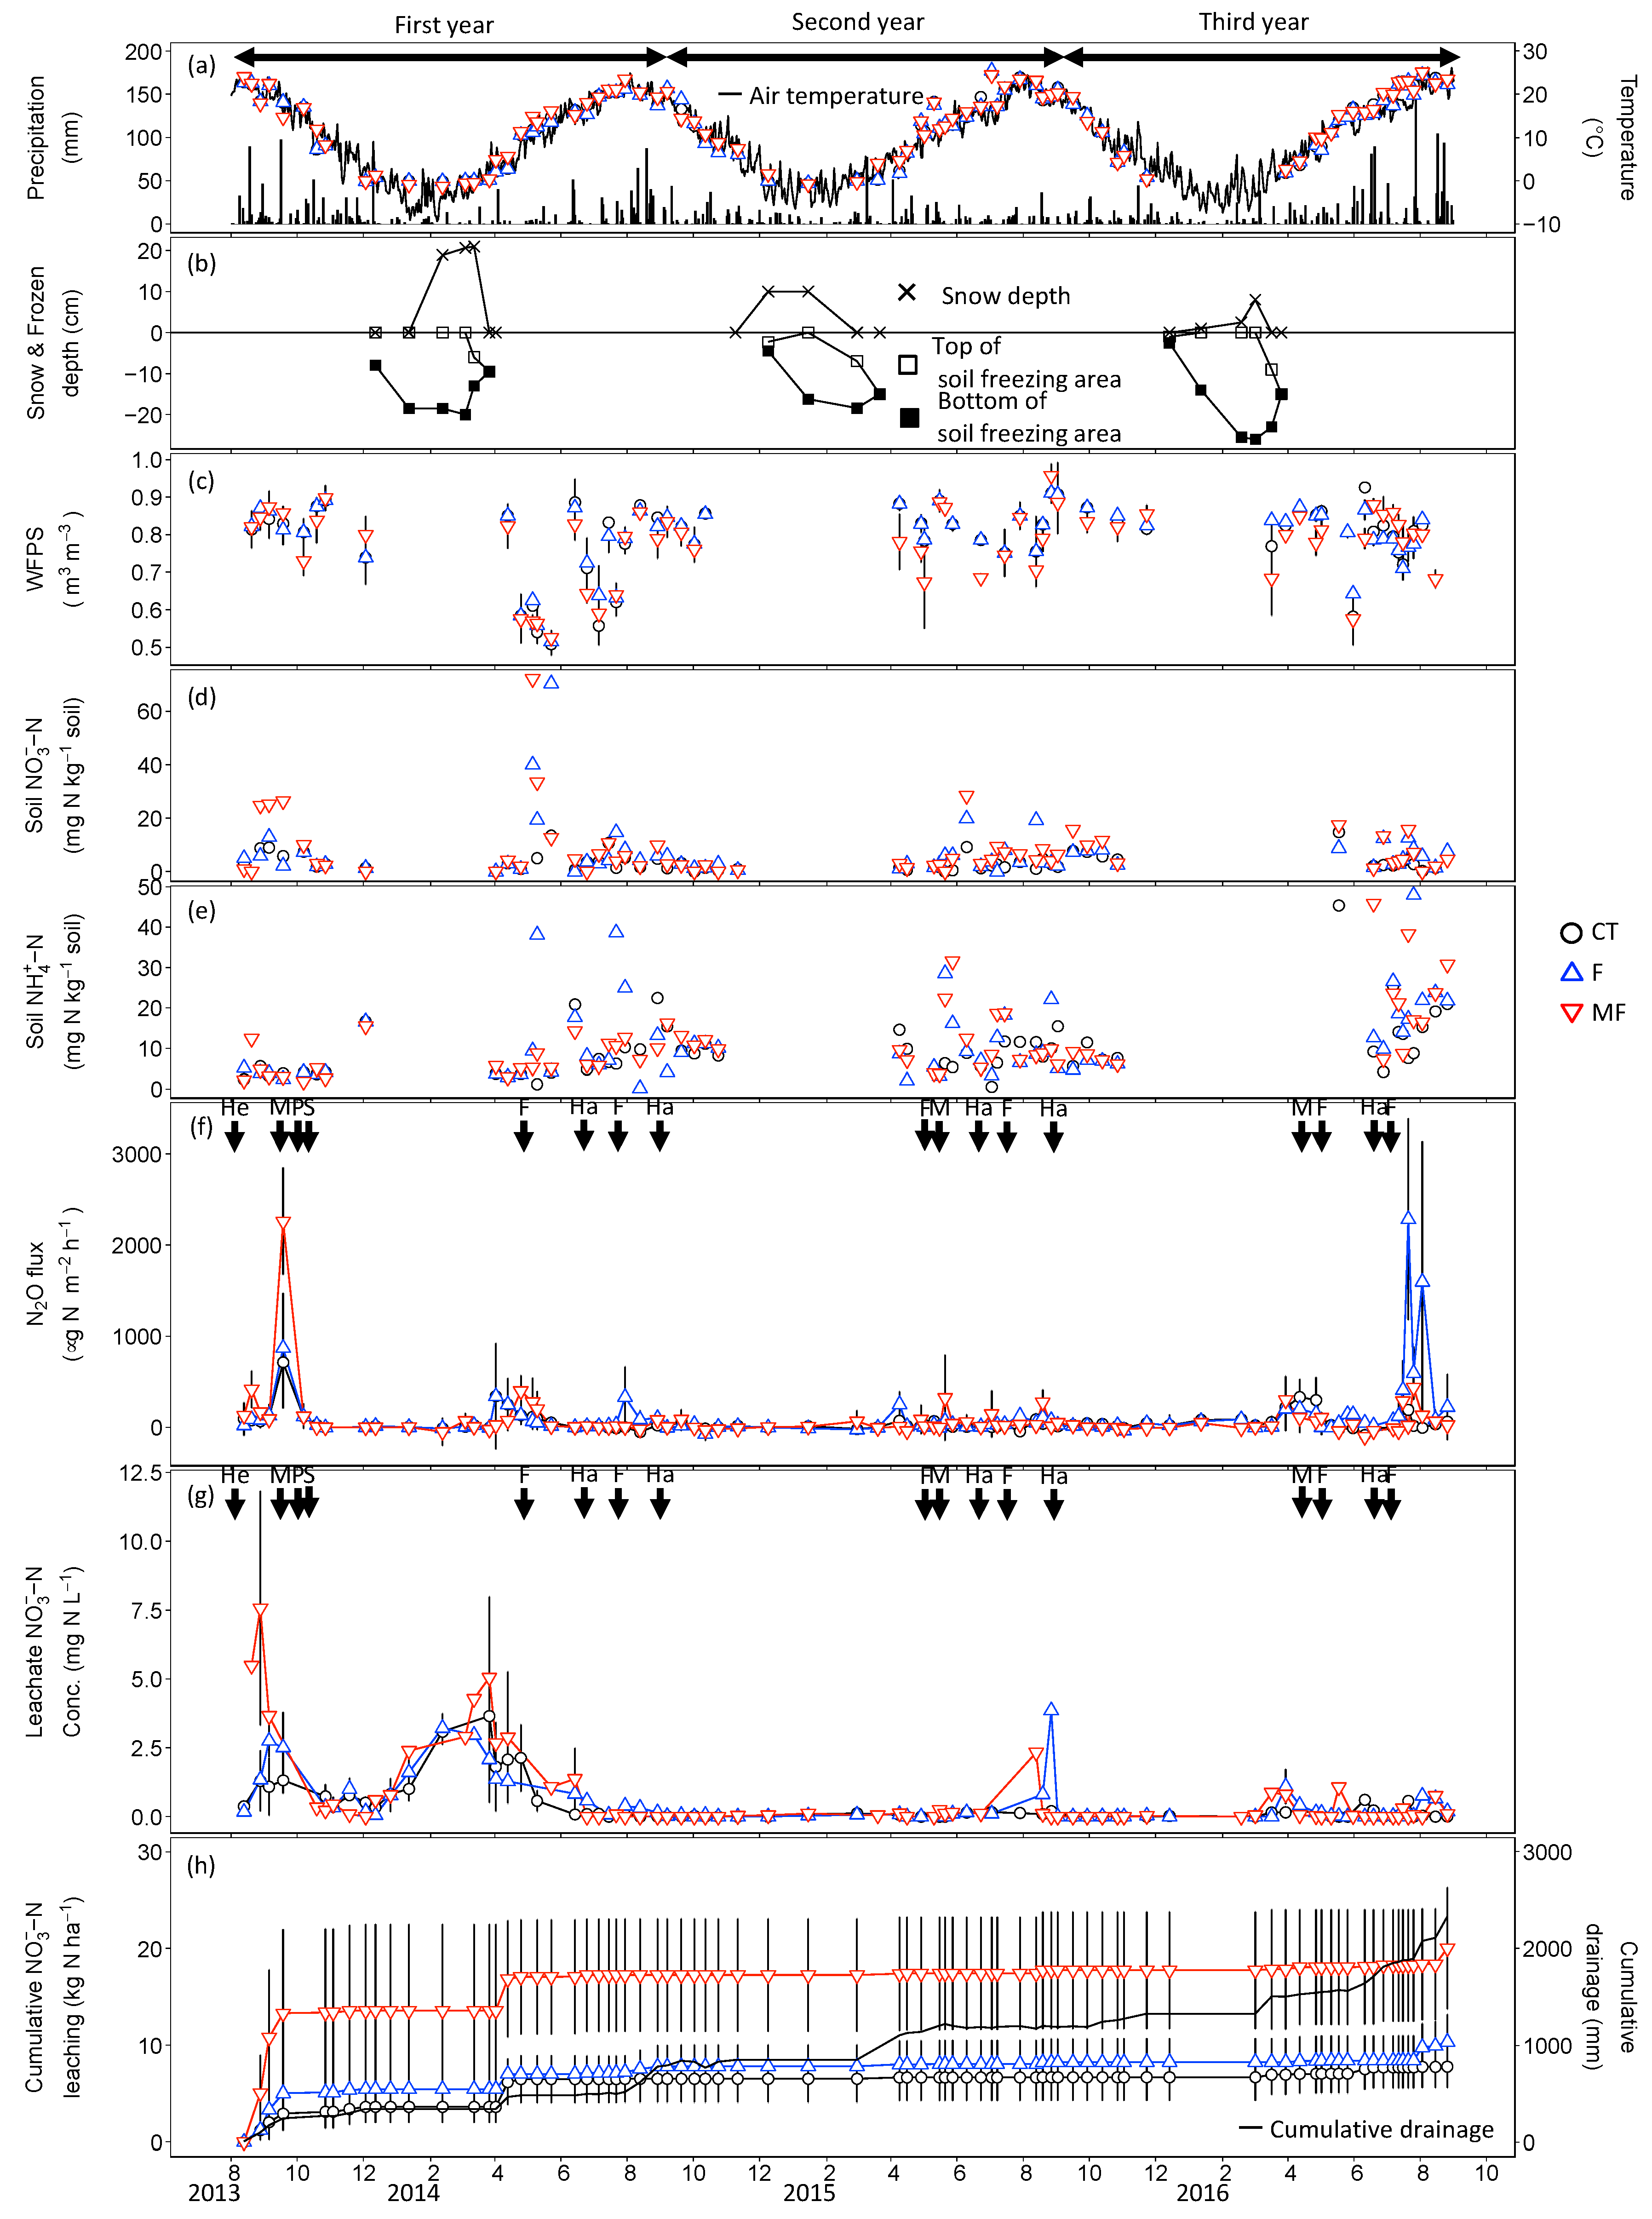
3.1. Weather and Soil Variables
3.2. Soil and Leachate Mineral N
3.3. N2O Flux
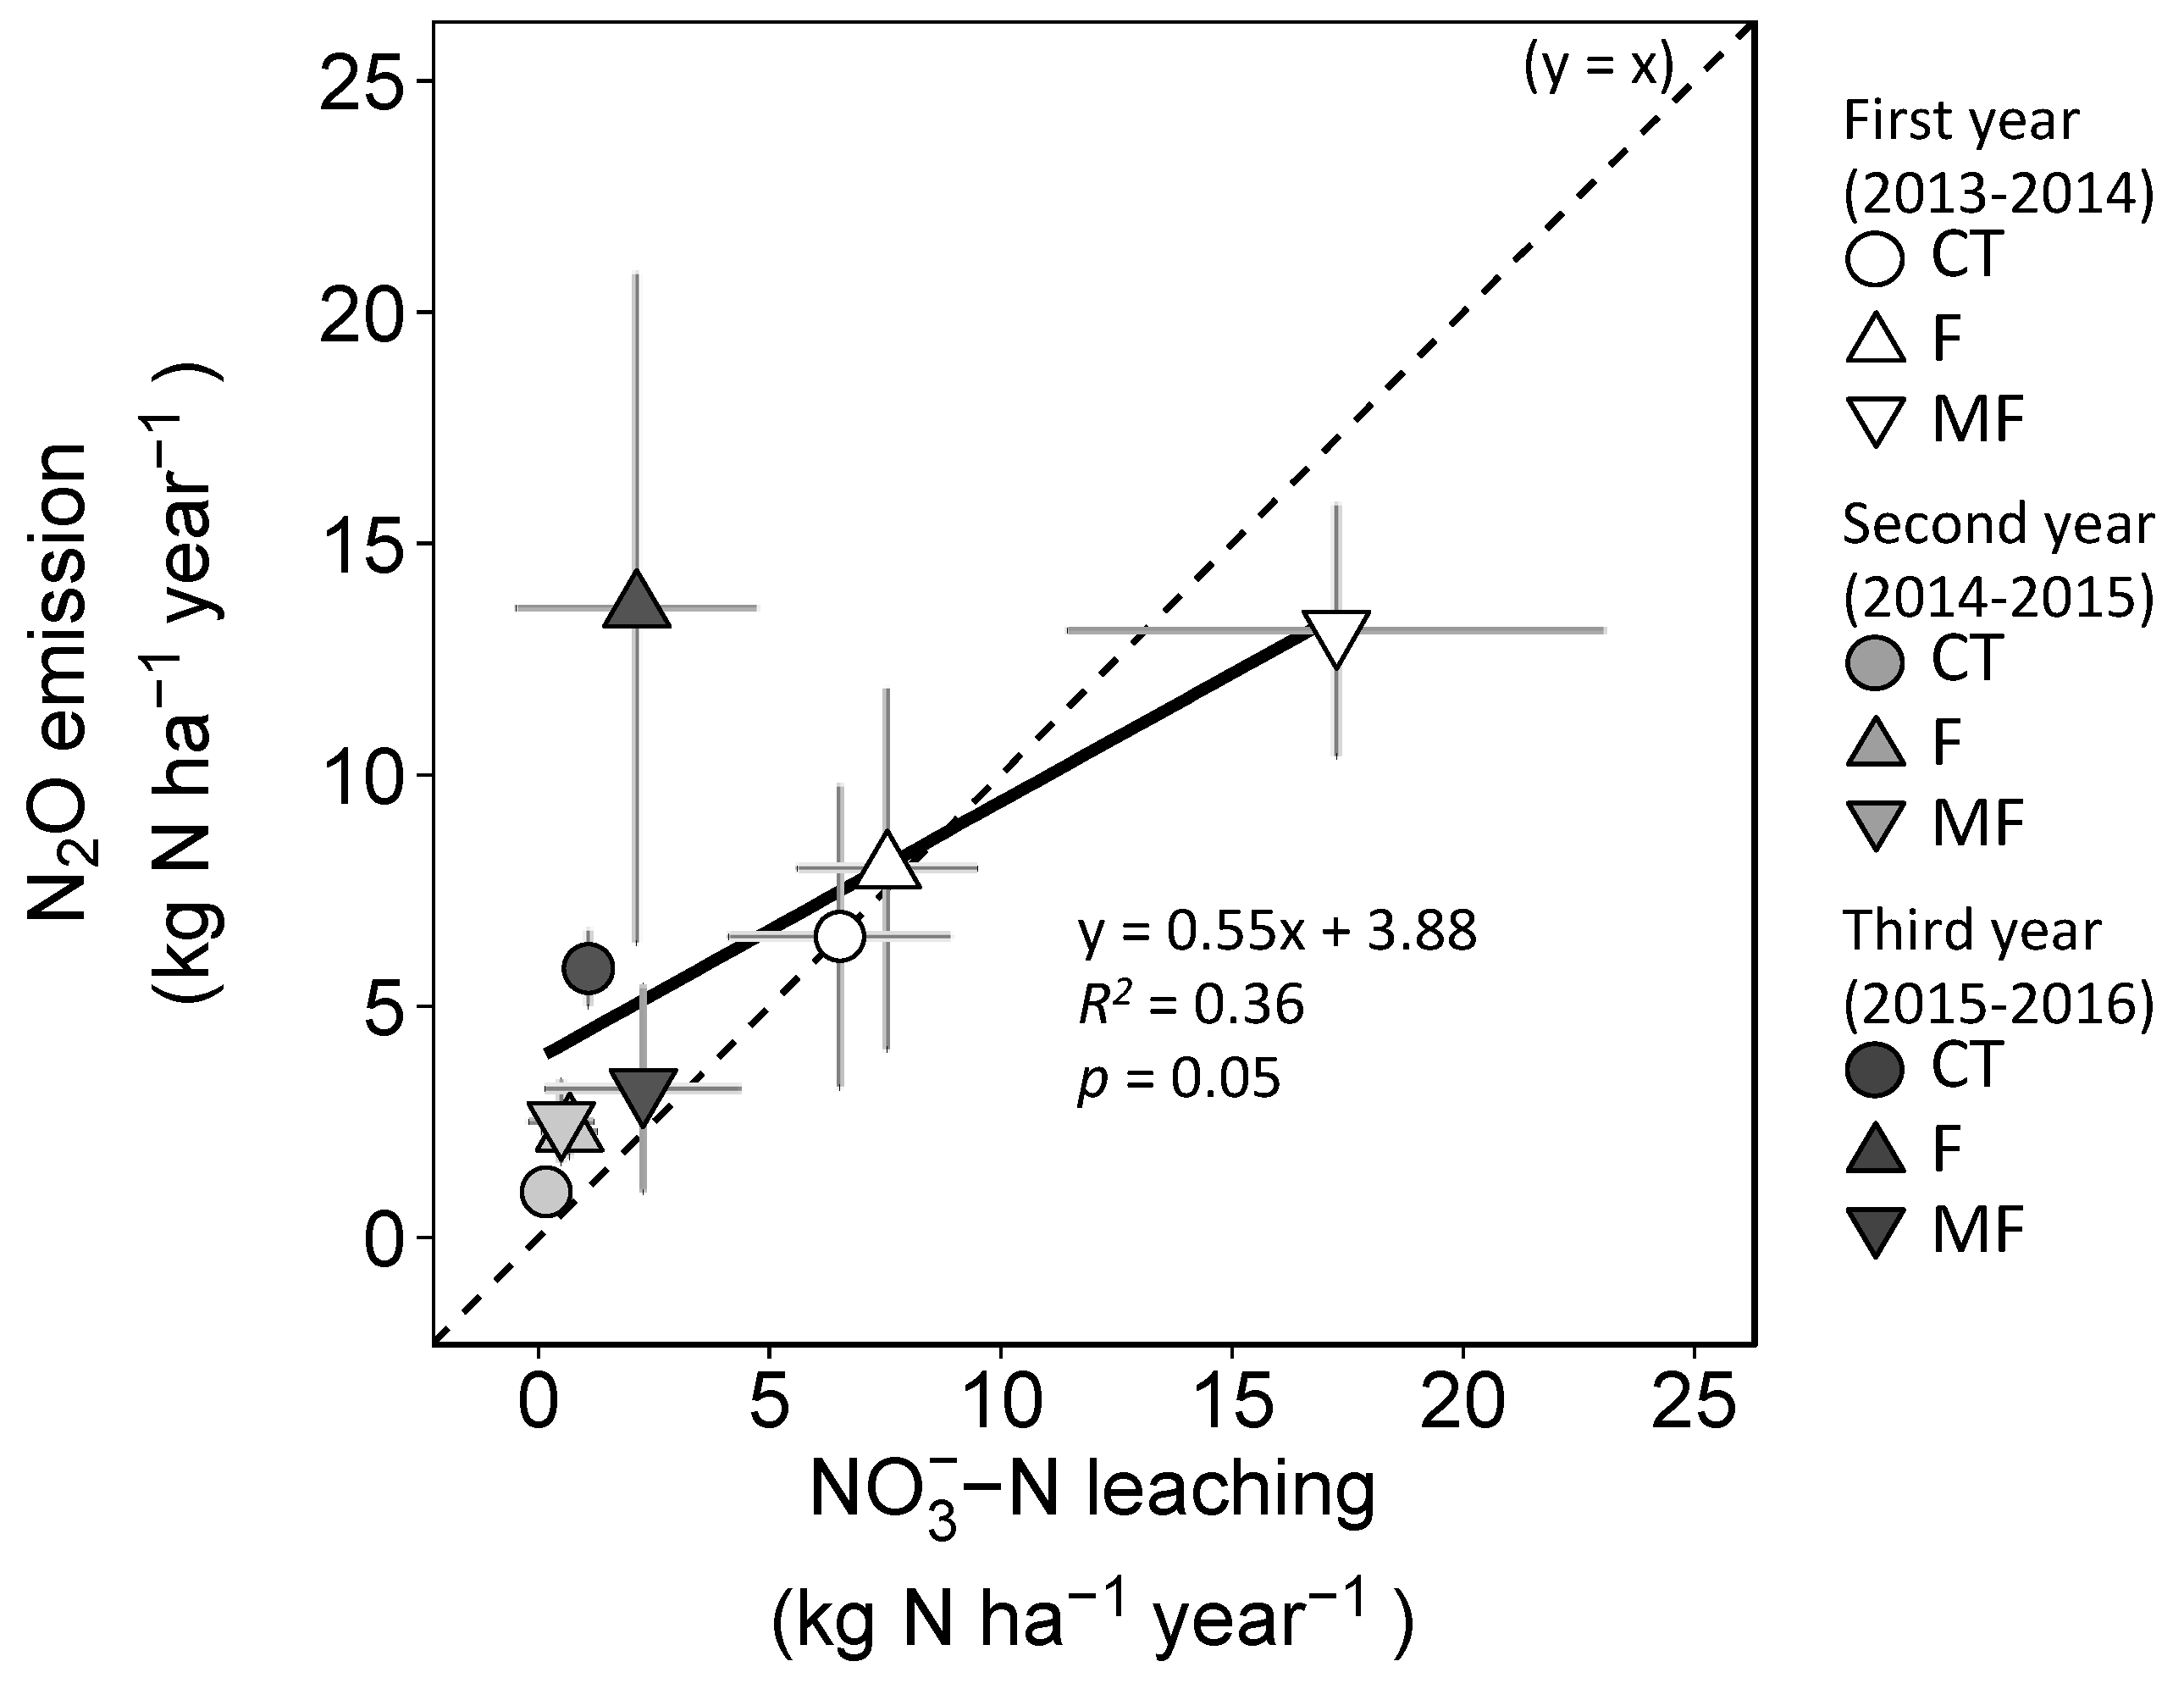
3.4. Cumulative N2O Emission and NO3−–N Leaching
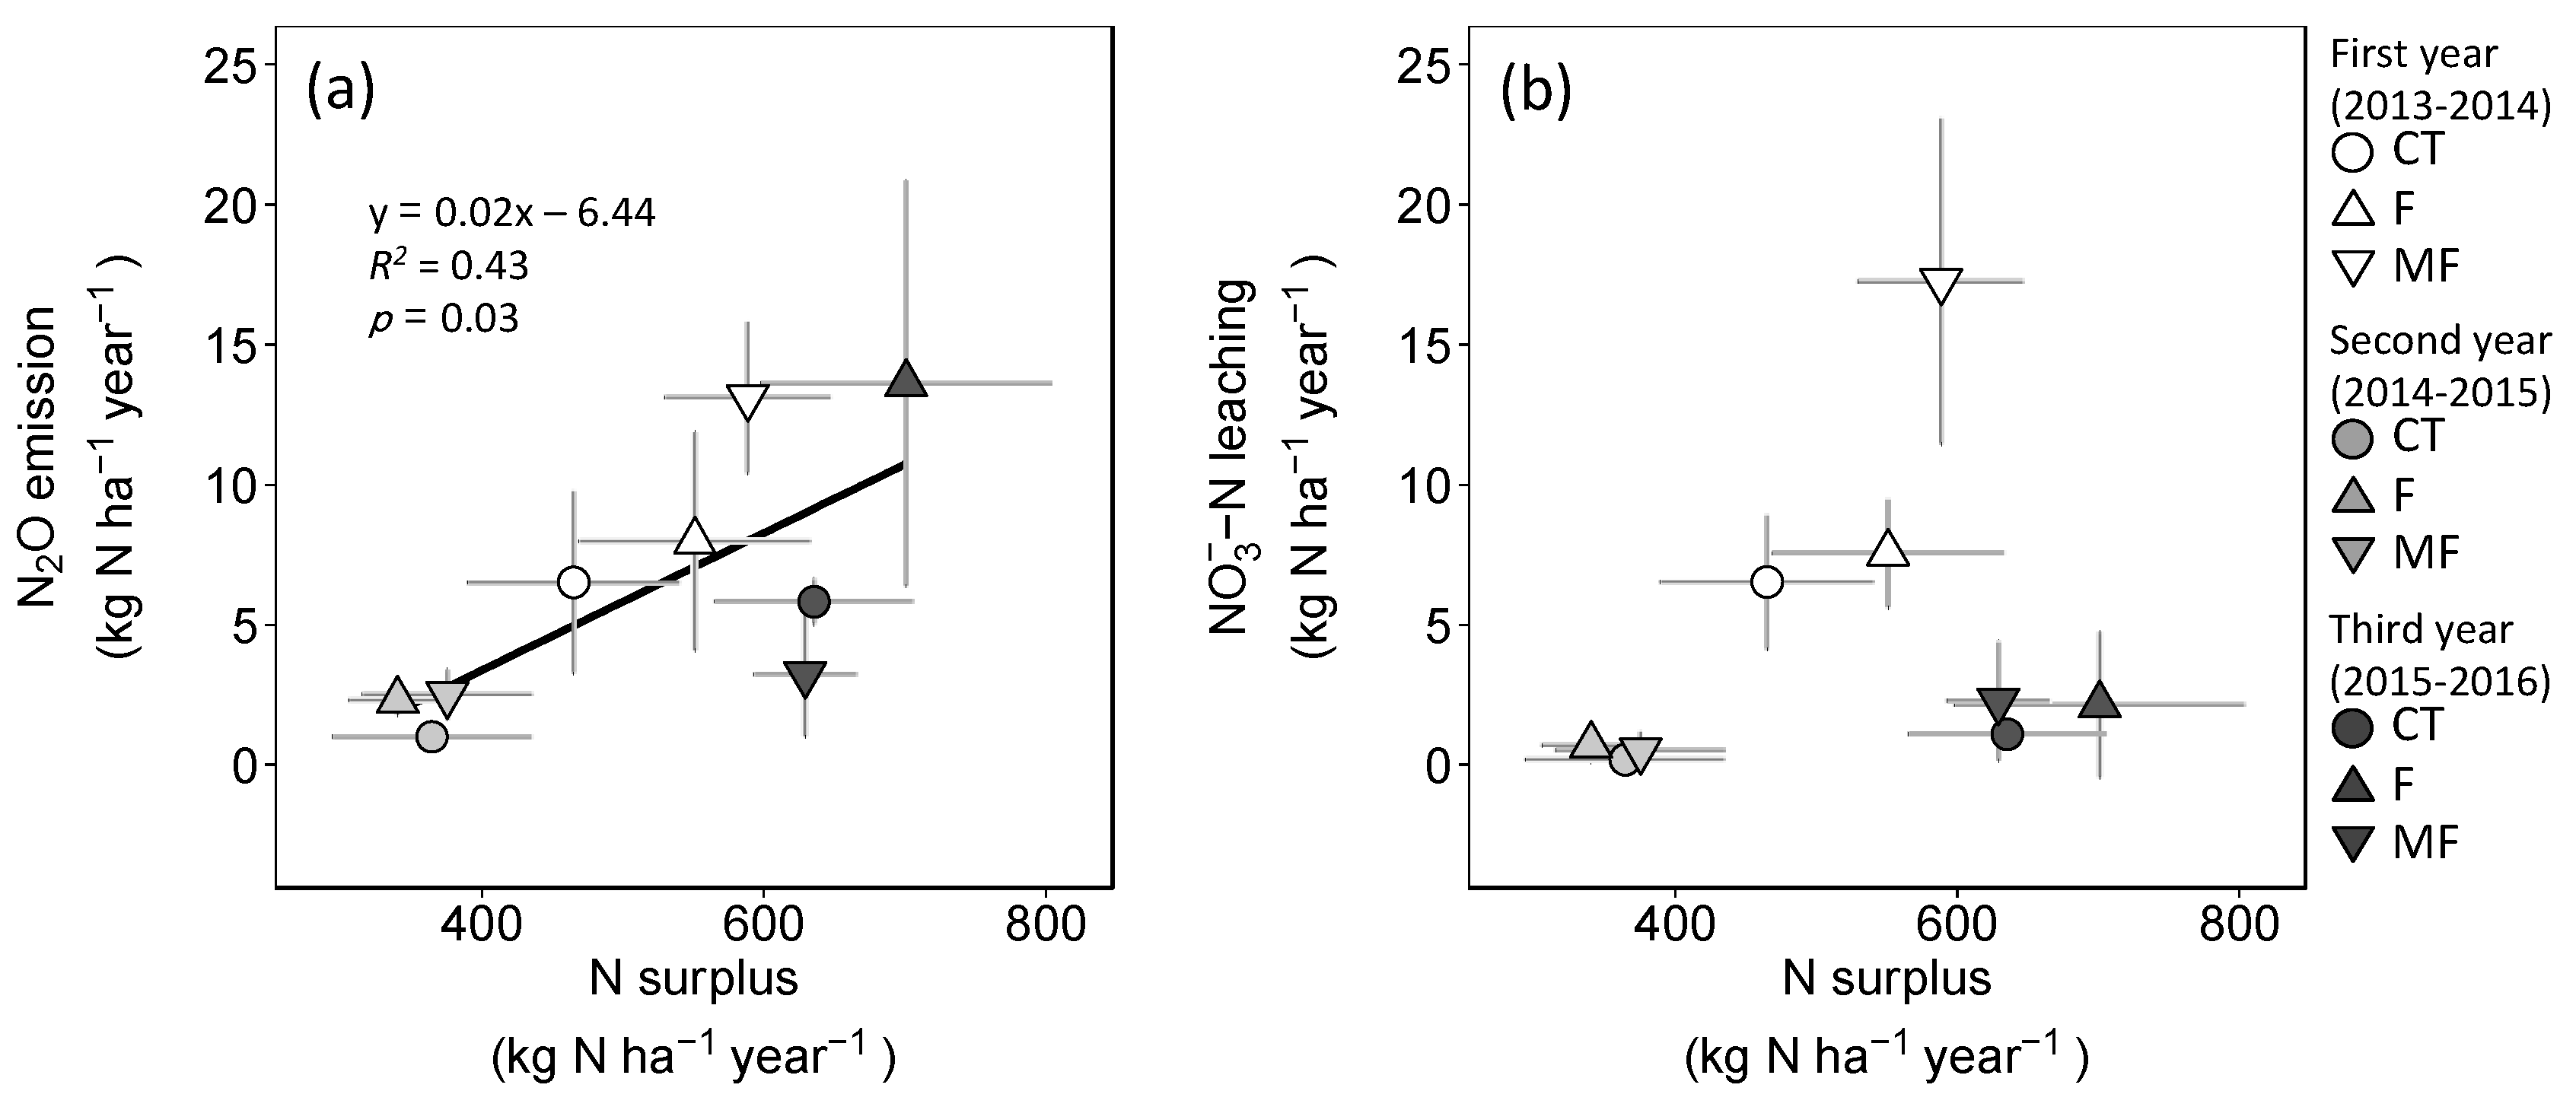
3.5. Plant N Uptake, Heterotrophic Respiration (RH), N Mineralization and Mineral N Surplus
4. Discussion
4.1. Temporal Nitrogen Dynamics Changes under Grassland Renovation and Permanent Management
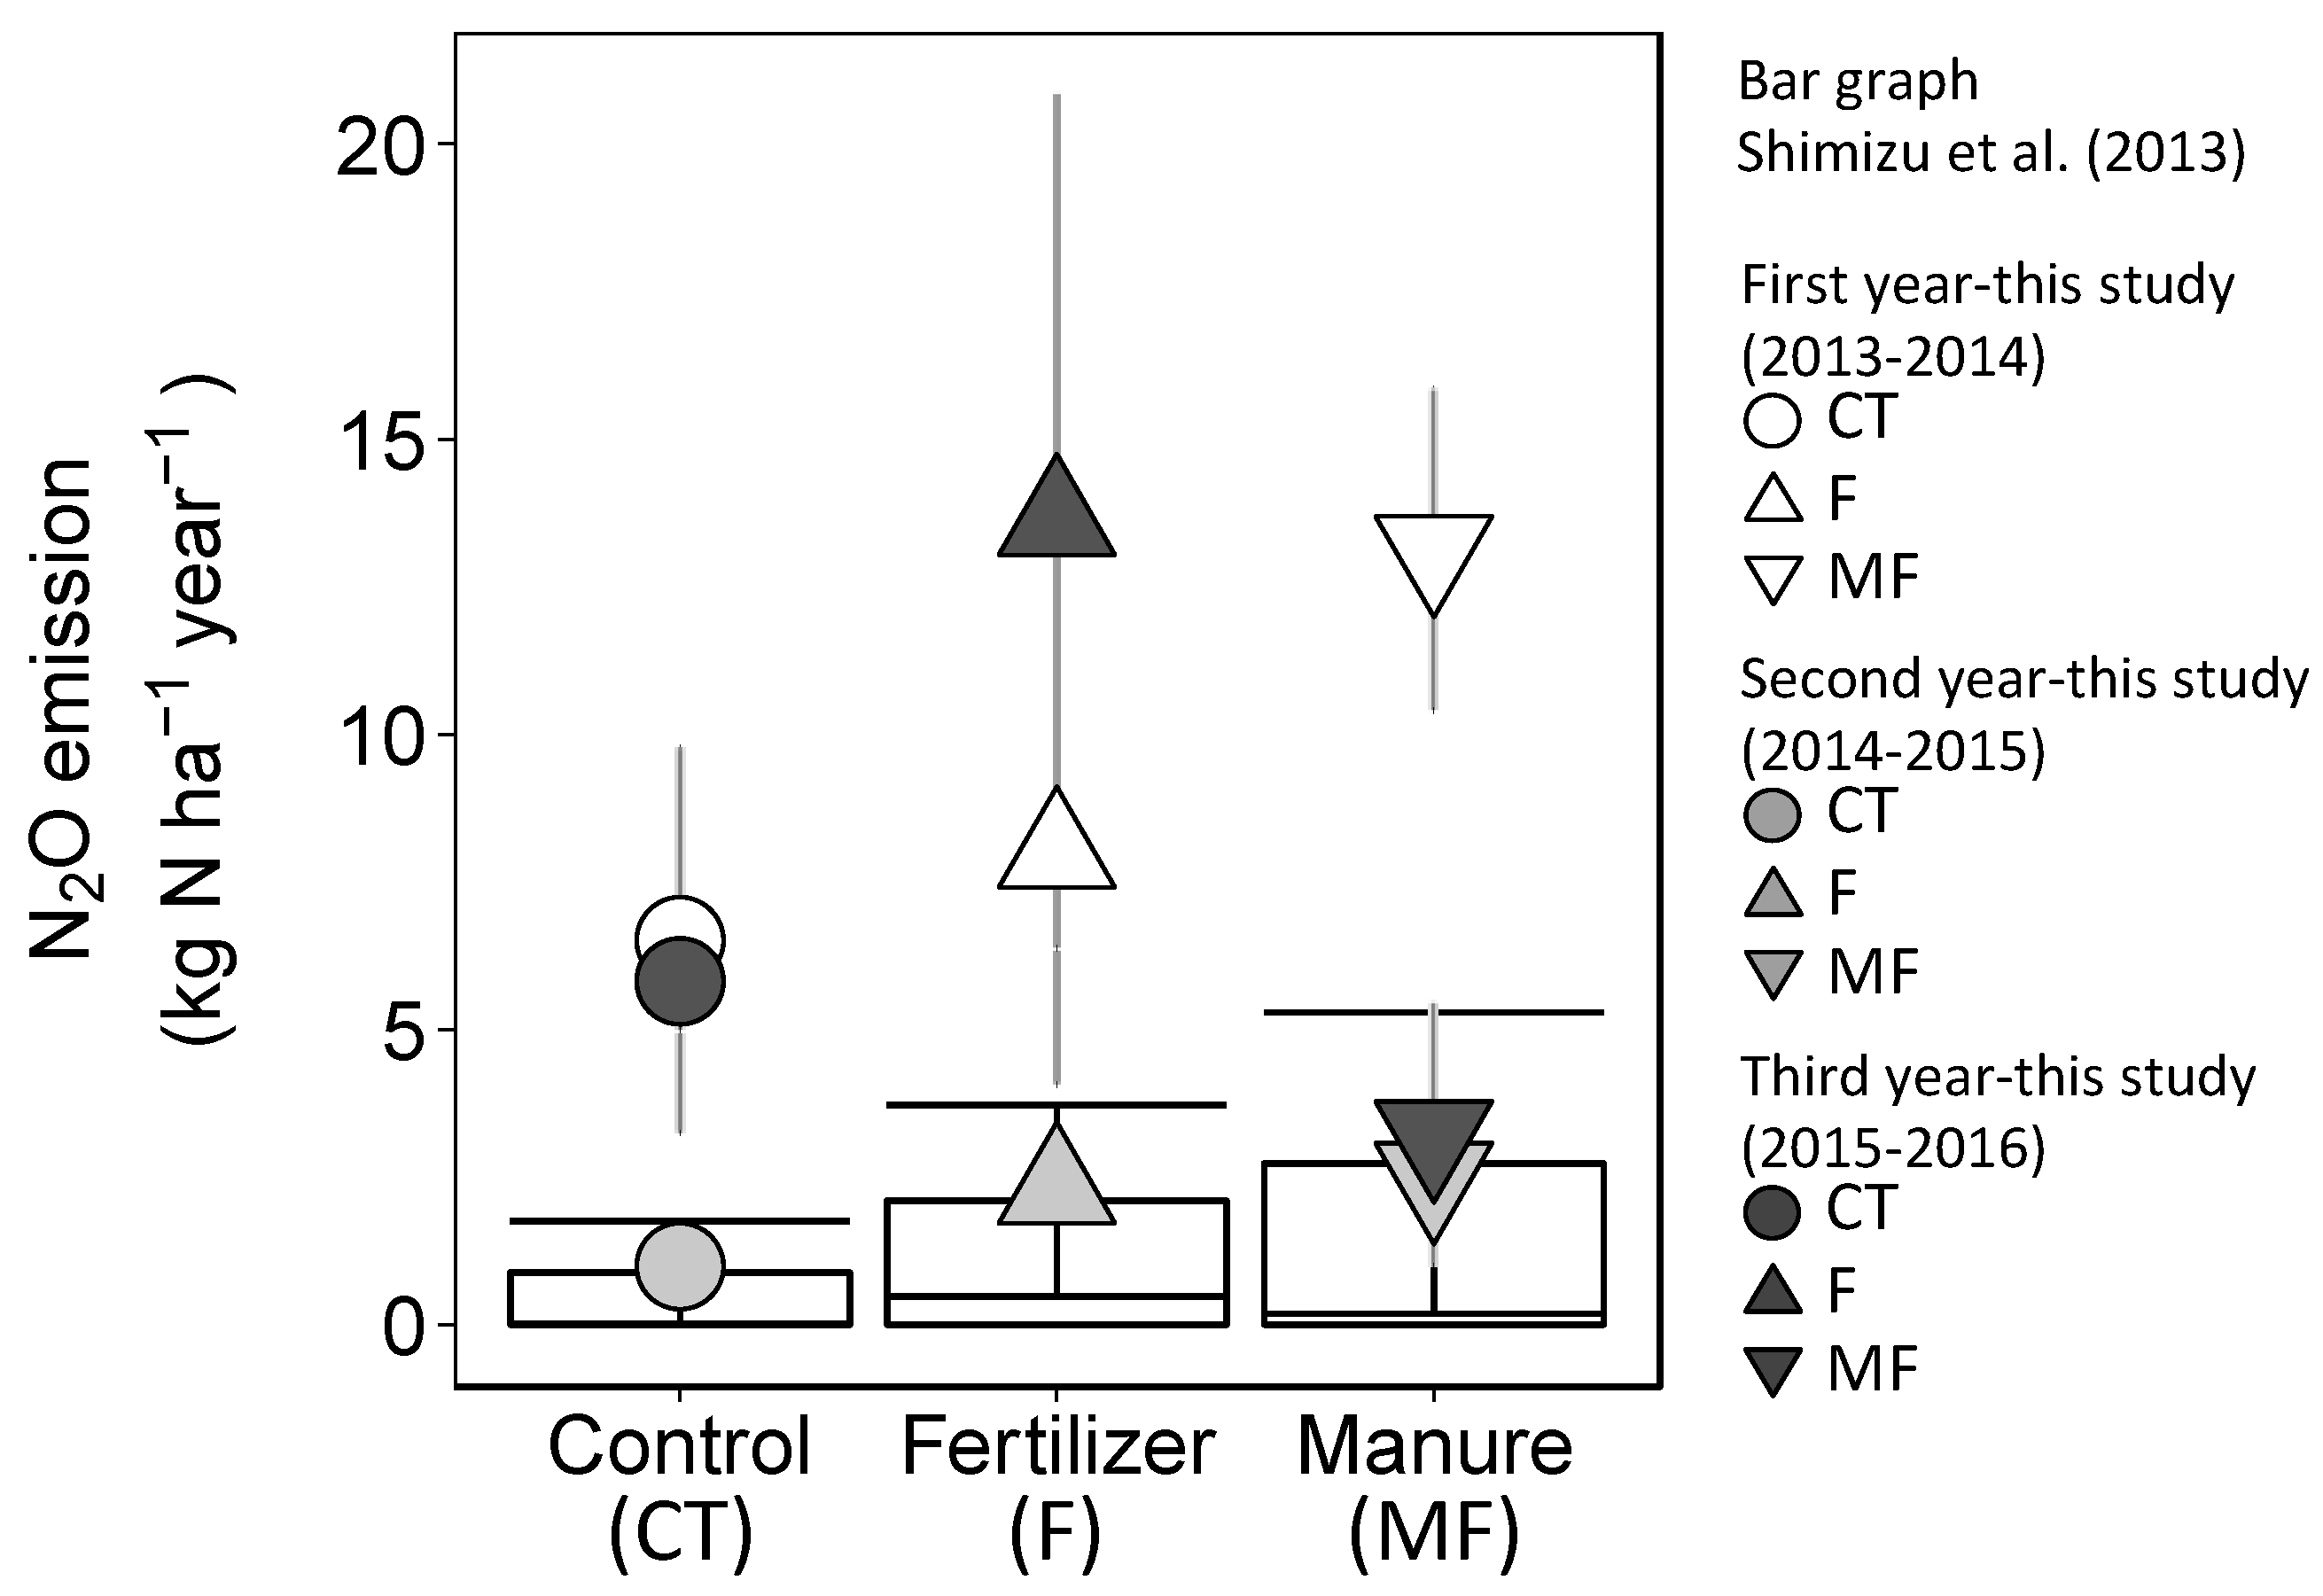
4.2. Annual N2O Emissions and Nitrate Leaching in Renovated Grassland
5. Conclusions
Supplementary Materials
Author Contributions
Funding
Acknowledgments
Conflicts of Interest
References
- Ministory of Agriculture, Forestroy and Fisheries Japan. The 90th Statistical Yearbook of Ministry of Agriculture, Forestry and Fisheries. Available online: http://www.maff.go.jp/e/data/stat/90th/index.html (accessed on 9 March 2018).
- Davies, M.G.; Smith, K.A.; Vinten, A.J.A. The mineralisation and fate of nitrogen following ploughing of grass and grass-clover swards. Biol. Fertil. Soils 2001, 33, 423–434. [Google Scholar] [CrossRef]
- Necpálová, M.; Casey, I.; Humphreys, J. Effect of ploughing and reseeding of permanent grassland on soil N, N leaching and nitrous oxide emissions from a clay-loam soil. Nutr. Cycl. Agroecosyst. 2013, 95, 305–317. [Google Scholar] [CrossRef]
- Six, J.; Elliott, E.T.; Paustian, K. Soil macroaggregate turnover and microaggregate formation: A mechanism for C sequestration under no-tillage agriculture. Soil Biol. Biochem. 2000, 32, 2099–2103. [Google Scholar] [CrossRef]
- Helgason, B.L.; Gregorich, E.G.; Janzen, H.H.; Ellert, B.H.; Lorenz, N.; Dick, R.P. Long-term microbial retention of residue C is site-specific anddepends on residue placement. Soil Biol. Biochem. 2014, 68, 231–240. [Google Scholar] [CrossRef]
- Mori, A.; Hojito, M. Grassland renovation increases N2O emission from a volcanic grassland soil in Nasu, Japan. Soil Sci. Plant Nutr. 2007, 53, 812–818. [Google Scholar] [CrossRef]
- Velthof, G.L.; Hoving, I.E.; Dolfing, J.; Smit, A.; Kuikman, P.J.; Oenema, O. Method and timing of grassland renovation affects herbage yield, nitrate leaching, and nitrous oxide emission in intensively managed grasslands. Nutr. Cycl. Agroecosyst. 2010, 86, 401–412. [Google Scholar] [CrossRef]
- Buchen, C.; Well, R.; Helfrich, M.; Fuß, R.; Kayser, M.; Gensior, A.; Benke, M.; Flessa, H. Soil mineral N dynamics and N2O emissions following grassland renewal. Agric. Ecosyst. Environ. 2017, 246, 325–342. [Google Scholar] [CrossRef]
- Reinsch, T.; Loges, R.; Kluß, C.; Taube, F. Renovation and conversion of permanent grass-clover swards to pasture or crops: Effects on annual N2O emissions in the year after ploughing. Soil Tillage Res. 2018, 175, 119–129. [Google Scholar] [CrossRef]
- Shepherd, M.A.; Hatch, D.J.; Jarvis, S.C.; Bhogal, A. Nitrate leaching from reseeded pasture. Soil Use Manag. 2001, 17, 97–105. [Google Scholar] [CrossRef]
- Shimizu, M.; Hatano, R.; Arita, T.; Kouda, Y.; Mori, A.; Matsuura, S.; Niimi, M.; Jin, T.; Desyatkin, A.R.; Kawamura, O.; et al. The effect of fertilizer and manure application on CH4 and N2O emissions from managed grasslands in Japan. Soil Sci. Plant Nutr. 2013, 59, 69–86. [Google Scholar] [CrossRef]
- Smith, K.A.; Beckwith, C.P.; Chalmers, A.G.; Jackson, D.R. Nitrate leaching following autumn and winter application of animal manures to grassland. Soil Use Manag. 2002, 18, 428–434. [Google Scholar] [CrossRef]
- Maeda, M.; Zhao, B.; Ozaki, Y.; Yoneyama, T. Nitrate leaching in an Andisol treated with different types of fertilizers. Environ. Pollut. 2003, 121, 477–487. [Google Scholar] [CrossRef]
- Mori, A.; Hojito, M. Effect of combined application of manure and fertilizer on N2O fluxes from a grassland soil in Nasu, Japan. Agric. Ecosyst. Environ. 2012, 160, 40–50. [Google Scholar] [CrossRef]
- Shimizu, M.; Marutani, S.; Desyatkin, A.R.; Jin, T.; Hata, H.; Hatano, R. The effect of manure application on carbon dynamics and budgets in a managed grassland of Southern Hokkaido, Japan. Agric. Ecosyst. Environ. 2009, 130, 31–40. [Google Scholar] [CrossRef]
- Shimizu, M.; Limin, A.; Desyatkin, A.R.; Jin, T.; Mano, M.; Ono, K.; Miyata, A.; Hata, H.; Hatano, R. Effect of manure application on seasonal carbon fluxes in a temperate managed grassland in Southern Hokkaido, Japan. Catena 2015, 133, 474–485. [Google Scholar] [CrossRef]
- Mukumbuta, I.; Shimizu, M.; Jin, T.; Nagatake, A.; Hata, H.; Kondo, S.; Kawai, M.; Hatano, R. Nitrous and nitric oxide emissions from a cornfield and managed grassland: 11 years of continuous measurement with manure and fertilizer applications, and land-use change. Soil Sci. Plant Nutr. 2017, 1–15. [Google Scholar] [CrossRef]
- Shiga, H.; Ohyama, N.; Maeda, K.; Suzuki, M. An evaluation of different organic materials based on their decomposition patterns in paddy soils. Bull. Natl. Agric. Res. Cent. 1985, 5, 1–9. [Google Scholar]
- Katayanagi, N.; Hatano, R. Spatial variability of greenhouse gas fluxes from soils of various land uses on a livestock farm in Southern Hokkaido, Japan. Phyt. Ann. Rei Bot. 2005, 45, 309–318. [Google Scholar] [CrossRef]
- Toma, Y.; Hatano, R. Effect of crop residue C:N ratio on N2O emissions from Gray Lowland soil in Mikasa, Hokkaido, Japan: Original article. Soil Sci. Plant Nutr. 2007, 53, 198–205. [Google Scholar] [CrossRef]
- Li, M.; Shimizu, M.; Hatano, R. Evaluation of N2O and CO2 hot moments in managed grassland and cornfield, southern Hokkaido, Japan. Catena 2015, 133, 1–13. [Google Scholar] [CrossRef]
- Katayanagi, N.; Hatano, R. N2O emissions during the freezing and thawing periods from six fields in a livestock farm, southern Hakkaido, Japan. Soil Sci. Plant Nutr. 2012, 58, 261–271. [Google Scholar] [CrossRef]
- Pampolino, M.F.; Urushiyama, T.; Hatano, R. Detection of nitrate leaching through bypass flow using pan lysimeter, suction cup, and resin capsule. Soil Sci. Plant Nutr. 2000, 46, 703–711. [Google Scholar] [CrossRef]
- Ayers, G.P.; Fukuzaki, N.; Gillett, R.W.; Selleck, P.W.; Powell, J.C.; Hara, H. Thymol as a biocide in Japanese rainwater. J. Atmos. Chem. 1998, 30, 301–310. [Google Scholar] [CrossRef]
- Limin, A.; Shimizu, M.; Mano, M.; Ono, K.; Miyata, A.; Wada, H.; Nozaki, H.; Hatano, R. Manure application has an effect on the carbon budget of a managed grassland in southern Hokkaido, Japan. Soil Sci. Plant Nutr. 2015, 61, 857–872. [Google Scholar] [CrossRef]
- R Core Team. R: A Language and Environment for Statistical Computing; R Foundation for statistical Computing: Vienna, Austria, 2018. [Google Scholar]
- Hasegawa, S.; Eguchi, S. Soil water conditions and flow characteristics in the subsoil of a volcanic ash soil: Findings from field monitoring from 1997 to 1999. Soil Sci. Plant Nutr. 2002, 48, 227–236. [Google Scholar] [CrossRef][Green Version]
- Kusa, K.; Sawamoto, T.; Hu, R.; Hatano, R. Comparison of N2O and CO2 concentrations and fluxes in the soil profile between a Gray Lowland soil and an Andosol. Soil Sci. Plant Nutr. 2010, 56, 186–199. [Google Scholar] [CrossRef]
- van Groenigen, J.W.; Georgius, P.J.; Van Kessel, C.; Hummelink, E.W.J.; Velthof, G.L.; Zwart, K.B. Subsoil 15N–N2O concentrations in a sandy soil profile after application of 15N-fertilizer. Nutr. Cycl. Agroecosyst. 2005, 72, 13–25. [Google Scholar] [CrossRef]
- Müller, C.; Stevens, R.J.; Laughlin, R.J.; Jäger, H.J. Microbial processes and the site of N2O production in a temperate grassland soil. Soil Biol. Biochem. 2004, 36, 453–461. [Google Scholar] [CrossRef]
- Risk, N.; Snider, D.; Wagner-Riddle, C. Mechanisms leading to enhanced soil nitrous oxide fluxes induced by freeze–thaw cycles. Can. J. Soil Sci. 2013, 93, 401–414. [Google Scholar] [CrossRef]
- Yanai, Y.; Hirota, T.; Iwata, Y.; Nemoto, M.; Nagata, O.; Koga, N. Accumulation of nitrous oxide and depletion of oxygen in seasonally frozen soils in northern Japan—Snow cover manipulation experiments. Soil Biol. Biochem. 2011, 43, 1779–1786. [Google Scholar] [CrossRef]
- Müller, C.; Martin, M.; Stevens, R.J.; Laughlin, R.J.; Kammann, C.; Ottow, J.C.G.; Jäger, H.J. Processes leading to N2O emissions in grassland soil during freezing and thawing. Soil Biol. Biochem. 2002, 34, 1325–1331. [Google Scholar] [CrossRef]
- DeLuca, T.H.; Keeney, D.R.; McCarty, G.W. Effect of freeze-thaw-events on mineralization of soil nitrogen. Biol. Fertil. Soils 1992, 14, 116–120. [Google Scholar] [CrossRef]
- Schimel, J.P.; Clein, J.S. Microbial response to freeze-thaw cycles in tundra and taiga soils. Soil Biol. Biochem. 1996, 28, 1061–1066. [Google Scholar] [CrossRef]
- Cowan, N.J.; Levy, P.E.; Famulari, D.; Anderson, M.; Drewer, J.; Carozzi, M.; Reay, D.S.; Skiba, U.M. The influence of tillage on N2O fluxes from an intensively managed grazed grassland in Scotland. Biogeosciences 2016, 13, 4811–4821. [Google Scholar] [CrossRef]
- Krol, D.J.; Jones, M.B.; Williams, M.; Richards, K.G.; Bourdin, F.; Lanigan, G.J. The effect of renovation of long-term temperate grassland on N2O emissions and N leaching from contrasting soils. Sci. Total Environ. 2016, 560–561, 233–240. [Google Scholar] [CrossRef] [PubMed]
- Dennis, S.J.; Cameron, K.C.; Di, H.J.; Moir, J.L.; Staples, V.; Sills, P.; Richards, K.G. Reducing nitrate losses from simulated grazing on grassland lysimeters in Ireland using a nitrification inhibitor (dicyandiamide). Biol. Environ. 2012, 112, 79–89. [Google Scholar] [CrossRef]
- Shimizu, M.; Marutani, S.; Desyatkin, A.R.; Jin, T.; Nakano, K.; Hata, H.; Hatano, R. Nitrous oxide emissions and nitrogen cycling in managed grassland in Southern Hokkaido, Japan. Soil Sci. Plant Nutr. 2010, 56, 676–688. [Google Scholar] [CrossRef]


| Treatment | Bulk Density g cm−3 | Total Carbon g C kg soil−1 | Total Nitrogen g N kg soil−1 |
|---|---|---|---|
| F area | 0.76 ± 0.06 a | 4.73 ± 0.74 b | 0.45 ± 0.06 b |
| MF area | 0.75 ± 0.06 a | 5.72 ± 0.99 a | 0.51 ± 0.07 a |
| Year after Renovation | Treatment | Fertilizer Type | T-C | T-N | P2O5 | K2O |
|---|---|---|---|---|---|---|
| kg ha−1 | ||||||
| First year | F | Chemical fertilizer | 0 | 150 | 108 | 212 |
| 2013–2014 | MF | Chemical fertilizer | 0 | 47 | 47 | 50 |
| Manure | 3591 | 182 | 167 | 115 | ||
| Second year | F | Chemical fertilizer | 0 | 104 | 40 | 141 |
| 2014–2015 | MF | Chemical fertilizer | 0 | 57 | 22 | 69 |
| Manure | 4193 | 165 | 209 | 144 | ||
| Third year | F | Chemical fertilizer | 0 | 145 | 117 | 190 |
| 2015–2016 | MF | Chemical fertilizer | 0 | 86 | 67 | 115 |
| Manure | 5110 | 202 | 254 | 175 | ||
| Soil and Leachate Variables | N2O Flux (µg N m−2 h−1) | |||
|---|---|---|---|---|
| First Year (2013–2014) | Second Year (2014–2015) | Third Year (2015–2016) | Combined Year (2013–2016) | |
| soil temperature | 0.29 ** | 0.39 *** | 0.13 n.s | 0.17 * |
| WFPS | −0.16 n.s | −0.13 n.s | −0.19 n.s | −0.11 n.s |
| soil pH | −0.43 *** | −0.09 n.s | −0.08 n.s | −0.27 *** |
| soil NO3−–N | 0.19 n.s | 0.24 n.s | 0.08 n.s | 0.23 ** |
| soil NH4+ –N | −0.49 *** | 0.26 * | 0.11 n.s | −0.1 n.s |
| soil NO3−–N + NH4+ –N | −0.14 n.s | 0.33 * | 0.13 n.s | 0.09 n.s |
| soil WEOC | −0.05 n.s | 0.10 n.s | 0.08 n.s | −0.1 n.s |
| Leachate NO3−–N conc. | 0.28 * | −0.02 n.s | 0.43 *** | 0.26 *** |
| Year | Treatment | N2O Emission kg N2O–N ha−1 year−1 | Nitrate Leaching kg NO3−–N ha−1 year−1 | ||||
|---|---|---|---|---|---|---|---|
| First year | CT | 6.51 ± 3.26 ab | 6.52 ± 2.41 a | ||||
| (2013–2014) | F | 7.98 ± 3.91 ab | 7.55 ± 1.95 a | ||||
| MF | 13.12 ± 2.72 a | 17.26 ± 5.82 a | |||||
| Second year | CT | 0.99 ± 0.18 b | 0.18 ± 0.31 c | ||||
| (2014–2015) | F | 2.30 ± 0.55 bc | 0.68 ± 0.60 bc | ||||
| MF | 2.51 ± 0.89 bc | 0.50 ± 0.70 bc | |||||
| Third year | CT | 5.82 ± 0.82 ab | 1.09 ± 0.34 ab | ||||
| (2015–2016) | F | 13.61 ± 7.24 a | 2.13 ± 2.61ab | ||||
| MF | 3.22 ± 2.23 bc | 2.27 ± 2.13 ab | |||||
| ANOVA | df | f value | p-value | df | f value | p-value | |
| Treatment (T) | 2 | 4.42 | 0.025 | 2 | 1.86 | 0.176 | |
| Year (Y) | 2 | 32.74 | < 0.001 | 2 | 32.19 | < 0.001 | |
| T × Y | 4 | 5.50 | 0.003 | 4 | 0.67 | 0.674 | |
| Year | Treatment | Chemical Fertilizer N Input | GMsoil | GMmanure | Plant N Uptake | Mineral N Surplus |
|---|---|---|---|---|---|---|
| kg N ha−1 year−1 | ||||||
| First year | CT | 0 | 526 ± 72 | 0 | 61 ± 9 | 465 ± 76 |
| F | 150 | 547 ± 64 | 0 | 147 ± 45 | 551 ± 82 | |
| MF | 47 | 492 ± 67 | 151 ± 14 | 101 ± 7 | 589 ± 59 | |
| Second year | CT | 0 | 440 ± 60 | 0 | 75 ± 17 | 365 ± 71 |
| F | 104 | 476 ± 40 | 0 | 240 ± 25 | 340 ± 35 | |
| MF | 57 | 411 ± 56 | 80 ± 40 | 173 ± 5 | 375 ± 60 | |
| Third year | CT | 0 | 682 ± 73 | 0 | 46 ± 11 | 635 ± 70 |
| F | 145 | 720 ± 133 | 0 | 164 ± 30 | 701 ± 103 | |
| MF | 86 | 637 ± 68 | 64 ± 14 | 158 ± 7 | 629 ± 37 | |
© 2018 by the authors. Licensee MDPI, Basel, Switzerland. This article is an open access article distributed under the terms and conditions of the Creative Commons Attribution (CC BY) license (http://creativecommons.org/licenses/by/4.0/).
Share and Cite
Nagatake, A.; Mukumbuta, I.; Yasuda, K.; Shimizu, M.; Kawai, M.; Hatano, R. Temporal Dynamics of Nitrous Oxide Emission and Nitrate Leaching in Renovated Grassland with Repeated Application of Manure and/or Chemical Fertilizer. Atmosphere 2018, 9, 485. https://doi.org/10.3390/atmos9120485
Nagatake A, Mukumbuta I, Yasuda K, Shimizu M, Kawai M, Hatano R. Temporal Dynamics of Nitrous Oxide Emission and Nitrate Leaching in Renovated Grassland with Repeated Application of Manure and/or Chemical Fertilizer. Atmosphere. 2018; 9(12):485. https://doi.org/10.3390/atmos9120485
Chicago/Turabian StyleNagatake, Arata, Ikabongo Mukumbuta, Kaho Yasuda, Mariko Shimizu, Masahito Kawai, and Ryusuke Hatano. 2018. "Temporal Dynamics of Nitrous Oxide Emission and Nitrate Leaching in Renovated Grassland with Repeated Application of Manure and/or Chemical Fertilizer" Atmosphere 9, no. 12: 485. https://doi.org/10.3390/atmos9120485
APA StyleNagatake, A., Mukumbuta, I., Yasuda, K., Shimizu, M., Kawai, M., & Hatano, R. (2018). Temporal Dynamics of Nitrous Oxide Emission and Nitrate Leaching in Renovated Grassland with Repeated Application of Manure and/or Chemical Fertilizer. Atmosphere, 9(12), 485. https://doi.org/10.3390/atmos9120485