Article

Natural Ventilation of a Small-Scale Road Tunnel by Wind Catchers: A CFD Simulation Study

1
School of Atmospheric Sciences, Sun Yat-sen University, Guangzhou 510275, China
2
Guangdong Province Key Laboratory for Climate Change and Natural Disaster Studies, Sun Yat-sen University, Guangzhou 510275, China
3
School of the Built Environment, University of Reading, Reading RG6 6UR, UK
*
Authors to whom correspondence should be addressed.
Atmosphere 2018, 9(10), 411; https://doi.org/10.3390/atmos9100411
Submission received: 29 July 2018 / Revised: 14 October 2018 / Accepted: 15 October 2018 / Published: 20 October 2018
(This article belongs to the Special Issue Recent Advances in Urban Ventilation Assessment and Flow Modelling)

Abstract

:
Providing efficient ventilation in road tunnels is essential to prevent severe air pollution exposure for both drivers and pedestrians in such enclosed spaces with heavy vehicle emissions. Longitudinal ventilation methods like commercial jet fans have been widely applied and confirmed to be effective for introducing external fresh air into road tunnels that are shorter than 3 km. However, operating tunnel jet fans is energy consuming. Therefore, for small-scale (~100 m–1 km) road tunnels, mechanical ventilation methods might be highly energetically expensive and unaffordable. Many studies have found that the use of wind catchers could improve buildings’ natural ventilation, but their effect on improving natural ventilation in small-scale road tunnels has, hitherto, rarely been studied. This paper, therefore, aims to quantify the influence of style and arrangement of one-sided flat-roof wind catchers on ventilation performance in a road tunnel. The concept of intake fraction (IF) is applied for ventilation and pollutant exposure assessment in the overall tunnel and for pedestrian regions. Computational fluid dynamics (CFD) methodology with a standard k-epsilon turbulence model is used to perform a three-dimensional (3D) turbulent flow simulation, and CFD results have been validated by wind-tunnel experiments for building cross ventilation. Results show that the introduction of wind catchers would significantly enhance wind speed at pedestrian level, but a negative velocity reduction effect and a near-catcher recirculation zone can also be found. A special downstream vortex extending along the downstream tunnel is found, helping remove the accumulated pollutants away from the low-level pedestrian sides. Both wind catcher style and arrangement would significantly influence the ventilation performance in the tunnel. Compared to long-catcher designs, short-catchers would be more effective for providing fresh air to pedestrian sides due to a weaker upstream velocity reduction effect and smaller near-catcher recirculation zone. In long-catcher cases, IF increases to 1.13 ppm when the wind catcher is positioned 240 m away from the tunnel entrance, which is almost twice that in short-catcher cases. For the effects of catcher arrangements, single, short-catcher, span-wise, shifting would not help dilute pollutants effectively. Generally, a design involving a double short-catcher in a parallel arrangement is the most recommended, with the smallest IF, i.e., 61% of that in the tunnel without wind catchers (0.36 ppm).

1. Introduction

With the development of urban transportation networks, urban road tunnels have gained popularity and can be commonly found in many large cities. These tunnels provide an efficient transportation process for vehicles and offer a much safer public traveling experience for pedestrians. Besides, they are core connections between different transportation systems like metro stations and bus stops, coupled with the provision of shade and commercial opportunities.
A road tunnel, as a semi-enclosed space, accommodating both vehicles and pedestrians, is a place of concern for exposure to air pollution. According to the city air quality report for the Barbican, London, UK [1], air pollution is quite severe in vehicle-pedestrian tunnels, with the concentration of pollutants like carbon monoxide (CO) and nitrogen dioxide (NO2) dramatically exceeding the EU mean annual target. The highest monthly mean NO2 concentration in the Beech Street tunnel in the City of London was found in November (30% higher than the EU target). Keyte et al. [2] conducted field measurements of polycyclic aromatic hydrocarbons (PAH) in tunnels in Birmingham and Paris which found that the mean PAH concentration in a tunnel was approximately 4.5 times higher than that in the ambient environment. Similar results of severe air pollution in road tunnels are also revealed by Kim et al. [3] and Wingfors et al. [4]. Thus, improvement on ventilation performance in the vehicle-pedestrian tunnels is necessary. Ventilation performance in tunnels is always poor due to the semi-enclosed space, and therefore supplying clean external air into the inner tunnel has become the priority for road tunnel ventilation design.
Many effective methodologies for enhancing tunnel ventilation have been proposed and investigated by researchers. Betta et al. [5] studied the optimal pitch angle of the tunnel jet fans, which could induce the greatest amount of fresh air from the outdoor environment. The possibility of improving the inner-tunnel ventilation by a set of spaced jet fans fixed on the top of the tunnel has also been explored [6,7,8]. The results showed that the performance of the commercial jet fans varies dramatically with the number, pitch angle, and position of jet fans, whilst the best pitch angle varied along with traffic conditions: When there is no traffic, the best pitch angle is 6 degrees and, during traffic jams, the pitch angle should be maintained between 2 and 4 degrees. Besides, ventilation performance in curved tunnels with jet fans was also investigated by Wang et al. [9]. This kind of longitudinal ventilation scheme with jet fans is effective and commonly used in tunnels less than 3 km [5,7]. However, the operation of such ventilation engines is energy consuming. According to Peeling et al. [10], most of the energy consumption in tunnels is due to lighting and ventilation, and the surveys from sample tunnels in Australia, Norway, and the Netherlands indicate that tunnel consumption could reach 356 kWh per meter of tunnel per annum. What is more, tunnel jet fans would also generate severe noise in the tunnel, which is not favored by pedestrians. Hence, new types of effective and energy-efficient ventilation schemes should be explored. Natural ventilation could possibly be the most energy-saving method for inner-tunnel ventilation in small-scale tunnels. Harish [11] investigated the performance of ceiling openings in a tunnel for removing smoke and hot gases during fire emergencies. This kind of natural ventilation approach is commonly studied by researchers into buoyancy-driven tunnel ventilation [12,13,14,15], but it tends to be ineffective for providing wind-driven ventilation.
Wind catchers—a traditional building design—are commonly used for providing natural ventilation for buildings in hot and arid or humid areas. Dehghani-sanij and Soltani [16,17] gave a specific review of proposed wind catcher designs for buildings. Both traditional and the most advanced design of wind towers have been introduced and compared by reviewers. While traditional styles of design like one-sided and two-sided wind towers would be very efficient for providing indoor ventilation and cooling effects in windy regions, the design still has limitations in facility protection and operation. The effect of wind catchers on building ventilation performance has been widely studied. An experimental study conducted by Afshin et al. [18] showed that the ventilation capacity of wind catchers increases dramatically with increases in the external wind speed. Two-sided or multi-opening wind catchers can provide more effective air exchange capacity between inner rooms and the outdoor environment. However, the flow rate would decrease with the increase in the wind incident angle and the number of catcher openings [18,19]. Optimal arrangements and shapes of wind catcher have also been investigated [19,20,21,22]. The wind catchers with a curved or inclined roof are able to supply higher ventilation rates compared with the ones with a flat roof. Catcher-induced flow is sensitive to the wind incident angle and the wind catchers in a staggered arrangement would induce a much stronger wind by preventing the blockage effect from the upstream flow. The thermal effects of wind catchers, like indoor thermal comfort and cooling capacity, have also been explored by Hosseini et al. [23] and Calautit and Hughes [24]. Bhadori introduced wind towers with wet columns or wet surfaces [25]. In this design, water evaporation helps increase the cooling potential of wind towers and helps introduce much cooler air into the building. Soltani et al. investigated the proposed design of wind towers with wetted surfaces by analyzing velocity, total pressure, and the pressure coefficient in different wind speed conditions [17]. Results show that the ventilation performance of wind towers is much greater at much higher wind velocities due to relatively smaller eddies within the wind tower.
Haghighi et al. [26] studied the possibility of applying wind catchers to an integrated indoor ventilation and cooling system in a complex indoor construction. Calautit et al. [22] first simulated and analyzed pollutant distribution in an indoor environment and discussed its dilution with the arrangement of wind catchers. The literature reported that wind catchers could help dilute indoor pollutants but were also likely to recirculate pollutants from upstream regions. Generally, wind catchers have been proved to be an effective natural ventilation and cooling approach for various indoor environments. However, the possibility of applying such types of architectural design in small-scale tunnels has not yet been investigated. This research aims to explore the ventilation capability of wind catchers in vehicle-pedestrian tunnels and propose a new avenue for natural ventilation in small-scale tunnels.
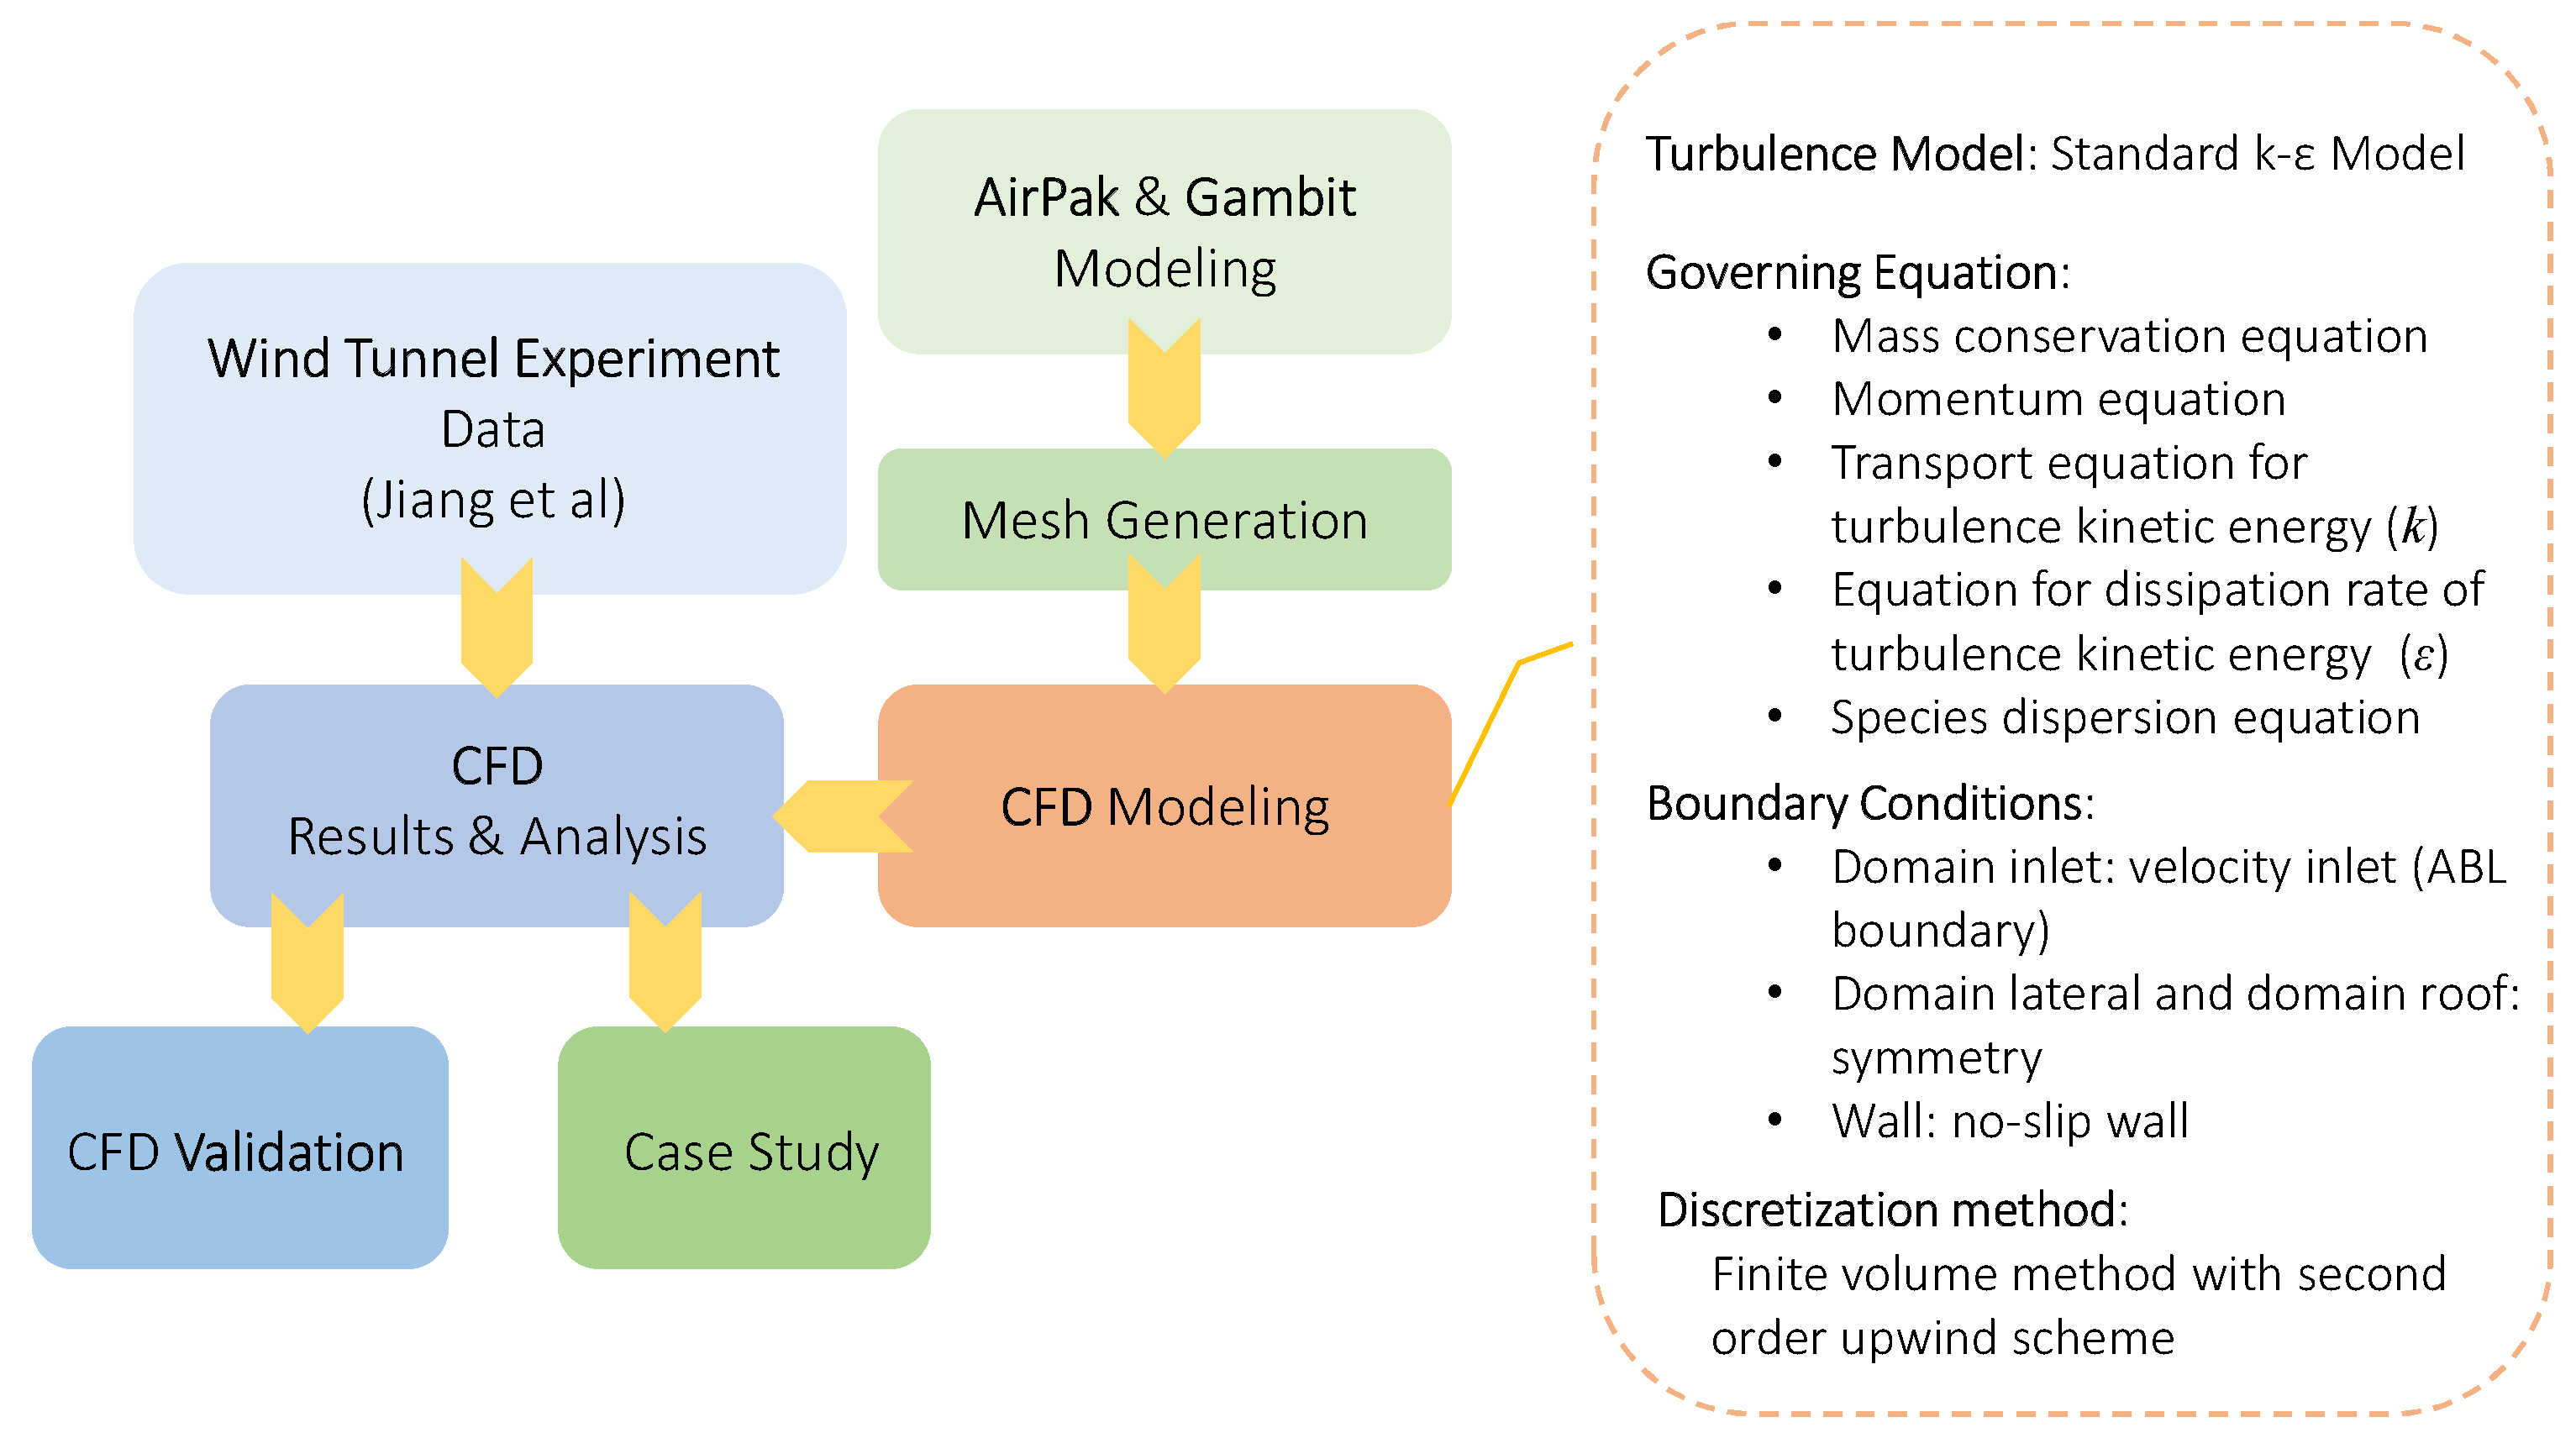
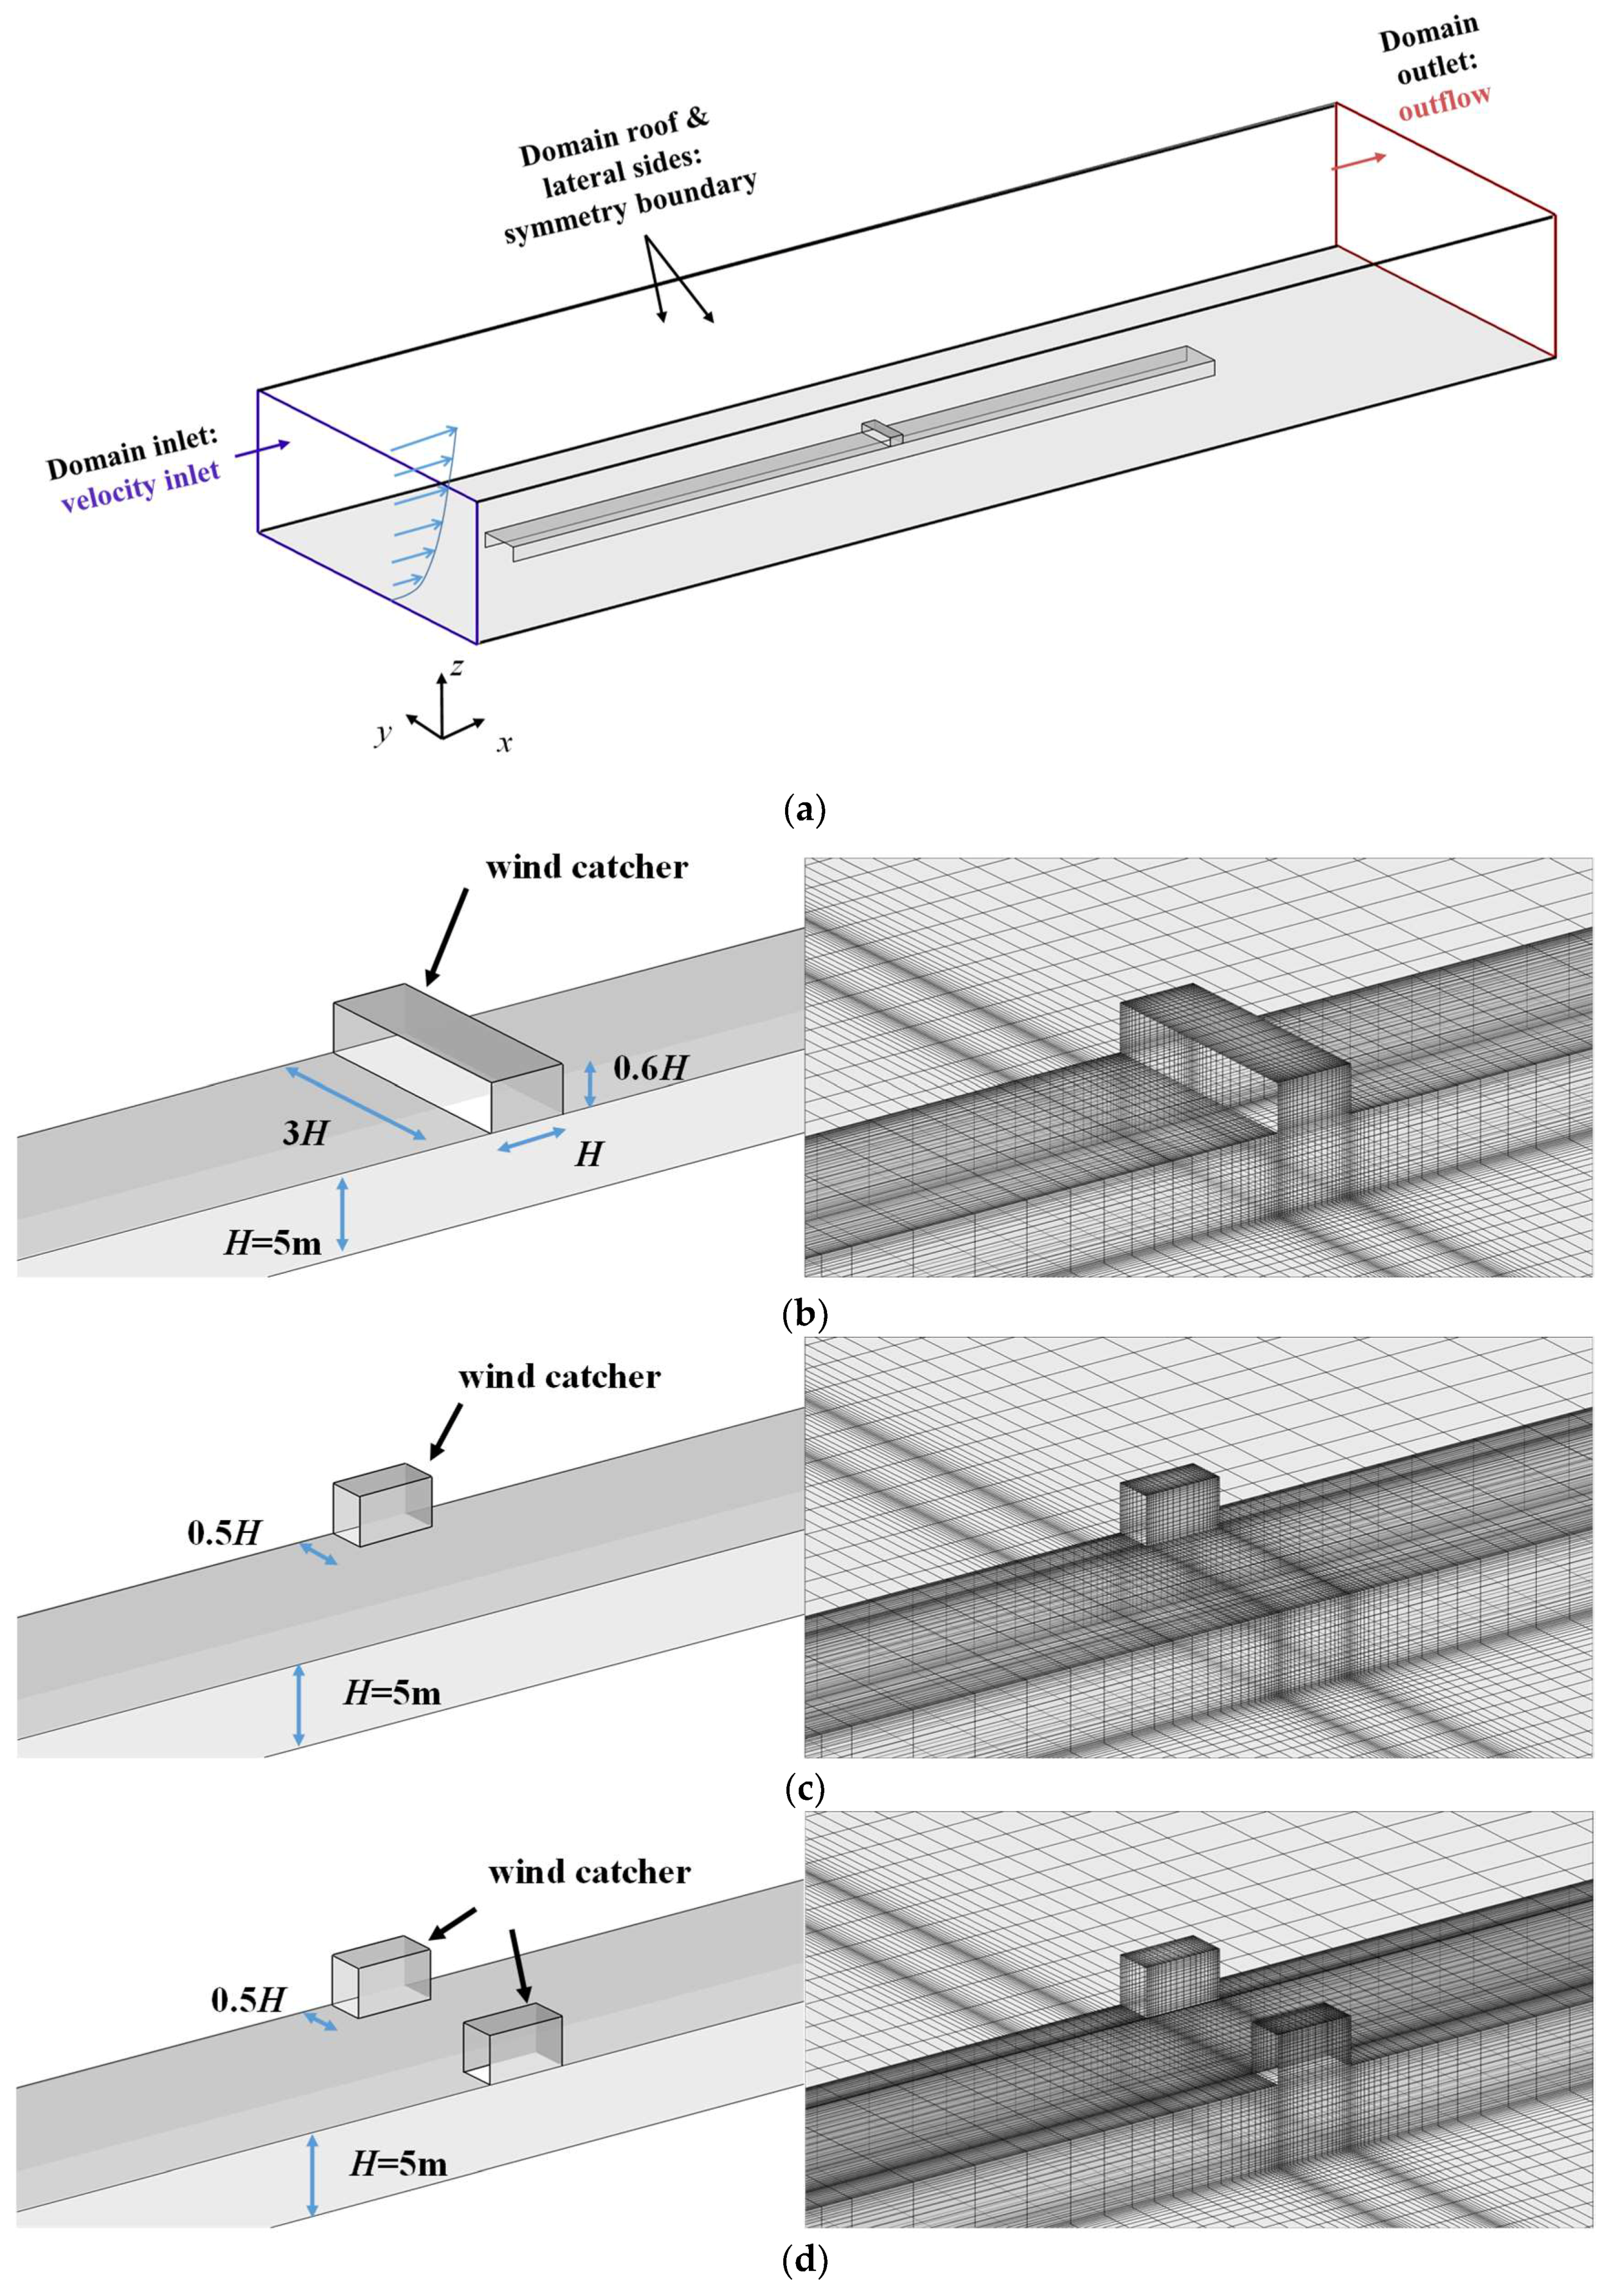
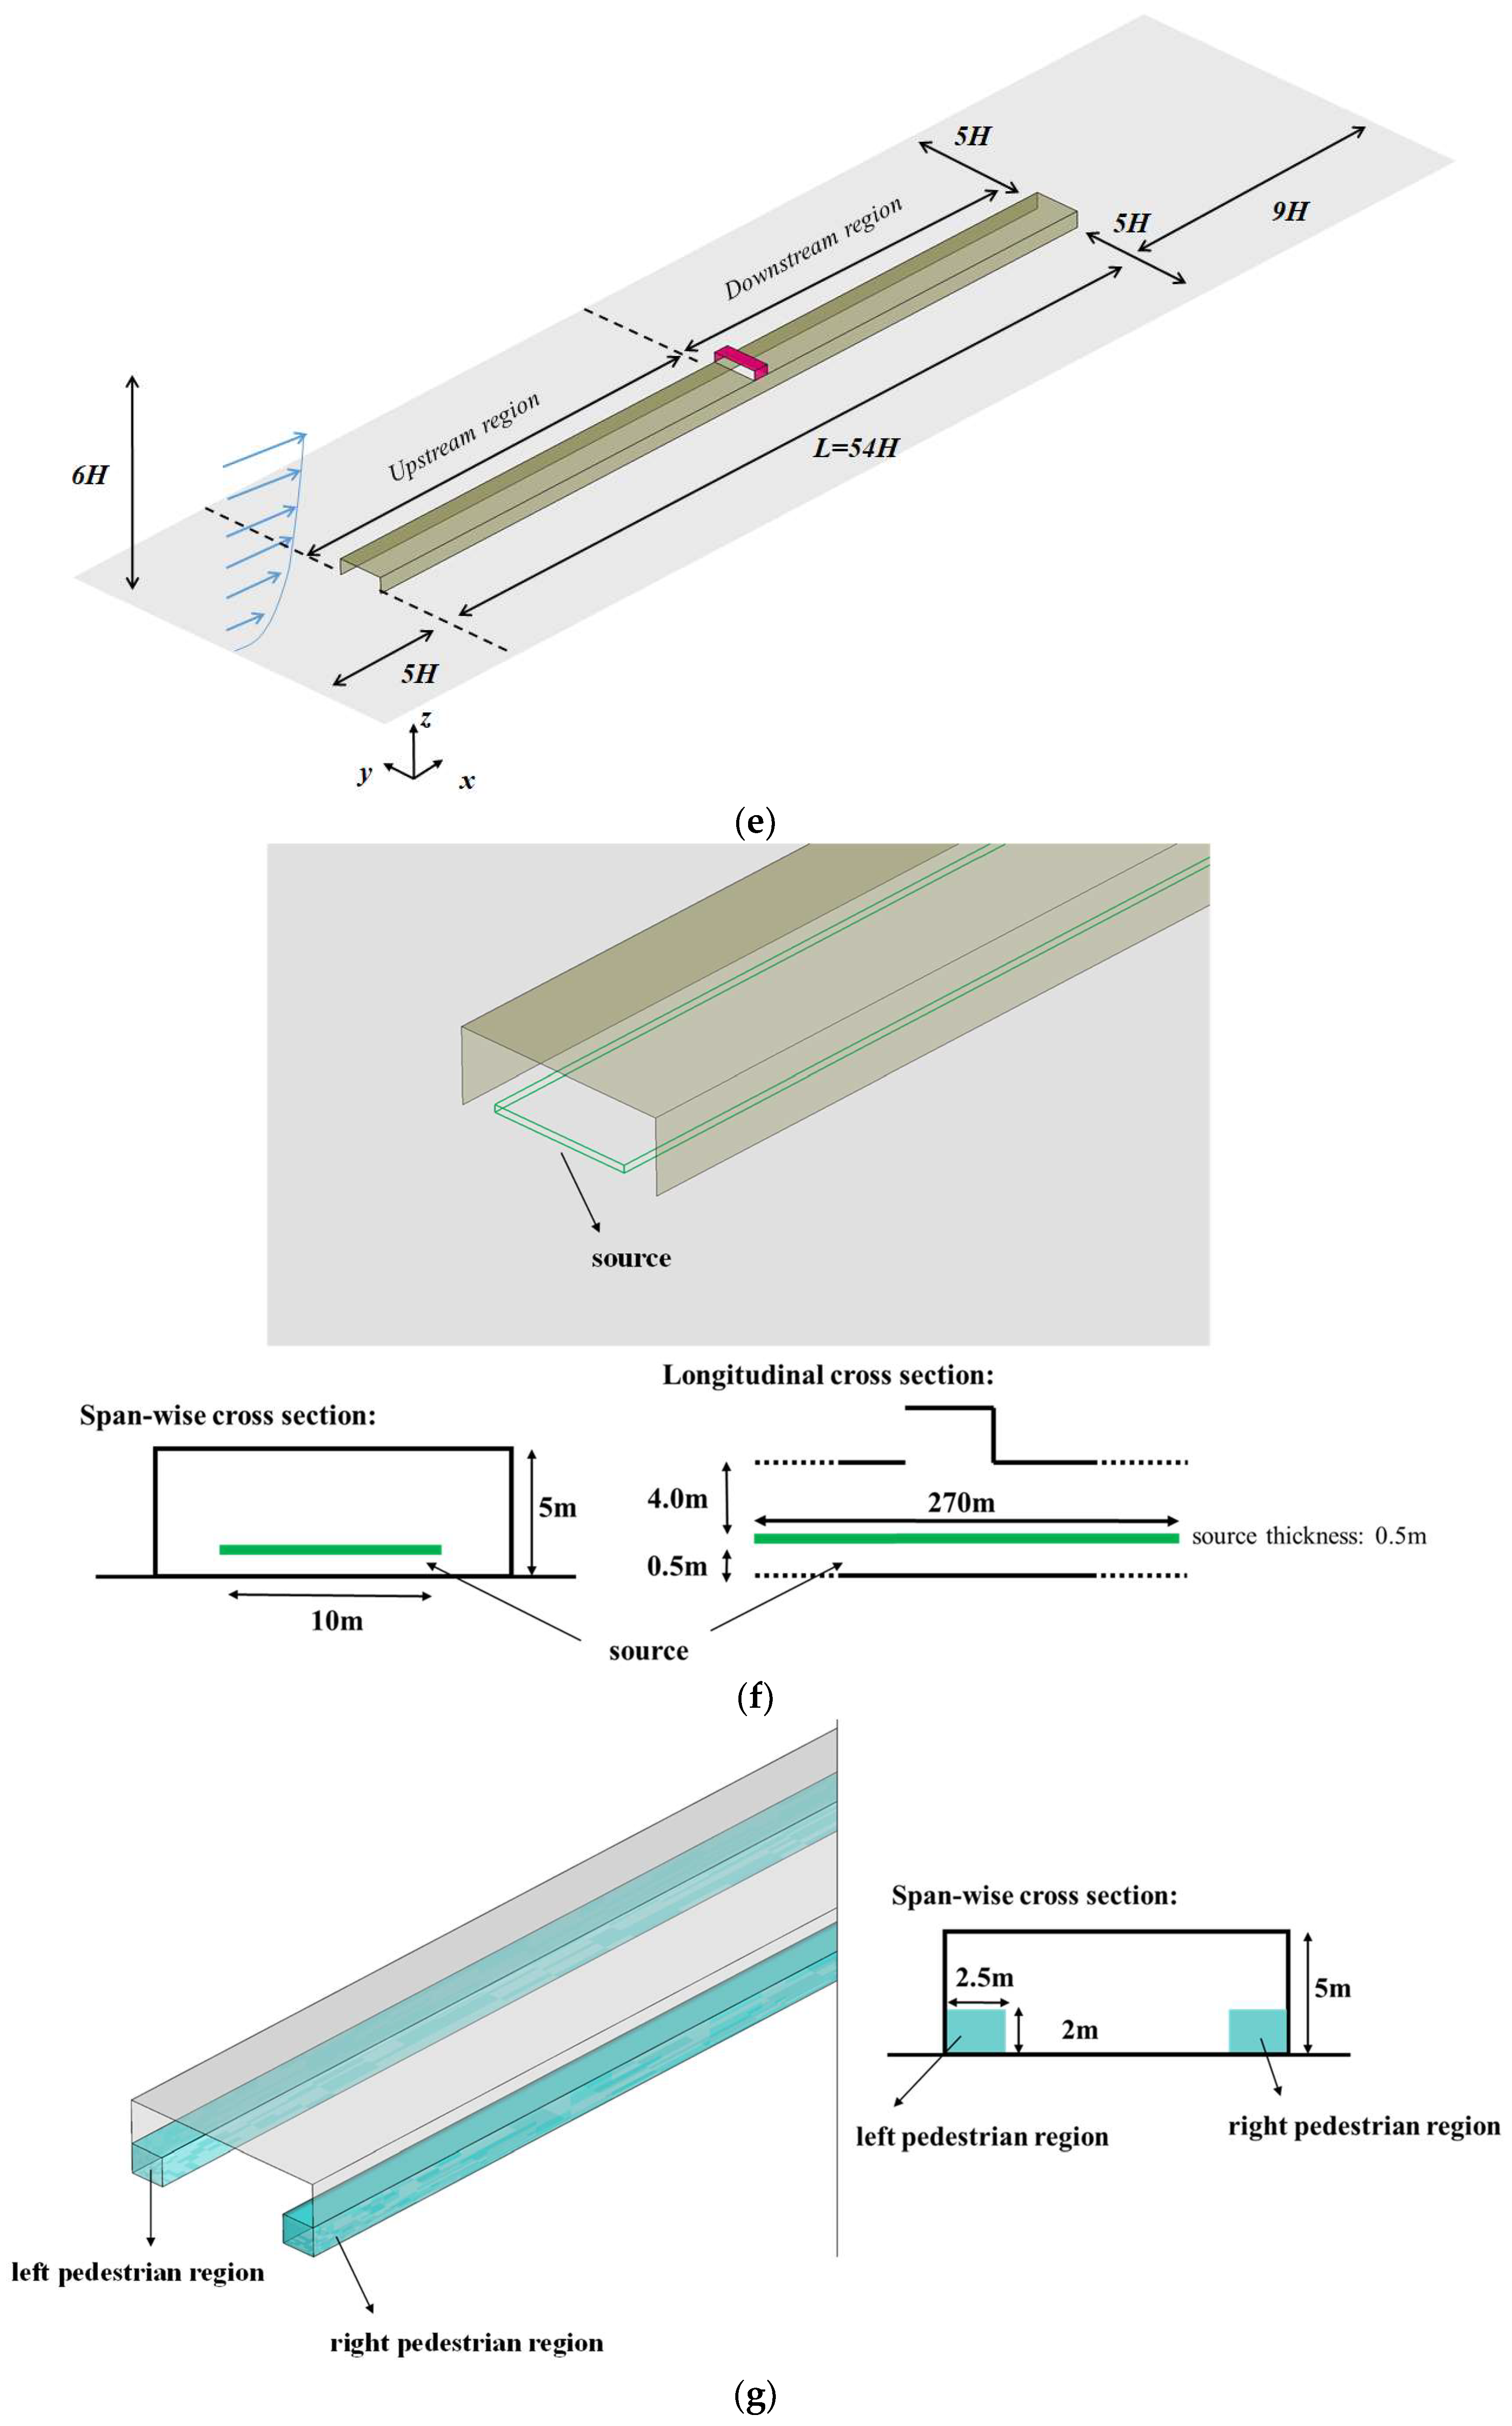
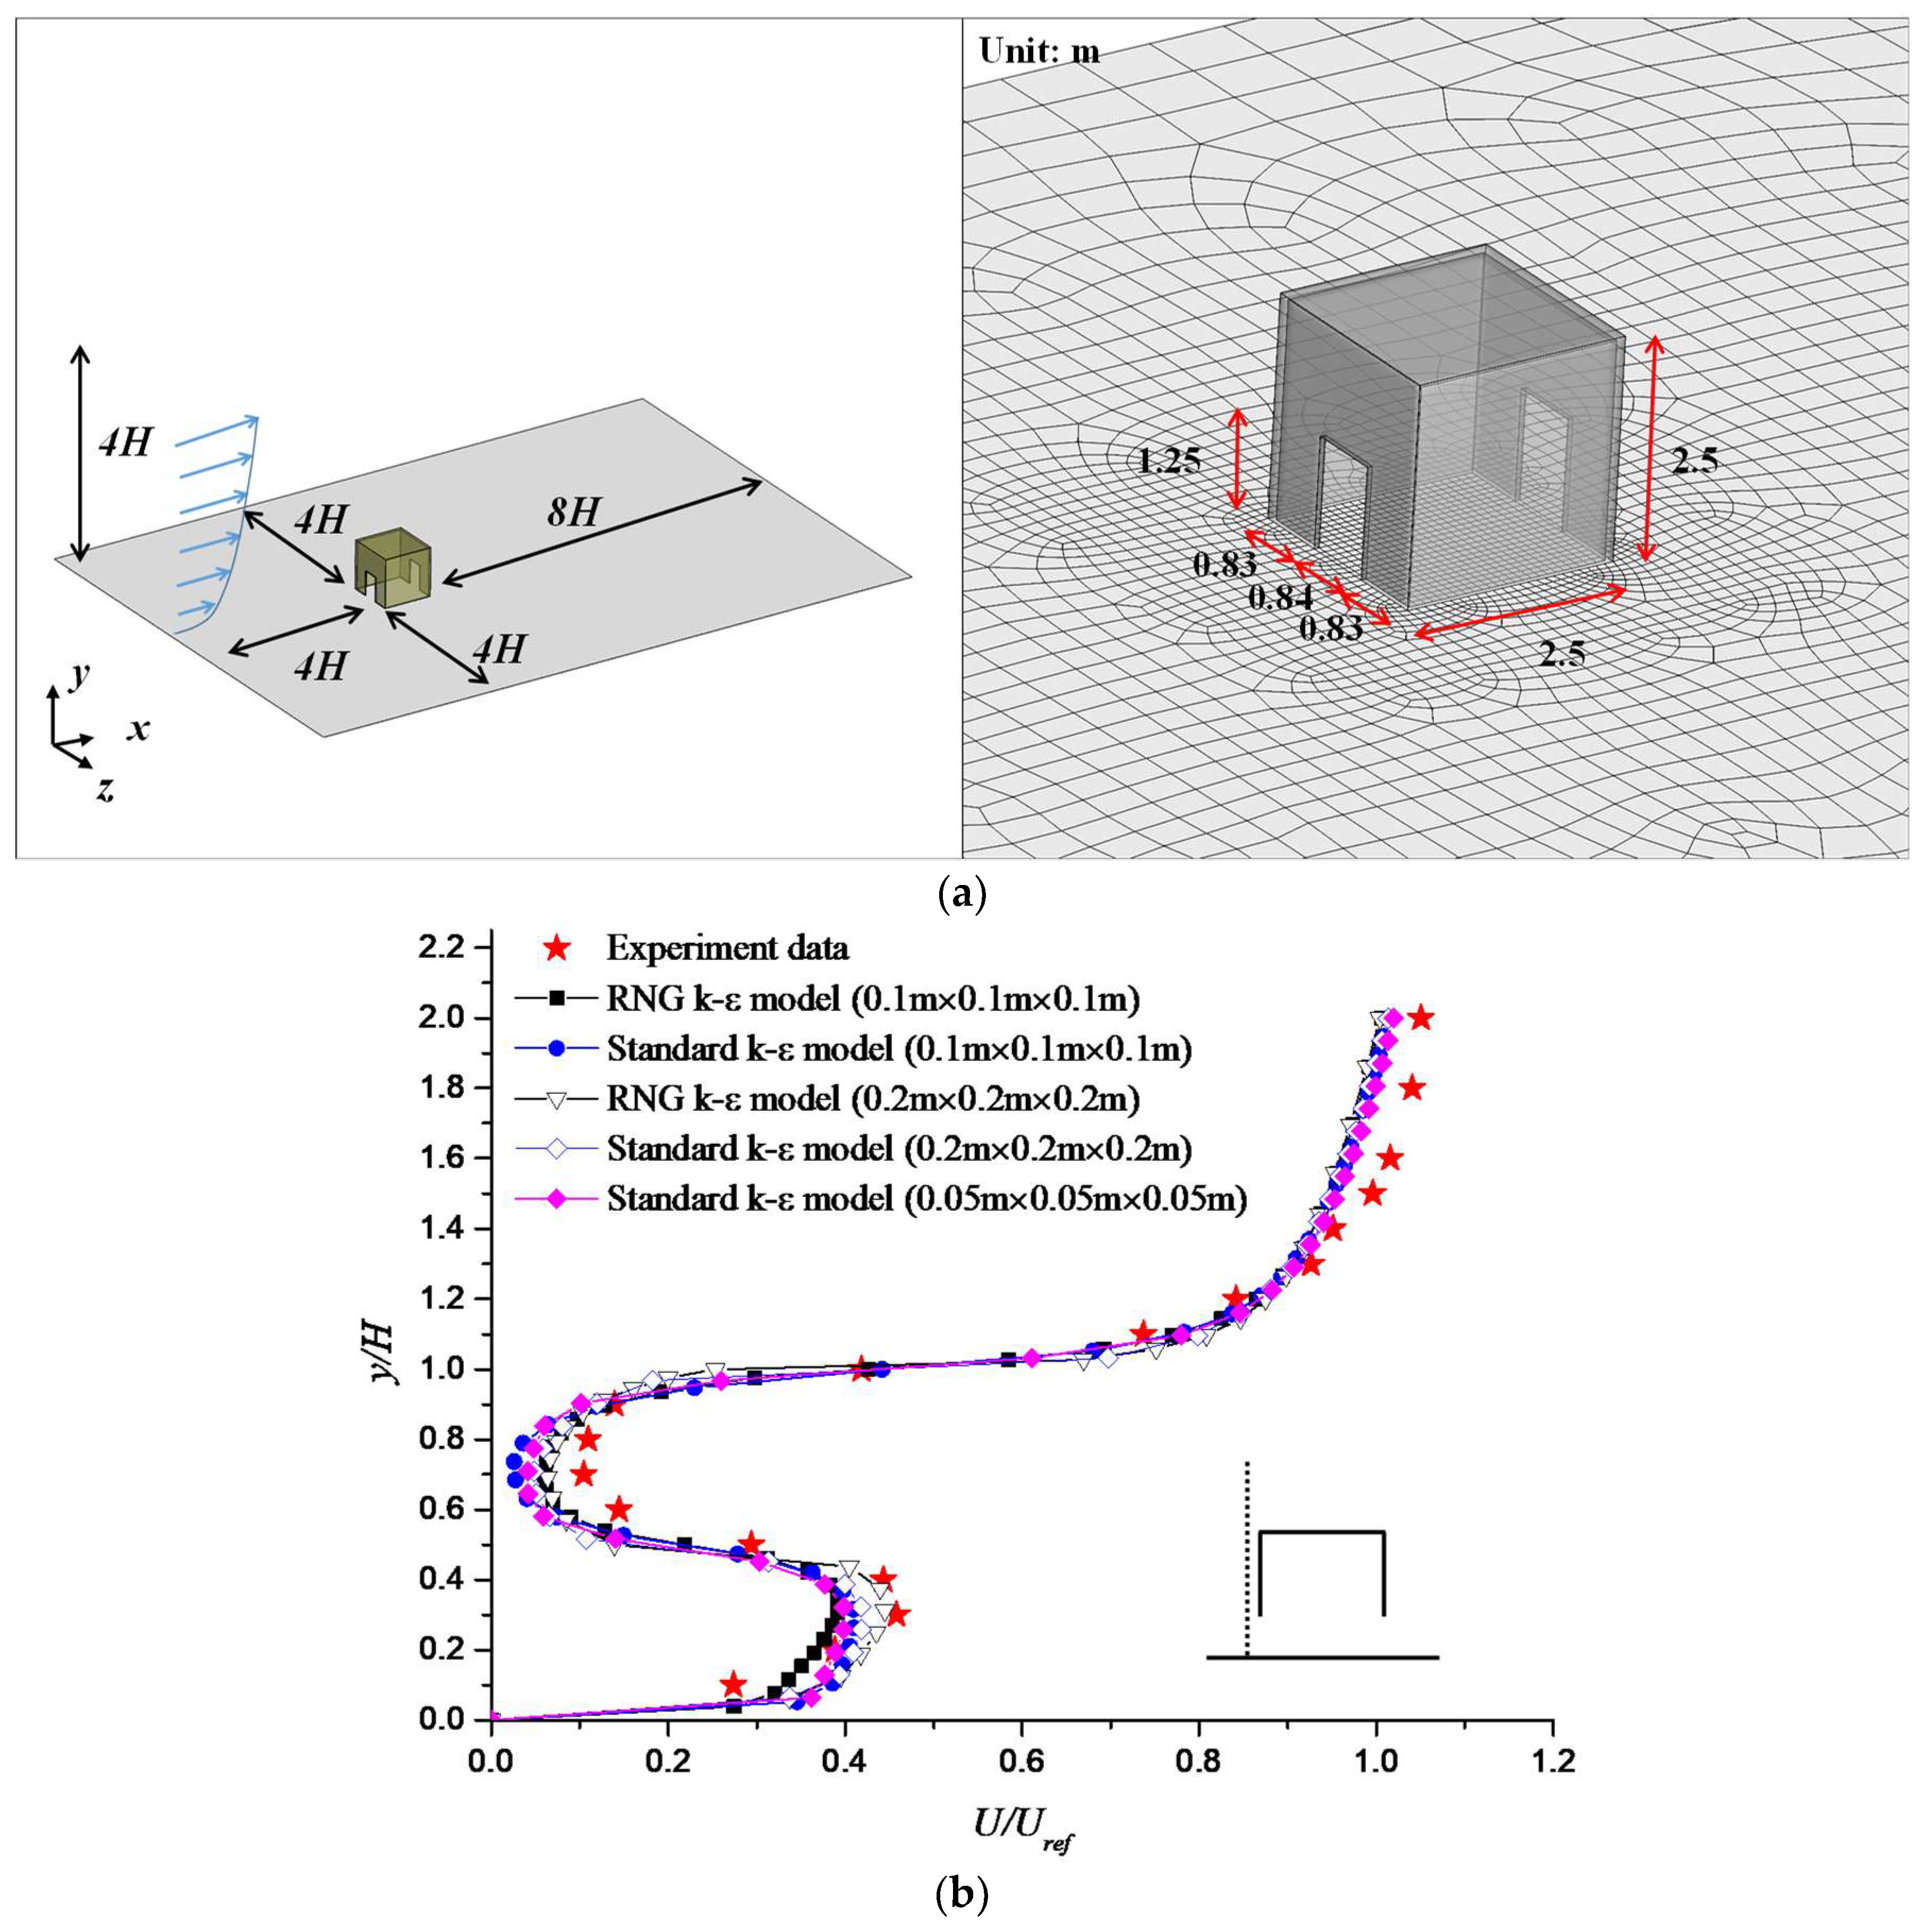
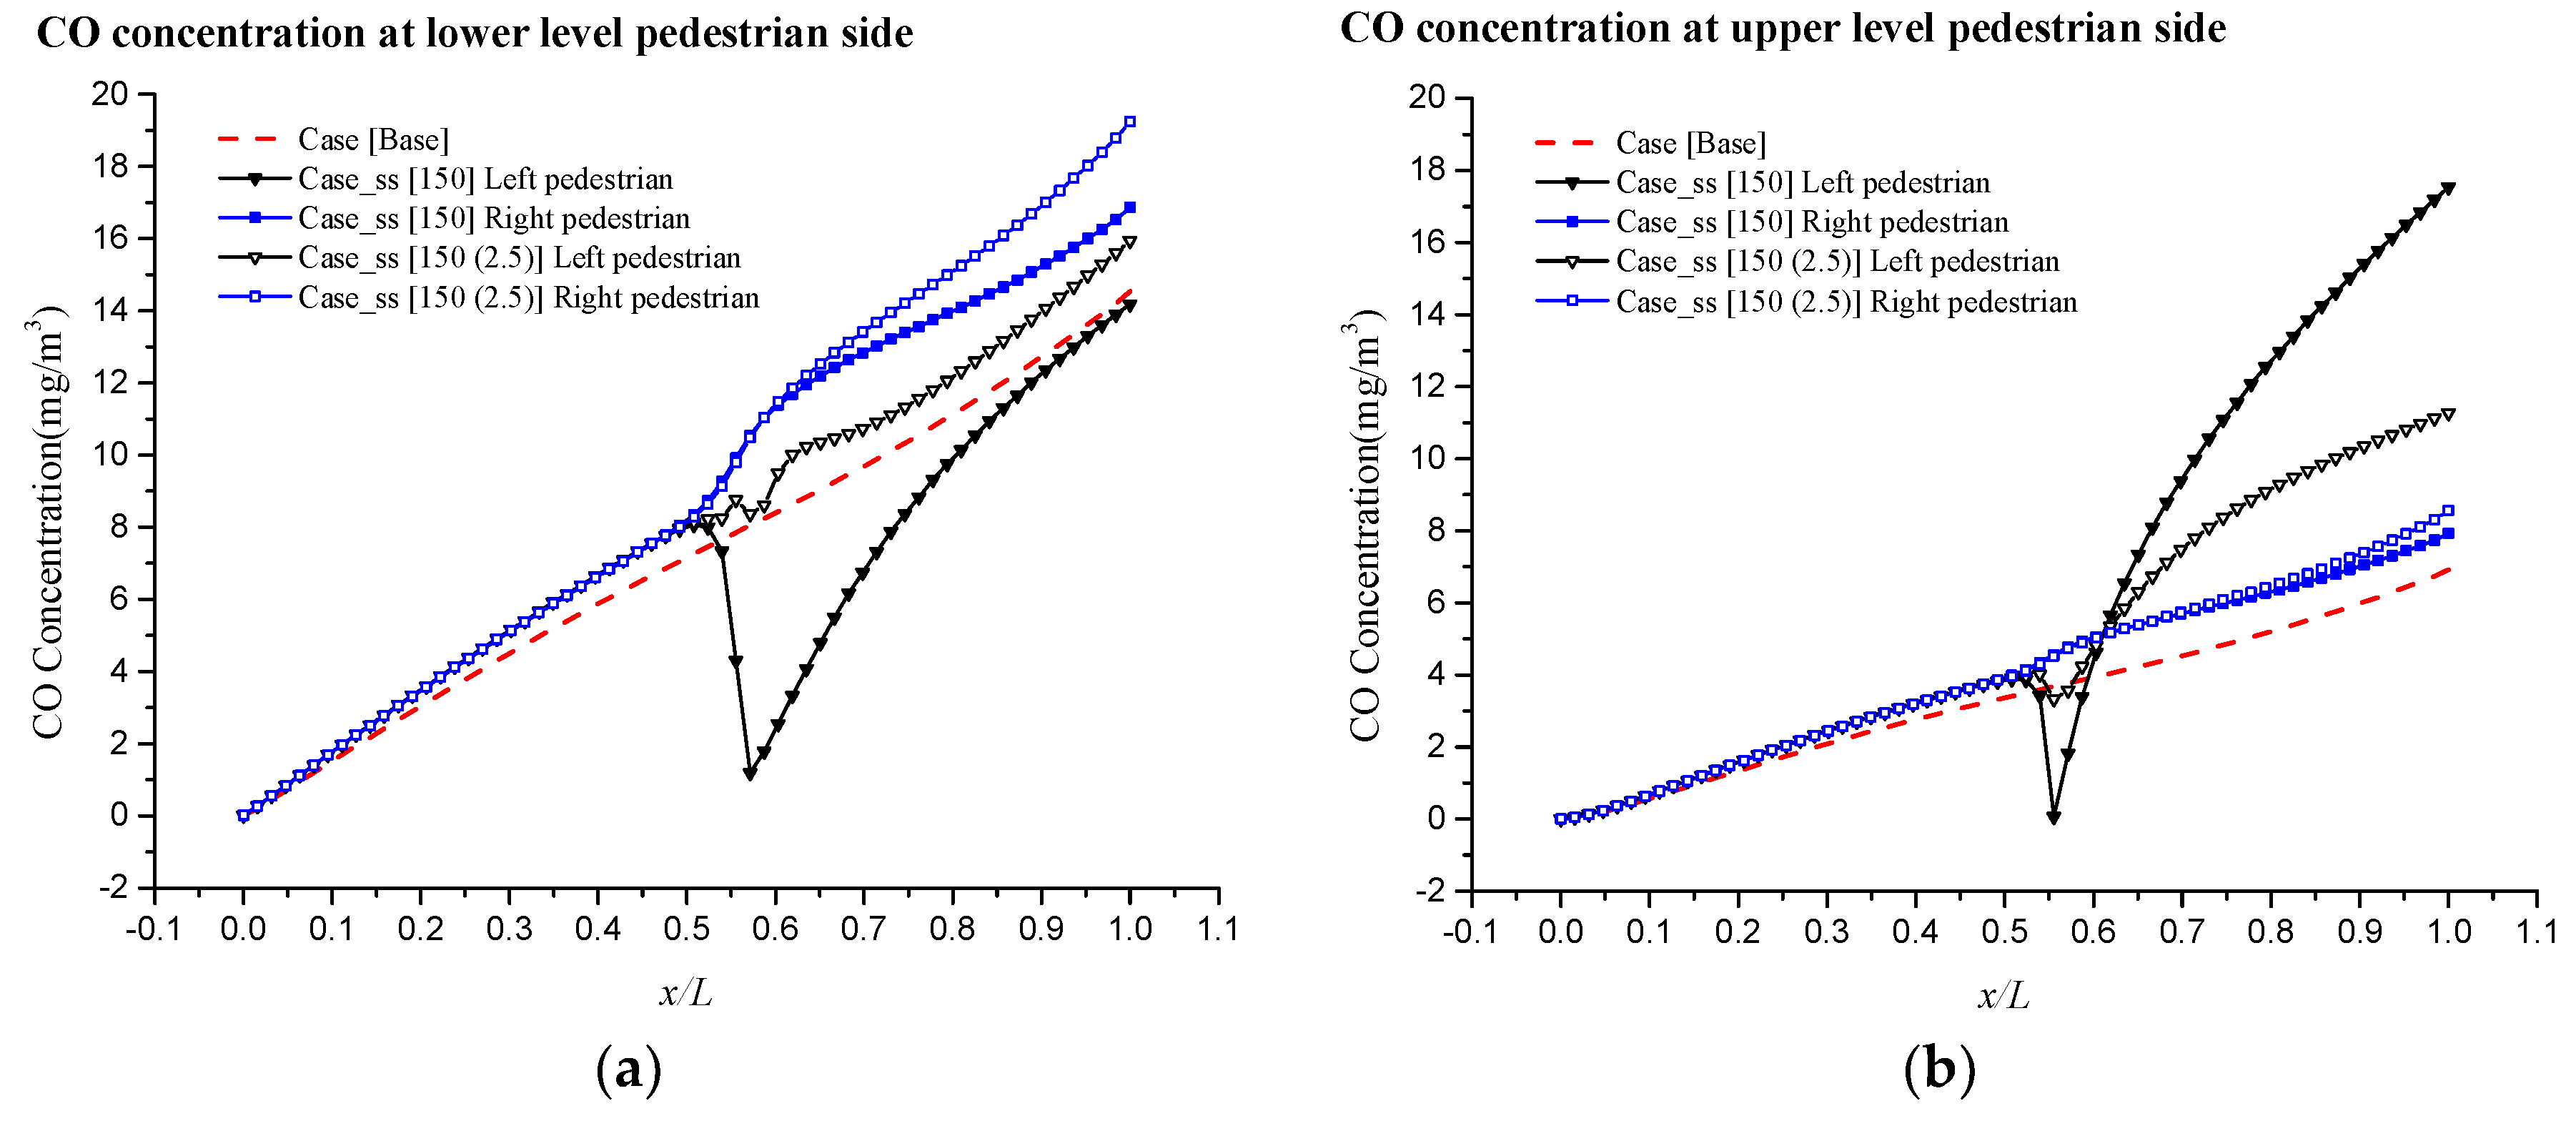
In order to evaluate the impacts of different types of ventilation design on air pollutants within a tunnel environment, this research adopts the concept of the intake fraction (IF), which is defined as the fraction of the total emission inhaled by the population [27,28,29,30]. In this research, CFD methodology with a validation process is applied for investigation. A total of 35 cases including the base case (without wind catcher) are built to investigate the wind catcher’s ventilation performance for different wind catcher arrangements and styles. In every single case series, the effects of wind catcher position on ventilation performance are presented, and the effects of the catcher style are addressed for different case series. The structure of the remaining paper is as follows: Section 2 introduces the numerical method of computational fluid dynamics (CFD) and the models built in this study. Section 3 introduces the concept of the intake fraction (IF). The results and discussion are presented in Section 4 and the conclusions given in Section 5.

2. CFD Methodology and Model Description

2.1. CFD Methodology

Computational Fluid Dynamic (CFD) is applied in this study to understand the aerodynamics and pollutant dispersion in the tunnel environment using Fluent 6.3.26 [31]. The road tunnel environment could be regarded as a special kind of indoor environment but on a much larger scale than an indoor room, it approximately fits the scale of urban street canyons. The standard k-ε model can well-simulate the airflow and pollutant dispersion with a performance which has been highly validated in urban scale studies [27]. Ghadiri [32] investigated the simulation performance of different numerical models in cases of two-sided rectangular wind catchers. Though SSG RSM models are regarded as being superior to standard k-ε models in terms of predicting the lateral volumetric airflow rate, the standard k-ε model is still widely used to study wind catcher performance because of its proven accuracy in wind catcher ventilation [20,22,24,32]. Hence, the standard k-ε model is employed to solve the steady state isothermal problem in this study.
The governing equations are discretized using the finite volume method (FVM) and are built into the model with a second order upwind scheme. Additionally, a Semi-implicit Method for a Pressure-linked Equation (SIMPLE) algorithm is applied in the steady-state simulation. The governing equations in the standard k-ε model are presented as follows:
Mass conservation equation [33,34,35]:
  u ¯ i x i = 0  
Momentum equation:
  u ¯ j u ¯ i x j = 1 ρ p ¯ x i + x j ( ν u ¯ i x j u i u j ¯ )  
Transport equation for turbulent kinetic energy (k) and dissipation rate ( ε ):
  u ¯ i k x i = x i [ ( ν + ν t σ k ) k x i ] + 1 ρ P k ε  
  u ¯ i ε x i = x i [ ( ν + ν t σ ε ) ε x i ] + 1 ρ C ε 1 ε k P k C ε 2 ε 2 k  
In the equation, u ¯ j is the time-averaged velocity components and u i is the fluctuation of velocity components. ν and ν t = C μ k 2 ε are the kinematic viscosity and kinematic eddy viscosity respectively. u i u j ¯ = ν t ( u ¯ i x j + u ¯ j x i ) 2 3 k δ i j is the Reynold stress tensor and. P k = ν t × u ¯ i x j ( u ¯ i x j + u ¯ j x i ) is the turbulence production term. C ε 1 , C ε 2 and C μ are empirical constants, which are derived from experiment and equal to 1.44, 1.92 and 0.09 respectively. σ k = 1.0 and σ ε = 1.3 are Prandtl numbers in the equations of turbulent kinetic energy and its dissipation rate.
The under-relaxation factors for the pressure term, momentum term, k and ε terms are 0.3, 0.7, 0.8 and 0.8 respectively. The solution process does not stop until all residuals stop decreasing. Typical residuals at convergence are less than: 5 × 10⁻¹¹, 2 × 10⁻¹¹, 3 × 10⁻¹¹ for stream-wise velocity, span-wise velocity, and vertical velocity respectively, and 2 × 10⁻¹⁰, 2 × 10⁻⁸, 1 × 10⁻⁷, 3 × 10⁻⁹ for k, ε, continuity, and CO respectively. Figure 1 summarizes the numerical methodology employed in this study.

2.2. Model Description

Figure 2a depicts the 3D domain of the tunnel-catcher model in the CFD simulation (single long-catcher case with catcher positioned at x = 150 m). Figure 2b–d presents the details of the three basic catcher arrangement styles, which correspond to three different case series: Single long-catcher series, single short-catcher series and double short-catcher series, and the specified cases are listed in Table 1. The idea of the basic catcher style comes from the flat-roof catcher design that has been widely adopted for improving ventilation in some enclosed indoor environments. For investigating the effects of the catcher length, models of a long catcher and a short catcher were built respectively, and for exploring the influence of the integrated effect of two short wind catchers, double short-catcher cases are built. A total of 35 cases including the base case (without wind catcher) were built to investigate the catcher’s ventilation performance in different arrangements and catcher styles. In every single case series, the effects of catcher position on ventilation performance would be emphasized, and between different case series, the effects of the catcher style could be addressed.
The tunnel model was built on a 1:1 real scale in accordance with the real-world vehicle-pedestrian tunnel in the Barbican district, City of London, UK. The tunnel height is H = 5 m and the length of the tunnel is L = 270 m. The long catcher was designed to be 3 m tall (0.6H) and 5 m wide (H) with a length of 15 m (3H) (Figure 2b). Meanwhile, the short catcher was designed to be 2.5 m in length (Figure 2c). The thickness of the building was neglected to reduce the mesh number and improve the computational efficiency due to its relatively small influence on flow at this scale, which was confirmed in some pre-modeling tests in this research (Figure A1 and Figure A2). The preliminary test is specifically discussed in Appendix A.

2.3. CFD Domain, Boundary Conditions and Grid Arrangements

As displayed in Figure 1, the general blockage ratio of the computational domain in this research was smaller than 3.0%, which satisfies the requirement in the urban wind environment simulation CFD guideline [36]. Furthermore, according to this CFD guidance, 5H was reserved between the target building (i.e., tunnel) and the laterals, front and top boundaries to ensure full development of the inlet wind profile (Figure 2e).
The medium grid arrangements with the minimum grid size of 0.1 m at wall surfaces were well-generated with the grid expansion ratio of 1.2 toward regions away from the tunnel model. The total hexahedral cell number ranged from 1,463,365 to 2,225,069 in all test cases. The standard k-ε model was employed as a no-slip wall boundary condition was applied in the near wall treatment. The normalized distance from wall surfaces (y+) ranged from 30 to 500 at most regions of the wall surfaces, i.e., the first grid point near the wall surface located in the fully-developed turbulent region [33]. Zero normal gradient conditions were employed at the two lateral domain boundaries, the domain roof (symmetry boundary), and the domain outlet boundary (i.e., outflow) (Figure 2a). The power-law velocity profile was employed at the domain inlet [36]:
  U 0 ( z ) = U r e f ( z z r e f ) α  
  k ( z ) = U * 2 C μ  
  ε ( z ) = U * 3 κ ( z + z 0 )  
where Uref is the reference velocity and equals 3 m/s at the reference height zref = 16 m. U * = κ U r e f / l n ( z r e f + z 0 z 0 ) is the friction velocity, and aerodynamic roughness length z0 = 1.0 m, which fits the land roughness of the urban surface. The von Karman constant κ   = 0.41, and α is set to 0.27 according to the study by Irwin [37]. Turbulence has been fully developed at the entrance of the computational domain at reference level according to the setup of the power law.
All CFD setups including computational domain size, boundary conditions, and grid arrangements etc. satisfy the CFD guideline requirements (Tominaga et al. [36]). It is also worth mentioning that some researchers use the uniform inlet velocity profile instead of the atmospheric boundary layer (ABL) in catcher cross-ventilation simulations [23,38]. Though the latter requires much larger computational areas and more meshes than the former, the uniform inlet velocity profile would possibly underestimate the general flow rate inside the room [23]. Thus, to generate more accurate flow features in tunnels, the ABL boundary was applied in this research.

2.4. CFD Setup in Pollutant Dispersion Modelling

Carbon monoxide (CO) is one of the most common inert pollutants among vehicle emissions in London, UK [1]. Thus, CO was chosen as the pollutant source in this research. The emission rate was determined according to the research by Ng and Chau [39], with the realistic emission rate of 36.1 g/h/m per unit street length. The CO source was above road, with a thickness of 0.5 m and span-wise width of 10 m (Figure 2f). The emission was homogeneous and was controlled by the constant emission rate that is defined in the model. The governing equation of the CO dispersion model is [33]:
  u ¯ j C x j x j [ ( D m + D t ) C x j ] = S  
C is the time-averaged CO concentration. Dm is the molecular diffusivity and Dt is the turbulent diffusivity. S is the pollutant emission rate. Here, D t = ν t / S c t and Sct is the turbulent Schmidt number whose value is set as Sct = 0.7 following the literature [27,40,41].
In particular, pedestrian regions were defined at the two lateral sides of the tunnel, with 2 m in height and 2.5 m in width along the whole tunnel (Figure 2g). The CO mean concentration in pedestrian regions is used when the intake fraction of the walking pedestrians in the tunnel is calculated, and the results will be covered in Section 3.

2.5. Grid Independence Study and Model Validation by Wind Tunnel Experiments

The natural ventilation feature of the wind catcher was validated by a wind tunnel experiment by Jiang et al. [42]. A 10:1 3D cubic building model with two openings was built, with the scale similar to the catcher-tunnel models. The corresponding parameters of the building model are presented in Figure 2a, i.e., building height of 2.5 m and opening size of 0.84 m wide and 1.25 m tall. At the domain inlet, the vertical profiles of the stream-wise velocity and turbulent quantities are defined as follows [43]:
  U ( y ) = ( u * / κ ) l n ( y / y 0 )  
  k ( y ) = u * 2 / C μ  
  ε ( y ) = C μ 3 / 4 k 3 / 2 / ( κ y )  
where u* is the friction velocity and equals 1.068 m/s according to Jin et al. [43], y0 is the roughness length = 0.05 m in the wind tunnel experiment, velocity components in the y and z directions are zero. The parameter roughness height Ks and roughness constant Cs and their relationship with y0 is K s = 9.793 y 0 / C s , which has been built into models in Fluent [44]. The Reynolds number can be calculated by Equation (12):
  R e = U r e f H ν  
where the reference velocity Uref = 10 m/s, the characteristic length H is 0.25 m and ν is the kinetic viscosity which is 1.54 × 10⁻⁵ m2/s. Re reached approximately 162,000 in wind tunnel experiments. In the validation model, Uref was defined as 3 m/s and the length was 2.5 m. Thus, Re reached about 487,000, verifying that the Reynolds numbers in both cases satisfy the Reynolds independence requirement (Re ≫ 11,000), ensuring that the turbulence was fully developed. It is worth mentioning that the friction velocity u* was 0.314 m/s, which could be calculated by Equation (13):
  u * = κ U r e f l n ( H y 0 )  
The cross-ventilation building model for CFD validation was built with fine grid (0.05 m), medium grid (0.1 m) and coarse grid (0.2 m) near wall surfaces and inside building models respectively. The data of the RNG k-ε model were derived from a validation study conducted by Jin et al. [43]. A similar validation process has also been done by Ai, Mak and Niu [45,46]. The standard k-ε model with enhanced wall function was employed in this validation study, and the boundary conditions were exactly the same as in the research cases (illustrated in Section 2.3). The validation model is presented in Figure 3a.
Normalized wind speed profile (U/Uref) of three feature lines x = −25/H, H/2 and 3H/2 at the center plane of the model are presented in Figure 3b–d respectively. Results show that both the RNG k-ε model and the Standard k-ε model predict the flow well in the cross ventilation cases, with the profiles generally fitting the experiment data. For better evaluation of the model simulation accuracy, a series of statistical values were calculated, including normalized mean error (NMSE), the fraction bias (FB) and the correlation coefficient (R). The results of the statistical metrics are listed in Table 2. According to Santiago et al. [47], a credible simulation model should satisfy the criterion of the statistical metrics: NMSE ≤ 1.5 and −0.3 ≤ FB ≤ 0.3. All of the correlation coefficients were significant with 95% confidence. Data shows that all of the statistical values satisfy the criterion, while both the RNG k-ε model and the Standard k-ε model could predict the flow with an acceptable accuracy. The medium grid attains some different CFD results from the coarse grid, but CFD results change little if the fine grid is used (Figure 3b–d, Figure 4). Thus, the medium grid arrangements with a minimum grid of 0.1 were adopted for the following CFD simulations. In addition, the standard k-ε model was employed in our study owing to it being the most widely adopted and accurate predictor validated by the literature [21,23,25,33].

3. Intake Fraction (IF)

The outdoor intake fraction (IF) has been widely used for the assessment of pollutant exposure for nearby populations in many urban climate studies [27,28,29,30], and it has also been used for indoor environment evaluation [48]. The intake fraction is defined as the fraction of total intake by a certain group of population among the total emission. For example, IF is 1 ppm (part per million) when 1 g is inhaled by a group of population in 1 ton pollutant emission. IF for urban climate studies is related to factors including the local population (P), breathing rate (Br), time spent in the environment ( Δ t ), environmental pollutant concentration (Ce), and the pollutant emission ( m ˙ ). It is defined as below [27]:
  I F u r b a n = i N j M P i × B r i , j × Δ t i , j × C e j / m ˙  
where M is the number of the investigated microenvironments e.g., indoor environment, near vehicle environment etc., and N is the number of the studied population group like the elderly, adults, children etc. Breathing rate, staying time and the environment pollutant concentration would vary with the studied population groups (i) and the studied microenvironments (j). The intake fraction for different population groups and microenvironments is listed in Table 3.
The intake fraction was introduced in this research to assess the influences of pollutant distribution on a certain group of people regardless of the complex pattern of pollutant distribution in real cases. A new version of the intake fraction for tunnel research is defined as the fraction of the total inhaled by a person and the total emission during the time the person passes through the tunnel. This is presented as follows:
  I F t u n n e l = V o l b r × C i m ˙ = B r × t × C ¯ m ˙  
where Volbr is the intake volume of each breath (m3) and Ci is the spatial CO concentration (mg/m3) at the time he breathes, and m ˙ is the total emission during the time he passes through the tunnel (mg). The equation is transferred into the form that could be calculated by the breathing rate (Br, m3/day) and the spatial averaged CO concentration at the pedestrian region (C) (Equation (14)), and t is the time the person passes through the tunnel. Only adults are considered in this study, and it is assumed that the walking speed is 1.4 m/s, so the time taken is about 193 s in this case. Since the pedestrian region could be regarded as the near vehicle region, according to Allan et al. [49] (Table 3), the breathing rate was 15.5 m3/day, approximately 1.79 × 10⁻⁴ m3/s. The intake fraction would finally convert into ppm units, which means the value of the inhaled parts per million emission parts.

4. Result and Discussion

4.1. Wind Aerodynamics in a Tunnel

As shown in Table 1, 35 cases were studied to explore the effects of wind catcher design on pollutant concentration and exposure in tunnels. The simulation results show that the flow pattern and CO dispersion mechanism would not change significantly for stream-wise variations in wind catcher position, while significant differences in flow and pollutant dispersion pattern could be found for span-wise changes using a single short-catcher (Case_ss [150 (2.5)] and Case_ss [150 (5.0)]) and two short catchers changed from parallel to staggered arrangements (Case_ds [120, 180] and Case_ds [90, 210]). All of these wind aerodynamics and significant shifts in flow patterns among cases are specifically discussed in the following subsections.

4.1.1. Effects of Catcher Style on Wind Aerodynamics in the Tunnel

Three basic styles of wind catcher arrangement were considered, i.e., one single long catcher, one single short catcher above the left pedestrian side and two short catchers in a parallel arrangement above both pedestrian sides (Table 1). According to the simulation results, the wind in tunnels is dominated by longitudinal velocities, whose magnitude is 1.8 to 2.3 m/s higher than that of span-wise and vertical velocities, and in every single catcher arrangement series, flow patterns inside the tunnel tend to be similar when the catcher positions only vary stream-wise. Hence, in this section, discussion of the flow pattern will be based on the cases with the catcher located at x = 150 m (x/L = 0.55) with y = 0 in three basic catcher arrangement cases.
Airflow Structures in Horizontal Views
Figure 5 presents the horizontal velocity magnitude with streamline on slices at pedestrian level (z = 1.6 m). In the single long-catcher case (Case_sl [150], Figure 5b), the velocity magnitude is significantly intensified at the back of the wind catcher, with the highest value reaching 2.8 m/s. However, considerable reductions in velocity magnitude could also be found at the upstream regions of the tunnel when compared with the results in the base case (Figure 5a). This reduction is mainly due to the negative influence of the strong catcher-driven flow, which is observed as a strong downward vertical flow in the near-catcher regions, with the strong vertical velocity magnitude reaching −0.63 m/s at the catcher position in Case_sl [150] (Figure 4b). This intense catcher-driven flow works as a barrier, dissipating the kinetic energy of the domain-driven flows and preventing the flow from passing through the tunnel to the downstream region. According to the simulation results, this kind of velocity reduction effect exists for all of the catcher cases, and would be much stronger when the wind catcher is positioned closer to the tunnel exit. The design of the short wind catchers better diminishes this kind of reduction effect (Figure 5c–e). Compared to Case_sl [150], much higher velocity magnitudes could be found at the upstream region of the tunnel in Case_ss [150], Case_ss [150 (2.5)] and Case_ds [150, 150], with the value reaching around 1.6 m/s. However, the velocity strengthening effects at the downstream region of the tunnel decline in short-catcher cases: A single short-catcher on the left pedestrian side tends to intensify the airflow just behind where the wind catcher is positioned, while a double short-catcher above the two pedestrian sides would also strengthen the flows in the middle of the tunnel, where the vehicle roadway is located.
Figure 4a presents the span-wise velocity magnitude along the left pedestrian side at level z = 1.6 m. The velocity shows similar patterns in Case_ss [150] and Case_ds [150]. Distinguishable negative values of span-wise wind could be observed at x/L = 0.50 (about 13.5 m ahead of where the catcher is located) for both of the cases. The value peaks at −0.35 m/s at catcher position (x/L = 0.55), and the intensity of the flow decreases sharply the farther it goes away from the catcher position between x/L = 0.55 and 0.70, and then it becomes stable, maintaining at around −0.15 m/s from x/L = 0.70 to the end of the tunnel. However, significant strong span-wise velocity is absent in single long-catcher cases where its magnitude only peaks at −0.05 m/s and lasts for a very short distance due to lower span-wise pressure differences. This branch of the span-wise airflow plays a vital role in hindering vehicle pollutants dispersing from the vehicle side to the pedestrian side, which is specifically analyzed in Section 4.2.
Airflow Structures Viewed Vertically
Figure 6 shows the velocity magnitude with streamlines on a vertical slice located at the middle of the left pavement (1.5 m from the left tunnel wall). As revealed by many other researchers, a wind catcher would cause two large recirculation zones in an enclosed room, i.e., one occurs behind the catcher and the other in front of the catcher [22]. Velocity would sharply reduce to about 0.2 m/s on the edge of the zone in this case. However, unlike the results in enclosed room models in many other studies, a strong longitudinal wind dominates the flow in a tunnel, thus only one intensified recirculation zone could be found in a tunnel at the back of the catcher just beneath the roof (Figure 6a). This recirculation zone is smaller in size but much stronger than that in enclosed rooms. Airflow is introduced to the lower level of the tunnel, and due the impinging effects, the velocity magnitude increases rapidly to 2.7 m/s at pedestrian level just behind the catcher position. Compared to the long-catcher cases, the recirculation zone in short-catcher cases is relatively smaller, with much weaker impinging effects at pedestrian level. Besides, the upstream velocity of the tunnel region is generally larger in the short-catcher case, where the reduction effect is much weaker compared with that of the long-catcher cases (Figure 6a,b). To sum up, stronger impinging effects would effectively intensify the velocity in the downstream region but would also cause much stronger upstream velocity reduction.
A special downstream vortex could be found in short-catcher cases in a vertical plane (Figure 7). The vortex in not fully developed in the near catcher region, and it shows a pattern of a high span-wise velocity center just beneath the catcher entrance, which peaks at 0.7 m/s in Case_ss [150] and Case_ds [150, 150] (Figure 7b,c). Due to the blockage of the lateral tunnel walls, catcher-induced flows move to the middle of the tunnel. The vortex is more obvious in the downstream region: One main anticlockwise vortex is found in single short-catcher cases (Case_ss [150] in Figure 7b), and two counter-rotating vortexes could be found in double short-catcher cases (Case_ds [150, 150] in Figure 7c).
Figure 4 also reveals the feature of the vortex development: The constant negative value of span-wise velocity along the pedestrian sides corresponds to the span-wise branch of the anticlockwise vortex at pedestrian level, while the vertical velocity corresponds to the downward branch of the vortex. The magnitude of the span-wise velocity is in a relatively steady state with the value reducing from −0.35 m/s to −0.15 m/s at x/L = 0.65. Distinguishable negative values of vertical velocity also become stable at the same position (x/L = 0.65) in both single short-catcher and double short-catcher cases. This reveals that the left anticlockwise vortex just occurred at x/L = 0.6, which is 13.5 m away from the catcher position. Additionally, the vortex develops into the strongest state at pedestrian level at x/L = 0.65, where the vertical velocity peaks. The vortex exists along the tunnel and extends driven by the strong longitudinal flow.

4.1.2. Effects of Wind Catcher Arrangement on Wind Aerodynamics in a Tunnel

As has been shown in Table 1, Case_ss [150 (2.5)] and Case_ss [150 (5.0)] were built to investigate the influences of the single short-catcher when positioned farther away from the left tunnel wall. Additionally, Case_ds [120, 180] and Case_ds [90, 210] were built to investigate the impacts of parallel and staggered arrangements for double short-catchers. From the results of the cases (Figure 7d–e), short wind catchers would have little influence on the airflow in the upstream region of the tunnel, but dramatically change the vortex in the downstream region, hence influencing the longitudinal ventilation significantly. When two short wind catchers are in a staggered arrangement, the situation becomes more complicated. The intensity of the vortexes is not equally distributed at any x position, and this would also be covered in this section.
Span-wise variations in single short-catcher positions
From the vertical cross section at x = 148 m (Figure 7d), different from the results in cases with the catcher positioned immediately above the left pedestrian side (y = 0), two distinguishable branches of span-wise flow are observed just beneath the catcher entrance, heading to the two sides of the tunnel. The areas of strengthened velocity in Case_ss [150 (2.5)] and Case_ss [150 (5.0)] are significantly smaller than that in Case_ss [150] (Figure 7b,d,e). A downstream-vortex also exists (Figure 7d,e), but one more clockwise vortex occurs on the left side of the tunnel when compared to the result in Case_ss [150]. Due to the blockage of the left tunnel wall, the clockwise vortex on the left is much weaker than the anticlockwise vortex on the right in Case_ss [150 (2.5)]. However, when the catcher is set in a more central position (Case_ss [150 (5.0)]), the two vortexes would gradually share the same intensity. The span-wise velocity is generally weaker than that in cases with the catcher positioned immediately above the left pedestrian side, and this also indicates relatively weaker downstream vortexes.
Double Short-Catchers in a Staggered Arrangement
Figure 8 depicts the span-wise and vertical velocity along the tunnel pedestrian sides in Case_ds [120, 180]. On the left pedestrian side, comparison is made with Case_ds [120, 120], where both of the short catchers are positioned at x = 120 m. According to the results, the curve of the span-wise velocity along the left pedestrian side fits quite well with the curve in Case_ds [120, 120], with the velocity magnitude peaking at around −0.35 m/s at x = 120 m. This trend maintains at the right pedestrian side (but with positive values), where the maximum span-wise velocity could be found at x = 180 m in both parallel and staggered cases. However, a staggered arrangement tends to have little influence on the vertical velocity when compared to the parallel arrangement cases. For all of the short-catcher cases: The downstream vortex does not reach the ground when it forms right behind the catcher entrance. It will gradually develop in shapes and reach the pedestrian level at around 13.5 m away from the catcher, at which position the second peak of the vertical velocity could be found in Figure 8. In staggered arrangement cases, due to the asymmetrical arrangement of short-catchers, two opposite vortexes unequally develop along the tunnel, with the anticlockwise vortex on the left being much weaker than the clockwise one on the right because the left catcher is much closer to the tunnel entrance.

4.2. CO Concentration Distribution and the Pollutant Dispersion Mechanism

Airflow directly influences the pollutant distribution inside the tunnel. Figure 9 presents the CO concentration for slices at z = 1.6 m (pedestrian level) and z = 4.0 m (upper level) for each case. Due to the strong stream-wise driven flows, CO accumulates in the downstream region of the tunnels near the exit. Compared with the results of the base case, it is apparent that among all of the cases with wind catchers, high CO concentration could be found in the upper level of the tunnel. In addition, this phenomenon demonstrates that CO might not be dispersed directly out of the tunnel with the intensified winds induced by the catchers, and that the ventilation efficiency of the tunnel is possibly reduced by the catchers. Designers should be particularly aware of this when arranging the catchers within the tunnels.
In single long-catcher cases (Figure 9b), due to strong velocity reduction effects in the upstream region of the tunnel, CO concentration is relatively higher at the region right in front of the long catcher at both the pedestrian (65 mg/m3) and upper levels (35 mg/m3). Significant pollutant removal shows at the downstream region of the tunnel at pedestrian level, with the CO concentration reaching around 30 mg/m3 on average. In the downstream region, CO concentration shows a much higher value at the upper level compared with the result in the base case. This indicates that the ventilation efficiency for the downstream region is distinguishably reduced by the long catcher, and the long-catcher style might not be efficient for pollutant removal in tunnels.
In short-catcher cases, at pedestrian level, CO removal along the pavement is quite effective compared with the result in the base case (Figure 9c–e). A clear low-concentration band could be found behind where the wind catcher is positioned. As has been discussed previously, a special downstream-vortex exists in short-catcher cases, and the vortex would help transport the dispersed pollutants above the pavement from lower to higher levels in the tunnel. Figure 10 reveals how the downstream vortex influences the CO in Case_ss [150], ss [150 (2.5)] and ds [150, 150]. The vortex is not fully developed very close to the catcher position (x = 150 m), where the vortex just exists beneath the tunnel roof, with little influence on flows and CO at lower levels. As has been discussed before, the vortex would fully develop and reach the ground at about 13.5 m away from the catcher position, and the pollutants would be transported to higher levels and recirculate with the vortex. When a single short-catcher is positioned above the left pedestrian side, the high-value center of the CO concentration moves from the middle to the right and squeezes in shape, with the maximum concentration reaching 80 mg/m3 at x = 260 m (Figure 10a). Some of the CO recirculates with the anticlockwise vortex and mostly accumulates at the left-top of the tunnel. With two short-catchers arranged in parallel at x = 150 m above both pedestrian sides, the CO would recirculate and gradually fill the whole cross section at the end of the tunnel, with most of the pollutants accumulating in the middle and the top (Figure 10c). This kind of catcher arrangement would be quite efficient at reducing the CO concentration at the low-level pedestrian sides, where low values of CO concentration are always observed (Figure 10c).
When a single short-catcher is put away from the left tunnel wall (Case_ss [150 (2.5)] & ss [150 (5.0)]), another clockwise vortex occurs at the left pedestrian side. CO will not be transported upwards in the very first place but splits up with two branches of span-wise flows and accumulates at the pedestrian level (Figure 10b). Hence, this kind of catcher arrangement is not efficient for pollutant dispersion at both left and right pedestrian sides. Specified data is presented in Figure 11, in single short-catcher cases, relatively higher CO concentration could be found at the right pedestrian side, where no catcher is positioned. According to the results, in Case_ss [150], the catcher is quite effective for pollutant removal in the left pedestrian side (Figure 11a) by transporting the pollutant to the upper level of the tunnel (Figure 11b), while CO accumulates more on the lower-left pedestrian side in Case_ss [150 (2.5)], and much more severe negative effects on the right pedestrian side could also be found in this case (Figure 11a,b).
General comparison is made among the cases with these three basic catcher styles, and the results are presented in Figure 12. The features can be summarized as follows:
  • Higher pollutant concentration in upstream regions could be found for all of the wind catcher cases, and such an effect is more obvious in single long-catcher cases.
  • Pollutant removal for the left pedestrian side is quite efficient in single short-catcher cases with the wind catcher being positioned immediately above the left pedestrian side.
  • Much more severe recirculation is found in double short-catcher cases, with much higher CO concentration occupying the end of the tunnel.
Figure 9e presents the CO concentration in the staggered arrangement case (Case_ds [120, 180]) at two different layers, where significant asymmetrical distribution of CO could be found. A much clearer low-concentration band exists on the right pedestrian side at z = 1.6 m, but more pollutants accumulate at the upper level of the tunnel compared with the results in Case_ds [150, 150] (Figure 9d).

4.3. Intake Fraction (IF)

Table 4 presents the intake fraction (IF) in single long-catcher cases and compares them with IF in the base case. Due to the symmetrical features of the models, IF values along both of the pedestrian sides tend to be the same in each case, so the average IF along both pedestrian sides is presented. IF will increase when the wind catcher is positioned farther away from the tunnel entrance, i.e., from 0.46 ppm (catcher position: x = 10 m) to 1.13 ppm (catcher position: x = 240 m).
This trend can also be found among all of the short-catcher cases, and this is mainly because the upstream velocity reduction effect would be intensified when the wind catcher is positioned much farther from the tunnel entrance. Comparing with the IF in the base case, a single long-catcher should better be arranged before x = 30 m (x/L = 0.11), otherwise negative effects on pollutant removal at the pedestrian sides would occur. Additionally, it also indicates that such a long catcher might not be efficient for pollutant dispersion along the pavements though it may induce a quite intense longitudinal wind in the near catcher region.
Table 5 shows the IF in cases with a single short catcher being placed immediately above the left pedestrian side. Better air quality could be found at the left pedestrian region. In Case_ss [30], IF is reduced to 0.30 ppm, which is only 61% of the IF in the base case (0.49 ppm). However, the percentage increases to 94% when the catcher is positioned at 240 m from the tunnel entrance. Poorer ventilation conditions are found at the right pedestrian region, where the IF reaches 0.47 ppm in Case_ss [30] and increases to 0.58 ppm in Case_ss [240]. However, it is still relatively lower than that in long-catcher cases. When the single short catcher is moved away from the left tunnel wall, more CO would accumulate with the recirculation at both pedestrian sides, with the IF sharply increasing to 0.57 and 0.89 ppm in Case_ss [150 (2.5)] and Case_ss [150 (5.0)] respectively (Table 6).
For double parallel short-catcher cases, air quality at both pedestrian sides would be improved (Table 7). When wind catchers are positioned before 210 m (x/L = 0.78), better air quality occurs at both pedestrian regions compared with that in the base case. The smallest CO exposure is found in Case_ds [30, 30], i.e., 0.32 ppm, only 63% of the IF in the base case, where both of the wind catchers are placed 30 m from the tunnel entrance. When it comes to staggered cases, for example, in Case_ds [120, 180], IF at the left pedestrian side is 0.47 ppm, which is slightly lower compared with that of Case_ds [120, 120] (0.48 ppm) but relatively larger than that in Case_ss [120] (0.40 ppm). At the right pedestrian side, IF increases to 0.50 ppm in staggered Case_ds [120, 180], and it is a little larger than IF in Case_ds [180, 180] (0.48 ppm) but much smaller than that in Case_ss [120] (0.57 ppm). So two catchers would effectively avoid the negative effects that exist on the right pedestrian side in single short-catcher cases, but ventilation capacity at the left pedestrian side would be relatively poorer. Besides, even though CO concentration asymmetrically distributes along the tunnel in staggered cases, the IFs in Case_ds [120, 180] turn out to be approximately similar to those in corresponding parallel cases (i.e., Case_ds [120, 120] and Case_ds [180,180]), which might indicate that air condition at one pedestrian side in double short-catcher cases is not sensitive to the catcher position on the other side, as long as they are positioned immediately above the pavements.

5. Conclusions

This research investigates the possibility of applying wind catchers for providing natural ventilation and reducing pedestrian exposure to air pollution in short road tunnels. Computational fluid dynamics (CFD) methodology with the standard k-ε turbulence model was used to perform three-dimensional (3D) turbulent flow simulations which were validated with wind tunnel experiment data. Thirty-five cases with long and short catchers with different wind catcher arrangements were built to investigate the effects of the catcher style and arrangement on tunnel ventilation performance. The intake fraction was applied as an assessment of the in-tunnel ventilation conditions and pollutant exposure at pedestrian regions. The simulation results and outcomes can be summarized as follows:
  • Effects of catcher style:
    • Ventilation performance is much worse in cases with a long-catcher design due to extremely strong velocity reduction effects in the upstream region and large recirculation zones behind the catcher entrance.
    • A downstream vortex could be found in short-catcher cases, which will fully develop and reach the ground 13.5 m behind where the wind catcher is positioned. This vortex would help transport CO from one pedestrian side to the other and from lower to upper levels. Consequently, pollutants will accumulate at the left-top (or right-top) of the tunnel.
  • Effects of catcher arrangement:
    • Among all cases, the closer wind catchers are positioned to the tunnel entrance, the better ventilation for the inner-tunnel environment they can provide.
    • A single short-catcher above one pedestrian side will lead to a negative impact on the opposite side; when the single short-catcher is positioned away from the lateral wall, it will result in much worse ventilation performance at both pedestrian sides.
    • Double short-catchers in a parallel arrangement have generally good performance by transporting pollutants to the middle and the top regions of the tunnel. In cases with wind catchers of staggered arrangement, relatively lower IF could be found at the left pedestrian side, because the catcher is positioned much closer to the tunnel entrance on this side. CO distribution in staggered cases is asymmetrical, but the intake fraction at one pedestrian side is nearly the same as the value in the corresponding parallel case with the same catcher position. This indicates that IF is not sensitive to the catcher position at the opposite side.
From the results above, it can be concluded that design of double short-catcher in parallel arrangement is recommended for providing natural ventilation in short road tunnels, such as the Barbican in the City of London, with the smallest IF being only 61% of the base case.

Author Contributions

Conceptualization, S.L, Z.L. and J.H.; Methodology, S.L, Z.L. and K.Z.; Software, S.L.; Formal Analysis, S.L.; Investigation, S.L.; Resources, Z.L, and J.H.; Writing-Original Draft Preparation, S.L.; Writing-Review & Editing, Z.L., S.L. K.Z. and J.H.; Visualization, S.L.

Funding

This study was funded by National Key R&D Program of China [grant No. 2016YFC0202206 and 2016YFC0202205]; the National Natural Science Foundation of China (grant No. 51478486 and 11471343) and National Natural Science Foundation—Outstanding Youth Foundation (grant No. 41622502) as well as Science and Technology Program of Guangzhou, China (grant No. 201607010066 and 2014B020216003).

Conflicts of Interest

The authors declare no conflict of interest.

Appendix A

In the preliminary study, we have conducted tests on a real shape model, which is presented in Figure A1. Columns at the opening of the wind catcher and the thickness of the walls are considered in the test case. The results have been compared with that in Case_ss [150] (Figure A2). Results show that span-wise velocity and vertical velocity along the left pedestrian side show similar patterns and fit quite well with each other. Small differences only appear in near catcher regions due to situations where fluctuation and blockage of the ground strongly impinge. Since the focus of this research is on the relative ventilation performance of tunnel-catcher models, the small differences in the near catcher region can be neglected. Besides, in real shape models, over 4,000,000 meshes are built, and this figure is nearly double that in simplified models. Hence, we employed the simplified models in our case study without considering the effect of catcher columns and wall thickness. Similar study methods are found in the literature [20].
Figure A1. Model and grid distribution in real shape case in preliminary test.
Atmosphere 09 00411 g0a1
Figure A2. Span-wise velocity and vertical velocity along left pedestrian side in Case_ss [150] and Case_ss [150] (real shape). (a) Span-wise velocity; (b) vertical velocity.
Atmosphere 09 00411 g0a2

References

  1. Francis, L.; Stockwell, H. Science in the City: Barbican Report. Available online: https://www.cityoflondon.gov.uk/business/environmental-health/environmental-protection/air-quality/Pages/Air-Quality-Champions.aspx (accessed on 12 October 2013).
  2. Keyte, I.J.; Albinet, A.; Harrison, R.M. On-road traffic emissions of polycyclic aromatic hydrocarbons and their oxy- and nitro-derivative compounds measured in road tunnel environments. Sci. Total. Environ. 2016, 566–567, 1131–1142. [Google Scholar] [CrossRef] [PubMed]
  3. Kim, J.Y.; Lee, J.Y.; Kim, Y.P.; Lee, S.-B.; Jin, H.C.; Bae, G.-N. Seasonal characteristic of the gaseous and particulate PAHs at a roadside station in Seoul, Korea. Atmos. Res. 2012, 116, 142–150. [Google Scholar] [CrossRef]
  4. Wingfors, H.; Sjödin, A.; Haglund, P.; Brorström-Lundén, E. Characterisation and determination of profiles of polycyclic aromatic hydrocarbons in a traffic tunnel in Gothenburg Sweden. Atmos. Environ. 2001, 35, 6361–6369. [Google Scholar] [CrossRef]
  5. Betta, V.; Cascetta, F.; Musto, M.; Rotondo, G. Numerical study of the optimization of the pitch angle of an alternative jet fan in longitudinal tunnel ventilation system. Tunn. Undergr. Space Technol. 2009, 24, 164–172. [Google Scholar] [CrossRef]
  6. Bogdan, S.; Birgmajer, B.; Kovačić, Z. Model predictive and fuzzy control of a road tunnel ventilation system. Transp. Res. C-Emerg. Technol. 2008, 16, 574–592. [Google Scholar] [CrossRef]
  7. Betta, V.; Cascetta, F.; Musto, M.; Rotondo, G. Fluid dynamic performances of traditional and alternative jet fans in tunnel longitudinal ventilation systems. Tunn. Undergr. Space Technol. 2010, 25, 415–422. [Google Scholar] [CrossRef]
  8. Eftekharian, E.; Dastan, A.; Abouali, O.; Meigolinedjad, J.; Ahmandi, G. A numerical investigation into the performance of two types of jet fans in ventilation of an urban tunnel under traffic jam condition. Tunn. Undergr. Space Technol. 2014, 44, 56–67. [Google Scholar] [CrossRef]
  9. Wang, F.; Wang, M.N.; He, S.; Zhang, J.S.; Deng, Y.Y. Computational study of effects of jet fans on the ventilation of a highway curved tunnel. Tunn. Undergr. Space Technol. 2010, 25, 382–390. [Google Scholar] [CrossRef]
  10. Peeling, J.; Waymann, M.; Mocanu, I.; Nitsche, P.; Rands, J.; Potter, J. Energy efficient tunnel solutions. In Proceedings of the 6th Transport Research Arena, Warsaw, Poland, 18–21 April 2016. [Google Scholar]
  11. Harish, R.; Venkatasubbaiah, K. Effects of buoyancy induced roof ventilation systems for smoke removal in tunnel fires. Tunn. Undergr. Space Technol. 2014, 42, 195–205. [Google Scholar] [CrossRef]
  12. Tang, F.; Mei, F.Z.; Li, L.J.; Chen, L.; Ding, J.X.; Wang, Q.; Xu, X.Y. Ceiling smoke front velocity in a tunnel with central mechanical exhaust system: Comparison of model predictions with measurements. Appl. Therm. Eng. 2017, 127, 689–695. [Google Scholar] [CrossRef]
  13. Tang, F.; Mei, F.Z.; Wang, Q.; He, Z.; Fan, C.G.; Tao, C.F. Maximum temperature beneath the ceiling in tunnel fires with combination of ceiling mechanical smoke extraction and longitudinal ventilation. Tunn. Undergr. Space Technol. 2017, 68, 231–237. [Google Scholar] [CrossRef]
  14. Tanaka, F.; Kawabata, N.; Ura, F. Effects of a transverse external wind on natural ventilation during fires in shallow urban road tunnels with roof openings. Fire Saf. J. 2016, 79, 20–36. [Google Scholar] [CrossRef]
  15. Chen, L.F.; Hu, L.H.; Zhang, X.L.; Zhang, X.Z.; Zhang, X.C.; Yang, L.Z. Thermal buoyant smoke back-layering flow length in a longitudinal ventilated tunnel with ceiling extraction at difference distance from heat source. Appl. Therm. Eng. 2015, 78, 129–135. [Google Scholar] [CrossRef]
  16. Dehghani-sanij, A.R.; Soltani, M.; Raahemifar, K. A new design of wind tower for passive ventilation in buildings to reduce energy consumption in windy regions. Renew. Sustain. Energy Rev. 2015, 42, 182–195. [Google Scholar] [CrossRef]
  17. Soltani, M.; Dehghani-Sanij, A.; Sayadnia, A.; Kashkooli, F.M.; Gharali, K.; Mahbaz, S.B.; Dusseault, M. Investigation of airflow patterns in a new design of wind tower with a wetted surface. Energy 2018, 11, 1100. [Google Scholar] [CrossRef]
  18. Afshin, M.; Sohankar, A.; Dehghan-Manshadi, M.; Kazemi-Esfeh, M. An experimental study on the evaluation of natural ventilation performance of a two-sided wind-catcher for various wind angles. Renew. Energy 2016, 85, 1068–1078. [Google Scholar] [CrossRef]
  19. Montazeri, H. Experimental and numerical study on natural ventilation performance of various multi-opening wind catchers. Build. Environ. 2011, 46, 370–378. [Google Scholar] [CrossRef]
  20. Montazeri, H.; Montazeri, F. CFD simulation of cross-ventilation in buildings using rooftop wind-catchers: Impact of outlet openings. Renew. Energy 2018, 118, 502–520. [Google Scholar] [CrossRef]
  21. Dehghan, A.A.; Kazemi Esfen, M.; Dehghan Manshadi, M. Natural ventilation characteristics of one-sided wind catchers: Experimental and analytical evaluation. Energy Build. 2013, 61, 366–377. [Google Scholar] [CrossRef]
  22. Calautit, J.K.; O’Connor, D.; Hughes, B.R. Determining the optimum spacing and arrangement for commercial wind towers for ventilation performance. Build. Environ. 2014, 82, 274–287. [Google Scholar] [CrossRef] [Green Version]
  23. Hosseini, S.H.; Shokry, E.; Ahmadian Hosseini, A.J.; Ahmadi, G.; Calautit, J.K. Evaluation of airflow and thermal comfort in buildings ventilated with wind catchers: Simulation of conditions in Yazd City, Iran. Energy Sustain. Dev. 2016, 35, 7–24. [Google Scholar] [CrossRef]
  24. Calautit, J.K.; Hughes, B.R. A passive cooling wind catcher with heat pipe technology: CFD, wind tunnel and field-test analysis. Appl. Energy 2016, 162, 460–471. [Google Scholar] [CrossRef] [Green Version]
  25. Bahadori, M.N.; Mazidi, M.; Dehghani, A.R. Experimental investigation of new designs of wind towers. Renew. Energy 2008, 33, 2273–2281. [Google Scholar] [CrossRef]
  26. Haghighi, A.P.; Pakdel, S.H.; Jafari, A. A study of a wind catcher assisted adsorption cooling channel for natural cooling of a 2-storey building. Energy 2016, 102, 118–138. [Google Scholar] [CrossRef]
  27. He, L.J.; Hang, J.; Wang, X.M.; Lin, B.R.; Li, X.H.; Lan, G.D. Numerical investigations of flow and passive pollutant exposure in high-rise deep street canyons with various street aspect ratios and viaduct settings. Sci. Total Environ. 2017, 584–585, 189–206. [Google Scholar] [CrossRef] [PubMed]
  28. Luo, Z.W.; Li, Y.G.; Nazaroff, W.W. Intake fraction of nonreactive motor vehicle exhaust in Hong Kong. Atmos. Environ. 2010, 44, 1913–1918. [Google Scholar] [CrossRef]
  29. Marshall, J.D.; Teoh, S.K.; Nazaroff, W.W. Intake fraction of nonreactive vehicle emissions in US urban areas. Atmos. Environ. 2005, 39, 1363–1371. [Google Scholar] [CrossRef] [Green Version]
  30. Zhou, Y.; Levy, J.I. The impact of urban street canyons on population exposure to traffic-related primary pollutants. Atmos. Environ. 2008, 42, 3087–3098. [Google Scholar] [CrossRef]
  31. FLUENT V6.3. 2006. Available online: http://fluent.com (accessed on 1 December 2006).
  32. Ghadiri, M.H.; Lukman, N.; Ibrahim, N.; Mohamed, M.F. Computational analysis of wind-driven natural ventilation in a two sided rectangular wind catcher. Int. J. Vent. 2013, 12, 51–62. [Google Scholar] [CrossRef]
  33. ANSYS, Inc. ANSYS Fluent Theory Guide; ANSYS, Inc.: Canonsburg PA, USA, 2013; pp. 47–48. Available online: http://fluent.com (accessed on 1 November 2013).
  34. Mehryan, S.A.M.; Kashkooli, F.M.; Soltani, M. Comprehensive study of the impacts of surrounding structures on the aero-dynamic performance and flow characteristics of an outdoor unit of split-type air conditioner. Build. Simul. 2018, 11, 325–337. [Google Scholar] [CrossRef]
  35. Zargar, B.; Kashkooli, F.M.; Soltani, M.; Wright, K.; Ijaz, M.K.; Sattar, S. Mathematical modeling and simulation of bacteria distribution in an aerobiology chamber using computational fluid dynamics. Am. J. Infect. Control 2016, 44, S127–S137. [Google Scholar] [CrossRef] [PubMed]
  36. Tominaga, Y.; Mochida, A.; Yoshie, R.; Kataoka, H.; Nozu, T.; Yoshikawa, M.; Shirasawa, T. AIJ guidelines for practical applications of CFD to pedestrian wind environment around buildings. J. Wind Eng. Ind. Aerodyn. 2008, 96, 1749–1761. [Google Scholar] [CrossRef]
  37. Irwin, J.S. A theoretical variation of the wind profile power-law exponent as a function of surface roughness and stability. Atmos. Environ. 1979, 13, 191–194. [Google Scholar] [CrossRef]
  38. Lu, H.F.; Huang, K.; Fu, L.D.; Zhang, Z.H.; Wu, S.J.; Lyu, Y.; Zhang, X.L. Study on leakage and ventilation scheme of gas pipeline in tunnel. J. Nat. Gas Sci. Eng. 2018, 53, 347–358. [Google Scholar] [CrossRef]
  39. Ng, W.Y.; Chau, C.K. A modelling investigation of the impact of street and building configurations on personal air pollutant exposure in isolated deep urban canyons. Sci. Total Environ. 2014, 468–469, 429–448. [Google Scholar] [CrossRef] [PubMed]
  40. Habilomatis, G.; Chaloulakou, A. A CFD modelling study in an urban street canyon for ultrafine particles and population exposure: The intake fraction approach. Sci. Total Environ. 2015, 530–531, 227–232. [Google Scholar] [CrossRef] [PubMed]
  41. Hang, J.; Luo, Z.W.; Wang, X.M.; He, L.J.; Wang, B.M.; Zhu, W. The influence of street layouts and viaduct settings on daily CO exposure and intake fraction in idealized urban canyons. Environ. Pollut. 2017, 220, 72–86. [Google Scholar] [CrossRef] [PubMed]
  42. Jiang, Y.; Alexander, D.; Jenkins, H.; Arthur, R.; Chen, Q.Y. Natural ventilation in buildings: Measurement in a wind tunnel and numerical simulation with large-eddy simulation. J. Wind Eng. Ind. Aerodyn. 2003, 91, 331–353. [Google Scholar] [CrossRef]
  43. Jin, R.Q.; Hang, J.; Liu, S.S.; Wei, J.J.; Liu, Y.; Xie, J.L.; Sandberg, M. Numerical investigation of wind-driven natural ventilation performance in a multi-story hospital by coupling indoor and outdoor airflow. Indoor Built Environ. 2015, 25, 1–22. [Google Scholar] [CrossRef]
  44. Blocken, B.; Stathopoulos, T.; Carmeliet, J. CFD simulation of the atmospheric boundary layer: Wall function problems. Atmos. Environ. 2007, 41, 238–252. [Google Scholar] [CrossRef]
  45. Ai, Z.T.; Mak, C.M. A study of interunit dispersion around multistory buildings with single-sided ventilation under different wind directions. Atmos. Environ. 2014, 88, 1–13. [Google Scholar] [CrossRef]
  46. Ai, Z.T.; Mak, C.M.; Niu, J.L. Numerical investigation of wind-induced airflow and interunit dispersion characteristics in multistory residential buildings. Indoor Air 2013, 23, 417–429. [Google Scholar] [CrossRef] [PubMed]
  47. Santiago, J.L.; Martilli, A.; Martin, F. CFD simulation of airflow over a regular array of cubes. Part I: Three dimensional simulation of the flow and validation with wind-tunnel measurements. Bound.-Lay. Meteorol. 2007, 122, 609–634. [Google Scholar] [CrossRef]
  48. Nazaroff, W.W. Inhalation intake fraction of pollutants from episodic indoor emissions. Build. Environ. 2008, 43, 269–277. [Google Scholar] [CrossRef]
  49. Allan, M.; Richardson, G.M.; Jones-Otazo, H. Probability density functions describing 24-hour inhalation rates for use in human health risk assessments: An update and comparison. Hum. Ecol. Risk Assess. 2008, 14, 372–391. [Google Scholar] [CrossRef]
Figure 1. Computational Fluid Dynamic (CFD) modeling flowchart.
Atmosphere 09 00411 g001
Figure 2. (a) Physical model and boundary condition setups in tunnel-catcher simulation cases. Model and grid distribution of (b) single long-catcher cases; (c) single short-catcher cases and (d) double short-catcher cases; (e) setup in computational domain; (f) source setup in cases; (g) setup of pedestrian regions.
Atmosphere 09 00411 g002aAtmosphere 09 00411 g002b
Figure 3. (a) Domain setup and grid arrangement in validation models; (bd) vertical profile of U/Uref along lines at the center cross section of the building models. (b) x = −25/H; (c) x = H/2; (d) x = 3H/2.
Atmosphere 09 00411 g003aAtmosphere 09 00411 g003b
Figure 4. Velocity along the left pedestrian side (a) span-wise velocity under three basic catcher arrangements; (b) vertical velocity under three basic catcher arrangements.
Atmosphere 09 00411 g004
Figure 5. Velocity magnitude with streamtrace on horizontal cross section from 135 m (x/L = 0.5) to 178 m (x/L = 0.66) at pedestrian level (z = 1.6 m). (a) Base Case; (b) Case_sl [150]; (c) Case_ss [150]; (d) Case_ss [150, 2.5]; (e) Case_ds [150, 150].
Atmosphere 09 00411 g005aAtmosphere 09 00411 g005b
Figure 6. Velocity magnitude with streamlines in (a) Case_sl [150] and (b) Case_ss [150] on a vertical cross section at the central left-pedestrian region.
Atmosphere 09 00411 g006
Figure 7. Span-wise velocity on a vertical cross section at x = 148 m (x/L = 0.54) and x = 260 m (x/L = 0.96) respectively. (a) Case_sl [150]; (b) Case_ss [150]; (c) Case_ds [150, 150]; (d) Case_ss [150 (2.5)]; (e) Case_ss [150 (5.0)].
Atmosphere 09 00411 g007aAtmosphere 09 00411 g007b
Figure 8. (a) Comparison of span-wise velocity between Case_ds [120, 120], Case_ds [120, 180] and Case_ds [180, 180]; (b) comparison of vertical velocity between Case_ds [120, 120], Case_ds [120, 180] and Case_ds [180, 180].
Atmosphere 09 00411 g008
Figure 9. CO concentration on slices at z = 1.6 m and 4.0 m. (a) Case [Base]; (b) Case_sl [150]; (c) Case_ss [150]; (d) Case_ds[150, 150]; (e) Case_ds [120, 180].
Atmosphere 09 00411 g009aAtmosphere 09 00411 g009b
Figure 10. CO concentration on vertical cross section at x = 148 m (x/L = 0.54) and x = 260 m (x/L = 0.96) respectively. (a) Case_ss [150]; (b) Case_ss [150 (2.5)]; (c) Case_ds [150, 150].
Atmosphere 09 00411 g010
Figure 11. CO concentration along the left-pedestrian side in cases with three basic catcher arrangements CO concentration at (a) lower pedestrian side and (b) upper level pedestrian side.
Atmosphere 09 00411 g011
Figure 12. CO concentration in Case_ss [150] and Case_ss [150 (2.5)] at: (a) Lower level pedestrian side and (b) upper level pedestrian side.
Atmosphere 09 00411 g012
Table 1. List of Cases.
Base CaseCase Namex (m)x/L
-Case [Base]--
Series of Single Long-CatchersCase Namex (m)x/L
Atmosphere 09 00411 i001Case_sl [10]100.04
Case_sl [15]150.06
Case_sl [20]200.07
Case_sl [25]250.09
Case_sl [30]300.11
Case_sl [40]400.15
Case_sl [50]500.19
Case_sl [60]600.22
Case_sl [90]900.33
Case_sl [120]1200.44
Case_sl [150]1500.56
Case_sl [180]1800.67
Case_sl [210]2100.78
Case_sl [240]2400.89
Series of Single Short-CatchersCase Namex (m)x/Ly (m)
Atmosphere 09 00411 i002Case_ss [30]300.110
Case_ss [60]600.220
Case_ss [90]900.330
Case_ss [120]1200.440
Case_ss [150]1500.560
Case_ss [150 (2.5)]1500.562.5
Case_ss [150 (5.0)]1500.565.0
Case_ss [180]1800.670
Case_ss [210]2100.780
Case_ss [240]2400.890
Series of Double Short-CatchersCase Namex1 (m)x1/Lx2 (m)x2/L
Atmosphere 09 00411 i003Case_ds [30, 30]300.11300.11
Case_ds [60, 60]600.22600.22
Case_ds [90, 90]900.33900.33
Case_ds [120, 120]1200.441200.44
Case_ds [150, 150]1500.561500.56
Case_ds [120, 180]1200.441800.67
Case_ds [90, 210]900.332100.78
Case_ds [180, 180]1800.671800.67
Case_ds [210, 210]2100.782100.78
Case_ds [240, 240]2400.892400.89
Rules for case names: Case_Series [CP-l (dl), CP-r (dl)]; Case_sl: Series of single-long catcher; Case_ss: Series of single-short catcher; Case_ds: Series of double-short catcher; CP-l: Left catcher position (m); CP-r: Right catcher position (m) (default: No catcher on the right); dl: Distance (m) from left tunnel wall (default value: 0 m).
Table 2. Statistical metrics for the validation cases.
ValuesMesh Size (m)x = −25/Hx = H/2x = 3H/2
RNGStandardRNGStandardRNGStandard
NMSE0.1 × 0.1 × 0.10.0050.0070.0340.0590.0050.005
0.2 × 0.2 × 0.20.0110.0130.0330.0540.0100.014
0.05 × 0.05 × 0.05-0.007-0.054-0.007
FB0.1 × 0.1 × 0.10.0500.0440.088−0.0280.0020.036
0.2 × 0.2 × 0.20.0530.066−0.023−0.0170.0460.079
0.05 × 0.05 × 0.05-0.050-0.014-0.049
R0.1 × 0.1 × 0.10.9940.9910.9760.9610.9910.993
0.2 × 0.2 × 0.20.9840.9850.9770.9610.9860.985
0.05 × 0.05 × 0.05-0.991-0.961-0.993
Table 3. Breathing rate for various age groups in different microenvironments [49].
Breathing Rate Br (m3/day)Indoor at HomeNear Vehicle
Children12.514
Adults13.815.5
Elderly13.114.8
Table 4. Intake Fraction (IF) in cases with a single long catcher.
Case NameCatcher Position x (m)IF (ppm)
-Case [Base]-0.49
Atmosphere 09 00411 i004Case_sl [10]100.46
Case_sl [15]150.47
Case_sl [20]200.47
Case_sl [25]250.48
Case_sl [30]300.49
Case_sl [40]400.50
Case_sl [50]500.51
Case_sl [60]600.66
Case_sl [90]900.64
Case_sl [120]1200.66
Case_sl [150]1500.65
Case_sl [180]1800.69
Case_sl [210]2100.74
Case_sl [240]2401.13
Table 5. Intake Fraction (IF) in cases with a single short catcher above the left-pedestrian side.
Case Namex (m)IF (ppm)
Left-PedRight-PedAverage
-Case [Base]-0.490.490.49
Atmosphere 09 00411 i005Case_ss [30]300.300.470.39
Case_ss [60]600.350.510.43
Case_ss [90]900.380.540.46
Case_ss [120]1200.400.570.49
Case_ss [150]1500.400.600.50
Case_ss [180]1800.410.600.51
Case_ss [210]2100.430.600.51
Case_ss [240]2400.460.580.52
Table 6. Intake Fraction (IF) in cases with a single small catcher at 150 m.
Case Namey (m)IF (ppm)
Left-PedRight-PedAverage
-Case [Base]-0.490.490.49
Atmosphere 09 00411 i006Case_ss [150]00.400.600.50
Case_ss [150 (2.5)]2.50.570.630.60
Case_ss [150 (5.0)]5.00.890.800.84
Table 7. Intake Fraction (IF) in cases with two short catchers.
Case NameCatcher PositionIF (ppm)
-Case [Base]-0.4900
Parallel arrangement x (m)Averaged
Atmosphere 09 00411 i007Case_ds [30, 30]300.32
Case_ds [60, 60]600.39
Case_ds [90, 90]900.45
Case_ds [120, 120]1200.48
Case_ds [150, 150]1500.48
Case_ds [180, 180]1800.48
Case_ds [210, 210]2100.49
Case_ds [240, 240]2400.52
Staggered arrangement x1 (m)x2 (m)Left-PedRight-Ped
Atmosphere 09 00411 i008Case_ds [120, 180]1201800.470.50
Case_ds [90, 210]902100.450.49

