Article

Observational Characterization of the Synoptic and Mesoscale Circulations in Relation to Crop Dynamics: Belg 2017 in the Gamo Highlands, Ethiopia

by
Thomas T. Minda
1,2,*,
Michiel K. van der Molen
1,
Bert G. Heusinkveld
1,
Paul C. Struik
3 and
Jordi Vilà-Guerau De Arellano
1
1
Meteorology and Air Quality Group, Wageningen University and Research, P.O. Box 47, 6700 AA Wageningen, The Netherlands
2
Faculty of Meteorology and Hydrology, Arba Minch Water Technology Institute, Arba Minch University, P.O. Box 21, Arba Minch, Ethiopia
3
Centre for Crop Systems Analysis, Wageningen University and Research, P.O. Box 430, 6700 AK Wageningen, The Netherlands
*
Author to whom correspondence should be addressed.
Atmosphere 2018, 9(10), 398; https://doi.org/10.3390/atmos9100398
Submission received: 7 July 2018 / Revised: 23 September 2018 / Accepted: 29 September 2018 / Published: 11 October 2018
(This article belongs to the Section Biosphere/Hydrosphere/Land–Atmosphere Interactions)

Abstract

:
The Gamo Highlands in Ethiopia are characterized by complex topography and lakes. These modulate the mesoscale and synoptic scale weather systems. In this study, we analyzed the temporal and spatial variations in weather as function of topography and season and their impact on potato crop growth. To determine how crop growth varies with elevation, we installed a network of six automatic weather stations along two transects. It covers a 30-km radius and 1800-m elevation difference. We conducted a potato field experiment near the weather stations. We used the weather observations as input for a crop model, GECROS. Data analysis showed large differences between weather in February and May. February is more dominated by mesoscale circulations. The averaged February diurnal patter shows a strong east to southeast lake breezes and, at night, weak localized flows driven by mountain density flows. In contrast, in May, the synoptic flow dominates, interacting with the mesoscale flows. The GECROS model satisfactorily predicted the elevational gradient in crop yield. Model sensitivity experiments showed that belg-averaged precipitation distribution gave the highest yield, followed by exchanging May weather observations with April.

1. Introduction

Potato (Solanum tuberosum L.) is becoming an important crop in Ethiopia [1,2]. The optimal climatological conditions for potato crop growth are 15 to 25 °C mean daily temperature [3,4,5,6]. Higher temperatures inhibit tuberization, promote foliage growth, and reduce allocation of carbon and nitrogen to the tubers [6]. Potato requires more than 600 mm of annual total precipitation [6,7]. The crop consumes 500 to 700 mm of water, while inadequate availability of soil water during the growing season results in reduced yield [5]. These climatic conditions generally occur in the Gamo Highlands at elevations >1600 m above sea level (a.s.l.) [8]. The crop mainly grows during the belg (February to May) cropping season, because this is the season when precipitation provides the moisture for the seed tubers to sprout [2,9]. The season shows lower risk of crop diseases such as late blight than in other seasons [9]. Note that the Ethiopian climate, according to the National Meteorology Agency (NMA), is classified in three regimes namely belg (Feb to May), kirmet (Jun to Sep), and bega (Oct to Jan) [2,10]. The majority of this staple food in Ethiopia is produced by rain-fed agriculture. Only 4–5% of the agricultural land is irrigated in the country [11]. Consequently, potato growth strongly depends on weather and its interaction with elevation.
Here, we study the interplay among weather, potato crop growth, and elevation in the Gamo Highlands in southern Ethiopia in the belg growing season. This region is characterized by a diverse landscape and complex topography with altitudes ranging from 1100 to 3600 m a.s.l. It is part of the Great East African Rift Valley system, which is over 5500 km long, extending from the Red Sea junction, through Ethiopia, Kenya, and Mozambique to Lake Victoria [12]. The Gamo Highlands contain two large lakes, namely Lake Abaya (covering 1162 km2) and Lake Chamo with 317 km2, farmlands, settlements, wooded land, grasslands, and forests [13]. The steep elevation variation with the water bodies play a role in modulating weather on diurnal to seasonal time scales, as well as the climate of the region. Obviously, these factors influence crop growth across the elevations [2].
Weather in East African regions, just north of the Equator, shows a bimodal precipitation regime following the north–south displacement of the Intertropical Convergence Zone (ITCZ) [14]. The ITCZ oscillates between 10° south (S) and 20° north (N) in the African continent and strongly influences the annual precipitation cycle of the region [14,15,16]. However, weather in the Gamo Highlands is not only controlled by the position of the ITCZ, but also by atmospheric flows driven by complex topography and land heterogeneity [17]. These atmospheric phenomena interact differently during the early and later stages of the belg season, inducing a pronounced precipitation seasonality with elevation.
Generally, in tropical mountainous regions like the Gamo Highlands, orographic and thermally driven circulations play important roles in determining the local weather/climate dynamics of the region [17,18,19,20]. These dynamics depend on the orographic spatial orientation defined by the terrain altitude, slope, and aspect angle. The terrain orientation affects wind patterns, potentially affecting convergence, convection, and precipitation [20]. The contrast between the large water bodies and land may also play an important role [20]. Lake breezes can be superimposed on orographic flows and on the development of boundary layers [18,20,21]. Haile et al. [20] and Rientjes et al. [22] showed that Lake Tana in Ethiopia modulates the mesoscale circulations trend of its surroundings. For example, the diurnal precipitation of a location in the Lake Tana basin is correlated with the distance to the lake [20]. This finding, in line of our main goal, shows the role of the lake in influencing the local weather and climate. In addition, Pierre et al. [17] and Rientjes et al. [22] showed that Lake Tana also influences the diurnal distribution of the local weather around the basin. During daytime, lake breezes diverge from the lakes to the warmer surroundings and, during nighttime, land breeze flows converge to the warmer lake.
At the beginning of the belg season, in February, the ITCZ is positioned around 15° S and marches to the north. During this period, north-easterly, dry winds from the Arabian Peninsula reach the Gamo Highlands in southern Ethiopia [23,24]. In the subsequent wetter months of April and May, the ITCZ moves overhead toward northern Ethiopia. Consequently, south to southeasterly synoptic winds with high moisture content from the Indian Ocean reach the southern part of Ethiopia [23].
Simultaneous to this synoptic variability, during daytime, heating of the slopes induces valley winds, which draw air upward to converge at the mountaintop [25]. The lake breezes can reinforce these flows. During the nighttime, however, cooling over the higher terrain induces downslope flows. These nocturnal mountain winds normally have a smaller vertical dimension than the daytime valley winds and are more influenced by local topography. The heating/cooling over the high elevation may trigger dynamic flows such as gravity waves and drag [25]. These topography-triggered circulations may facilitate/suppress convective precipitation while converging/diverging with large-scale flows, and thus, influence precipitation formation.
Due to the relevance of large and small spatiotemporal scales, predictions of key weather variables become challenging. For example, global climate models predict an increasing trend in precipitation (up to 18% in East Africa at the end of the century) [26,27,28]. However, observations (gauged observations with merged satellite data) show a decreasing trend [29]. These opposing trends of precipitation in models and observations were coined the “East African Climate Paradox” [29].
The current crop models used for monitoring crop growth and yield predictions use a coarse resolution model input for weather variables: models [30], re-analysis [31], or interpolated station observations [32,33]. The typical model resolution is tens of kilometers [31,32,33]. If the models employ observations, they are normally few or unevenly distributed [32]. In complex topographic regions such as the Gamo Highlands, coarse resolution weather products smooth out topography, which leads to an increase the uncertainty of the weather variables. In this circumstance, the average topography is often below the potato-growing zone, which results in crop yield underestimation [2]. This is because the weather could be warmer, less cloudy, and drier than the anticipated. Our aim in designing and implementing the Gamo Ethiopian Meteorological Stations (GEMS) network is to provide reliable meteorological information to be used in monitoring meteorological conditions in complex topographic regions. These observations can be further employed for the evaluation of fine-resolution weather and crop models.
Minda et al. [2] applied crop a fine resolution (2 km × 2 km) weather model to represent the spatial meteorological variables during the years 2001 to 2010 in the Gamo Highlands. The analysis showed that precipitation increases and temperature decreases upward into the mountains as expected, creating an elevation zone between 1700 and 3000 m where potato grows optimally. The analysis also showed that the model was dry-biased in the valley and wet-biased in elevated areas. This underlines that fine resolution modeling is necessary, but not sufficient in topographically complex regions. Ground-truthing, quantified by continuous and high-quality measurements, remains essential for understanding and verification [34,35].
In sub-Saharan countries, weather station networks are typically sparse, unevenly distributed (they are mostly installed along main roads, in cities and towns away from agricultural land) and often with data gaps [36,37,38]. In Ethiopia, a country covering an area of 1.104 million km2, there are only 22 synoptic stations [39]. Moreover, there are few networks focusing at sub-daily temporal resolution [17,20]. Haile et al. [20] used a network of ten rain gauge stations collecting data on an hourly basis in the Lake Tana basin. Still, a reliable, sub-hourly meteorological information across elevation gradients is crucial to explain crop growth [2]. Given the geographical location of the Gamo Highlands and the complex topography, the major meteorological crop drivers exhibit large spatial and temporal variabilities, in which the impact on crop growth is significant.
Therefore, to complement our model strategy and filling the gap of current observations, we deployed a relatively dense weather stations network, for Eastern African standards, to measure the spatial and temporal variations of weather and crop growth: the GEMS network. The network was established as a continuous operational weather monitoring station in the Gamo Highlands. It was designed along two mountain transects, to better monitor the local circulations, and installed at representative altitudes to study the role of meteorology on potato crop growth in the region. The GEMS network measures weather plus soil moisture/temperature and leaf wetness at 15-min intervals of data recorded continuously since April 2016. To our knowledge, this is the first high-spatial-resolution network of weather stations with sub-hourly measurements of all major weather variables including soil/leaf wetness observations in Ethiopia. Recently, we extended the meteorological measurements in the GEMS network with crop measurements at potato experimental farm trials, e.g., plant height, canopy cover, yield, and the length of the growing season (LGS) [2]. The GEMS network allows us, for the first time in Ethiopia, to study the synergy between synoptic and mesoscale weather dynamics and crop growth in the Gamo Highlands.
The objective of this study was, therefore, to study the temporal and spatial variations in weather as a function of topography and their impact on potato crop growth during the belg season of 2017. The specific research questions were as follows:
  • How does the topography and presence of lakes induce mesoscale circulations in the Gamo Highlands during the belg season?
  • How do the mesoscale circulations interact with the synoptic circulation driven by the ITCZ?
  • How do the weather variations resulting from this interaction affect crop growth?
As such, we used the dataset from our new GEMS network in the Gamo Highlands. Our analysis was based on almost entirely on observations. Only to determine the impact of meteorology, we employed a potato growth model [2,40] using the newly GEMS observed weather information as input. In doing so, we improved our understanding about crop dynamics as affected by elevation and meteorology.
The paper is structured as follows: Section 2 presents the GEMS network, field experiments in potato crop, and the plan to use the network for weather and crop dynamics study. Section 3 shows results from the GEMS dataset in explaining the mesoscale and synoptic dynamics with crop growth modeling. The discussion and conclusions are provided in Section 4 and Section 5.

2. Methods

2.1. Description of the GEMS Network Dataset

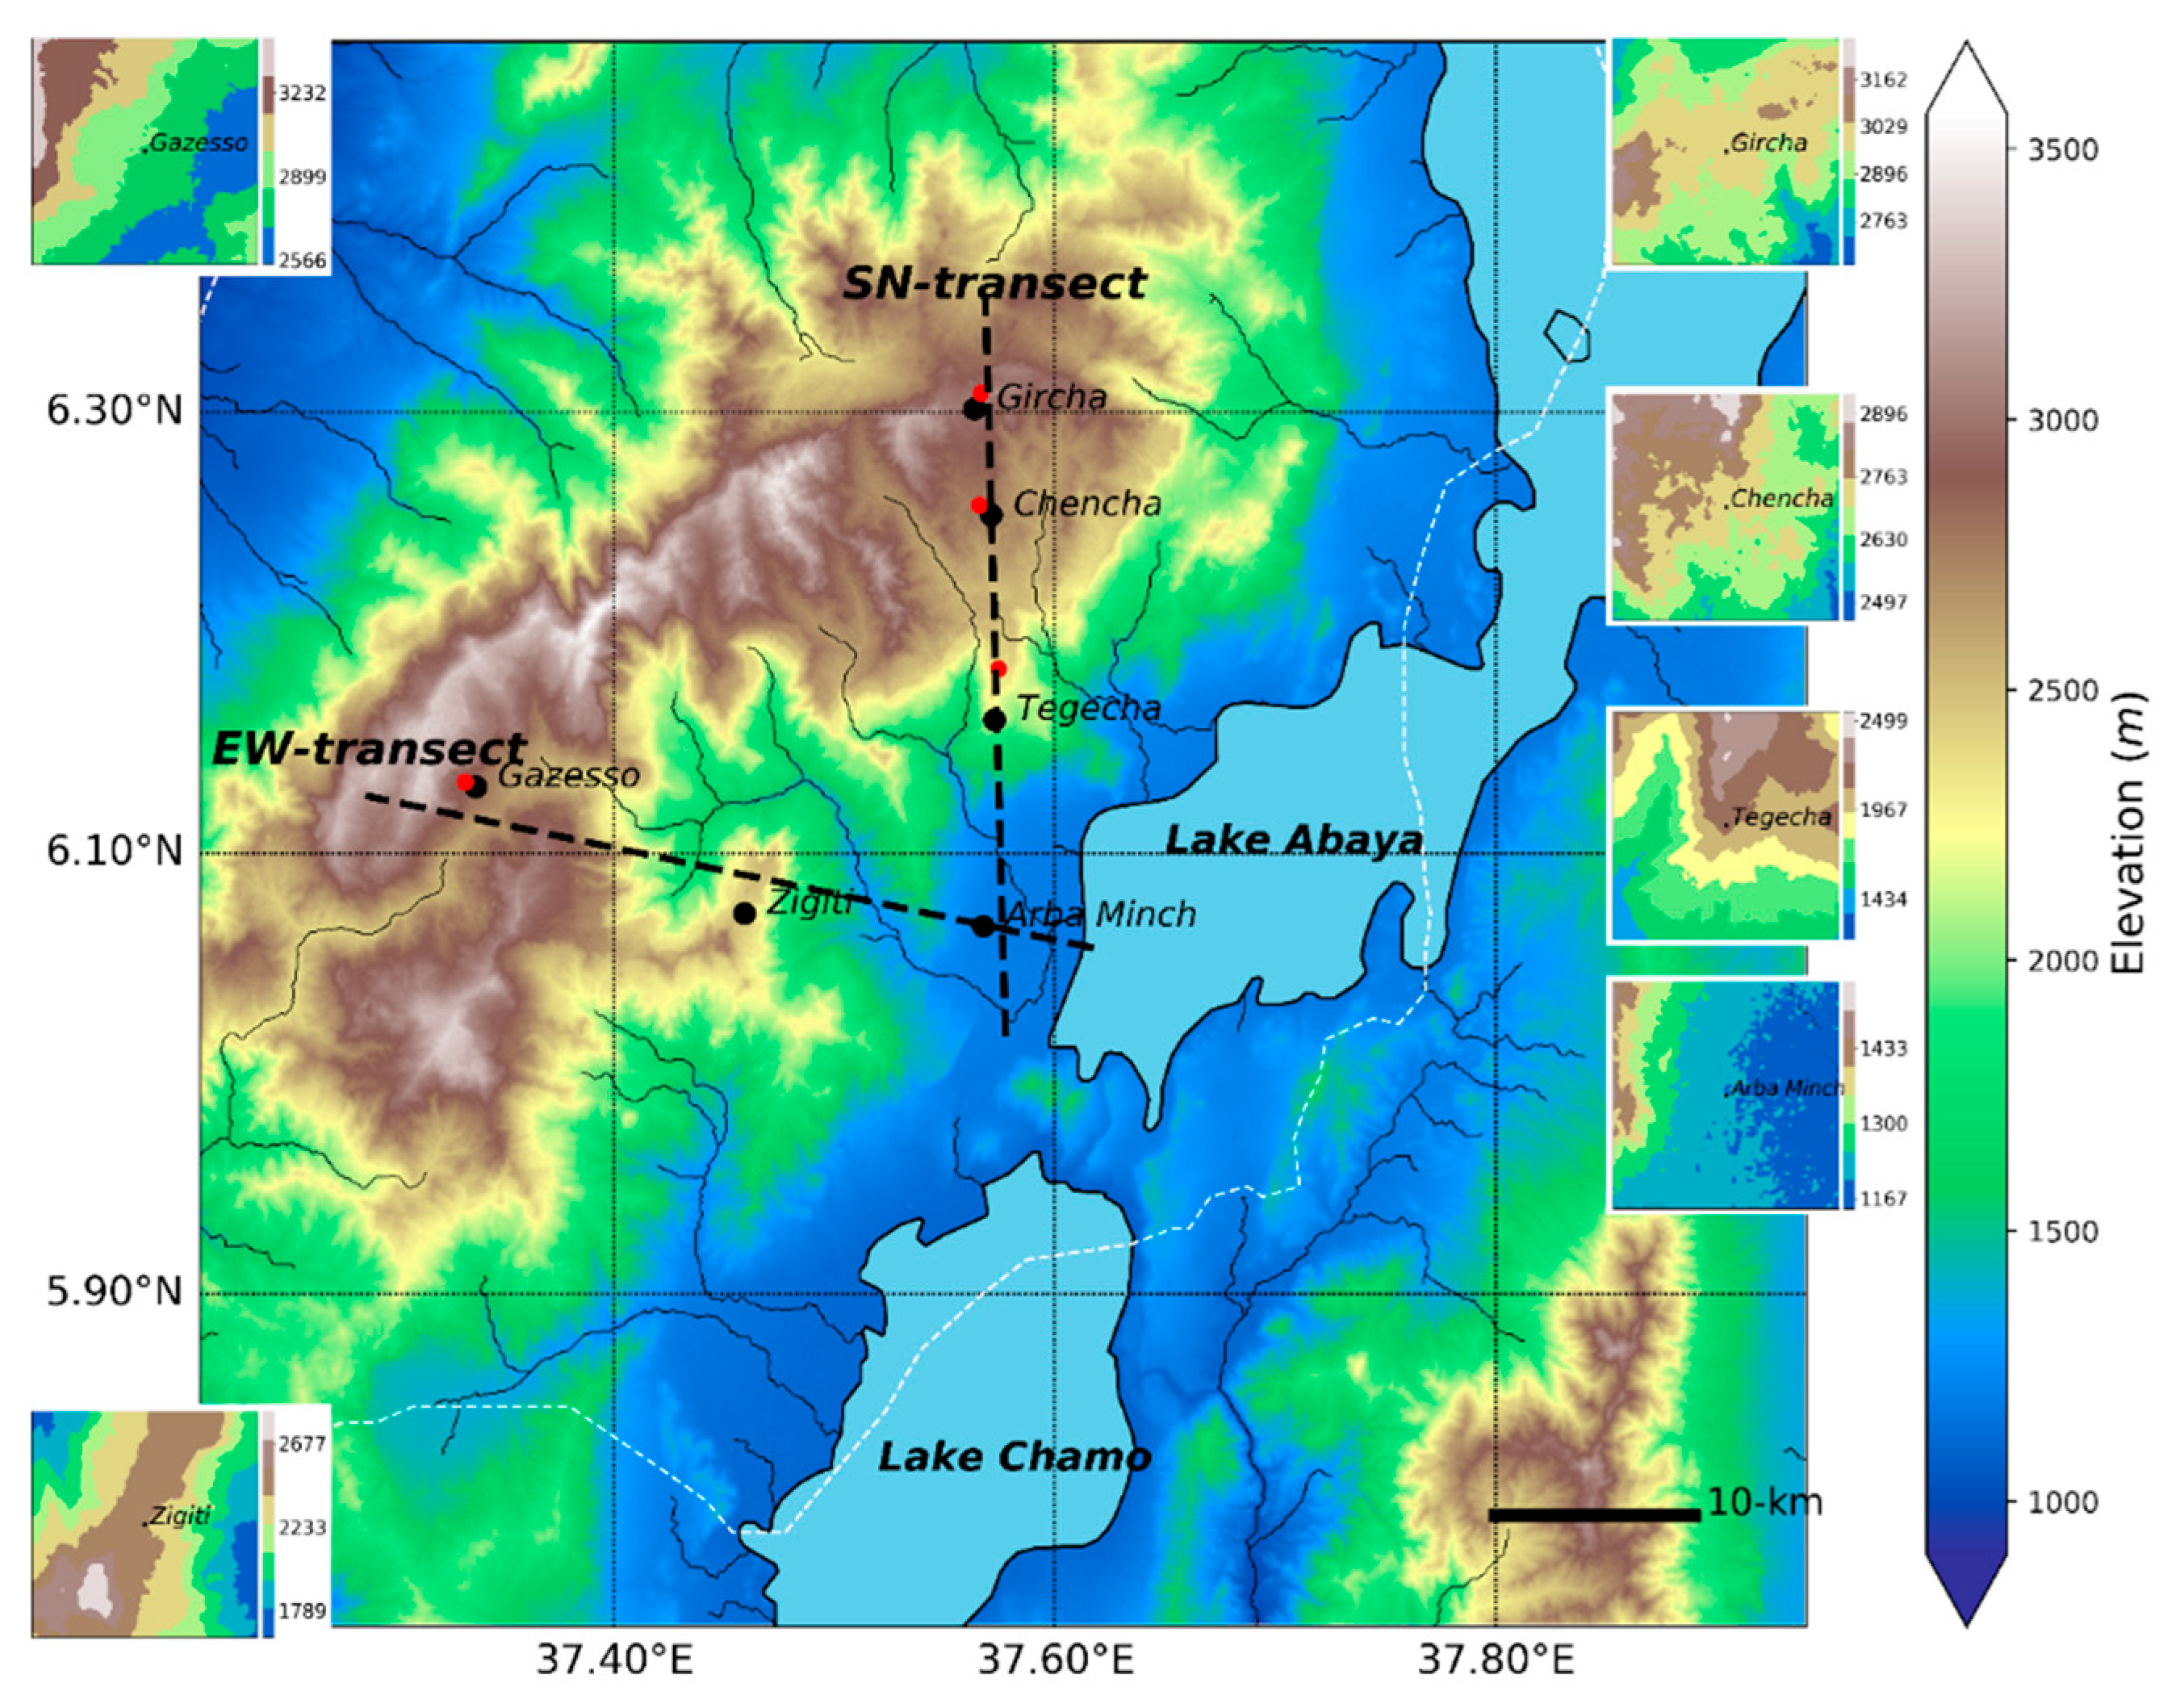
In April 2016, we installed a network of six automatic weather stations along two transects in the Gamo Highlands, Ethiopia. These highlands include complex terrain with elevation ranging from 1100 to 3600 m a.s.l., covered by a mixture of forests, bare and agricultural lands, and two large lakes (~10 km × 100 km). The Arba Minch station, close to the Lake Abaya and Arba Minch University main campus, was used as a reference station with which we compared the results of all the highland stations. Except for Arba Minch and Zigiti, all the stations are located on the terrain of experimental potato farms. All the station sites are not irrigated and covered by short grasses. Description of the locations of the stations in the GEMS network crop planting dates are shown in Table 1 and Figure 1.
Figure 1 shows the location of the stations and potato crop field trial farms related to the topography in the digital elevation model (DEM) (accessed from Reference [41]). The DEM has a horizontal resolution of 30 m. It is relevant to mention that, in designing the GEMS network, we defined a south–north (SN) transect, composed of the stations Arba Minch, Tegecha, Chencha, and Gircha, and an east–west (EW) transect, composed of the stations Arba Minch, Zigiti, and Gazesso. The SN transect starts in the non-potato growing zone near Arba Minch and Lake Abaya, and moves into the higher-elevation potato growing areas around Tegecha, Chencha, and Gircha. This transect is a south-facing slope. Potato is the major crop along this transect during the belg season, while farmers also grow enset (Ensete ventricosum, known as Ethiopian banana), wheat, barley, vegetables, and apple [42]. Gircha is nearly at the top of the mountains and represents locations which are somewhat higher than the main potato-growing elevation range. The EW transect also starts in Arba Minch. The east-facing slope to Zigiti is very steep. Zigiti is in a diverse, small-scale agricultural landscape where local farmers mainly grow wheat and barley, followed by enset and potato during the belg cropping season. Moving from Zigiti, the transect enters into the next valley, where the Gazesso station is located on an east-facing slope. Its exposure to the lake breezes will probably be different. In the EW transect, potato is grown starting from the Zigiti station. The GEMS network set-up in two transects allows us to study how the locations are influenced by the mesoscale (e.g., lake breezes and mountain flows) and large-scale weather systems such as the ITCZ and their roles in potato crop dynamics in the highlands.
The GEMS network measures (1) meteorological variables; (2) soil moisture tension and soil temperature at four depths (5, 10, 20, and 40 cm); and (3) leaf wetness (an artificial-leaf electrical-resistance type that indicates whether the surface of a foliage in the area is wet or dry by indicating how wet the surface of the sensor is) facing east and west directions (Table 2) [43]. These environmental variables were measured at the data update interval shown in Table 2 for each sensor in which 15-min statistics were recorded. Five of the six GEMS are Davis Vantage Pro2 + (DVP2) automatic weather stations and the other (in Chencha) is a Campbell instrument model (Campbell Scientific (CS) CR200X series data-logger, CS Africa, South Africa). Both weather stations are widely used globally [44,45,46]. These stations showed the best agreement compared with a professional meteorological monitoring system for air temperature, relative humidity, dew point, and precipitation measurements in a systematic comparison [46]. Station maintenance, cleaning of sensors, temperature/relative humidity sensor radiation shields, and precipitation buckets were done on a weekly basis for the Arba Minch station and a two-weekly basis for the other ones, which are off-road and remote stations. Although we installed GEMS network starting April 2016, in this study, we selected the belg of 2017, because of its relevance to potato growth [2].

2.2. ITCZ Progression

To determine the synoptic circulations, we used the GEMS network sea-level pressure (SLP) data and related it to the ITCZ data obtained from the NOAA Climate Prediction Center (NOAA-CPC) and the African Center for Meteorological Application for Development (ACMAD) [48,49]. The NOAA-CPC calculates the ITCZ latitudinal variation from the daily analysis of two key weather properties: (i) the location where the surface dew point temperature is closest to the 15-degree isodrosotherm; (ii) the region where the lower-level (925 hPa) wind streamlines delineate the axes of zonal convergence. These 10-daily averaged data are available for 15° west (W) to 35° east (E) from April to October. We considered the ITCZ latitudinal variation at 35° E. Note that the Gamo Highlands are located at ~37° E.

2.3. Analysis of the GEMS Dataset

Southern Ethiopia shows a bimodal precipitation regime, in which the main precipitation is during the belg season with rainfall maxima in April [14]. The year 2017 is characterized by a weak La Niña condition in the central and eastern Pacific Ocean [50]. As a result, southern Ethiopia showed a 1–2 °C warmer and drier (30–50% less precipitation) season as compared to the 1981–2010 ERA-Interim data [51] during three months (March to May) of the belg 2017.
The GEMS network is planned as a long-term (more than five years) meteorological monitoring stations’ network. These data will be combined with crop growth monitoring field experiments to understand how certain varieties adjust to this meteorology depending on elevation. We selected the belg season during 2017 because of its meteorological (moisture availability) and agronomical suitability to grow potato [9]. From the belg season, we further selected the months of February and May because of their contrasting circulation regimes. February (dry) is predominantly driven by mesoscale regimes whereas large-scale circulation features mainly influence May (wet). For February, we focused on the temporal and spatial variabilities of mesoscale dynamics (e.g., wind and the conserved variables such as potential temperature (θ; K) and specific humidity (q; g·kg−1)). For May, we analyzed precipitation, which is predominantly driven by large-scale circulation features such as the ITCZ and further pronounced by elevation. We analyzed the May precipitation data along the SN transect (for Arba Minch, Tegecha, and Chencha), because the data were more complete than the EW transect.
Our criteria for distinguishing between day and night were as follows: we considered incoming shortwave radiation (SW↓) >20 W·m−2 as day conditions and SW↓ = 0 W·m−2 as night conditions. To calculate θ and q, we needed pressure at stations’ locations. Note that the DVP2 stations calculate the necessary correction factor to consistently translate atmospheric pressure to SLP to standardize pressure measurements at different altitudes [52]. The stations’ atmospheric pressure is calculated (with the sea-level temperature being estimated from the projected temperature of the GEMS network measurements) for a column of air between sea level and a station’s elevation using the hypsometric equation [53]. We also calculated tendencies (time-derivatives of θ and q; ∂θ/∂t and ∂q/∂t) to investigate lake breeze and mountain-breeze flow development during the prominent mesoscale-driven month. DVP2 stations measure soil moisture tension of the soil on a scale of 0 kPa (wettest soil) to 200 kPa (driest soil). The Watermark soil moisture sensor measures an electrical resistance that is related to soil water tension (Table 2) [47].

2.4. Potato Crop Field Experiment Trials

Potato field experiments at the plot scale were conducted in the vicinities of the weather stations (Tegecha, Chencha, Gircha, and Gazesso) during the belg farming season in 2017, as shown in Figure 1. We planted improved (Gudenie and Belete) [7,54] and local (Suthalo) varieties. In this study, we considered cultivar Belete as the data on this cultivar were complete for different elevations. We applied the randomized complete block (RCB) design [55] with three replications. The RCB design is recommended for experimental areas with a predictable fertility gradient and is one of the most widely applied field experimental designs in agricultural research [55]. The planting pattern was 0.75 m × 0.30 m, the plot size was 3 m × 3 m, the plant density was 4.4 plants·m−2, the fertilizer doses were 236 kg·ha−1 of nitrogen/phosphorus/sulfur (NPS: 19N, 38P2O5, 0K2O, and 7S), 125 kg·ha−1 of muriate of potash (MOP: KCl (95–99.5%)), and 165 kg·ha−1 of urea (CO(NH2)2). Fertilizers were added upon planting, but urea was split into two additions (half upon planting, half during flowering stages). Data on the crop growth variables (e.g., the plant height) were measured on a daily basis (at Gircha and Gazesso farms) and yield parameters were collected. Data were taken from the middle two rows to minimize border effect. From the two rows, five plants were randomly selected and continuously monitored for plant height; the averages of the three plots were reported. In addition, the farm management practices such as tillage were documented. The Arba Minch station (1200 m) does not have a suitable climate for growing potato crop, because the temperature is too high there [3].

2.5. Simulating Crop Growth Variation along Mountain Slope Using the GECROS Model

The GEMS network data were analyzed and used as input on a daily basis to the “Genotype-by-Environment interaction on CROp growth Simulator” (GECROS) crop model [40]. The model is the state-of-the-art crop model, which is widely applied for modeling of crop dynamics of the world’s major crops. More specifically, it was used for potato crop growth modeling [56] and also applied in the Gamo Highlands [2]. GECROS is “an eco-physiological model that predicts crop growth and development as affected by genetic characteristics, climatic, and edaphic environmental variables” [56]. The model can be used for examining responses of biomass and protein production in arable crops to both genotypic and environmental characteristics [40].
The crop model uses environmental variables and biophysical inputs such as seed weight. The weather variable inputs are SW↓ (MJ·m−2∙d−1), Tmin (°C), Tmax (°C), vapor pressure deficit (VPD; kPa), u (m·s−1), and PPT (mm∙d−1) input at a given latitude on day (d) basis. Model inputs such as crop management options, crop/genotype-specific parameters, soil type/moisture, and model constants were taken from Minda et al. [2].
The crop growth model was coupled with a process-based soil model. The soil data (percent clay in the soil, the total organic carbon in the soil, soil water content at maximum holding capacity, soil water content at field capacity, and minimum soil water content) were taken from the ISRIC database [57] following statistical analysis explained in Minda et al. [2]. For further model details, the reader is referred to Yin and van Laar [40]. Here, we used the tailored model parameters as listed in Minda et al. [2] (follow the link). Our main objectives of applying the GECROS model: using the GEMS network data, were to study the sensitivity of crop growth variables and yield to (1) elevation and (2) modifications in the stations’ weather observations.

2.6. Model’s Sensitivity to Changes in the Observed GEMS Network Dataset

GECROS enabled us to perform model sensitivity analysis of potato growth to weather variations. Therefore, we conducted the model sensitivity experiments by exchanging the weather in the peak rain belg month (May) with March (early belg rain onset assumption), with April (climatologically normal belg assumption) and with June (late belg assumption), while maintaining the data of the other periods as observed. To determine the role of the meteorological variability, we also conducted experiments with average weather input data, i.e., where GECROS was run each day with the same diurnal cycle based on the average SW↓, Tmin, Tmax, PPT, and VPD over the belg season. Table 3 presents the detailed design of the sensitivity experiments.
The control run consisted of the one presented and it was compared with crop observations. In this run, all the observed meteorological variables were the input for the model. Sensitivity experiments 1–5 (SW↓avg, Tmin, avg, Tmax, avg, PPTavg, and VPDavg) were with the same meteorological inputs, except that one variable was averaged over the belg season. Experiments 6–8 (Early belg, Normal belg, and Late belg) were again with the original meteorological data, but now the May data were exchanged either with March, April, or June data to simulate an early (max PPT in March), normal (max PPT in April), and late (max PPT in June) belg precipitation onsets, respectively. Other model input parameters and variables are identical to the experiment set-up in Minda et al. [2]. All the experiments were done for each station mentioned.

3. Results

3.1. Monthly Variability: The Role of Large-Scale Weather Dynamics in the Gamo Highlands

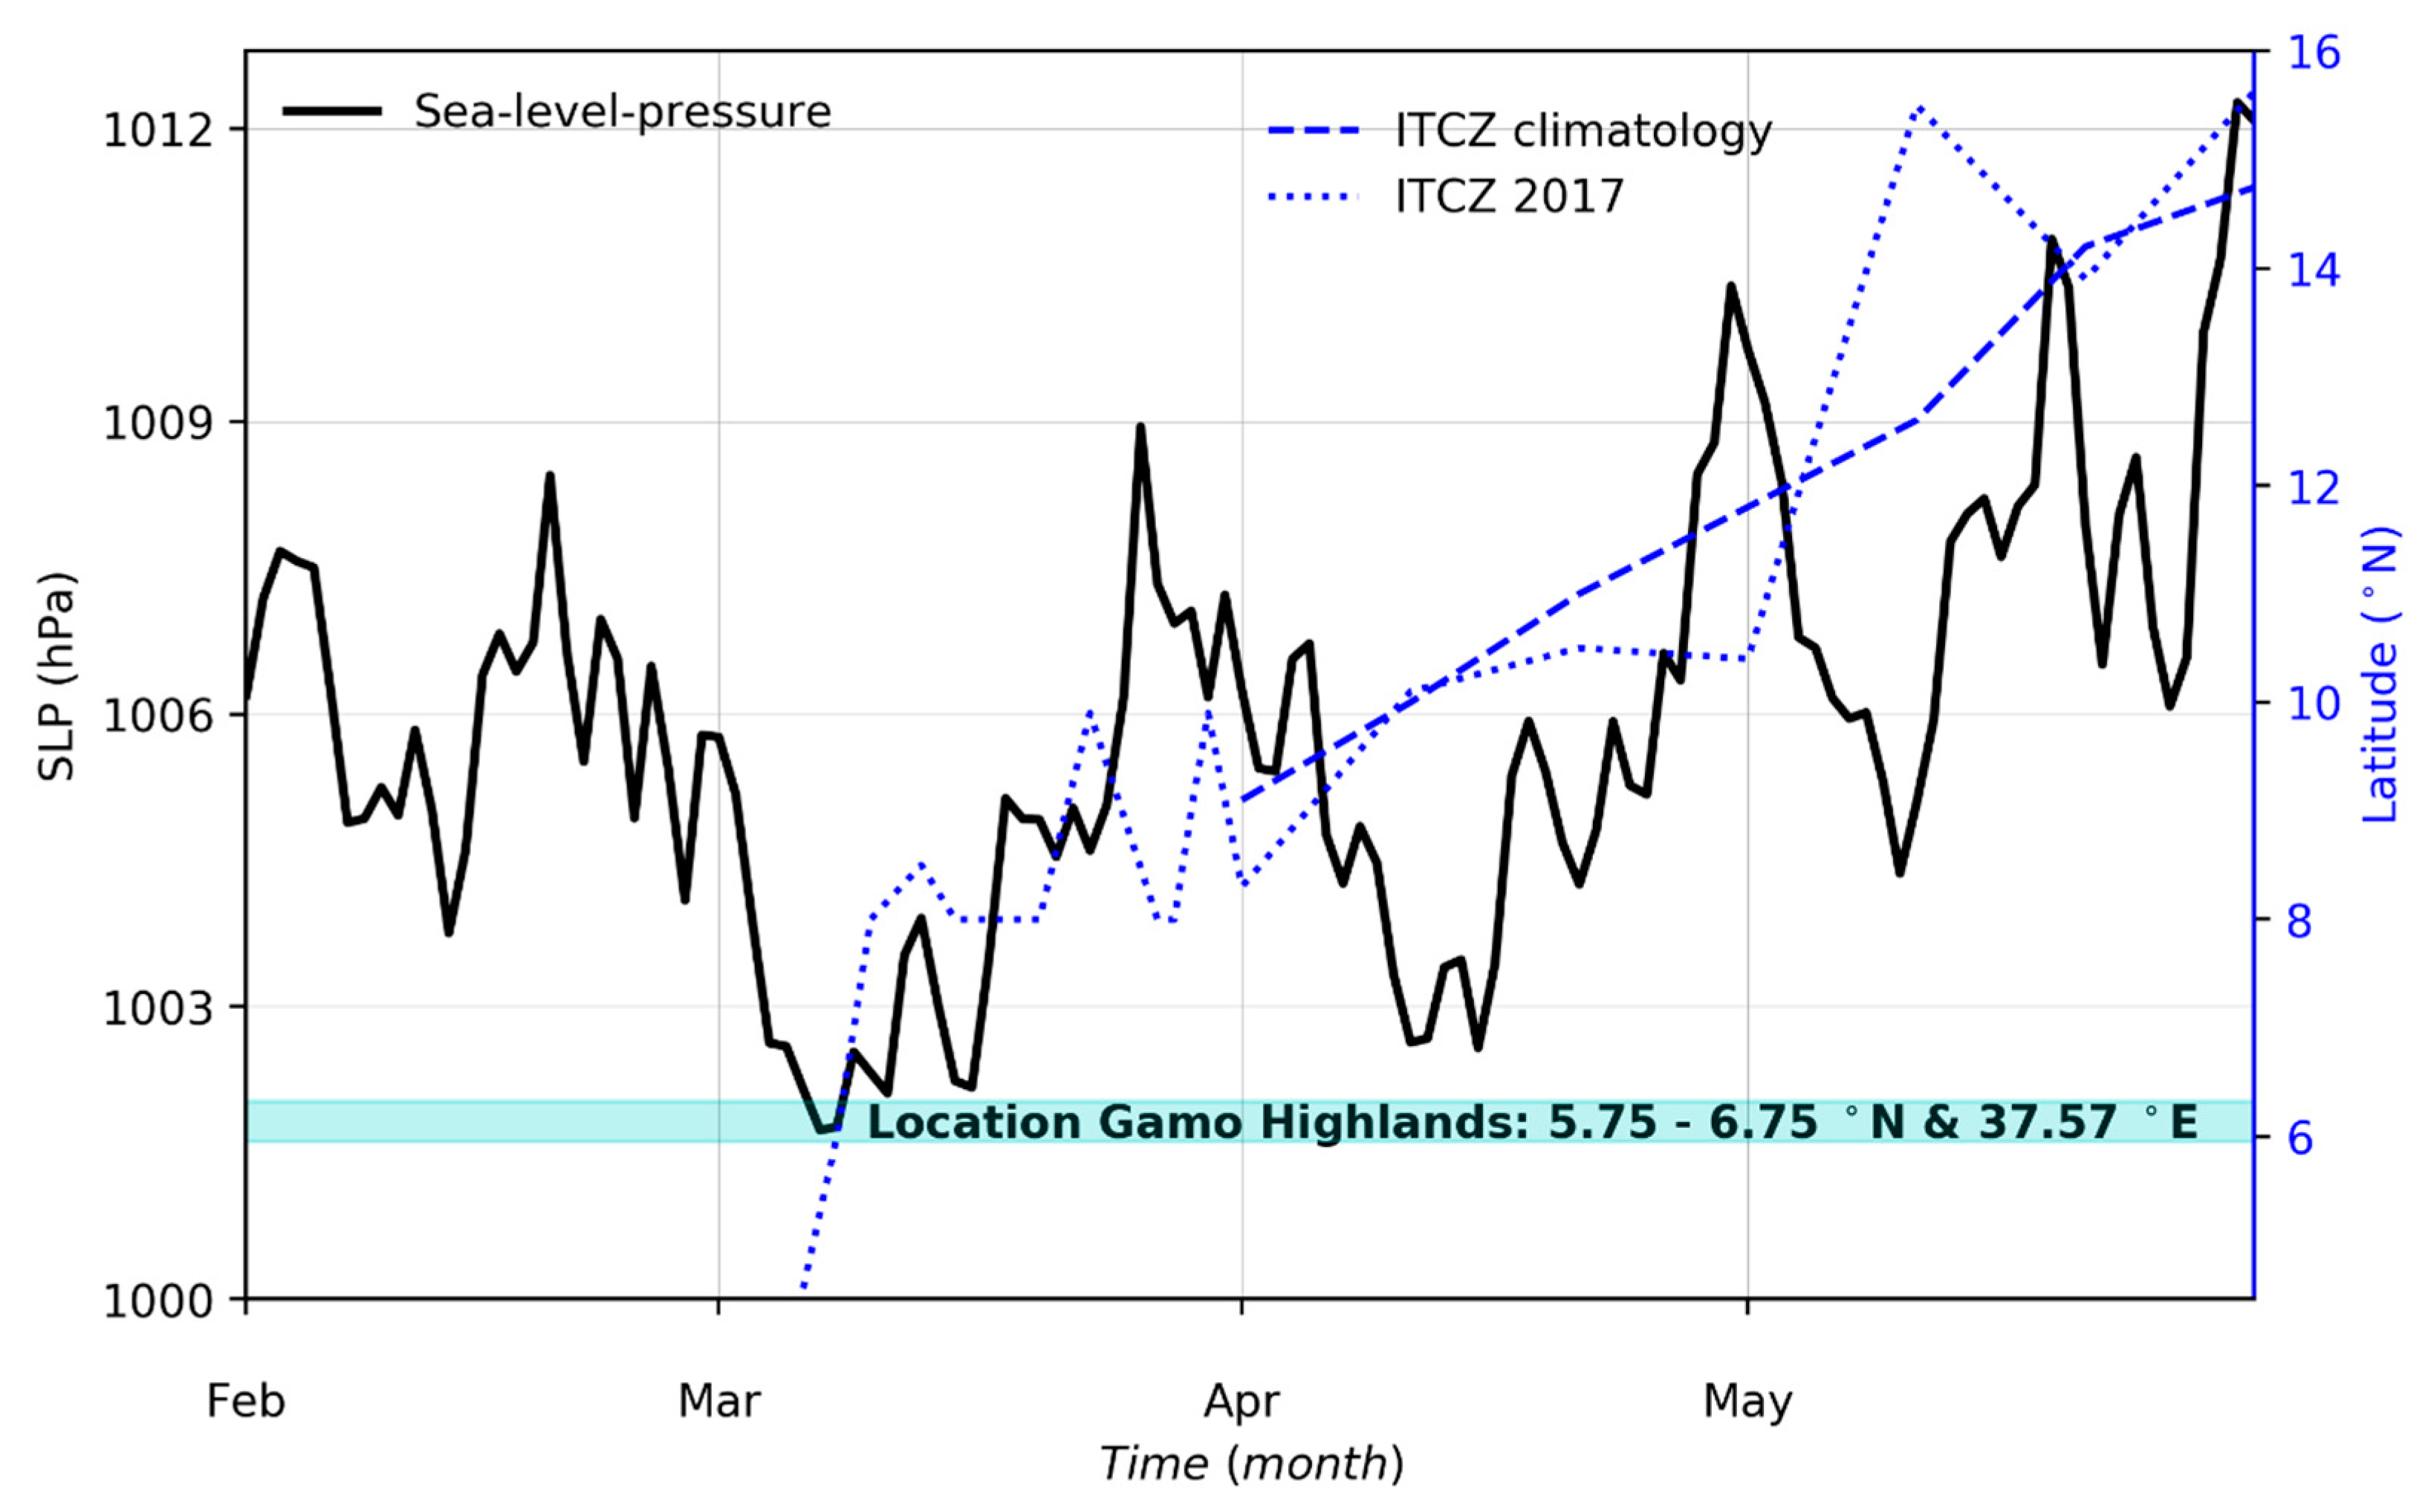
Figure 2 shows the SLP observations at Arba Minch (1200 m a.s.l.). Here, we considered low SLP as a proxy for the proximity of the ITCZ. The Ethiopian precipitation climatology is mainly determined by the seasonal variation in the latitudinal position of the ITCZ relative to area of interest [58]. The ITCZ is one of the main large scale processes that influences the belg precipitation in Ethiopia [59]. Figure 2 also shows the SLP (hPa) and the temporal latitudinal movement of the ITCZ climatological (2003–2013) and during belg 2017 data. In the figure, the 15-min resolution SLP observations were averaged and reported as daily values. For additional explanation of Figure 2, the reader is referred to the map of Ethiopia in Minda et al. [2] and seasonal latitudinal variation of the ITCZ over the African continent shown in Nicholson [23].
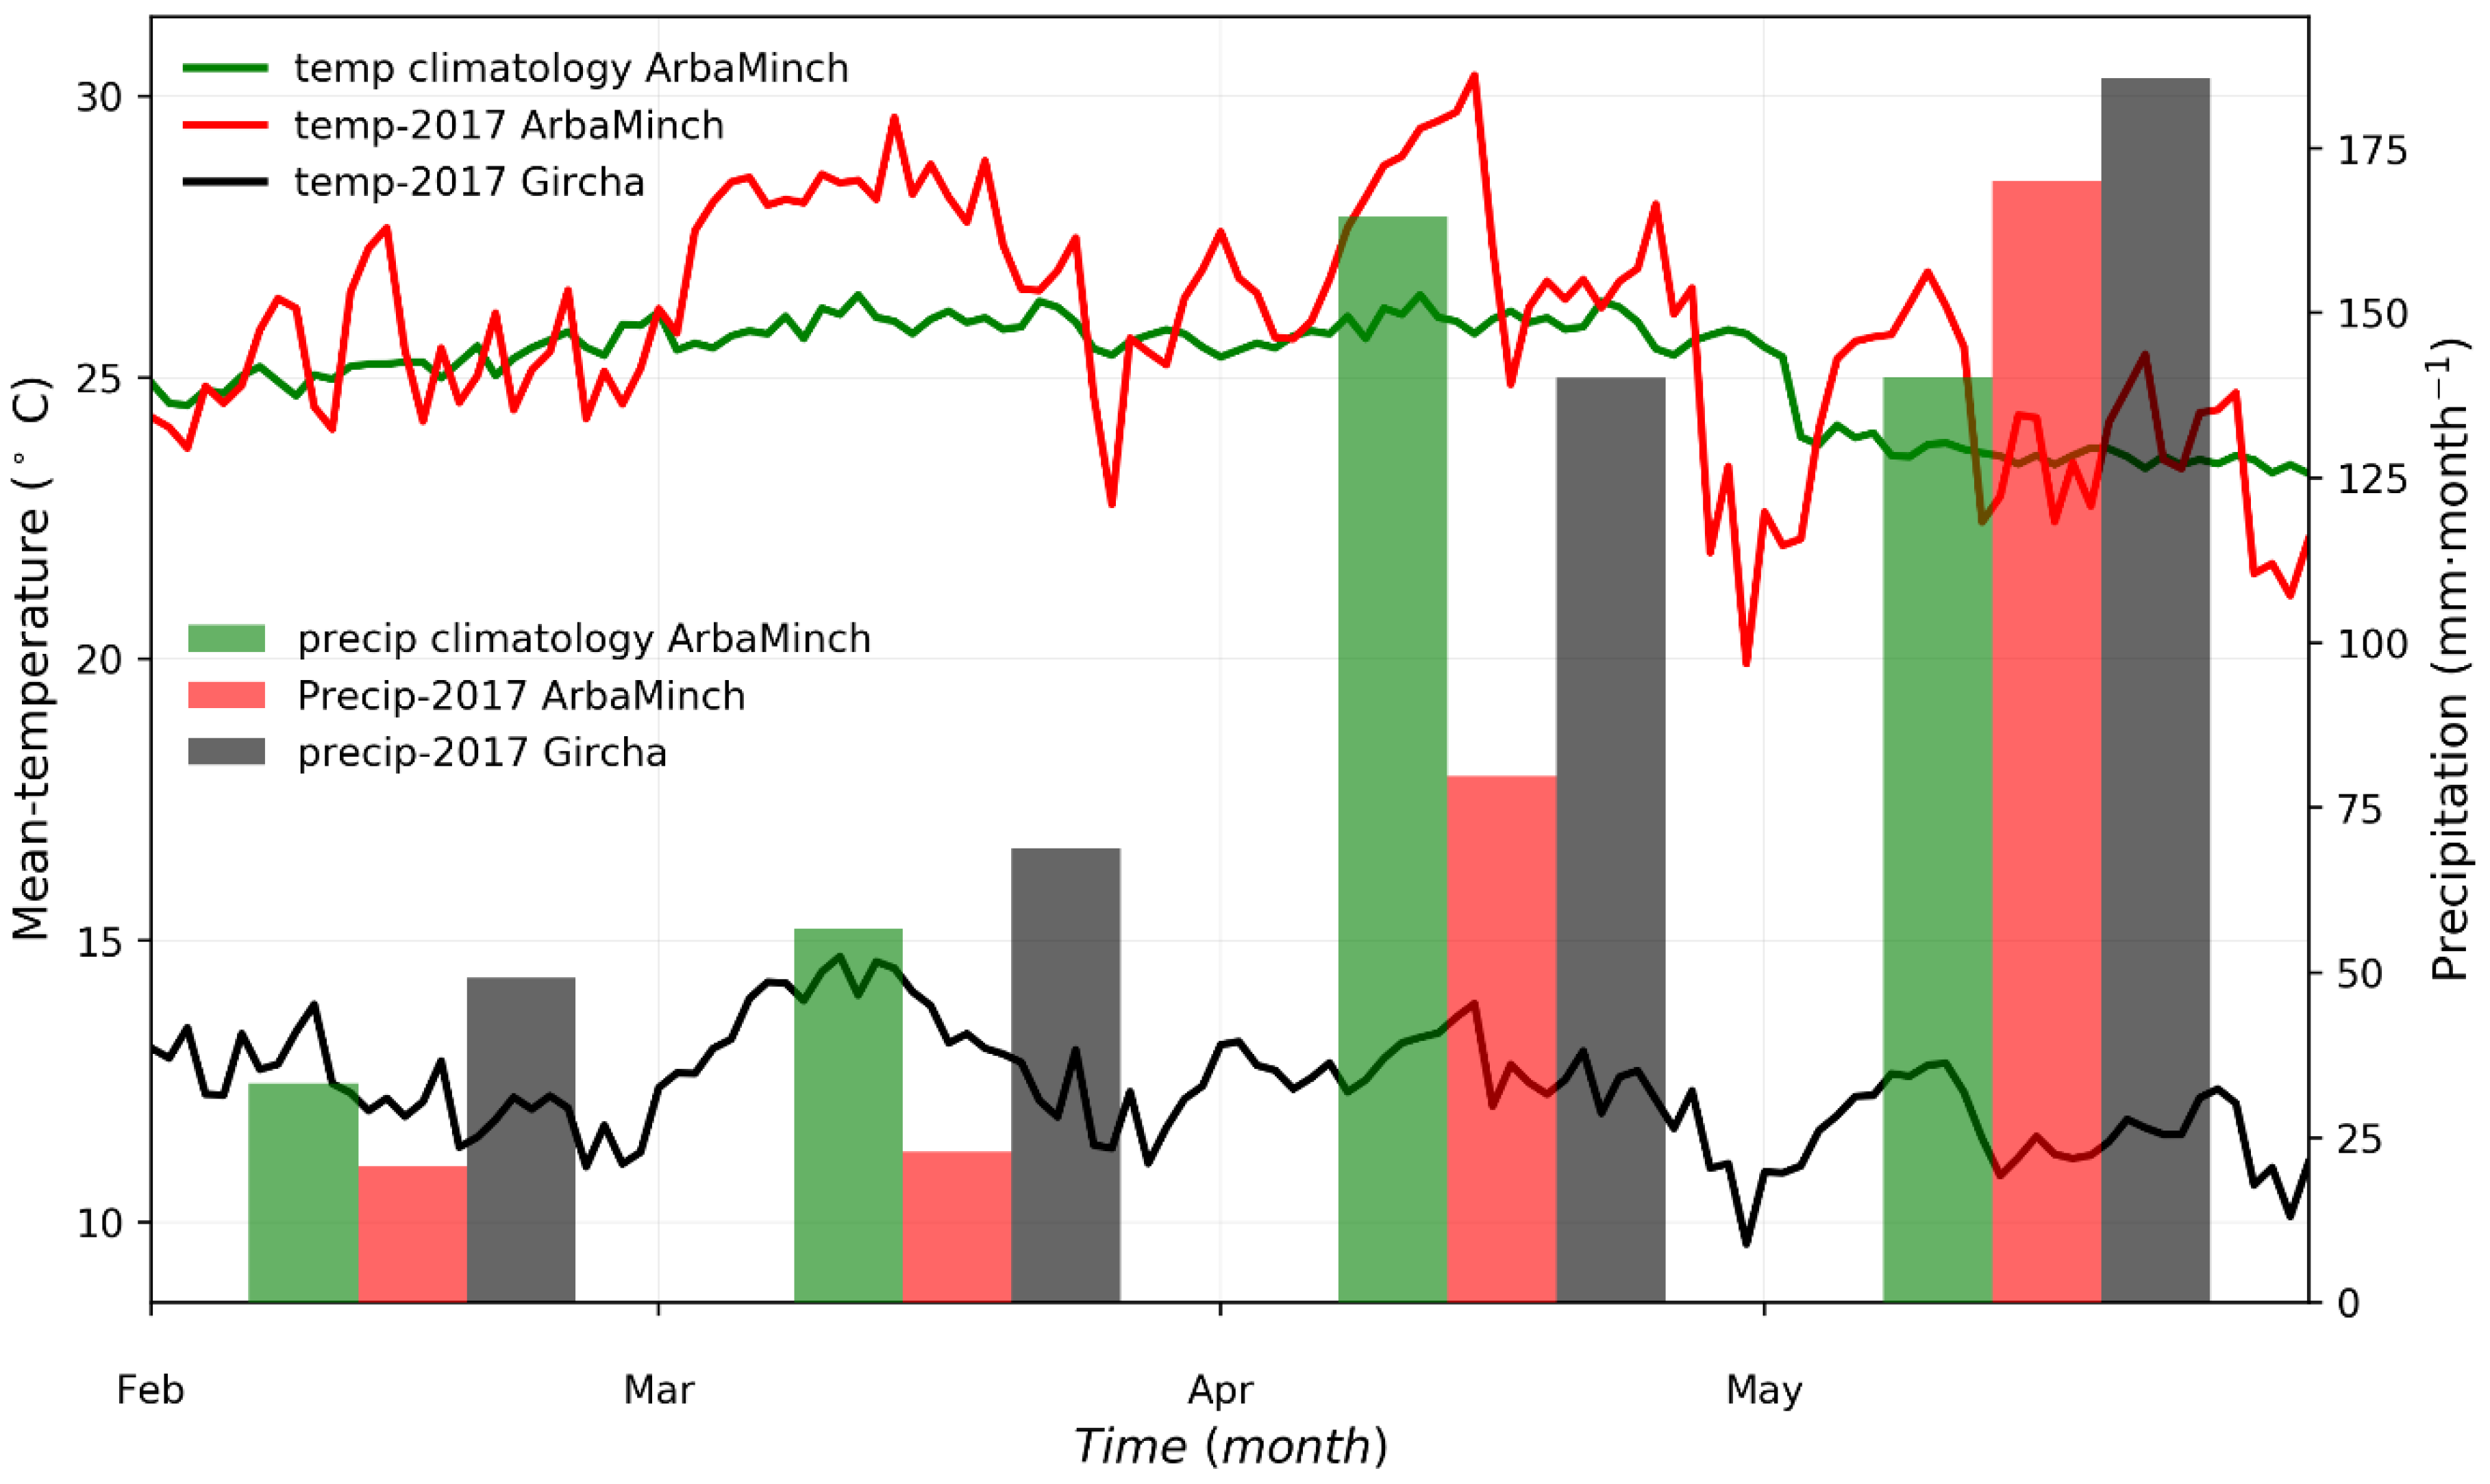
Figure 3 shows the daily variations in mean temperature and the monthly variations in precipitation during belg 2017 for the Arba Minch and Gircha stations, as the weather variables are the major atmospheric crop growth derivers. The 15-min interval observations were calculated and averaged to daily mean temperature and monthly total precipitation. The 30-year climatological (1987–2016) average temperature and precipitation daily observations during belg season for the Arba Minch station are also depicted for comparison.
Based on Figure 2 and Figure 3, in February, the ITCZ is located far south of the Gamo Highlands (i.e., ~10–15° S) and the Gamo Highlands were at higher pressure relative to the ITCZ. The SLP decreases slowly by ~3 hPa at the end of the month as the ITCZ approaches the Gamo Highlands (Figure 2). In this month, the highlands are less influenced by the ITCZ. As a result, the northeasterly winds transport dry air from the Arabian Peninsula. In March, the ITCZ passes the Gamo Highlands (5.75–6.75° N) and the observed SLP was at its minimum (1002 hPa). Still, there is hardly precipitation in this period (Figure 3). In turn, from March until the end of May, the ITCZ moved toward northern Ethiopia. In this period, the highlands experienced a higher-pressure system again (SLP increased by ~10 hPa from the minimum in March). Most precipitation fell in the Gamo Highlands after the passage of the backward tilted slope of the ITCZ front, i.e., when the front was located between 10 and 14° N. The position of the ITCZ northward of the Gamo Highlands favors southeasterly winds and moisture transport from the Indian Ocean [59,60]. The Gamo Highlands received >80% of the belg precipitation in April and May (Figure 3).
The 2017 belg season occurred during La Niña year [50], which is characterized by lower than normal and delayed precipitation in the Gamo Highlands (102 mm less and one-month delayed). Less and delayed belg precipitation (peak precipitation shift from April to May) as occurred in 2017 are typical La Niña impacts to our region [60]. In 2017, Arba Minch and Gircha received 293 and 443 mm of precipitation, respectively, during the belg season, which was ~43% of the annual total. Belg 2017 was also characterized by warmer weather (+1.0 °C) as compared to the belg climatology in Arba Minch. The average daily belg temperature was 25.8 °C for Arba Minch and 12.4 °C for Gircha, with a daily temperature variability of ±4.0 °C and ±2.3 °C at Arba Minch and Gircha, respectively, and in terms of standard deviation. Tsidu [51] also showed that southern Ethiopia during belg 2017 was warmer than the 1981–2010 mean climatology by 1–2 °C (based on the ERA-Interim reanalysis data).
February, the first month of belg 2017, was somewhat cooler (0.6 °C and 0.1 °C for Arba Minch and Gircha, respectively) than the other belg 2017 months. In this month, the ITCZ was located in the southern hemisphere and the GEMS network measured a relatively higher pressure (Figure 2). March was the warmest (+1.5 °C and +0.7 °C compared to the mean 2017 belg for Arba Minch and Gircha), and the ITCZ was directly overhead the Gamo Highlands (Figure 2). In spite of having the ITCZ overhead, cooler and wetter weather did not yet occur in the highlands in 2017. The warmer period continued until half of April, and the Gamo Highlands did not receive the expected precipitation. Ultimately, May was the coolest (−1.9 and −0.8 °C less than belg 2017 for Arba Minch and Gircha) and wettest month of the belg season.
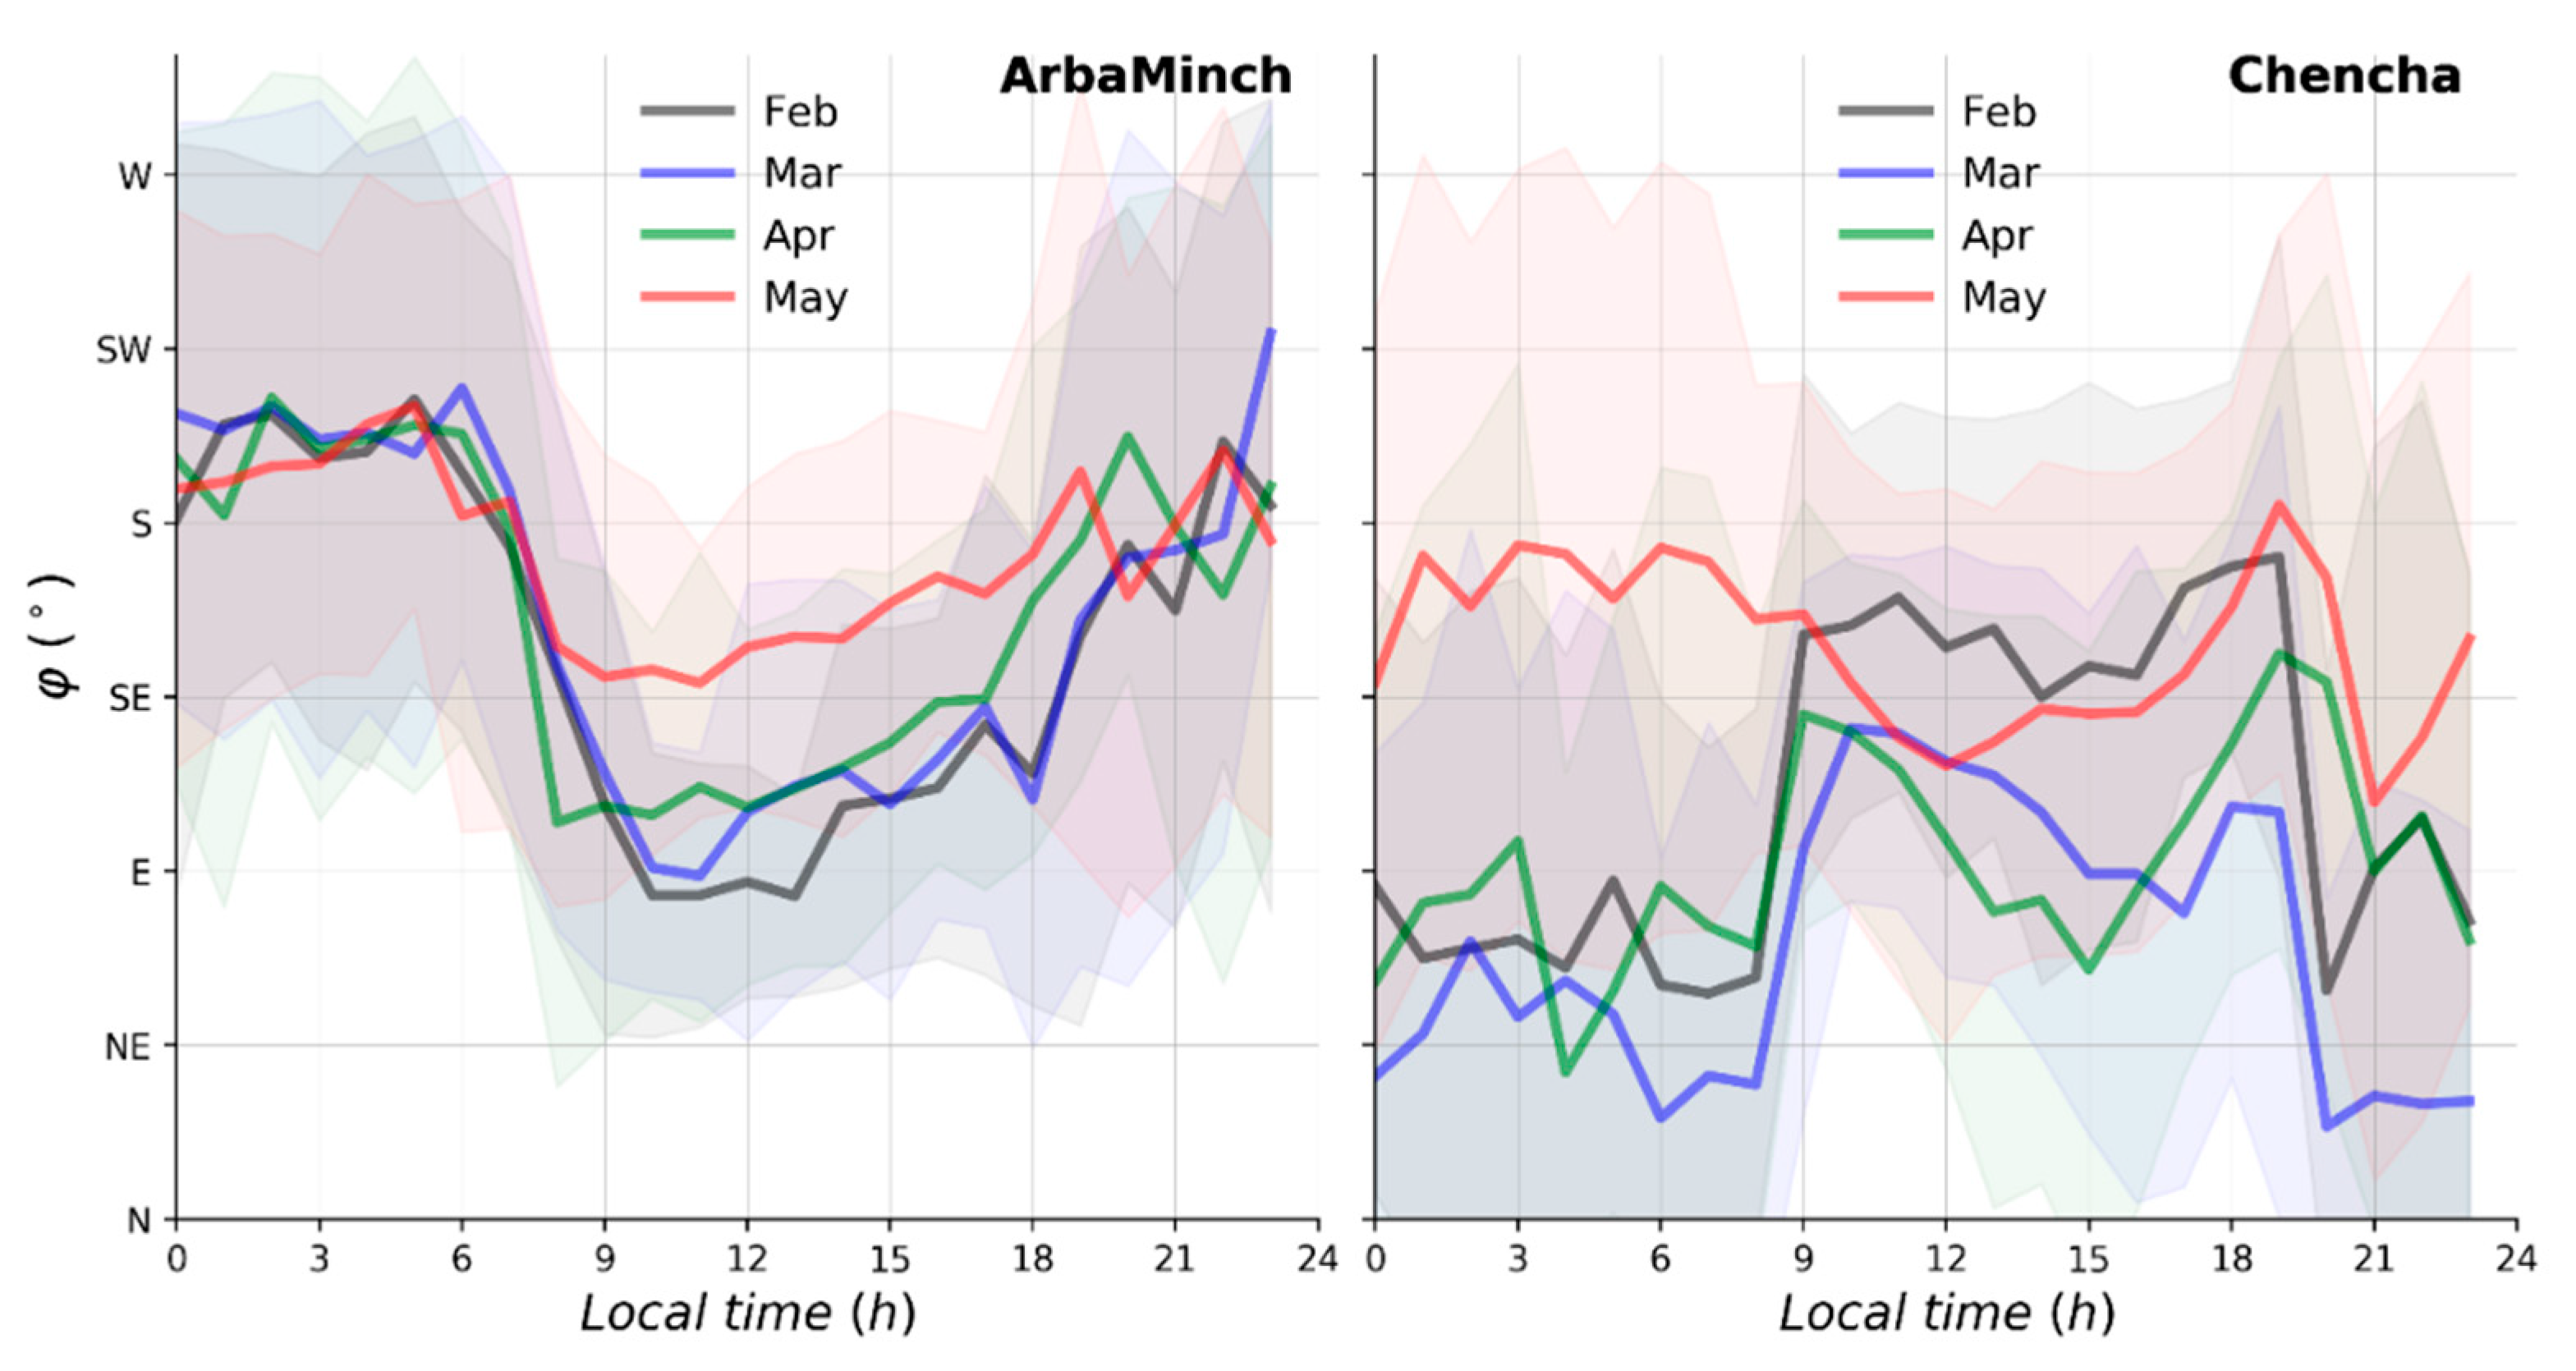
It is interesting to relate these findings to the diurnal variations in the various months in our study. To this end, we calculated the diurnal evolution of wind direction at the Arba Minch and Chencha stations (Figure 4), where Arba Minch is representative of the lowlands and Chencha of the highlands. This diurnal evolution was calculated as an average during the entire month. The standard deviation is also presented to show the variability in the observations. For February, we found that during daytime (0600–1800 local standard time (LST)), easterly flows occur in Arba Minch and southerly flows in Chencha. Note that time is reported in LST (coordinated universal time (UTC) +3). The wind direction in the months of March and April is similar to that in February. In contrast, for May, the wind direction was mainly southerly to southeasterly, indicating a pronounced role of large-scale circulations in relation to the ITCZ (see Figure 2). Figure 4 shows a daily pattern dominated by the mesoscale wind circulations, caused by the topography and the presence of the two lakes. In May, the synoptic scale was predominant than the mesoscale flows. Then, in particular, for Chencha, the southeasterly component of the large-scale wind is well aligned with the lake breezes and the anabatic winds during the day, causing strong upslope flow. These features are discussed in the following Section.

3.2. Mesoscale Dynamics: The Role of Lake Breezes and Mountain Flows in the Gamo Highlands

3.2.1. Day–Night Contrast in February and May Winds

Figure 5 provides more detail on the diurnal variability of 2-m wind direction (φ (°)) and speed (u (m·s−1)). We focus on the contrasting day and night values in φ and u as explained in Section 2.3.
In February, during daytime, all the stations had nearly a southeasterly wind, except Gazesso, which is across the first mountain range in a second valley along the EW transect (Figure 1 and Figure 5a). The u ranged from 1 to 2 m·s−1. It is interesting to note that, during daytime, the prevailing wind directions at all the stations were from between the southern part of Lake Abaya and the northern part of Lake Chamo and directed upward into the broad direction of the slope. The easterly wind direction in Gazesso matches with the direction of the main valley (Figure 1) headed from the lakes (more easterly as compared to other stations getting southeasterly flows). These directions also align with the general direction of the synoptic winds in February.
In contrast, the nighttime winds were characterized by south to southwesterly (SSW) flows along the EW transect (Zigiti and Gazesso) and by east to northeasterly (ENE) flows along the lower part of the SN transect (Tegecha and Chencha). These wind directions were not in the general (larger-scale) downslope direction. However, by looking at a detailed fine resolution topography map (see insets in Figure 1), we show that the nighttime wind followed small-scale topographic features. For example, in Chencha, the larger scale slope is toward the southeast, but very locally, the slope is toward a discharge valley in the west (W) to southwest (SW), causing ENE katabatic flows. The winds are downslope mountain flows in both transects. This is because the nighttime mountain winds form a much shallower mesoscale circulation than the daytime lake breeze and valley winds. These are typical characteristics of katabatic winds influenced by topography [61,62].
The wind direction at Gircha was quite invariable between day and night, and also the strongest. This is because the station is located near the mountain crest and is, at night, less exposed to mountain winds from higher altitudes. As a result, the wind direction is aligned with the southeasterly background wind during day and night.
The shift in wind direction between day and night at all other stations and the alignment of the wind direction with the slopes and the direction of the lakes are clear indicators of the presence of a combined lake and valley breeze flows [63]. These patterns break in May. The wind direction at all stations becomes more southerly during the day and at night than in February (analysis not shown here) with minimal diurnal variations in u and φ. The major difference is the direction of the synoptic-scale winds as a function of the position of the ITCZ. In February, it was directed from the southeast and, in May, from the south. The stronger influence of synoptic-scale winds in May disturbed the mesoscale dynamics, which were so prominent in February.

3.2.2. Diurnal Variability of θ and q in February along the Slope

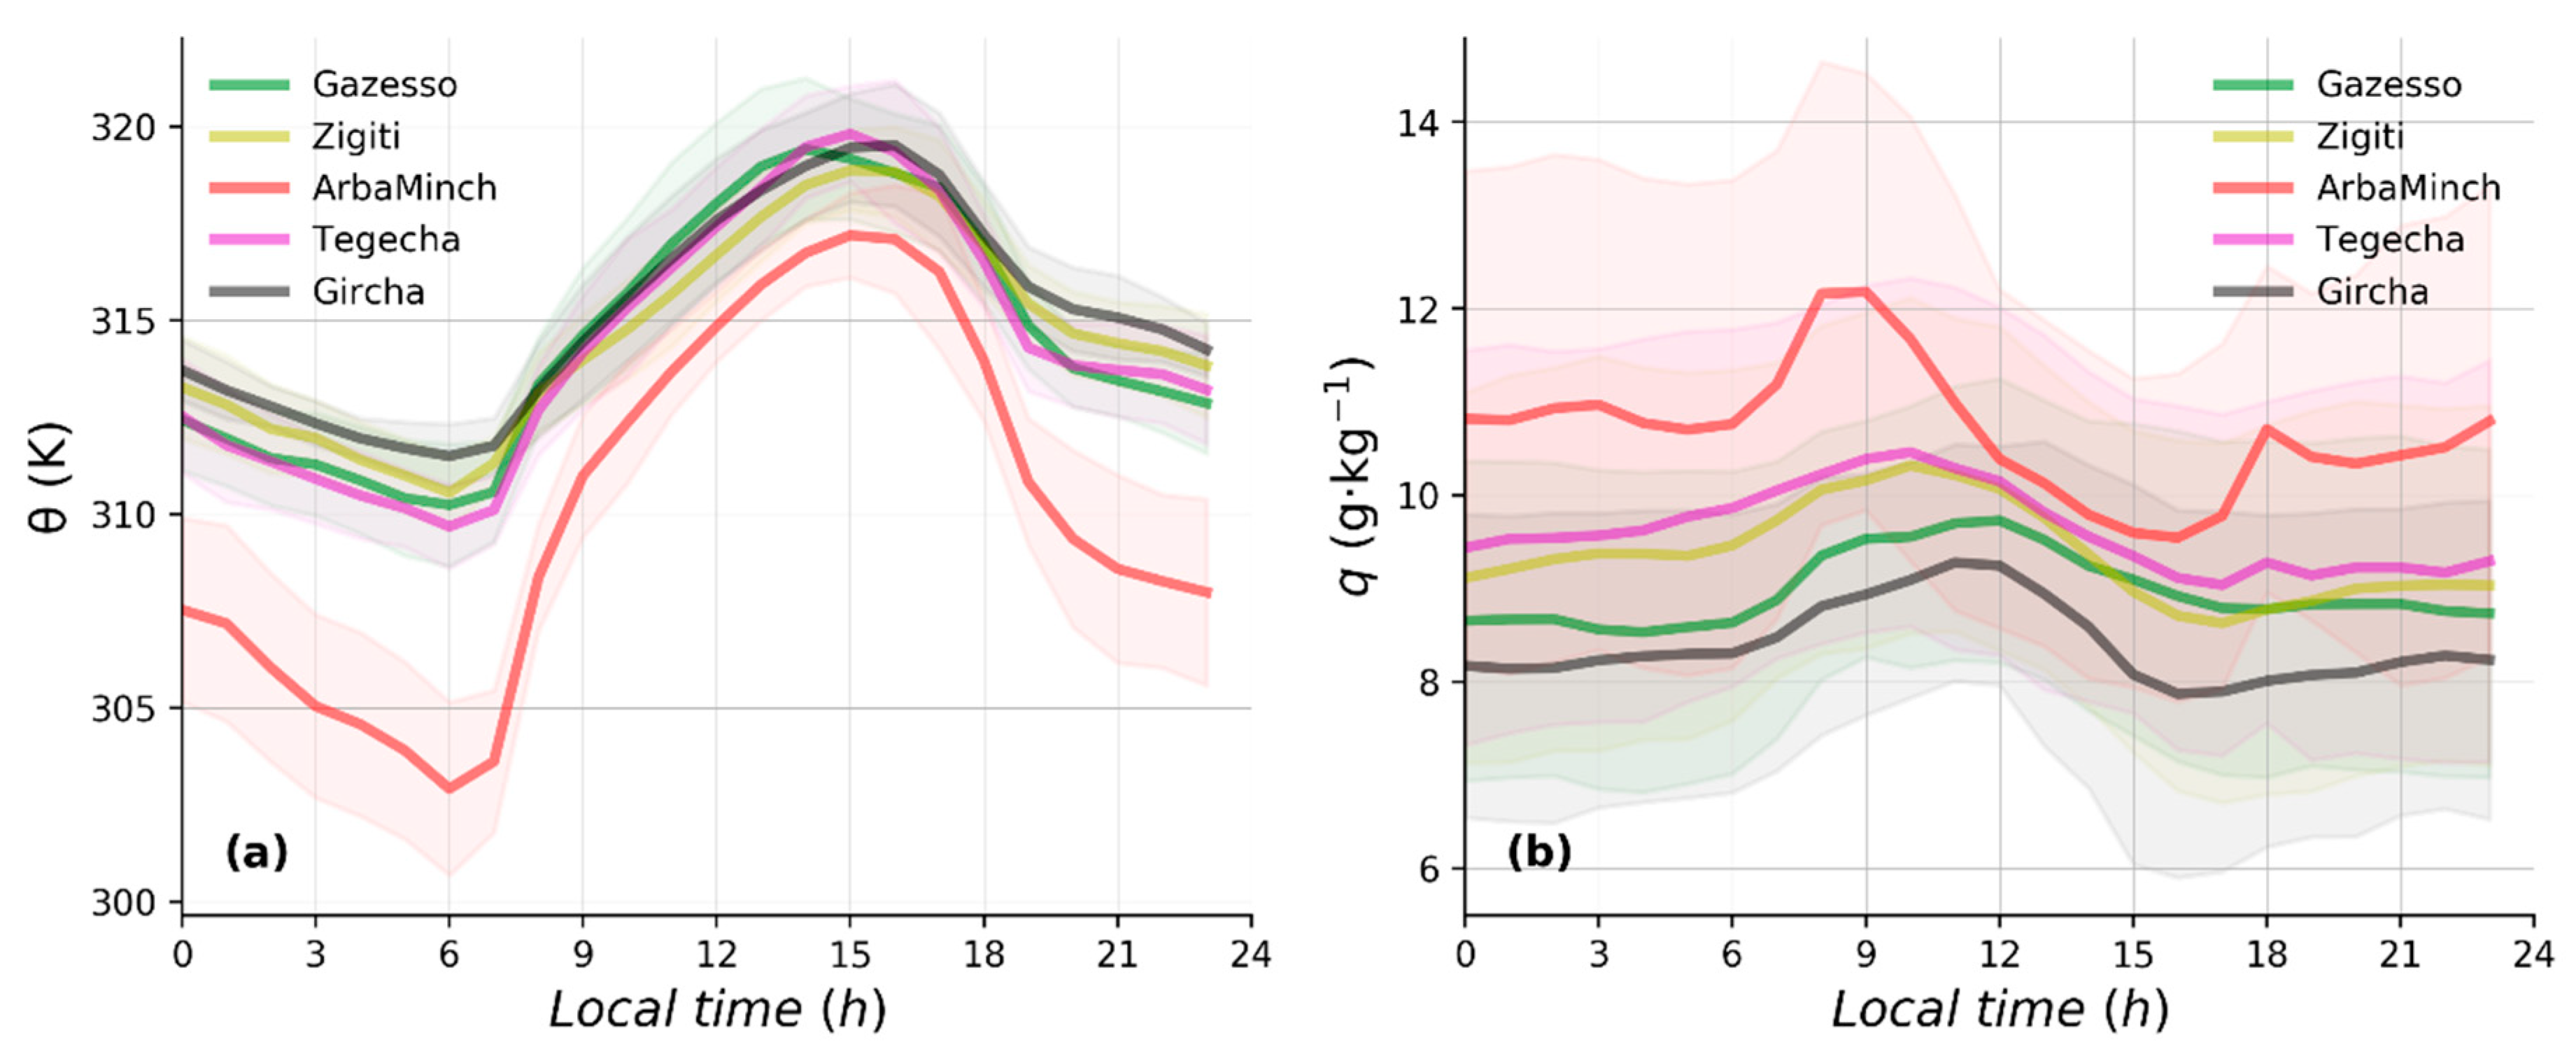
Figure 6 provides a characterization of the spatial variation of the diurnal cycle of meteorological variables θ (K) and q (g·kg−1) in February.
Figure 6a shows a distinct difference between the highland stations (Tegecha, Gircha, Zigiti, and Gazesso) on the one hand, and Arba Minch on the other hand. The highland stations had a very similar θ during night and at day, whereas the lowland station clearly had a 3–7 K lower θ. The difference between Arba Minch and the highland cluster is explained as follows: Arba Minch is the station nearest to Lake Abaya (Figure 1) and located in a relatively flat area. At night, the lowlands become cooler due to the combination of katabatic winds and the local longwave radiative cooling that creates stagnant stable boundary layer.
Figure 6b shows a similar distinction of the stations based on specific humidity (q): the highland stations and the lowland station displayed q with a more pronounced diurnal cycle than at the highland stations. However, the q was more variable among the highland stations than θ was (Figure 6a).
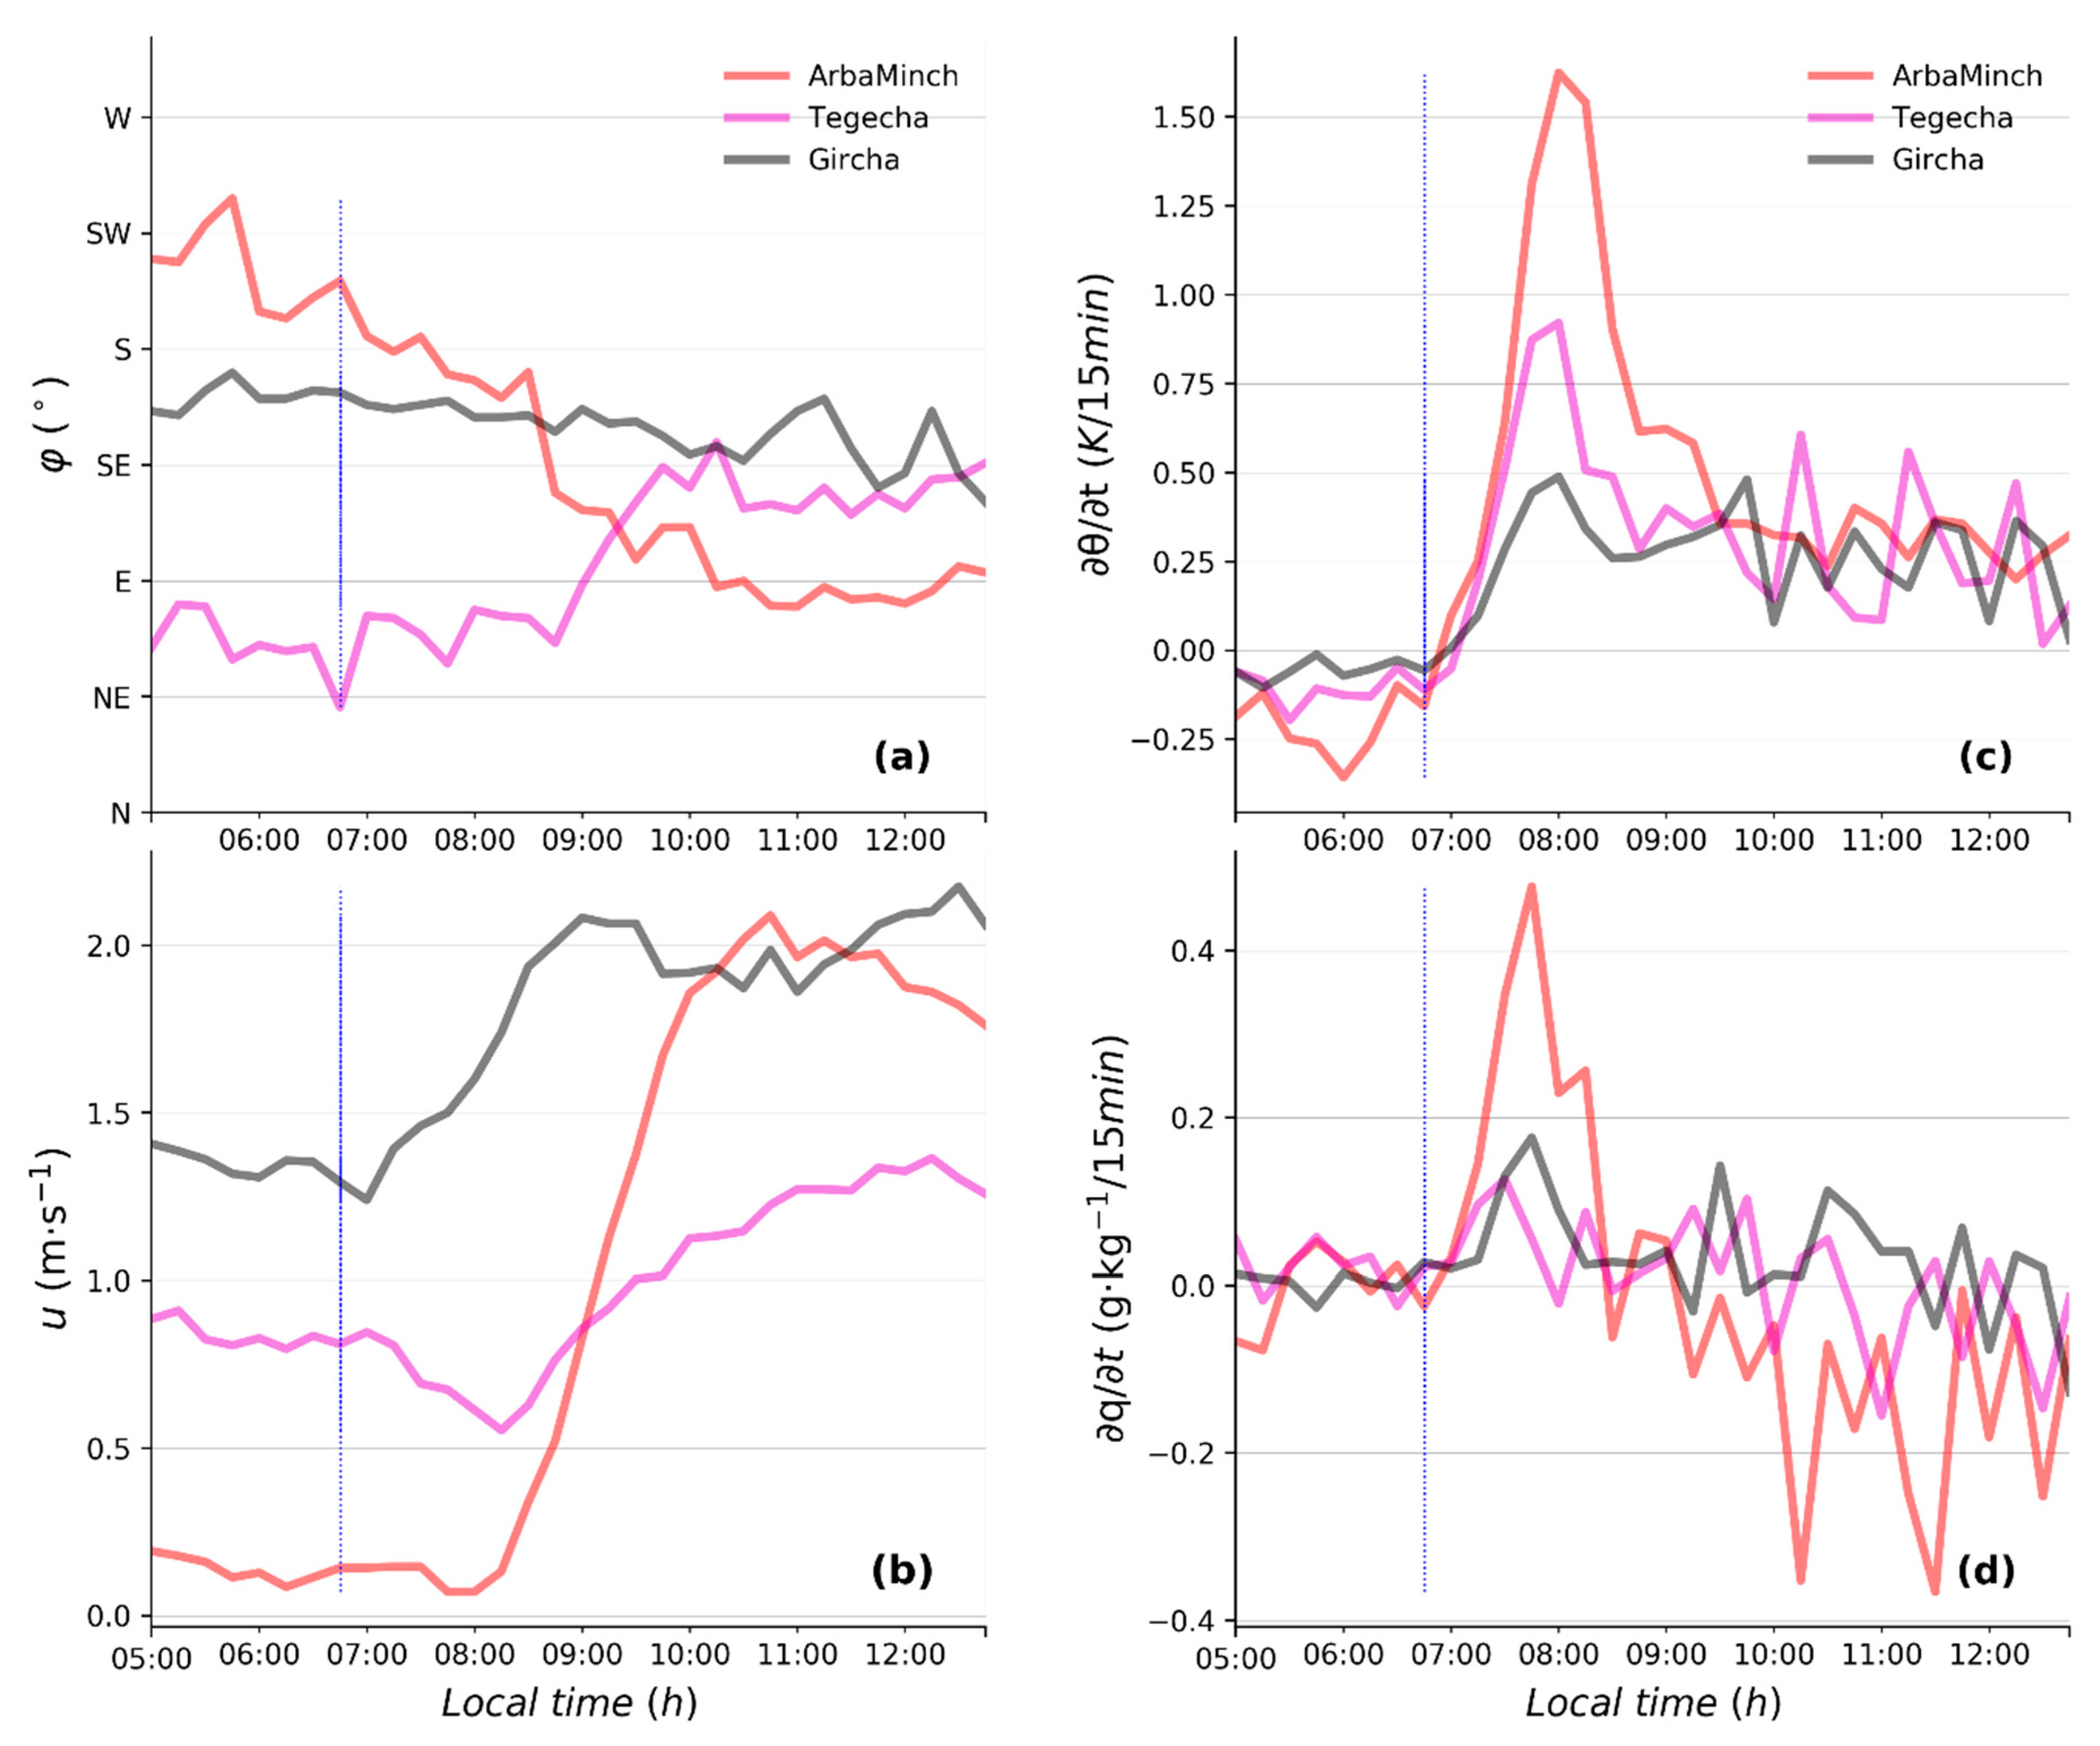
During the day, the lake breeze advected relatively cool and moist air toward the highlands. The nearly identical potential temperature and specific humidity at all highland stations was an indication that they were exposed to air from the same origin. The transition from mountain/land breeze to a valley/lake breeze was associated with the development of an internal boundary layer, because of more turbulent mixing over land than over the lake. This internal boundary layer was advected inland during the day. The most forward position was marked by the valley/lake wind front and was often detectable by strong changes in wind direction and speed, as well as temperature and humidity. In order to quantify the changes caused by the progression of this valley/lake breeze front, we show monthly, i.e., February 2017, averages of φ and u together with the tendencies (time-derivatives) of potential temperature (∂θ/∂t) and specific humidity (∂q/∂t) (Figure 7).
At the Arba Minch station, the calm mountain/land breeze at night shifted to a stronger lake breeze between 0700 h and 0900 LST, as the convective boundary layer (CBL) developed and the lake breeze gained strength (Figure 7a,b). At the highland stations, Tegecha and Gircha, the wind speed changed almost at the same time or earlier than in Arba Minch. Since the lake breeze front needs time to travel up the mountains, the wind direction and speed change cannot be caused by the lake breeze front alone and the wind shift indicates the transition from mountain winds into valley winds.
Based on Figure 7c,d, we identified four stages in the temperature and humidity tendencies: (1) a stable stratification stage before sunrise; (2) an increasing stage between sunrise and 0800 LST, when the solar radiation causes heating and evaporation of dew; (3) a decreasing stage until 0900 LST, when the stronger valley wind, the arrival of the lake breeze front, and associated atmospheric mixing cause the temperature and humidity to drop (remember that the θ at Arba Minch was lower than in the highlands (Figure 6)); and finally, (4) a nearly stable stratified stage in a well-mixed boundary layer after 0900 LST and a well-established lake breeze circulation (Figure 7c,d). The θ in the highlands was very comparable and q decreased predictably with elevation (Figure 6). The tendency in q followed a similar pattern as that of θ (Figure 7d), except that the maximum values occurred within an hour’s time after sunrise instead of 2 h with pronounced temporal variations.
Figure 7 shows the development of lake breezes during daytime. Changes in wind flows, θ, and q tendencies occurred after sunrise (0700 LST), marking the start of the lake breeze circulation. Similarly, relatively weaker the changes in these variables in the afternoon occurred approximately at 1630 LST, which shows the start of the mountain/valley flows (analysis not shown here) [64]. In the next Section, we focus on how precipitation develops under influence of the meso- and synoptic-scale weather.

3.3. Large-Scale Dynamics in Modulating Belg Precipitation

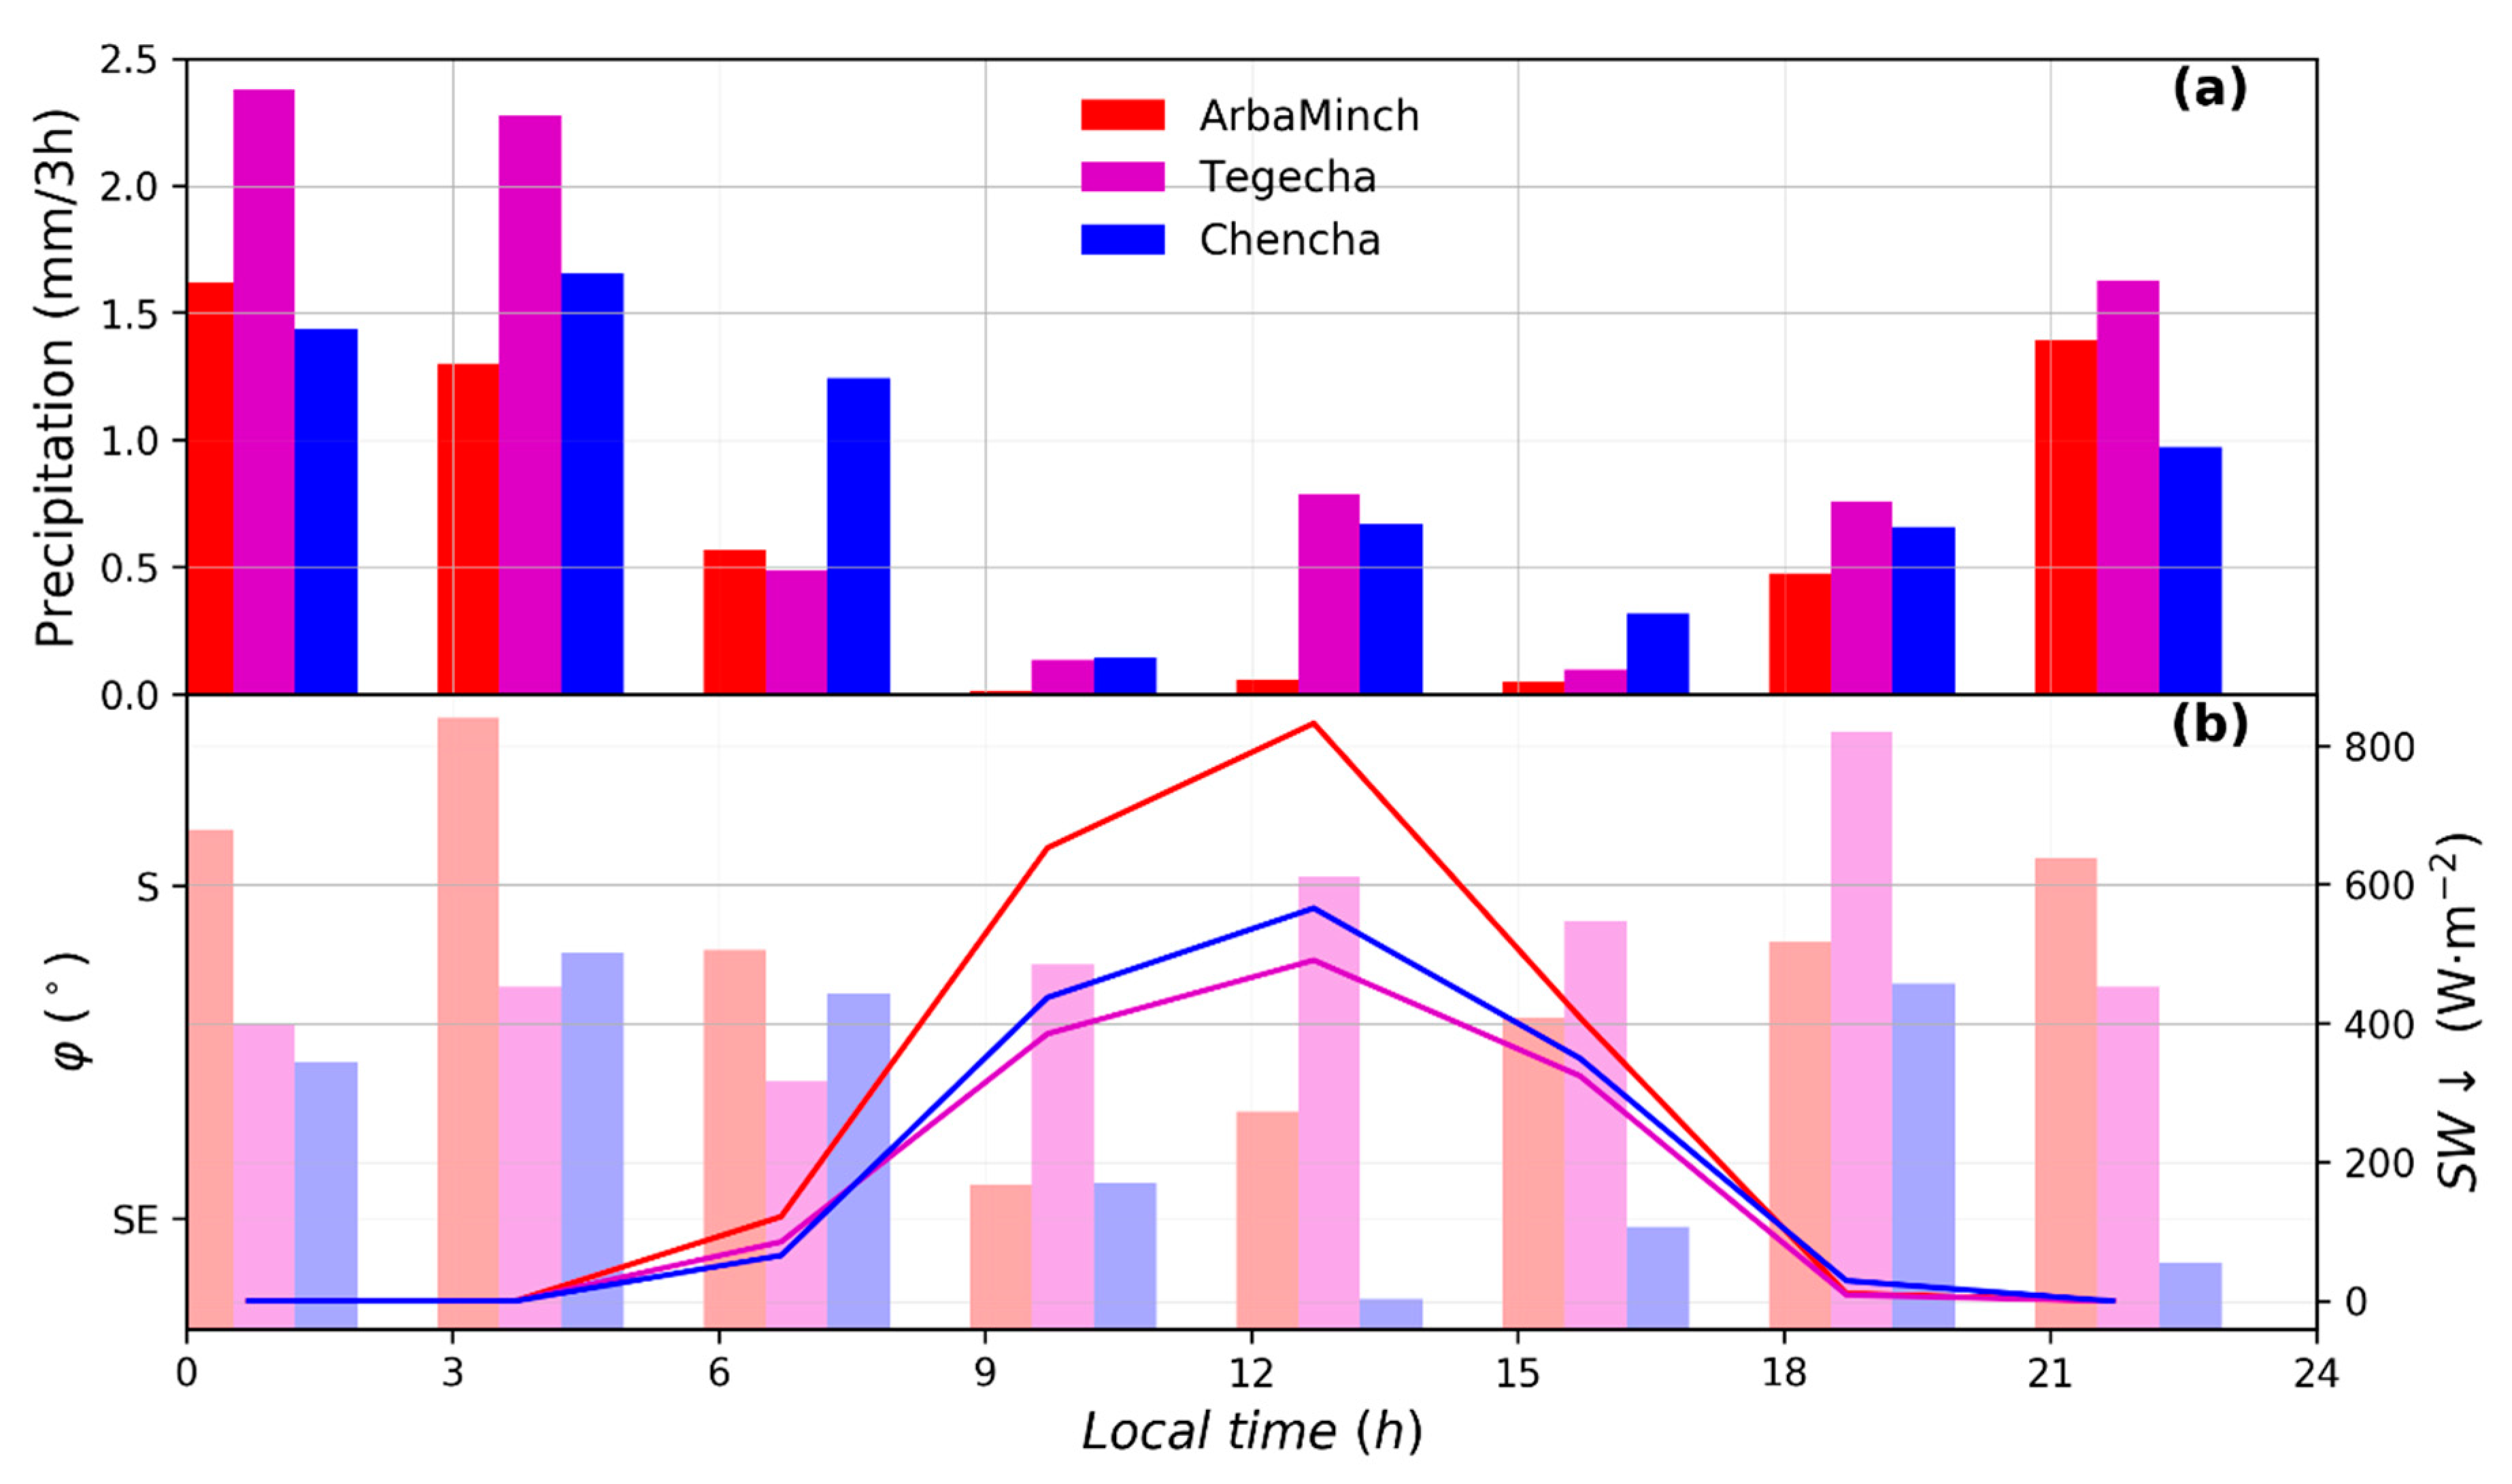
Figure 8 presents the diurnal variations of precipitation (mm/3h), φ (°), and SW↓ (W·m−2) in May for Arba Minch, Tegecha, and Chencha in the SN transect. The month of May was the wettest month of belg 2017.
During the complete belg 2017, the precipitation increased with elevation. More specifically, Arba Minch received 293 mm·belg−1, Tegecha 459 mm·belg−1, and Chencha 540 mm·belg−1 (not shown here). This trend is similar to the one we found in the WRF-modeled precipitation in Minda et al. [2]. The May precipitation accounted for 40–60% of the total belg precipitation in Arba Minch, Tegecha, and Chencha. The SN transect in Figure 8 also shows large spatial variability in precipitation. However, in the month of May alone, Tegecha received more precipitation (265 mm·month−1) than the other stations along the SN transect. Most precipitation fell in the evening and during the night (Figure 8). Houze [25] discussed that, on mountains, most nighttime precipitation happens near the base of the mountain, where the katabatic wind converges with low-level moist unstable air.
The wind regimes in May (Figure 8) were entirely different from those in February (Figure 5). Focusing on the SN transect (Figure 8), in May, moist, southeasterly to southerly synoptic air masses from the Indian Ocean dominate the day and night weather dynamics [2,65,66]. Furthermore, our GEMS network showed that there was nearly no significant diurnal variability in wind source and the southeasterly prevailing wind (~150–180°) (Figure 8), which was driven by the synoptic scale dynamics. Therefore, we explain the enhancement of late evening to nocturnal precipitation by two factors. Firstly, during the daytime, the combined effect of anabatic, valley-mountain winds, and the synoptic forcing transport moist air to higher levels, and secondly, this triggers and enhances cloud formation and intensity (shown by the decrease in SW↓ in Figure 8 between 1500 and 1800 LST compared to between 0600 and 0900 LST) and the subsequent precipitation during the night.

3.4. Crop Modeling Using GEMS Network Meteorological Data

3.4.1. Simulated and Modeled Crop Growth Gradient along the SN Transect

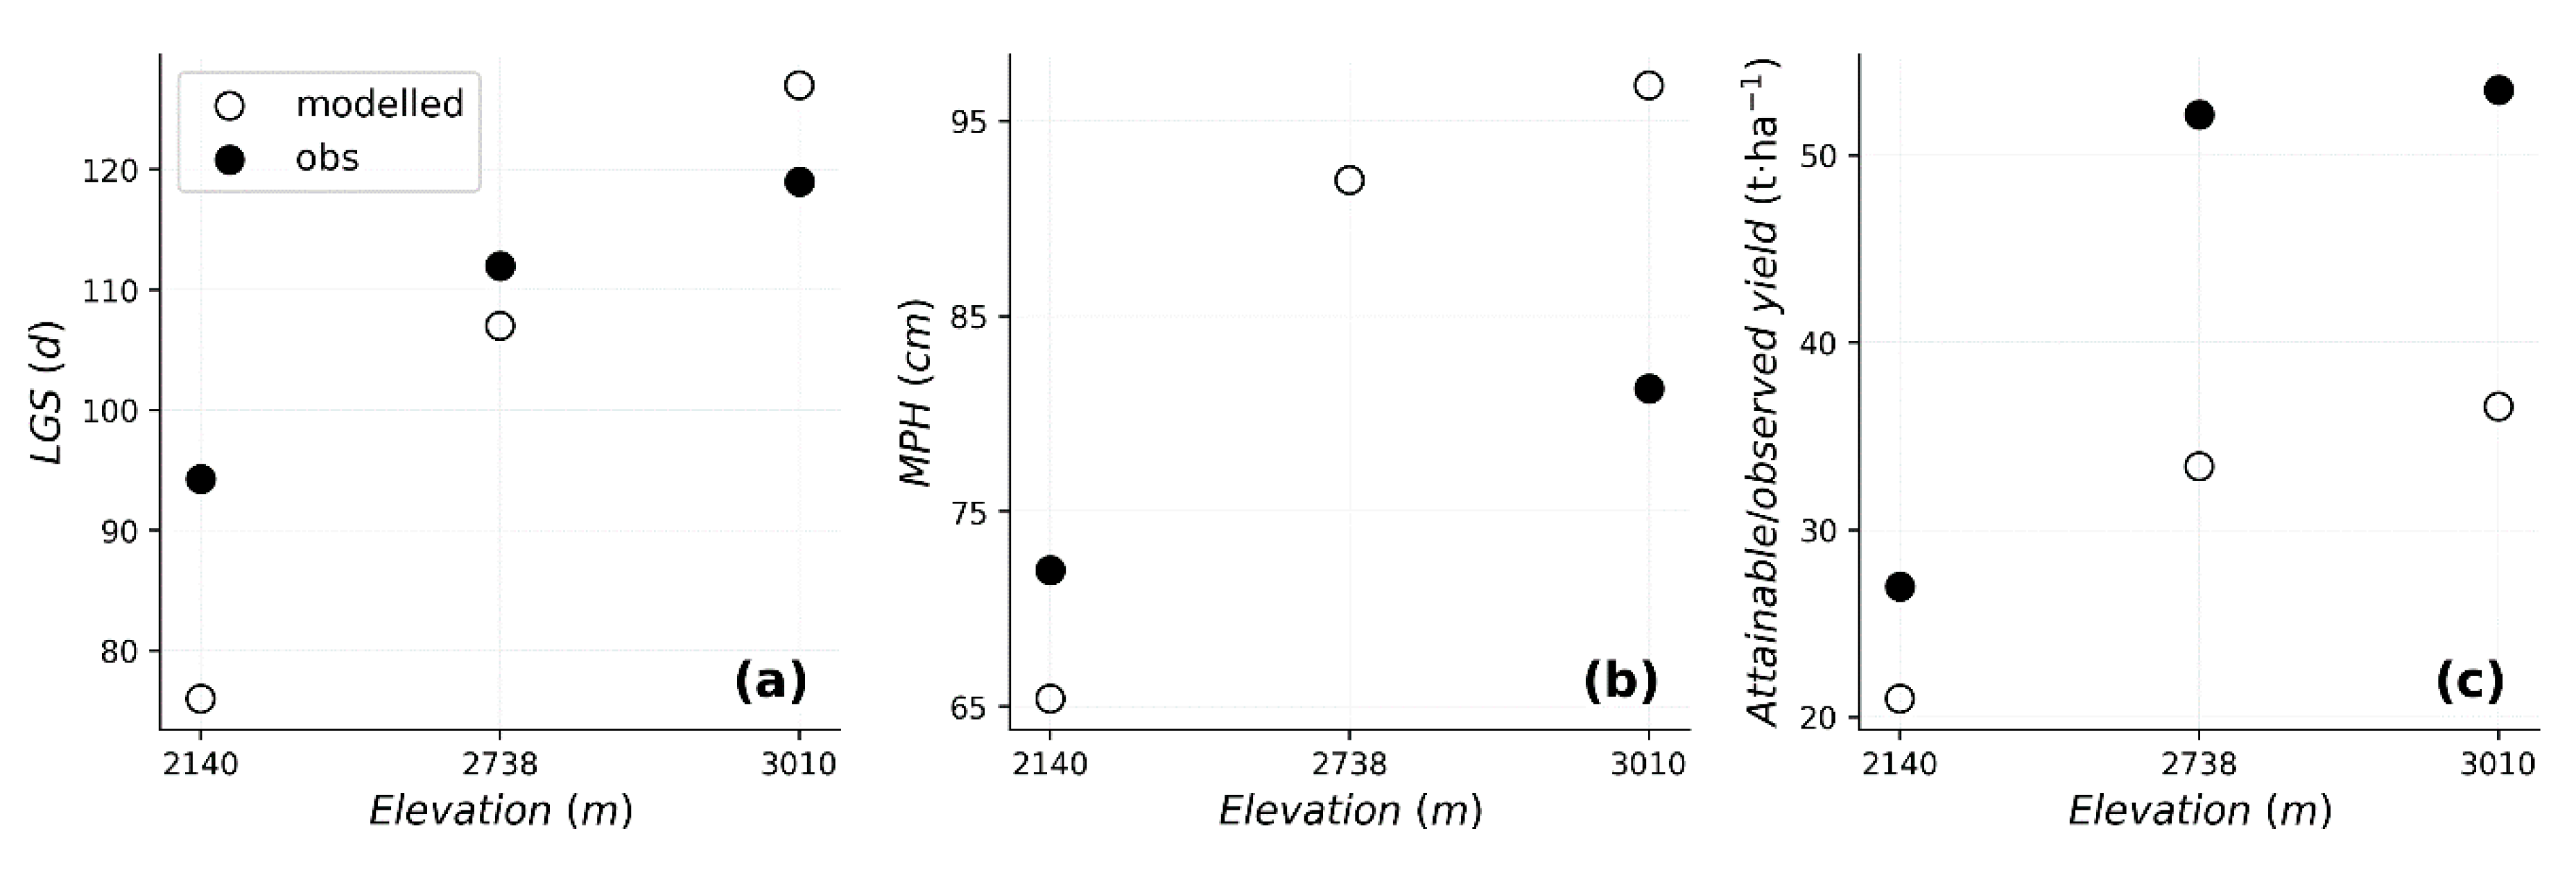
Figure 9 shows a selection of the modeled potato growth variables with observed yield at experimental potato farms (Figure 1) located at Tegecha (2140 m), Chencha (2738 m), and Gircha (3010 m). The attainable yield and the growth variables were the LGS (i.e., days to crop maturity) and maximum plant height (MPH, i.e., plant height at maturity).
The figure shows that the observed LGS increased from 95 d in Tegecha to 120 d in Gircha. The model underestimated the observed LGS by 19% in Tegecha, represented Chencha fairly well, and overestimated it by 7% in Gircha (Figure 9a). The MPH increased from 72 cm to 81 cm as we went up from Tegecha to Gircha, in which the model mainly overestimated the observed MPH. The observed yield increased from 27 t·ha−1 in Tegecha to 52 t·ha−1 in Chencha and almost stabilized as elevation increased further. For Chencha and Gircha, the model largely underestimated the yield observations. In practice, Tegecha is a few meters above the lowest level where potato is grown; at the lower elevations, the climate is too warm and dry to support potato crop growth. Similarly, Gircha (3200 m) was around the maximum elevation where potato was grown; at higher elevations the climate was too cool and wet (Figure 3), with subsequent risk of diseases at extended LGS. Between these extremes, however, the conditions for growing potato were optimal [2]. Figure 9c shows the attainable yield, which was the maximum yield attained considering soil type, climate, and cultivar, but without considering yield loss due to sub-optimal crop management and diseases, as the observed yield was. In the present case, however, the situation was quite the opposite. At higher altitudes, the attainable yield was some 35 t·ha−1, while the observed yield was 50–55 t·ha−1. One of the reasons for the mismatch between modeled and observed yield is that yield observations in small plots (9.0 m2 of which half was considered for yield estimation) are easily overestimated as compared with large plots. Sukhatme [67] showed that yield observations based on such small harvested areas could provide overestimations (as compared with estimates based on 50 m2 plots) by more than 25%.

3.4.2. Model Sensitivity Experiments

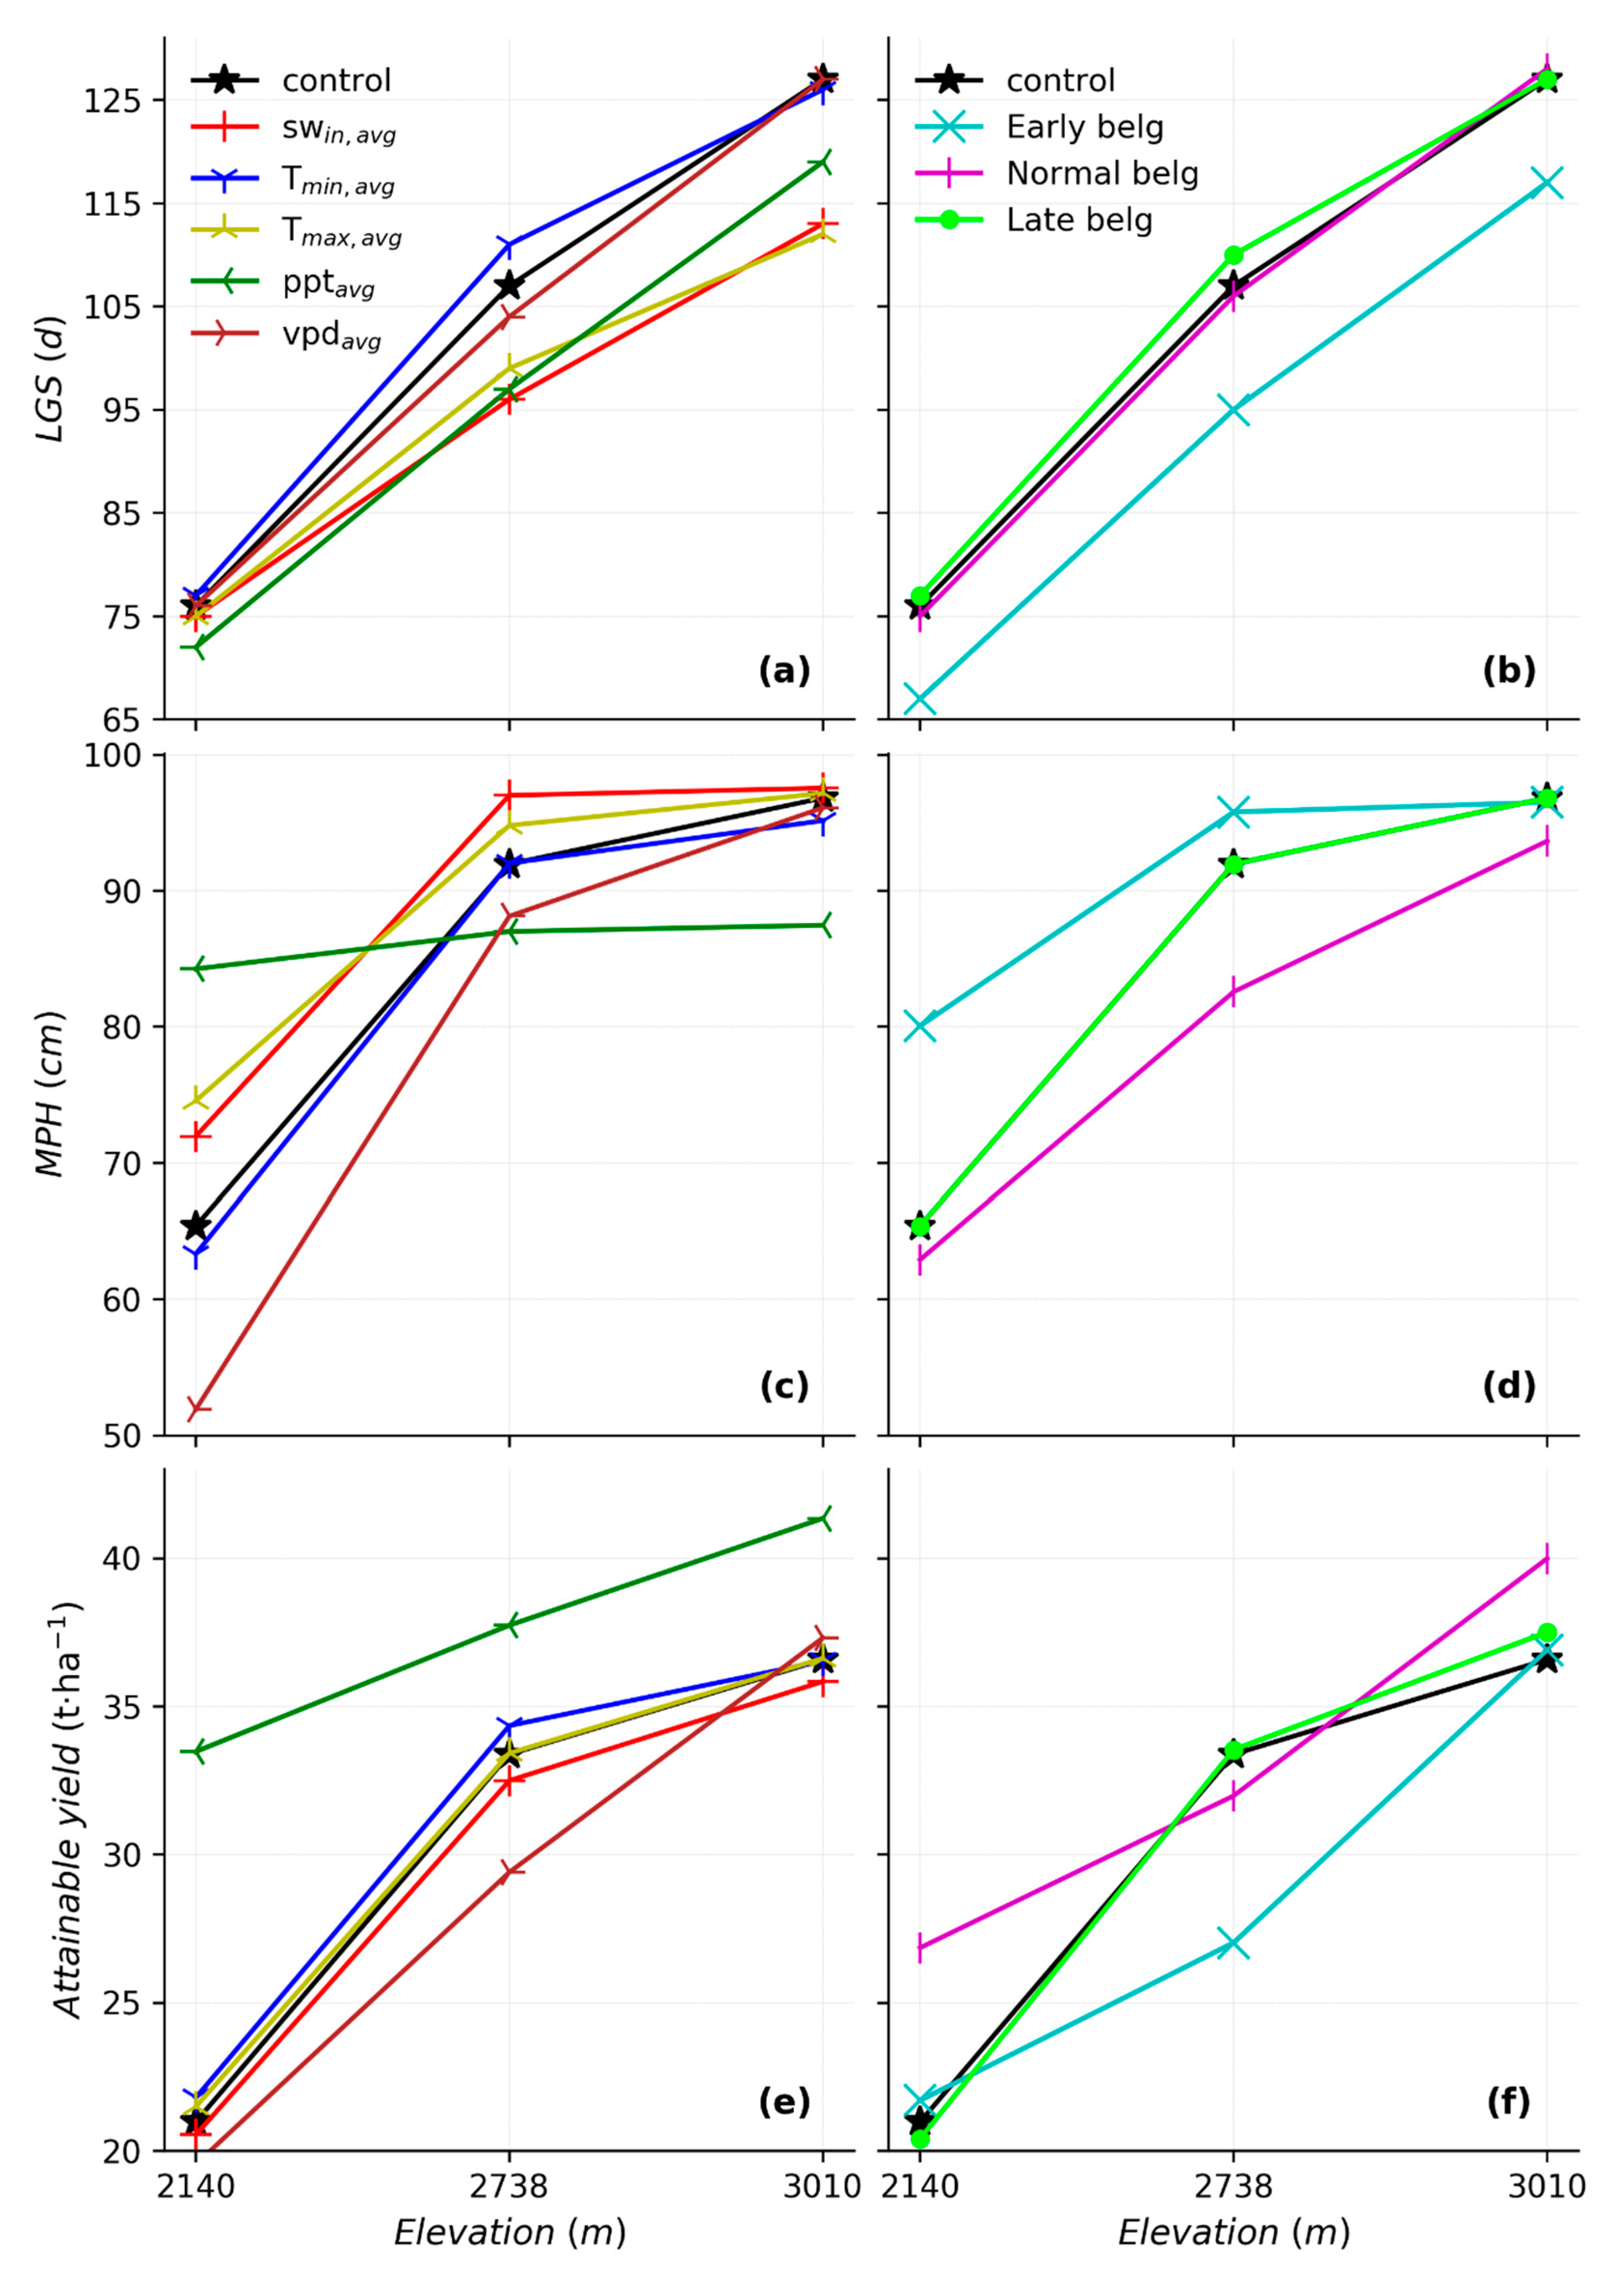
Figure 10 presents the results of the sensitivity experiment as designed in Table 3. It shows the modeled LGS (day; a and b), MPH (cm; c and d), and yield (t·ha−1; e and f) along the SN transect as compared to the control experiment. The left column shows the results of experiments 0–5, the right column experiments 0 and 6–8.
The variation in LGS between the experiments was larger for the elevated stations (Chencha and Gircha) compared to the lower one (Figure 10a). The variables causing the largest change in the crop growth dynamics were PPT followed by Tmin, SW↓, and Tmax (Figure 10b,c). This agrees with the result found in Minda et al. [2]. Of all the experiments, the one with the average distribution of precipitation (“PPTavg”) during the belg season resulted in the highest yield, followed by the “Normal belg” experiment, with the peak precipitation shifting from May to April. In these experiments, the moisture supply was improved during the crop’s critical development stages (i.e., vegetative growth, tuber initiation, and tuber bulking stages of the crop growth) and this explains the increased yield. This indicates that the supply of moisture due to precipitation plays a key role at the developmental stages.
Focusing on the “PPTavg” experiment, the LGS was slightly shorter (0–9 d) than in the control experiment. The MPH was much larger (~+20 cm) for the lower station (Tegecha) but lower for both the highland stations (Chencha and Gircha), showing that an average distribution of precipitation in time results in a larger and more uniform crop growth across the highlands. The modeled yield increased by 60% in Tegecha and by 13% in Chencha and Gircha.
We found that the “Early belg” (experiment 6) shortened the LGS by about 10 d. The reason is that the crop starts to grow earlier as sufficient moisture was available for the crop planted only around 7 March 2017 (Figure 10b), as the farmers were waiting for precipitation. The crop grows faster and taller than the control experiment (Figure 10d) as the weather was warmer and moister. The MPH was also larger, but it did not result in a larger yield in Tegecha and Gircha. Similarly, the “SW↓, avg” and “Tmax avg” experiments increased MPH with a slight decrease in yield. Contrastingly, in the “Normal belg” experiment, the LGS and MPH were close to the control run, but the yield was larger, particularly at Tegecha and Gircha.
Our suite of sensitivities indicates that the temporal distribution of precipitation is important for crop development and yield. Too much precipitation too early in the season was not effective, because the seed tubers could not take much moisture from the soil. Precipitation in April was the most effective; the precipitation was there when the crop needed it most, while the soil would not become dry in the later months. However, an average distribution of precipitation is most favorable for the crops in the tropical highland climate, because sufficient but not too much moisture will be available at all times. This was related to a balanced soil moisture content (because of regular precipitation supply) throughout the crop growth period as discussed below. It is interesting to see that the crop’s MPH and yield were more sensitive to the temporal distribution of precipitation at the lower parts of the slope (Tegecha) than higher up in the mountains (Chencha and Gircha). This was because the high-elevated stations received some amount of precipitation in each month, whereas the lower stations had a more seasonal distribution of precipitation (Figure 3).
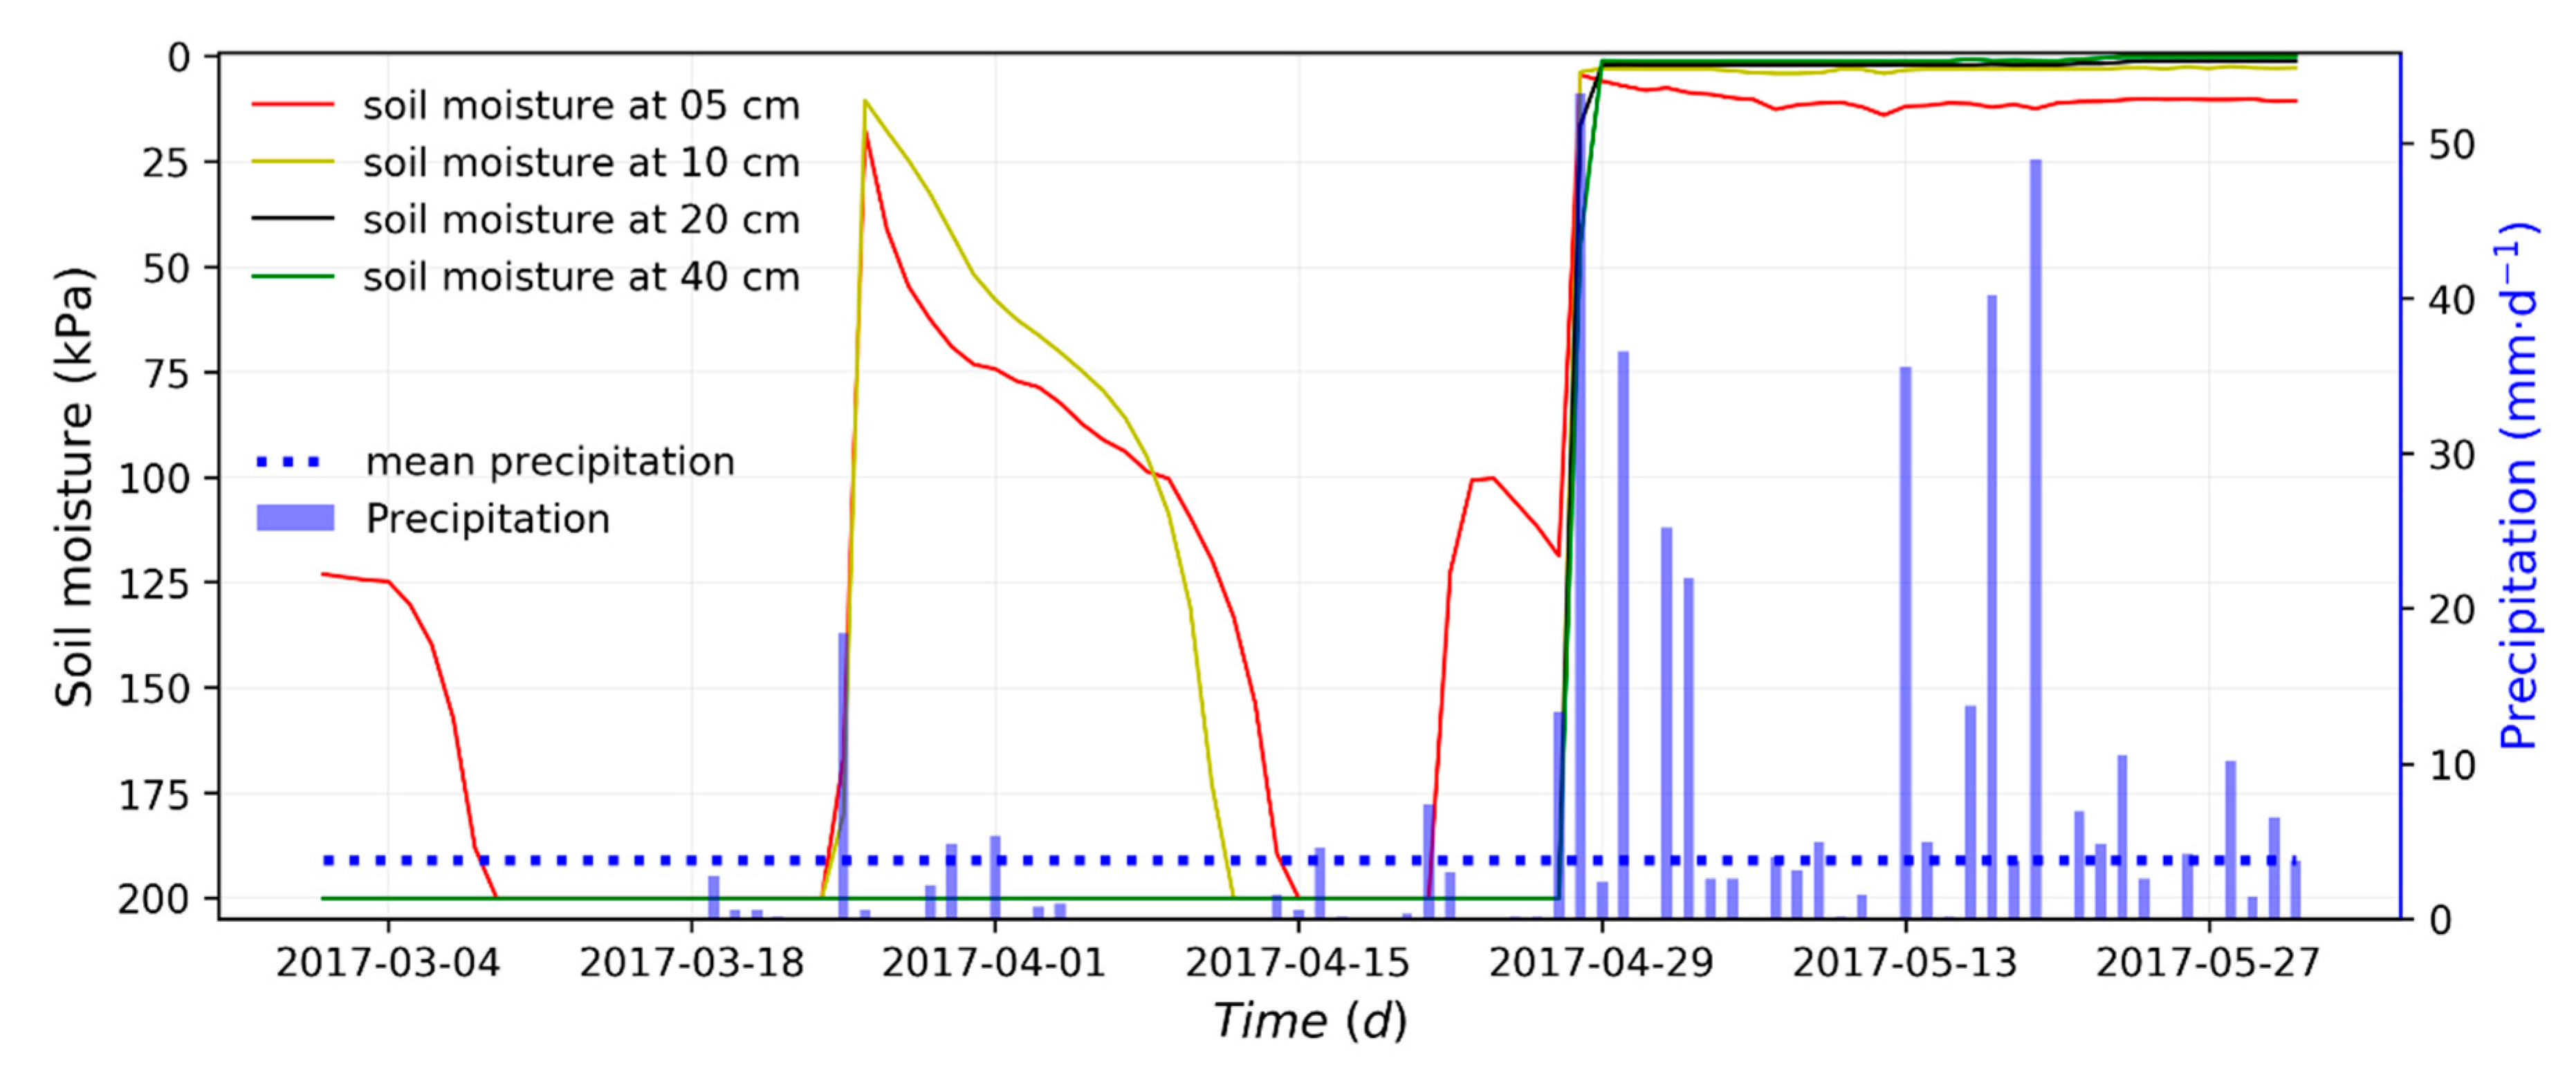
To further show the relevance of the soil moisture dynamics, Figure 11 presents the observed soil moisture tension (kPa), precipitation (mm·d−1), and average precipitation (mm·d−1) in Tegecha. The top-10-cm soil moisture tension declined from 10 kPa at the beginning of April to 200 kPa (dry soil) in mid-April. The soil saturated again after it gained more than 60 mm of precipitation. The soil moisture tension at 20 cm and below remained dry until sufficient moisture penetrated into the clay soil.

4. Discussion

The GEMS network enabled us to characterize the mesoscale patterns and their impact on crop growth variables. In February, preceding the potato planting, mesoscale circulations govern the diurnal weather variability within the GEMS’ network domain, as the ITCZ, the main large-scale weather phenomenon, is still located in the southern hemisphere [23]. WRF model output analysis [2] showed that the low-pressure system (a minimum value in SLP) was located below the Equator in January and the system marches toward northern Ethiopia in June. In February, the synoptic flow to the Gamo Highlands is northeasterly. This is a dry and warm airflow from the Arabian Peninsula [2,65]. The daytime mesoscale flows, in turn, were predominantly easterly to southeasterly lake and valley breezes toward and up the east facing slopes. These flows start at 0700 LST, attain climax at noontime, and start to decay after 1500 LST (Figure 4). During nighttime, however, weaker and more localized katabatic winds (mountain breezes) are observed (Figure 5) [64]. These flows start around 1630 LST. The lake/mountain breeze circulations change directions at 0800 and 1800 LST [64].
February and May show greater differences in how the synoptic and mesoscale flows interact. In May, during day time, the moist southeasterly to southerly synoptic flows [23] coincide with the lake/valley winds. Together, they form upslope winds (Figure 8) [2,65]. Our explanation is that the high correlation between mesoscale and synoptic scales inhibits the convergence, and, as a result, it weakens the orographic lifting that results in less precipitation during daytime (Figure 8). This pattern is reversed during nighttime. The southerly synoptic flow dominates the weak mountain flows during nighttime. Hence, the nocturnal precipitation is enhanced by the moisture transport dominated by synoptic winds to the higher levels, local circulations, and a subsequent cooling (shown by a decreased SW↓ after 1500 LST in Figure 8). The combined effects occurring in the evening transition trigger cloud formation and the subsequent precipitation during the night.
We hypothesize that the precipitation regime on the other side of the mountain rim may be different, because that is where the valley and synoptic winds converge [2]. This could lead to quite different growing conditions for potato. It might be convenient to strengthen the GEMS network by establishing three or more stations across the mountain ridges to obtain a better understanding of the spatial distribution of weather and crop dynamics in the Gamo Highlands.
Our findings corroborate previous results that much of the weather in East Africa is caused by the convergence between local circulation features, such as land/lake breezes and mountain/valley winds with the synoptic scale flows [17,68]. Rainfall gauges and satellite precipitation products near Lake Tana (NE Ethiopia) showed a precipitation maximum in the evening to early morning [21,69], which agrees with our findings presented in Figure 8. These authors also underlined that precipitation maxima are observed later in the afternoon for stations more distant from the lake, where distance to the lake is an important factor in explaining the spatial variations of the nocturnal precipitation.
Figure 9 shows that the LGS, MPH, and yield increase along the SN transect. This finding agrees the results found in Minda et al. [2]. GECROS results showed a good agreement for the crop growth variables, LGS and MPH. These modeled variables are in the physiologically acceptable range for potato crop [5,70]. The model also captured the trend in yield along the SN transect (r2 = 0.98). However, we found a large discrepancy between the modeled and the observed yield (mean bias error of −13.9 t·ha−1). Using the GEMS sub-daily observations and interpolated soil data, we attempted to minimalize the uncertainties in the modeled yield related to these meteorological and soil data. In consequence, we attribute the bias to (1) the crop model parameters, which are not adjusted to the to the local potato varieties in the Gamo Highlands; and (2) probable overestimation of the observed data because of small-size field trial farm. For the first case, we suggest, for future studies, recalibration of the crop parameters to the Ethiopian potato varieties and the existing farm management practices. This recalibration requires a complete observational set, which is currently not available. Although the absolute differences are large, the present model set-up is reasonable to study the sensitivity of crop growth to elevation and modifications in the GEMS network dataset. For the second case, Sukhatme [67] suggested that a minimum of 50 m2 of plot area is needed to be free from yield overestimation bias.
The weather/crop numerical experiments showed that soil moisture availability to the crop is the most important factor for crop growth. Availability of precipitation, as in the “PPTavg” model experiment, improved the yield by 60% in Tegecha and 13% in Chencha and Gircha (Figure 10). The timing of the precipitation relative to the growth stage is also important. For example, the potato planting date was on 7 March 2017 in Gircha and the seed emerged at the end of the month. In the control experiment, precipitation did not occur until May 2017, which is late when compared to the climatology. In the “Normal belg” sensitivity experiment, the peak precipitation in May shifted to April, and hence, increased moisture was available to the crop in the critical crop development stages from emergency to tuber bulking [5], which enhances the crop yield.
The larger yield in the “PPTavg” experiment is explained by a non-linear response of crop growth to soil moisture content. In the specific representation by GECROS, photosynthesis rates depend on soil moisture. In the experiments in which the initial soil moisture content starts with mid-range values, it tends to drop to the wilting point. As a result, the photosynthesis rates may suddenly drop dramatically. This pattern is opposite when the initial conditions are near soil moisture field capacity [71]. With averagely distributed precipitation during the entire season, the soil moisture content is always larger than the photosynthesis cut-off point. In this situation, the average photosynthesis rate is in between the extreme conditions of dry and wet soils [69,71].
Our observations show that soil moisture, therefore, changes from moist to dry in a matter of a week and backward in a matter of days (Figure 11). In the model experiment with an average distribution of precipitation throughout the belg season, the soil water content would be constant and above the wilting point, preventing unproductive periods with soil moisture below the wilting point. This model experiment indicates that a regularly scheduled supply of water (irrigation and or precipitation) can significantly improve crop growth and yield. Simple rainfall harvesting technologies can be recommended as options to supply moisture for the crop water requirement. Note that farmers in the highlands traditionally grow crops without irrigation [2].
In situations with heavy precipitation in a short period, part of the infiltrated water will percolate to deeper soil layers and may become unavailable for plants. Runoff could also occur, but this is not taken into account in the GECROS model [40]. Increased precipitation beyond the moisture holding capacity of the soil facilitates nutrient loss into the deep soil layer and causes a decline in crop yield [2]. These processes require further observational evidence.

5. Conclusions

The aim of this paper was to study the temporal and spatial variations in weather as a function of elevation and their impact on potato crop growth during the belg 2017 crop season. We used newly obtained weather and crop observations from our GEMS network. Here, we answered the following research questions:
(1)
How does the topography and presence of lakes induce mesoscale circulations in the Gamo Highlands during the belg season? The observations show a southeasterly lake/valley wind pattern as predominant during the day, and opposing land/mountain winds during the night. These observed patterns are based on the lower potential temperature and a higher specific humidity originated at the lowland stations. However, the signal and pattern of these upslope winds on temperature and humidity in the highland stations were weaker. Precipitation is highly correlated to the increase in elevation.
(2)
How do the mesoscale circulations interact with the synoptic circulation driven by the ITCZ? The ITCZ, a synoptic tropical weather system, which moves northward during the belg season, is correlated with the GEMS network SLP data and causes a shift in wind direction and moisture content during its passage. An interesting finding was that the ITCZ and maximum precipitation locations did not coincide. The ITCZ passes the Gamo Highlands overhead in March, but the maximum precipitation is recorded during May.
In February, dry air masses originating at the Arabian Peninsula characterized the synoptic scale at the Gamo Highlands. Superimposed to this flows, we observed stronger E to SE lake breezes during daytime, and more localized and weaker mountain winds during nighttime. In May, and due to the northern movement of the ITCZ, the air masses originated at the SE to S reaching the Gamo Highlands are characterized by a high moisture content. Our observations show that precipitation is less often during daytime since the mesoscale winds aligned with the moist and warm SE synoptic winds. During the night, however, the interaction between the synoptic and local flows might facilitate convergence, which enhances cloud formation, and the precipitation conditions.
(3)
How do the weather variations resulting from this interaction affect crop growth? The design of the GEMS network in mountain transects, with stations every few hundred meters above 2000 m and sub-hourly observations, was capable of identifying spatial and temporal variations in wind and precipitation in the potato-cropping zone.
The observed and modeled potato growth variables such as the length of the growing season (LGS), the maximum plant height, and the yield are clear functions of elevation (Figure 10). Using the crop model experiments, we found that precipitation, increasing with elevation, is by far the most important meteorological variable determining crop growth and yield in the Gamo Highlands. This is probably because other meteorological variables are less limiting.
Relevant crop variables, such as the LGS, improve with the new input of the GEMS meteorological observations. The comparison of the attainable yield between the model results and the observations shows that the crop model requires a new calibration to be adjusted to the Ethiopian varieties. New observations of the attainable yield need to be done in the future to consider the field size. This future work will also address the omission of crop yield loss due to diseases higher up the mountains. There, the vegetation is more frequently wet and the growing season lasts longer due to lower temperatures.

Author Contributions

Conceptualization, T.T.M., M.K.v.d.M., and J.V.-G.d.A. Methodology, T.T.M., M.K.v.d.M., B.G.H., P.C.S., and J.V.-G.d.A. Software, T.T.M. and M.K.v.d.M. Validation, T.T.M. Formal analysis, T.T.M. Investigation, T.T.M. Resources, T.T.M., M.K.v.d.M., B.G.H., P.C.S., and J.V.-G.d.A. Data curation, T.T.M. Writing—original draft preparation, T.T.M. Writing—review and editing, T.T.M., M.K.v.d.M., B.G.H., P.C.S., and J.V.-G.d.A. Visualization, T.T.M., M.K.v.d.M., B.G.H., P.C.S., and J.V.-G.d.A. Supervision, M.K.v.d.M., P.C.S., and J.V.-G.d.A. Project administration, J.V.-G.d.A. Funding acquisition, M.K.v.d.M. and J.V.-G.d.A.

Funding

Thomas T. Minda’s research is supported by the Netherlands Organization for International Cooperation in Higher Education (NUFFIC).

Acknowledgments

We would like to appreciate and thank Guchie Gulie for his encouragement and resource arrangement during site visits. The following people also contributed during our fieldwork: Fasil Eshetu, Sabura Shara, Alemayehu Hailemiceal, Teklu Wogayehu, Yechale Kebede, Simon Shibru, Beshah Mogossie, Zelalem Anely, Yared Godine, Tonja T. Minda, Tekalign T. Minda, Tadele Girma, Habtamu Hailemariam, Kanko Chuntale, and Admasu Adiyo. We are thankful for Mathias Rotach for his constructive comments on the manuscript. We are grateful for weather data provision by the NMA, Ethiopia.

Conflicts of Interest

The authors declare no conflicts of interest.

References

  1. Tadesse, Y.; Almekinders, C.J.M.; Schulte, R.P.O.; Struik, P.C. Potatoes and livelihoods in Chencha, southern Ethiopia. NJAS Wagening. J. Life Sci. 2018. [Google Scholar] [CrossRef]
  2. Minda, T.T.; van der Molen, M.K.; Struik, P.C.; Combe, M.; Jiménez, P.A.; Khan, M.S.; de Arellano, J.V.-G. The combined effect of elevation and meteorology on potato crop dynamics: A 10-year study in the Gamo Highlands, Ethiopia. Agric. For. Meteorol. 2018, 262, 166–177. [Google Scholar] [CrossRef]
  3. Khan, M. Assessing Genetic Variation in Growth and Development of Potato. Ph.D. Thesis, Wageningen University & Research, Wageningen, The Netherlands, 2012. [Google Scholar]
  4. Streck, N.A.; de Paula, F.L.M.; Bisognin, D.A.; Heldwein, A.B.; Dellai, J. Simulating the development of field grown potato (Solanum tuberosum L.). Agric. For. Meteorol. 2007, 142, 1–11. [Google Scholar] [CrossRef]
  5. Food and Agriculture Organization (FAO). International Year of the Potato 2008. Available online: http://www.potato2008.org/en/potato/cultivation.html (accessed on 10 May 2017).
  6. Tsegaw, T. Response of Potato to Paclobutrazol and Manipulation of Reproductive Growth under Tropical Conditions. Ph.D. Thesis, University of Pretoria, Pretoria, South Africa, 2005. [Google Scholar]
  7. MOANR. Crop Variety Register Issue No. 18; Minsirty of Agriculture and Natural Resources: Addis Ababa, Ethiopia, 2016. [Google Scholar]
  8. Gebreselassie, H.; Mohamed, W.; Shimelis, B. Evaluation of Potato (Solanum tuberosum L.) Varieties for Yield and Yield Components in Eastern Ethiopia. J. Biol. Agric. Healthc. 2016, 6, 146–154. [Google Scholar]
  9. Tufa, A.H. Economic and Agronomic Analysis of the Seed Potato Supply Chain in Ethiopia. Ph.D. Thesis, Wageingen University & Research, Wageningen, The Netherlands, 2013. [Google Scholar]
  10. Degefu, W. Some Aspects of Meteorological Drought in Ethiopia; Cambridge University Press: Cambridge, UK, 1987. [Google Scholar]
  11. Awulachew, S.B.; Erkossa, T.; Namara, R.E. Irrigation potential in Ethiopia. In Constraints and Opportunities for Enhancing the System; International Water Management Institute: Addis Ababa, Ethiopia, 2010. [Google Scholar]
  12. Cattani, E.; Merino, A.; Levizzani, V. Evaluation of Monthly Satellite-Derived Precipitation Products over East Africa. J. Hydrometeorol. 2016, 17, 2555–2573. [Google Scholar] [CrossRef]
  13. Daye, D.D.; Healey, J.R. Impacts of land-use change on sacred forests at the landscape scale. Glob. Ecol. Conserv. 2015, 3, 349–358. [Google Scholar] [CrossRef] [Green Version]
  14. Diro, G.T.; Black, E.; Grimes, D. Seasonal forecasting of Ethiopian spring rains. Meteorol. Appl. 2008, 15, 73–83. [Google Scholar] [CrossRef] [Green Version]
  15. Nicholson, S.E. Dryland Climatology; Cambridge University Press: Cambridge, UK, 2011. [Google Scholar]
  16. Nicholson, S.E. A revised picture of the structure of the “monsoon” and land ITCZ over West Africa. Clim. Dyn. 2009, 32, 1155–1171. [Google Scholar] [CrossRef]
  17. Pierre, C.; Wilson, G.; Olivier, P.; Vincent, D.; Funatsu, B.M.; Nathalie, P. Major role of water bodies on diurnal precipitation regimes in Eastern Africa. Int. J. Climatol. 2018, 38, 613–629. [Google Scholar]
  18. Camberlin, P. Nile Basin Climates. In The Nile: Origin, Environments, Limnology and Human Use; Dumont, H.J., Ed.; Springer: Dordrecht, The Netherlands, 2009; pp. 307–333. [Google Scholar]
  19. Fraedrich, K. A simple climatological model of the dynamics and energetics of the nocturnal circulation at Lake Victoria. Q. J. R. Meteorol. Soc. 1972, 98, 322–335. [Google Scholar] [CrossRef]
  20. Haile, A.T.; Rientjes, T.; Gieske, A.; Gebremichael, M. Rainfall Variability over Mountainous and Adjacent Lake Areas: The Case of Lake Tana Basin at the Source of the Blue Nile River. J. Appl. Meteorol. Clim. 2009, 48, 1696–1717. [Google Scholar] [CrossRef]
  21. Haile, A.T.; Habib, E.; Elsaadani, M.; Rientjes, T. Inter-comparison of satellite rainfall products for representing rainfall diurnal cycle over the Nile basin. Int. J. Appl. Earth Obs. Géoinf. 2013, 21, 230–240. [Google Scholar] [CrossRef]
  22. Rientjes, T.; Haile, A.T.; Fenta, A.A. Diurnal rainfall variability over the Upper Blue Nile Basin: A remote sensing based approach. Int. J. Appl. Earth Obs. Geoinf. 2013, 21, 311–325. [Google Scholar] [CrossRef]
  23. Nicholson, S.E. The ITCZ and the Seasonal Cycle over Equatorial Africa. Bull. Am. Meteorol. Soc. 2018, 99, 337–348. [Google Scholar] [CrossRef]
  24. Barry, R.G.; Chorley, R.J. Atmosphere, Weather and Climate; Routledge: Abingdon, UK, 2009. [Google Scholar]
  25. Houze, R.A. Orographic effects on precipitating clouds. Rev. Geophys. 2012, 50. [Google Scholar] [CrossRef] [Green Version]
  26. van Oldenborgh, G.J.; Collins, M.; Arblaster, J.; Christensen, J.H.; Marotzke, J.; Power, S.B.; Rummukainen, M.; Zhou, T.; Stocker, T.F.; Qin, D. Annex I: Atlas of Global and Regional Climate Projections; Cambridge University Press: Cambridge, UK; New York, NY, USA, 2013; pp. 1311–1393. [Google Scholar]
  27. Stocker, T.F.; Qin, D.; Plattner, G.-K.; Tignor, M.; Allen, S.K.; Boschung, J.; Nauels, A.; Xia, Y.; Bex, V.; Midgley, P.M. Climate Change 2013: The Physical Science Basis; Intergovernmental Panel on Climate Change, Working Group I Contribution to the IPCC Fifth Assessment Report (AR5); Cambridge University Press: New York, NY, USA, 2013. [Google Scholar]
  28. Kerandi, N.; Arnault, J.; Laux, P.; Wagner, S.; Kitheka, J.; Kunstmann, H. Joint atmospheric-terrestrial water balances for East Africa: A WRF-Hydro case study for the upper Tana River basin. Theor. Appl. Clim. 2018, 131, 1337–1355. [Google Scholar] [CrossRef]
  29. Rowell, D.P.; Booth, B.B.B.; Nicholson, S.E.; Good, P. Reconciling Past and Future Rainfall Trends over East Africa. J. Clim. 2015, 28, 9768–9788. [Google Scholar] [CrossRef]
  30. Schlenker, W.; Roberts, M.J. Nonlinear temperature effects indicate severe damages to U.S. crop yields under climate change. Proc. Natl. Acad. Sci. USA 2009, 106, 15594–15598. [Google Scholar] [CrossRef] [PubMed] [Green Version]
  31. Rosenzweig, C.; Elliott, J.; Deryng, D.; Ruane, A.C.; Müller, C.; Arneth, A.; Boote, K.J.; Folberth, C.; Glotter, M.; Khabarov, N.; et al. Assessing agricultural risks of climate change in the 21st century in a global gridded crop model intercomparison. Proc. Natl. Acad. Sci. USA 2014, 111, 3268–3273. [Google Scholar] [CrossRef] [PubMed] [Green Version]
  32. Portmann, F.T.; Siebert, S.; Döll, P. MIRCA2000—Global monthly irrigated and rainfed crop areas around the year 2000: A new high-resolution data set for agricultural and hydrological modeling. Glob. Biogeochem. Cycles 2010, 24. [Google Scholar] [CrossRef]
  33. Liu, J.; Williams, J.R.; Zehnder, A.J.B.; Yang, H. GEPIC—modelling wheat yield and crop water productivity with high resolution on a global scale. Agric. Syst. 2007, 94, 478–493. [Google Scholar] [CrossRef]
  34. Lorenz, E.N. Deterministic Nonperiodic Flow. J. Atmos. Sci. 1963, 20, 130–141. [Google Scholar] [CrossRef] [Green Version]
  35. Dee, D.; Fasullo, J.; Shea, D.; Walsh, J. The Climate Data Guide: Atmospheric Reanalysis: Overview & Comparison Tables. Available online: https://climatedataguide.ucar.edu/climate-data/atmospheric-reanalysis-overview-comparison-tables (accessed on 11 May 2018).
  36. Diro, G.T.; Grimes, D.; Black, E.; O’neill, A.; Pardo-Iguzquiza, E. Evaluation of reanalysis rainfall estimates over Ethiopia. Int. J. Clim. 2009, 29, 67–78. [Google Scholar] [CrossRef] [Green Version]
  37. Araya, N.S. Weather insurance for farmers: experience from Ethiopia. In Proceedings of the IFAD Conference on New Directions for Smallholder Agriculture, Rome, Italy, 24–25 January 2011. [Google Scholar]
  38. Dinku, T.; Hailemariam, K.; Maidment, R.; Tarnavsky, E.; Connor, S. Combined use of satellite estimates and rain gauge observations to generate high-quality historical rainfall time series over Ethiopia. Int. J. Clim. 2014, 34, 2489–2504. [Google Scholar] [CrossRef]
  39. NMSA. Regional Meteorological Station Information. Available online: http://www.ethiomet.gov.et/stations/regional_information/4 (accessed on 12 March 2018).
  40. Yin, X.; van Laar, H. Crop Systems Dynamics: An Ecophysiological Simulation Model for Genotype-by-Environment Interactions; Wageningen Academic Publishers: Wageningen, The Netherlands, 2005. [Google Scholar]
  41. Ramapriyan, H.K.; Murphy, K. Collaborations and Partnerships in NASA’s Earth Science Data Systems. Data Sci. J. 2017, 16, 51. [Google Scholar] [CrossRef]
  42. Mazengia, W.; Schulte, R.; Tadese, Y.; Griffin, D.; Schulz, S.; Struik, P.C. The Farming Systems of Potential Potato Production Areas of Chencha, Southern Ethiopia. In Potato and Sweetpotato in Africa: Transforming the Value Chains for Food and Nutrition Security; CABI: Cambridge, UK, 2015; Chapter 37; pp. 382–396. [Google Scholar]
  43. Instruments, D. Vantage Pro2™ Console Manual; Davis Instruments Corp.: Hayward, CA, USA, 2006. [Google Scholar]
  44. Steeneveld, G.J.; Koopmans, S.; Heusinkveld, B.G.; Theeuwes, N.E. Refreshing the role of open water surfaces on mitigating the maximum urban heat island effect. Landsc. Urban Plan. 2014, 121, 92–96. [Google Scholar] [CrossRef]
  45. Lagouvardos, K.; Kotroni, V.; Bezes, A.; Koletsis, I.; Kopania, T.; Lykoudis, S.; Mazarakis, N.; Papagiannaki, K.; Vougioukas, S. The automatic weather stations NOANN network of the National Observatory of Athens: operation and database. Geosci. Data J. 2017, 4, 4–16. [Google Scholar] [CrossRef]
  46. Bell, S.; Cornford, D.; Bastin, L. How good are citizen weather stations? Addressing a biased opinion. Weather 2015, 70, 75–84. [Google Scholar] [CrossRef]
  47. Davis-Instruments. Davis Instruments Support. Available online: https://www.davisinstruments.com/resources/weather-monitoring/#support (accessed on 25 August 2018).
  48. National Oceanic and Atmospheric Administration (NOAA). Climate Prediction Center: Africa InterTropical Front (ITF). Available online: http://www.cpc.ncep.noaa.gov/products/international/itf/itcz.shtml (accessed on 15 September 2017).
  49. African Center of Meteorological Application for Development (ACMAD). ITD and ITCZ Positions. Available online: http://www.acmad.net/new/ (accessed on 15 March 2017).
  50. Blunden, J.; Arndt, D.S.; Hartfield, G. State of the Climate in 2017. Bull. Am. Meteorol. Soc. 2018, 99, S143–S173. [Google Scholar]
  51. Tsidu, G.M. Eastern Africa in State of the Climate in 2017. Bull. Am. Meteorol. Soc. 2018, 99, S216–S217. [Google Scholar]
  52. Davis-Instruments. Derived Variables in Davis Weather Products. Support Documents for: Wireless Vantage Pro2™ Plus with. 2006. Available online: https://www.davisinstruments.com/support/derived-variables-in-davis-weather-products/ (accessed on 29 September 2018).
  53. Stull, R. Meteorology for Scientists and Engineers; Brooks/Cole: Boston, MA, USA, 2000. [Google Scholar]
  54. Woldegiorgis, G. Potato variety development strategies and methodologies in Ethiopia. In Seed Potato Tuber Production and Dissemination: Experiences, Challenges and Prospects; Ethiopian Institute of Agricultural Research: Addis Ababa, Ethiopia, 2013. [Google Scholar]
  55. Gomez, K.A.; Gomez, K.A.; Gomez, A.A. Statistical Procedures for Agricultural Research; John Wiley & Sons: Hoboken, NJ, USA, 1984. [Google Scholar]
  56. Khan, M.; Yin, X.; van der Putten, P.E.L.; Struik, P.C. An ecophysiological model analysis of yield differences within a set of contrasting cultivars and an F1 segregating population of potato (Solanum tuberosum L.) grown under diverse environments. Ecol. Model. 2014, 290, 146–154. [Google Scholar] [CrossRef]
  57. Leenaars, J.; Ruiperez, G.M. Africa Soil Profiles Database, Version 1.2. In A Compilation of Georeferenced and Standardised Legacy Soil Profile Data for Sub-Saharan Africa (with Dataset); Wageningen University & Research: Wageningen, The Netherlands, 2014. [Google Scholar]
  58. Korecha, D.; Barnston, A.G. predictability of June-September rainfall in Ethiopia. Mon. Weather. Rev. 2007, 135, 628–650. [Google Scholar] [CrossRef]
  59. Berhane, F.; Zaitchik, B. Modulation of Daily Precipitation over East Africa by the Madden–Julian Oscillation. J. Clim. 2014, 27, 6016–6034. [Google Scholar] [CrossRef]
  60. Diro, G.T.; Grimes, D.; Black, E. Large scale features affecting Ethiopian rainfall. In African Climate and Climate Change; Springer: Berlin, Germany, 2011; pp. 13–50. [Google Scholar]
  61. Whiteman, C.D. Mountain Meteorology: Fundamentals and Applications; Oxford University Press: Oxford, UK, 2000. [Google Scholar]
  62. Zardi, D.; Whiteman, C.D. Diurnal Mountain Wind Systems. In Mountain Weather Research and Forecasting: Recent Progress and Current Challenges; Chow, F.K., De Wekker, S.F.J., Snyder, B.J., Eds.; Springer: Dordrecht, The Netherlands, 2013; pp. 35–119. [Google Scholar]
  63. Crosman, E.T.; Horel, J.D. Sea and Lake Breezes: A Review of Numerical Studies. Bound. Lay. Meteorol. 2010, 137, 1–29. [Google Scholar] [CrossRef] [Green Version]
  64. Gebremariam, B. Basin Scale Sedimentary and Water Quality Responses to External Forcing in Lake Abaya, Southern Ethiopian Rift Valley; Freie Universität of Berlin: Berlin, Germany, 2007. [Google Scholar]
  65. Jury, M.R. Southern Ethiopia Rift Valley lake fluctuations and climate. Sci. Res. Essays 2014, 9, 794–805. [Google Scholar]
  66. Viste, E.M. Moisture Transport and Precipitation in Ethiopia. Ph.D. Thesis, University of Bergen, Bergen, Norway, 2012. [Google Scholar]
  67. Sukhatme, P.V. The Problem of Plot Size in Large-Scale Yield Surveys. J. Am. Stat. Assoc. 1947, 42, 297–310. [Google Scholar] [CrossRef] [PubMed]
  68. Mukabana, J.R.; Pielke, R.A. Numerical Simulation of the Influence of the Large-Scale Monsoon Flow on the Diurnal Weather Patterns over Kenya; Atmospheric Science Paper No. 542; Colorado State University: Fort Collins, CO, USA, 1992. [Google Scholar]
  69. Verhoef, A.; Egea, G. Modeling plant transpiration under limited soil water: Comparison of different plant and soil hydraulic parameterizations and preliminary implications for their use in land surface models. Agric. For. Meteorol. 2014, 191, 22–32. [Google Scholar] [CrossRef]
  70. Harper, P. Optimum leaf area index in the potato crop. Nature 1963, 197, 917–918. [Google Scholar] [CrossRef]
  71. Combe, M.; Vilà-Guerau de Arellano, J.; Ouwersloot, H.G.; Jacobs, C.M.J.; Peters, W. Two perspectives on the coupled carbon, water and energy exchange in the planetary boundary layer. Biogeosciences 2015, 12, 103–123. [Google Scholar] [CrossRef] [Green Version]
Figure 1. Six GEMS stations network (black dots) and potato experimental farms (red dots). The large digital elevation model covers an area of 80 km × 80 km and the insets with detailed topography map cover 5 km × 5 km area. The dashed black lines show the south–north (SN) and east–west (EW) transects of the network. The dashed white line represents the approximate southeast (SE) boundary of the Gamo Highlands.
Atmosphere 09 00398 g001
Figure 2. The daily mean observed SLP at Arba Minch station during the belg season of 2017. The SLP (black line with scale on the left y-axis); latitudinal variation of the ITCZ climatology (15-year data for April and May following Section 2.2) and in 2017 (blue lines with blue right-side y-axis). The ITCZ location data before March 2017 are not available. The cyan-coloured horizontal bar shows the latitude range of the Gamo Highlands.
Atmosphere 09 00398 g002
Figure 3. Observed temperature (left y-axis) and total monthly precipitation (right y-axis) during belg 2017 and following the 1987–2016 climatology. The green-colored bars show the climatological belg data from Arba Minch station (data obtained from the NMA, Ethiopia), the red- and black-coloured bars show the 2017 belg season as observed by the GEMS network. The GEMS data were averaged/summed to daily/monthly values, respectively.
Atmosphere 09 00398 g003
Figure 4. Diurnal evolution of monthly average wind direction (φ (°)) observed at reference (Arba Minch) and Chencha stations on the SN transect during belg 2017 (Figure 1). The shaded regions show mean ± standard deviations. Note that the standard deviations are calculated on hourly-averaged data for each month.
Atmosphere 09 00398 g004
Figure 5. The dominant local wind sources in the GEMS stations network in Feb 2017 during daytime (full-colored bar plots) and nighttime (light-coloured bar plots). The left and right plots show wind direction (a) and wind speed (b), respectively, as explained in Section 2.3.
Atmosphere 09 00398 g005
Figure 6. Diurnal evolution of potential temperature (θ) (a) and specific humidity (q) (b) in February 2017. The shaded regions show mean ± standard deviation (computed on hourly averages). Chencha is not included here for lacking SLP data (Table 2). Note that the standard deviation follows similar calculations to that of Figure 4.
Atmosphere 09 00398 g006
Figure 7. (a) φ (°), (b) u (m·s−1), (c) ∂θ/∂t (K/15-min), and (d) ∂q/∂t (g·kg−1/15-min) during the shift from stratified boundary layer to convective boundary layer in February 2017. The vertical lines show the approximate time of sunrise time in February 2017.
Atmosphere 09 00398 g007
Figure 8. (a) 3-h total precipitation (mm/3 h), (b) 3-h mean φ (°) (bar plots) and SW↓ (W·m−2) (line plots). Data from Arba Minch, Tegecha, and Chencha GEMS network in the SN transect in May.
Atmosphere 09 00398 g008
Figure 9. GECROS-modeled (open dots) and observed (closed dots) values for crop growth variables and yield for Tegecha (2140 m), Chencha (2738 m), and Gircha (3010 m) stations in the Gamo Highlands: (a) LGS (d), (b) MPH (cm), and (c) observed (attainable) crop yield (t·ha−1). Note that MPH data for Chencha are missing.
Atmosphere 09 00398 g009
Figure 10. Model sensitivity experiment outputs based on Table 3 for Tegecha (2140 m), Chencha (2738), and Gircha (3010) stations. The LGS (d) (a,b), MPH (cm) (c,d), and attainable yield (t·ha−1) (e,f). The left panel shows average distribution (means of the belg data for each day) experiments of the major atmospheric crop drivers: SW↓, Tmin, Tmax, PPT, and VPD. The right panel shows shifting the peak precipitation in May to March (“Early belg”), April (“Normal belg”), and June (“Late belg”) model experiment assumptions. Note that the control experiment is added in each panel for ease of comparison.
Atmosphere 09 00398 g010
Figure 11. Observed soil moisture tension (kPa) at 5, 10, 20, and 40 cm soil depth (left y-axis) and daily precipitation (mm·d−1; bar plot for observed and dot plot for average precipitation distribution) (right y-axis) at the Tegecha (2140 m) station from March to May in 2017. The soil moisture tension is represented by daily averages (line plots). Note that 0 kPa means the soil is fully saturated and 200 kPa means fully dry soil.
Atmosphere 09 00398 g011
Table 1. Gamo Ethiopian Meteorological Stations (GEMS) and potato crop field experiment site descriptions. Key: Lon—longitude; Lat—latitude; Elv—elevation; LULC—land use land cover; N, E, S, W—north, east, south, west.
StationTransectLocationLocation DescriptionSoil a (LULC b) DescriptionPotato Crop Planting Dates
Lon (°E)Lat (°N)Elv (m)
Arba MinchReference37.5686.0671200A plain farmVertisols (crop)
TegechaSN37.5736.1612091Near forest (S), valley (W) & mountain (N)Nitisols (crop, forest)5 April 2017
ChenchaSN37.5716.2542753Rural townAndosols (crop, rural settlement)25 March 2017
GirchaSN37.5646.3023015Open grazing landAndosols (crop, grazing land)7 March 2017
ZigitiEW37.4596.0732414Near mountain (N)Nitisols (crop, rural settlement)
GazessoEW37.3376.1302847Rural town, near mountainAndosols (crop, rural settlement)2 March 2017
a Data were obtained from the International Soil Reference and Information Centre (ISRIC) soil grids (https://www.soilgrids.org/#!/?layer=TAXNWRB_250m&vector=1); b The Ethiopian Sentinel-2 land-use land-cover (LULC) 2016 data were obtained from the Regional Centre for Mapping of Resources for Development (RCMRD) GeoPortal (http://geoportal.rcmrd.org/layers/servir%3Aethiopia_sentinel2_lulc2016).
Table 2. The automatic weather stations types, weather variables measured, sensor type, measurement resolution, sensors’ measurement accuracy, and data update interval of the sensors [47]. Key: AWS—automatic weather station; SLP—sea-level pressure.
AWSVariables Measured Sensor TypeResolutionAccuracy (±)Update Interval
Davis Vantage Pro2 + (DVP2)Incoming shortwave radiation (SW↓)Silicon photodiode1 W∙m−22% of full scale 50 s to 1-min
Temperature (T) P–N junction silicone diode1 °C/0.5 °C/10 s
Relative humidity (RH)Film capacitor element1%2%50 s
Precipitation (PPT)Tipping bucket with magnetic switch0.2 mmgreater of 4% or 1 tip20 s
2 m wind speed (u)Solid state magnetic sensor0.1 m·s−11 m·s−12.5 s
2 m wind direction (φ)Wind vane potentiometer22.5 on compass rose2.5 s
Barometric pressure (SLP)Davis Instruments 63220.1 hPa1.0 hPa1-min
Soil moisture tension (ψ) Watermark1 kPa 77–90 s
Soil temperature (Tsoil) Precision thermistor1 °C0.5 °C77–90 s
Leaf wetness (LW) Artificial leaf electrical resistance1 (0 to 15 range)0.5 1-min
Campbell Scientific (CS)SW↓LI-COR 200 r pyranometer <1% over 360°
T/RHCS215-L 0.10 °C/2.0%
pptPronamics professional rain gauge0.1 mm2.0%
u03001 Wind Sentry Anemometer/Vane 0.5 m∙s−1/5°
Table 3. GECROS model sensitivity experiment design. Key: PPT—precipitation; VPD—vapor pressure deficit.
No.ExperimentExperiment NameDescription of Input of Meteorological Variables
0ControlControl6 variables as observed
1SW↓SW↓, avg5 variables as observed + belg-averaged SW↓
2TminTmin, avg5 variables as observed + belg-averaged Tmin
3TmaxTmax, avg5 variables as observed + belg-averaged Tmax
4PPTPPTavg5 variables as observed + belg-averaged precipitation
5VPDVPDavg5 variables as observed + belg-averaged VPD
6early-belgEarly belgexchanging May and March observation + other periods as observed
7normal-belgNormal belgexchanging May and April observation + other periods as observed
8belg-in-kirmetLate belgexchanging May and June observation + other periods as observed