Article

Particle-Bound Polycyclic Aromatic Hydrocarbon in the Atmosphere of Heavy Traffic Areas in Greater Cairo, Egypt: Status, Source, and Human Health Risk Assessment

by
Salwa Kamal Hassan
Air Pollution Research Department, Environmental Research Division, National Research Centre, Dokki, Giza 12622, Egypt
Atmosphere 2018, 9(10), 368; https://doi.org/10.3390/atmos9100368
Submission received: 21 August 2018 / Revised: 8 September 2018 / Accepted: 10 September 2018 / Published: 21 September 2018
(This article belongs to the Section Air Quality)

Abstract

:
Airborne particulate samples were collected from three main squares (Ramsis, El Giza, and Sphinx) representing heavy traffic areas in Greater Cairo during the period of December 2015–February 2016, and analysed for polycyclic aromatic hydrocarbon (PAHs). The maximum concentrations of particle-bound PAHs were observed at El Giza, while the minimum levels were recorded at Sphinx. The levels of particle-bound PAHs in the square areas of Greater Cairo are higher than those found in many different locations in Egypt and around the world.The distribution of individual particle-bound PAHs as well as PAH categories, depending on the ring number in Ramsis, El Giza, and Sphinx, wasquite similar. This similarity implies similar emission sources of PAHs in the three square areas, with vehicle exhaust emissions being the dominant one. Benzo[b]fluoranthene (BbF), benzo[ghi]perylene (BGP), and indeno[1,2,3-cd]pyrene(IND) were the most abundant PAH compounds. Diagnostic concentration ratios of PAH compounds in the three square locations suggest that both petrogenic and pyrogenic sources emit these compounds. Moreover, they originate mainly from traffic emissions in the study areas. Based on the calculated benzo[a]pyrene equivalent (BaPeq) for the individual particle-bound PAH compounds, health risks associated with the inhalation of these compounds were assessed. Total carcinogenic activity (TCA) for all measured PAHs represented 20.03% (El Giza), 20.40% (Ramsis), and 20.60% (Sphinx) of the total PAH concentrations. Benzo[a]pyrene (BaP) and dibenz[a,h]anthracene (DBA) were the highest contributors to the total health risks; these accounted for 42.72% and 38.50% (El Giza), 41.79% and 39.17% (Ramsis), and 42.92% and 37.78% (Sphinx) of the TCA of all PAH compounds, respectively. These results indicate the importance of BaP and DBA as surrogate compounds for PAHs in the atmosphere of square areas of Greater Cairo.

1. Introduction

Airborne particulate matter contains both organic and inorganic pollutants. One of the most important organic pollutants in urban environments are polycyclic aromatic hydrocarbons (PAHs) [1,2]. These organic compounds constitute of only carbon and hydrogen and are widely distributed in the environment, and arranged in two or more aromatic rings [3,4]. Recently, PAH compounds have received a great deal of attention due to their known harmful effects on human and environmental health [5,6,7]. Although there are hundreds of PAHs in the environment, only 16 of these compounds are included in the priority pollutants list of US EPA [8]. Several PAH compounds have carcinogenic, cytotoxic, mutagenic, and allergenic potential [9,10,11,12,13]. Most high molecular weight PAH compounds, which occur mainly in the particulate phase, [9] are carcinogenic and/or mutagenic [10,14]. PAH compounds with low molecular weight are less harmful to human health compared to PAH compounds with high molecular weight; however, they can form toxic PAHs from the reaction with ozone and nitrogen oxides [15].
Atmospheric PAHs have both natural and anthropogenic sources [16,17,18]. Forest fires and volcanoes are the natural emission sources of PAHs [19,20], whereas both pyrogenic and petrogenic are the anthropogenic PAH sources. Atmospheric PAHs produced during fossil fuel and biomass combustions are pyrogenic, while petrogenic PAH sources include volatilization and unburned fossil fuel emission [21]. Incomplete combustion and/or pyrolysis of fossil fuels, as well as other organic materials, emit anthropogenic PAH compounds in the atmosphere of urban and industrial areas [22]. Traffic emissions, tire wear debris, asphalt particles, resuspended soils, and electric power plants are the major sources of PAHs [23,24,25]. Previous studies reported that PAHs were found in high levels in urban atmosphere with high traffic density and low atmospheric dispersion [26,27]. PAHs are associated with fine aerosol particles [28,29]. Furthermore, they can be transported into and/or between environmental compartments [30]. PAHs are distributed between gaseous and particulate phases in the atmosphere according to their vapor pressure, and can be dispersed and transported over large areas, followed by dry and/or wet deposition in the soil and other environmental surfaces such as vegetation, water bodies, and ground surfaces (streets and roads) [31,32,33].
As the vehicle numbers in traffic areas are continuously increasing, generated pollutant loads from traffic will force an even greater impact on human and ecosystem health. Therefore, the relationship between traffic characteristics and atmospheric pollution loads worth investigation is required to formulate appropriate strategies to mitigate the adverse impacts on air quality. The information on the concentrations, distribution, sources, and health risks associated with PAH compounds in heavy traffic areas (squares) of Greater Cairo is not enough. Previous studies focused on the level and distribution of PAHs in suspended particulate collected from urban, industrial, and residential areas of Greater Cairo [6,34]. Thus, the aims of this study are: (1) To evaluate the atmospheric levels of particle-bound PAHs in total suspended particulate (TSP) in three heavy traffic areas (squares) in Greater Cairo; (2) to describe the distribution of particle-bound PAHs in TSP in the heavy traffic areas; (3) to identify the possible sources of these particle-bound PAHs based on their diagnostic ratios; and (4) to assess the health risks that are associated with the inhalation of particle-bound PAHs in the heavy traffic areas.

2. Materials and Methods

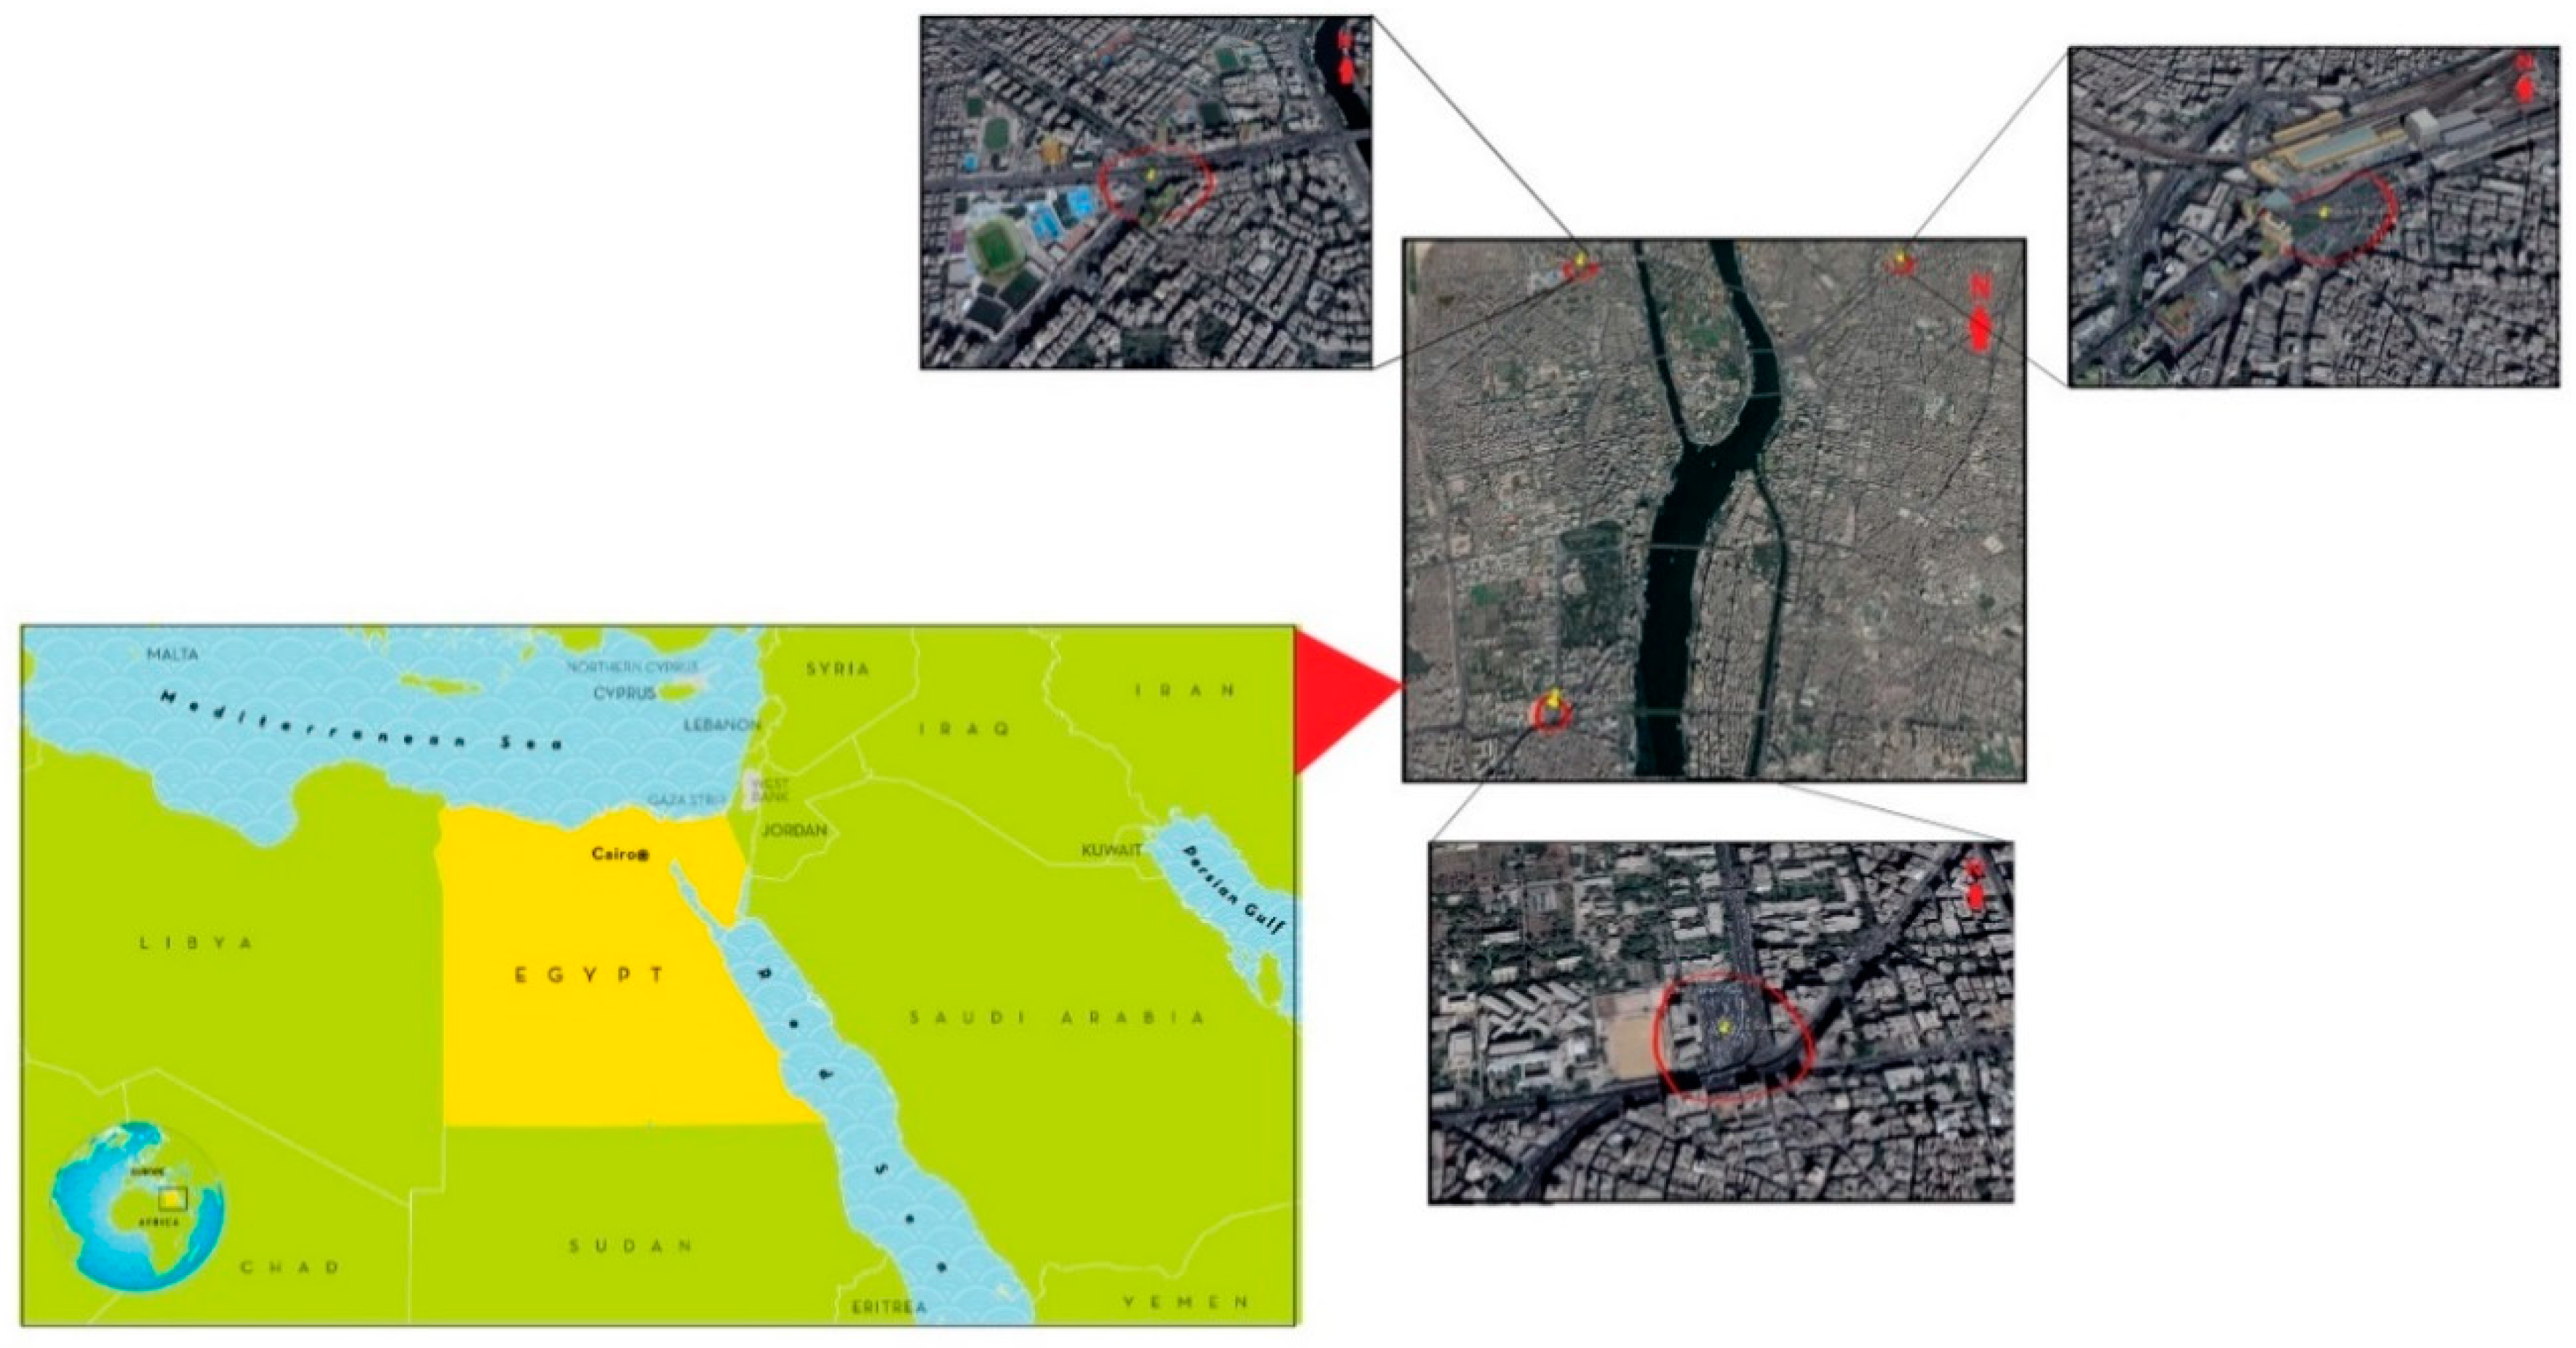
2.1. Sampling Sites and Periods

Greater Cairo is composed of four main sections, including the City of Cairo, Giza governorate, and Shoubra EI-Kheima. Full details of the study areas can be found elsewhere [35]. Briefly, Greater Cairo is the most populous city in Africa with a population of over 22 million, extending for almost 50 km along the sides of the River Nile. Greater Cairo houses most of the polluting activities in the country. Consequently, it is one of the most polluted megacities in the world, due to the higher emission of air pollutants from industrial activities in Shoubra El-Kheima and southwest of Giza (Helwan), a thermal power station, and more than 2.3 millions vehicles running in the street. The low wind speeds and the frequent inversions, coupled with a high rate of emission in the area, have resulted in a high local pollution load.
Three sampling sites representing the traffic areas (main squares) in Greater Cairo were selected for the collection of TSP sampling. These sites are Ramsis Square, El Giza Square in Giza, and Sphinx Square. Information concerning the sampling sites is shown in Figure 1. All samples were collected from a point approximately 9 m above ground level in the traffic areas. Daily (24 h) samples were collected during the period of December 2015–February 2016.
TSP samples were collected through glass fiber filters of Whatman GI: A type (20 cm × 25 cm) using high volume air samplers (General Metal Works Inc., Bensalem, PA, USA), operated at a flow rate of 1.13 m3/min. The samples were collected twice per week. Prior to air sample collection, the cleaning procedures were applied to glass fiber filters. The filters were combusted at 450 °C for 12 h to remove organic impurities and allowed to cool to room temperature in desiccators, and then stored in aluminum foil packages until used. Field blanks were collected through putting another set of glass fiber filters in the sampling site for the same duration with the same steps, without operating the high volume air sampler.

2.2. Chemical Analysis

Details of the sampling extraction and analysis can be found elsewhere [6]. Briefly, particle-bound PAH compounds were extracted from the TSP samples using Soxhlet apparatus, and extracted with DCM/n-hexane mixture (50/50, v/v) for 24 h, according to Fang et al. [36]. The organic extracts were then concentrated using a rotary evaporator, and cleaned with clean silica gel/alumina columns consisting of 5 g anhydrous sodium sulfate, 20 g silica gel (deactivated 5% with distilled water), 10 g alumina (deactivated 1% with distilled water), 5 gm sand, and glass wool [15,37,38]. The extracts were concentrated, exchanged to 2 mL hexane, placed on the columns, and eluted with dichloromethane (200 mL). The eluted extracts were concentrated on a rotary evaporator and exchanged to 1 mL hexane, and stored in a freezer until analysis.
For particle-bound PAH analysis, a 1-μL extract was withdrawn from the samples, including the blank samples, and injected into a Hewlett–Packard gas chromatography (GC; model HP6890), fitted with a flame ionization detector (FID). An HP-5 (30 m× 320 μm×0.25 μm) capillary column was used with hydrogen as carrier gas. The concentrations of the target PAH compounds were quantified through an external standard solution of 15 PAH compounds (PAH mixture, Supelco, Inc., St. Louis, MO, USA). The limit of detection for the measured individual PAH compounds varied from 0.04 to 0.08 ng/m3. The target particle-bound PAH compounds included naphthalene (NA), acenaphthylene (ACY), acenaphthene (ACE), fluorine (FLU), phenanthrene (PHE), anthracene (ANT), fluoranthene (FLT), pyrene (PYR), benz[a]anthracene (BaA), chrysene (CRY), benzo[b]fluoranthene (BbF), benzo[a]pyrene (BaP), dibenz[a,h]anthracene (DBA), benzo[ghi]perylene (BGP), and indeno [1,2,3,-cd]pyrene (IND).
According to the number of aromatic rings, particle-bound PAH compounds were classified into two aromatic rings (NA), three aromatic rings (ACY, ACE, FLU, PHE, and ANT), four aromatic rings (FLT, PYR, BaA, and CRY), five aromatic rings (BbF, BaP, and DBA), and six aromatic rings (IND and BGB). Moreover, the two- and three-ring particle-bound PAH compounds were classified as low molecular weight (LMW) PAH compounds, and the four- and five-ring PAH compounds were classified as middle molecular weight (MMW) PAH compounds. Meanwhile, six-ring PAH compounds were classified as high molecular weight (HMW) PAH compounds.

3. Results and Discussion

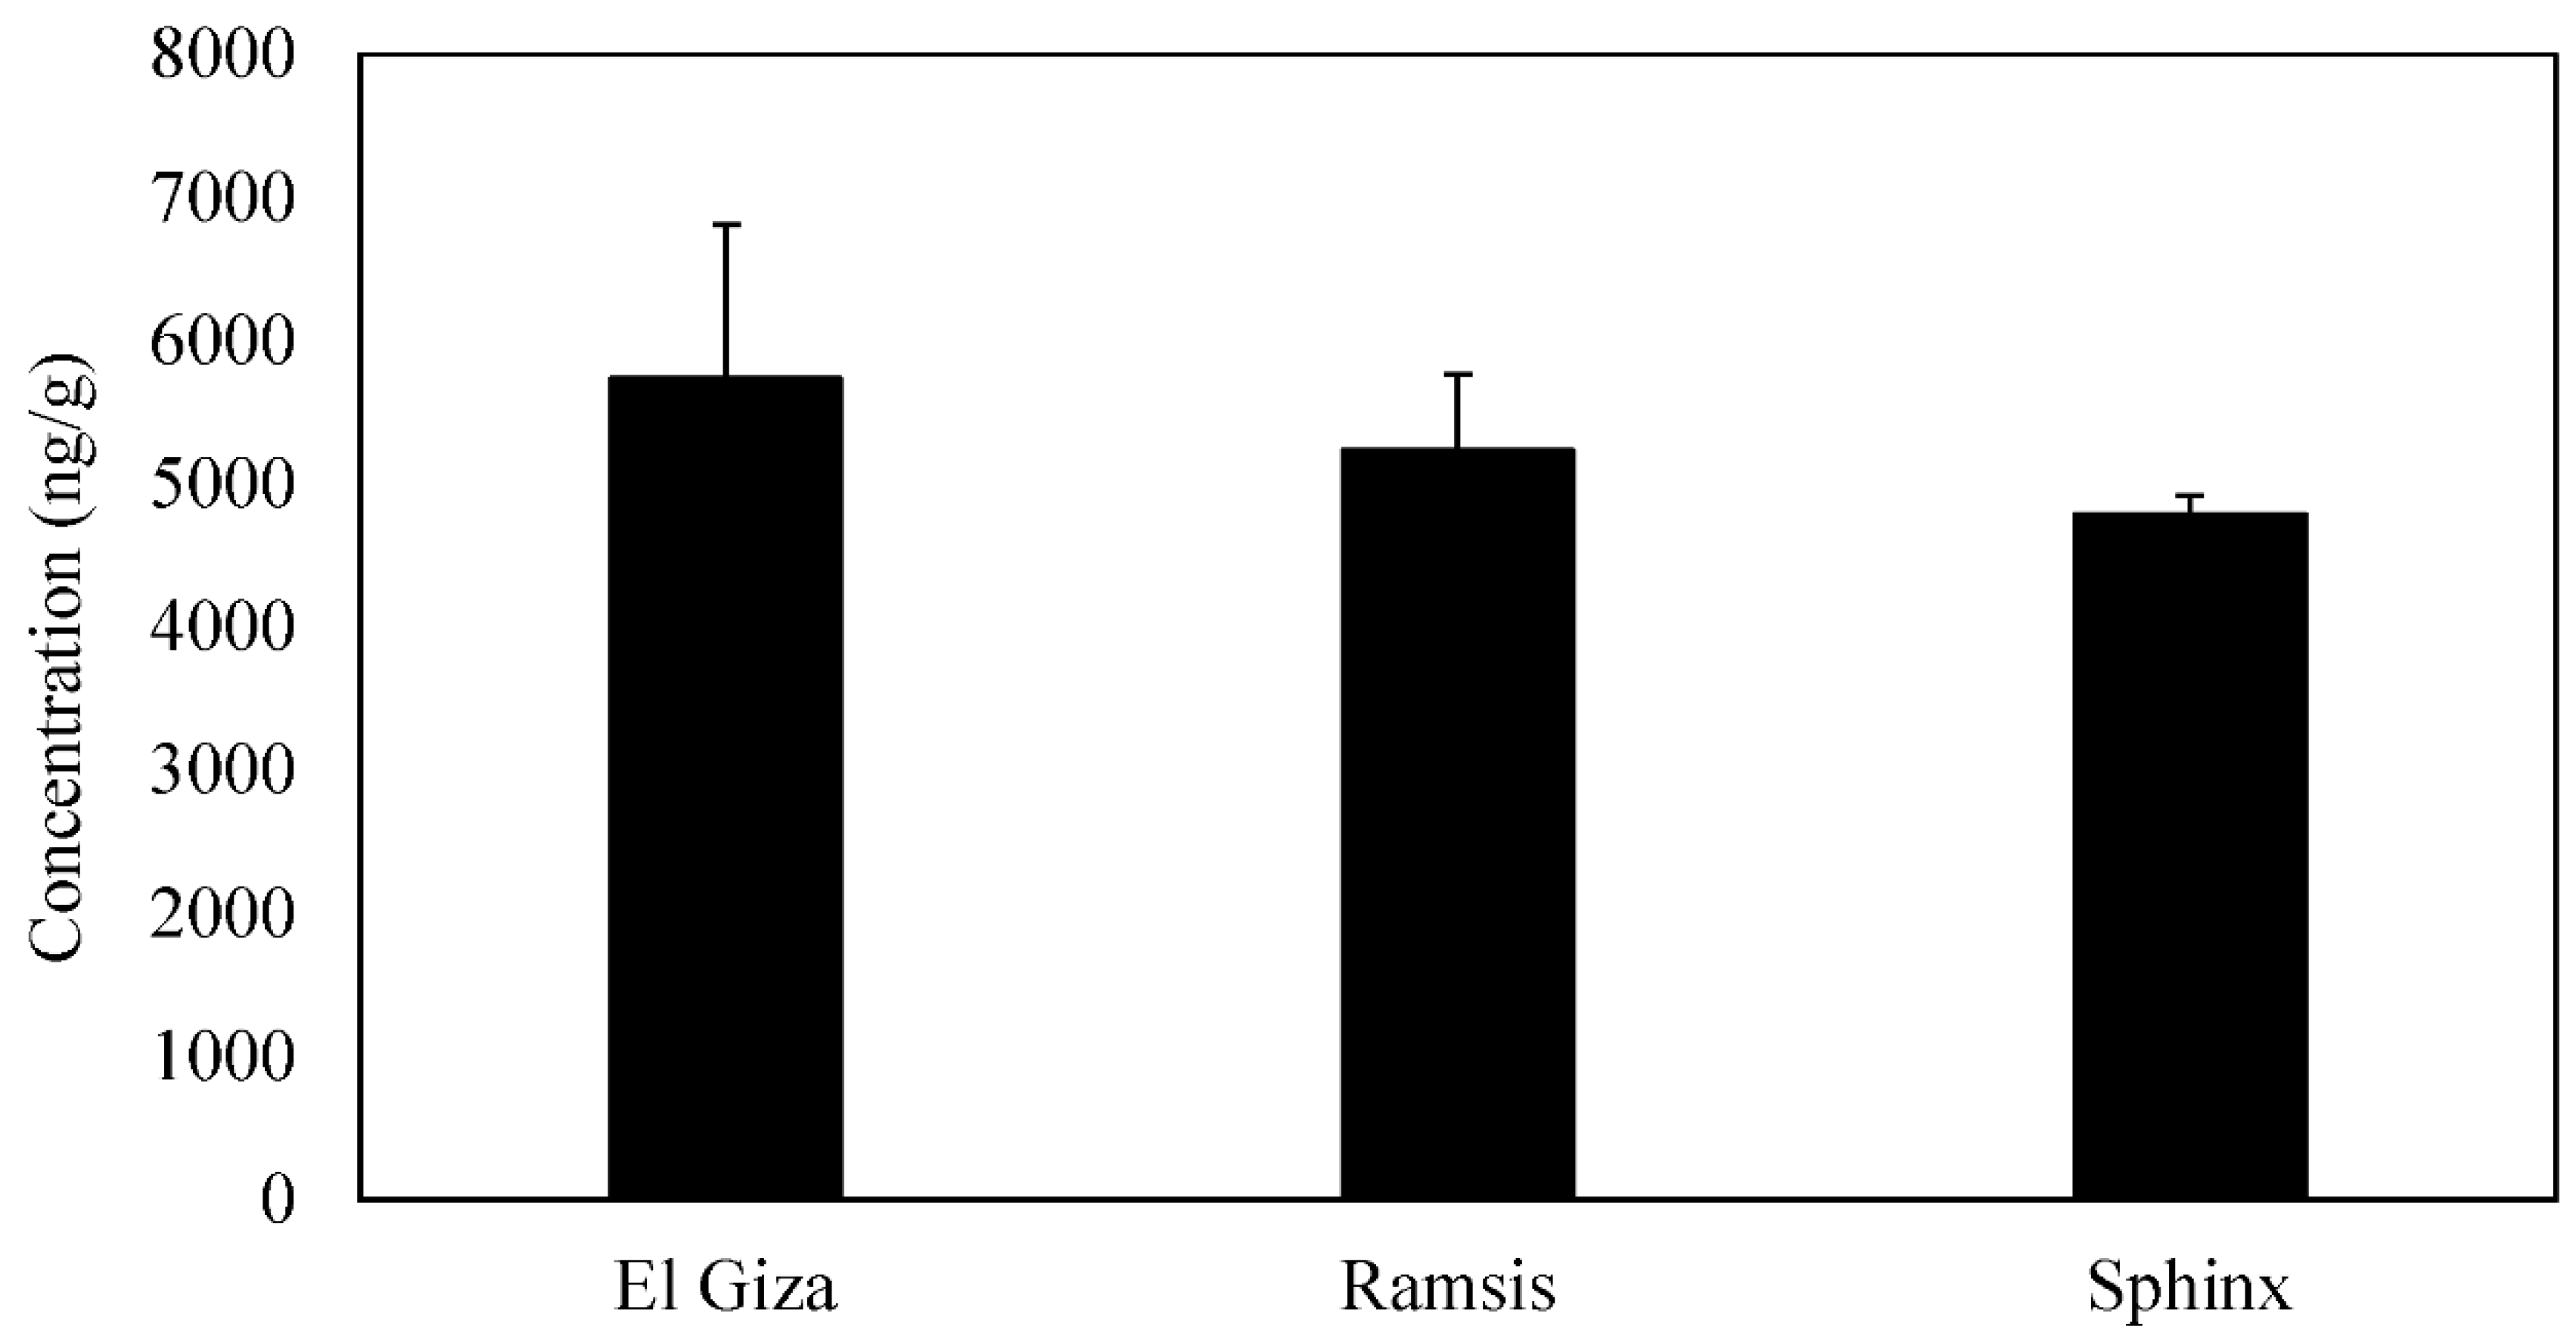
3.1. Spatial Variations of PAHs

The average concentrations of the individual particle-bound PAH compounds in the three study traffic areas (square) are presented graphically in Figure 2. This figure shows that the most abundant particle-bound PAHs were BBF, BGP, IND, PYR, and CRY in these square areas. The average concentrations of individual PAH compounds ranged from 70.09 ng/m3 (ACY) to 980.96 ng/m3 (BbF) at El Giza Square, from 45.23 ng/m3 (ACY) to 927.32 ng/m3 (BbF) at RamsisSquare, and from 38.29 ng/m3 (ACY) to 880.22 ng/m3 (BbF) at Sphinx Square. Based on ring number, the concentrations of particle-bound PAH categories in the study areas during the study period are shown in Figure 3. From this figure, it can be noticed that particle-bound PAHs with five aromatic rings were the most abundant, followed by those with four and six aromatic rings, those with three aromatic rings, and those with two aromatic rings in the different study areas. The concentrations were 1915, 1791, and 1676 ng/m3 for five aromatic rings, 1637, 1466, and 1311 ng/m3 for four aromatic rings, 1551, 1477, and 1413 ng/m3 for six aromatic rings, 547, 435, and 344 ng/m3 for three aromatic rings, and 86, 65, and 44 ng/m3 for two aromatic rings at the El Giza, Ramsis, and Sphinx Square, respectively. In addition, the concentrations of the Σ PAH 15 compounds in the study areas are presented in Figure 4. This figure shows the highest total particle-bound PAH compounds were found at El Giza Square, whereas the lowest concentration was observed inthe Sphinx Square area. The concentrations of the Σ PAH 15 compounds were 5735, 5234, and 4787 ng/m3 at El Giza, Ramsis, and Sphinx Square, respectively. Since traffic emissions are the main sources of particle-bound PAH compounds in the square areas, the relative differences in concentrations of particle-bound PAH compounds at both El Giza and Ramsis Squares and Sphinx Square may be due to the relative differences in traffic emissions, which are due to the differences in traffic density. This is in agreement with previous investigators, who found that vehicle traffic is the major source of PAH compounds in the atmosphere [6,39,40,41], and gasoline exhaust particles are considered the main source of atmospheric PAH compounds [40,42,43].
In the present study, the average concentration of total particle-bound PAH compounds at El Giza (5735 ng/m3), Ramsis (5234 ng/m3), and Sphinx (4787 ng/m3) and all the study square areas (5252 ng/m3) was higher than that found in Cairo City Center (Cairo, Egypt) (3402.8 ng/m3) and in Faysal (Giza) (1904.2 ng/m3) by Hassan [34], in Dokki (Giza) (1429.74 ng/m3) by Hassan and Khoder [6], in Taiyuan city (1504.7 ng/m3) by Peng et al. [44], in New Delhi (India) (891 ng/m3) by Sharma et al. [45], and in Jeddah (Saudi Arabia) (4.97 ng/m3) by Alghamdi et al. [46]. These results clearly indicate the levels of particle-bound PAHs in the square areas of Greater Cairo are higher than those found in many different locations in Egypt and around the world.

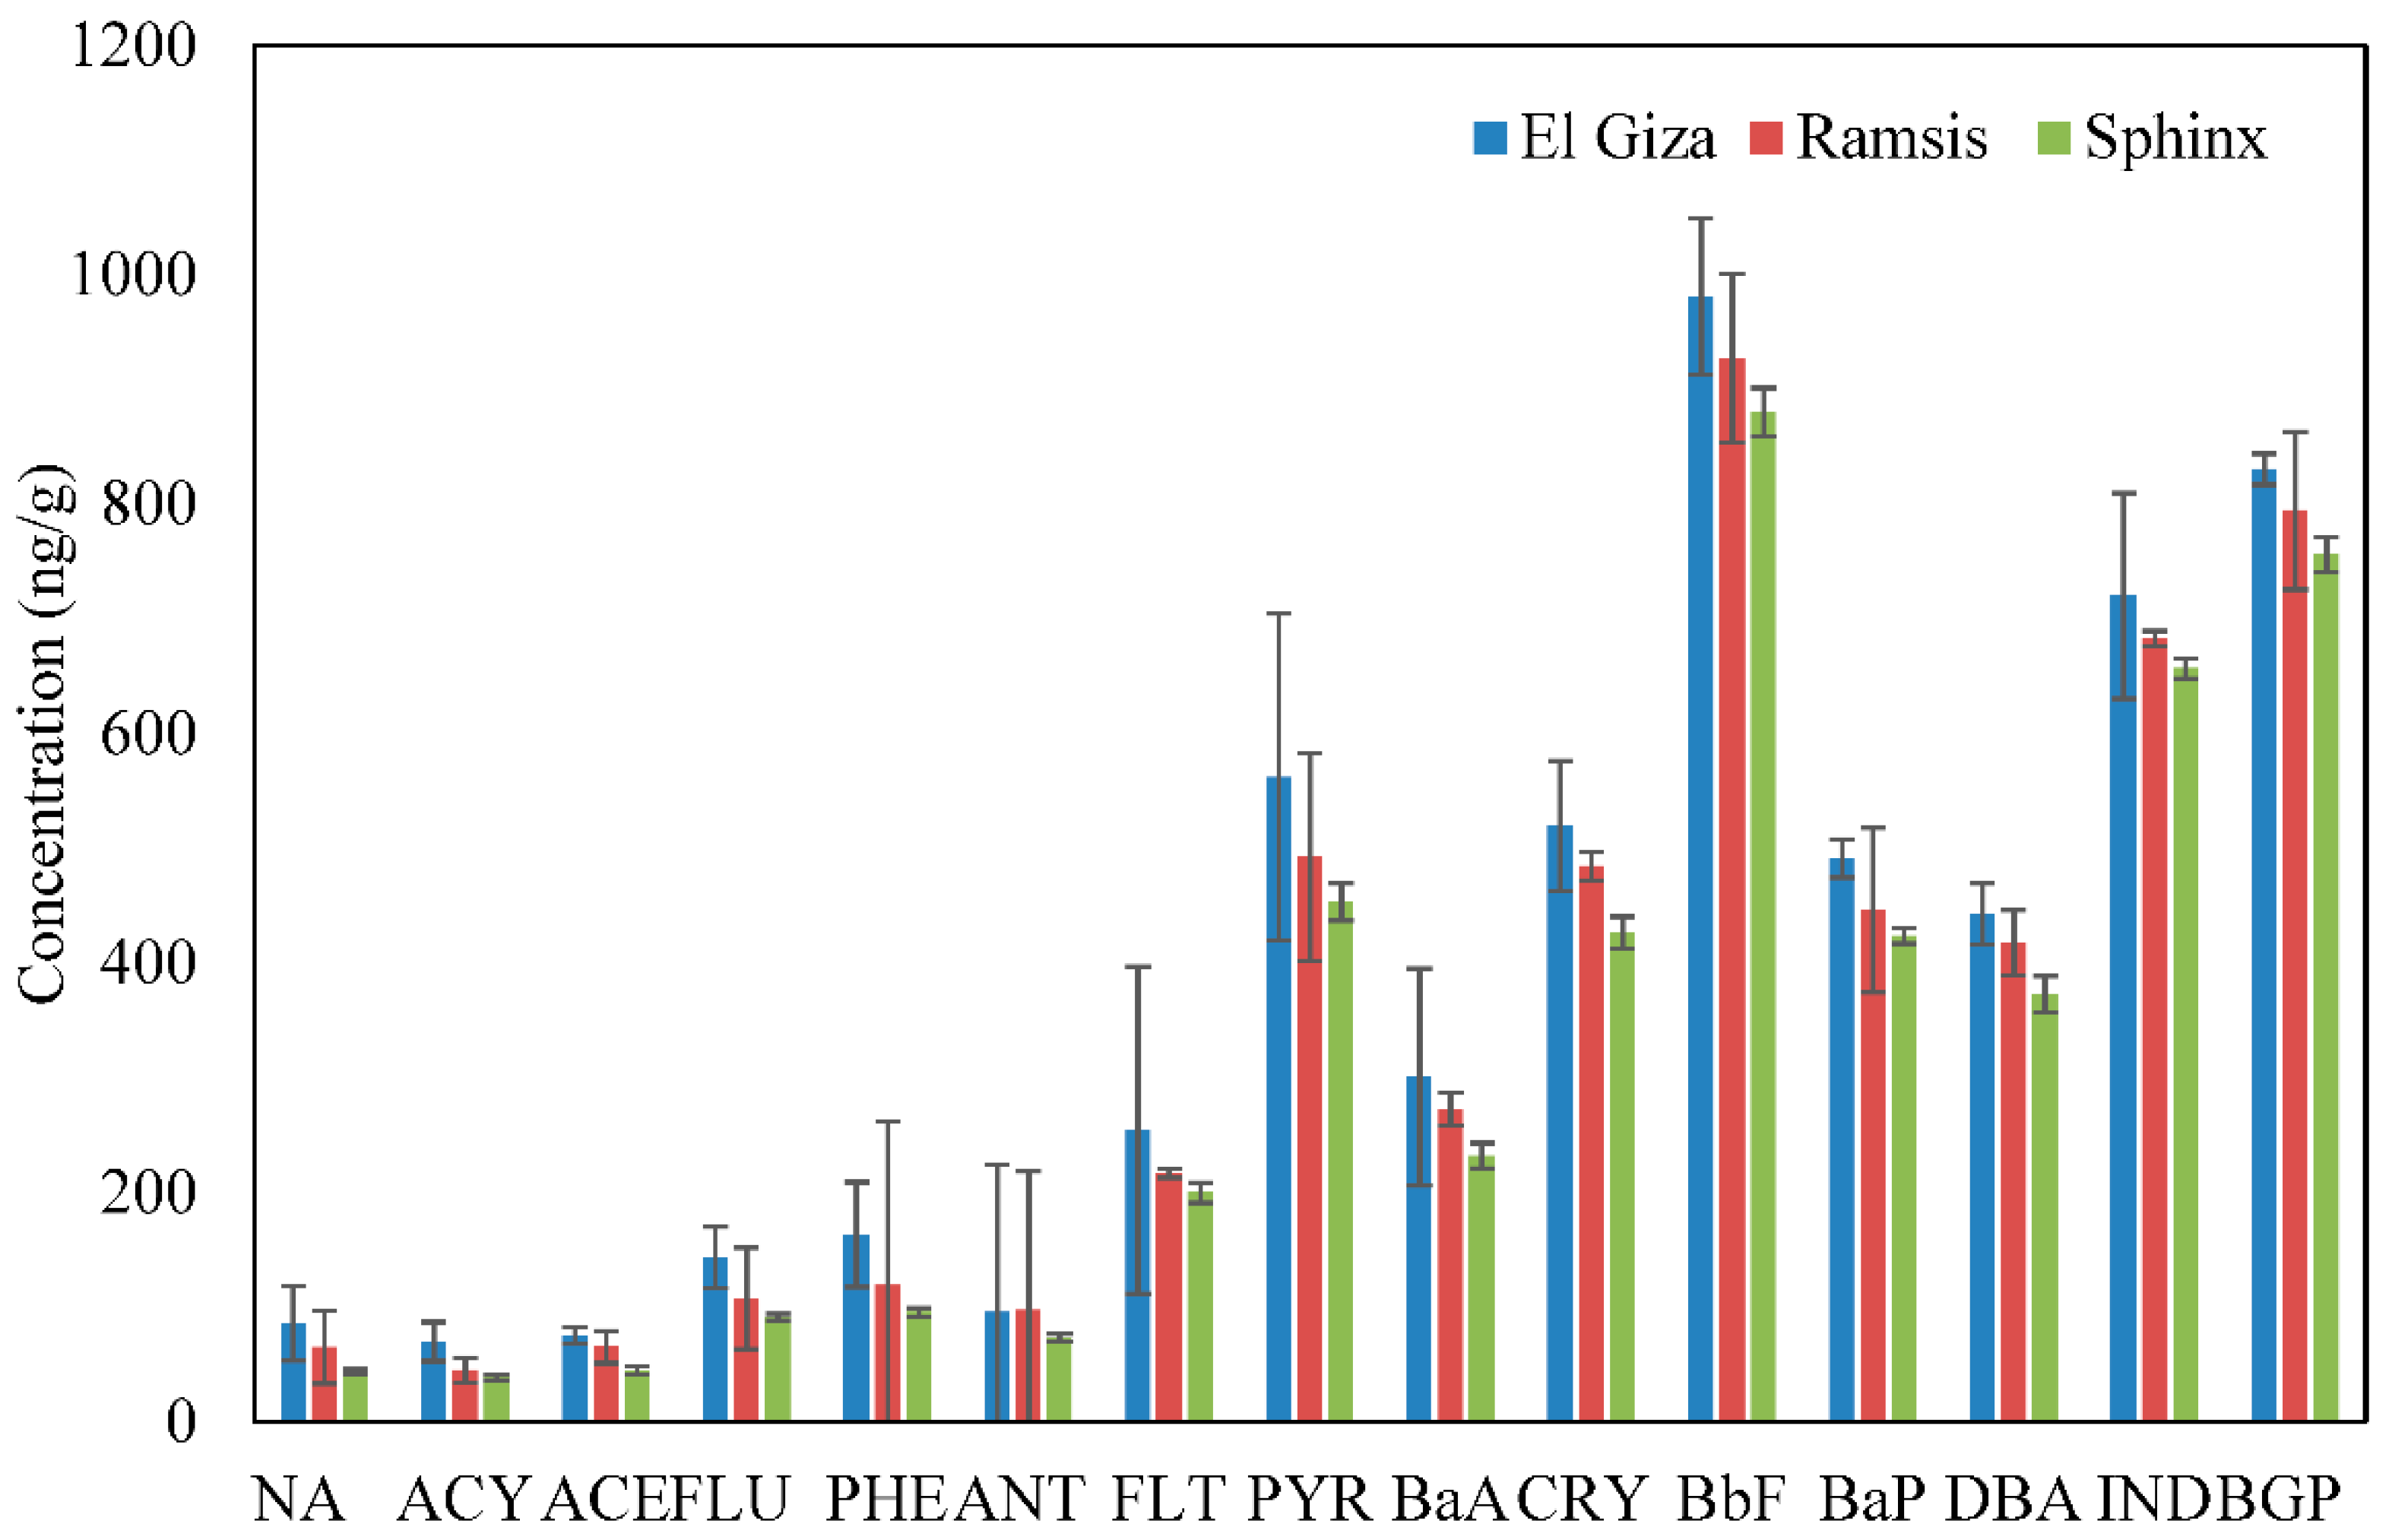
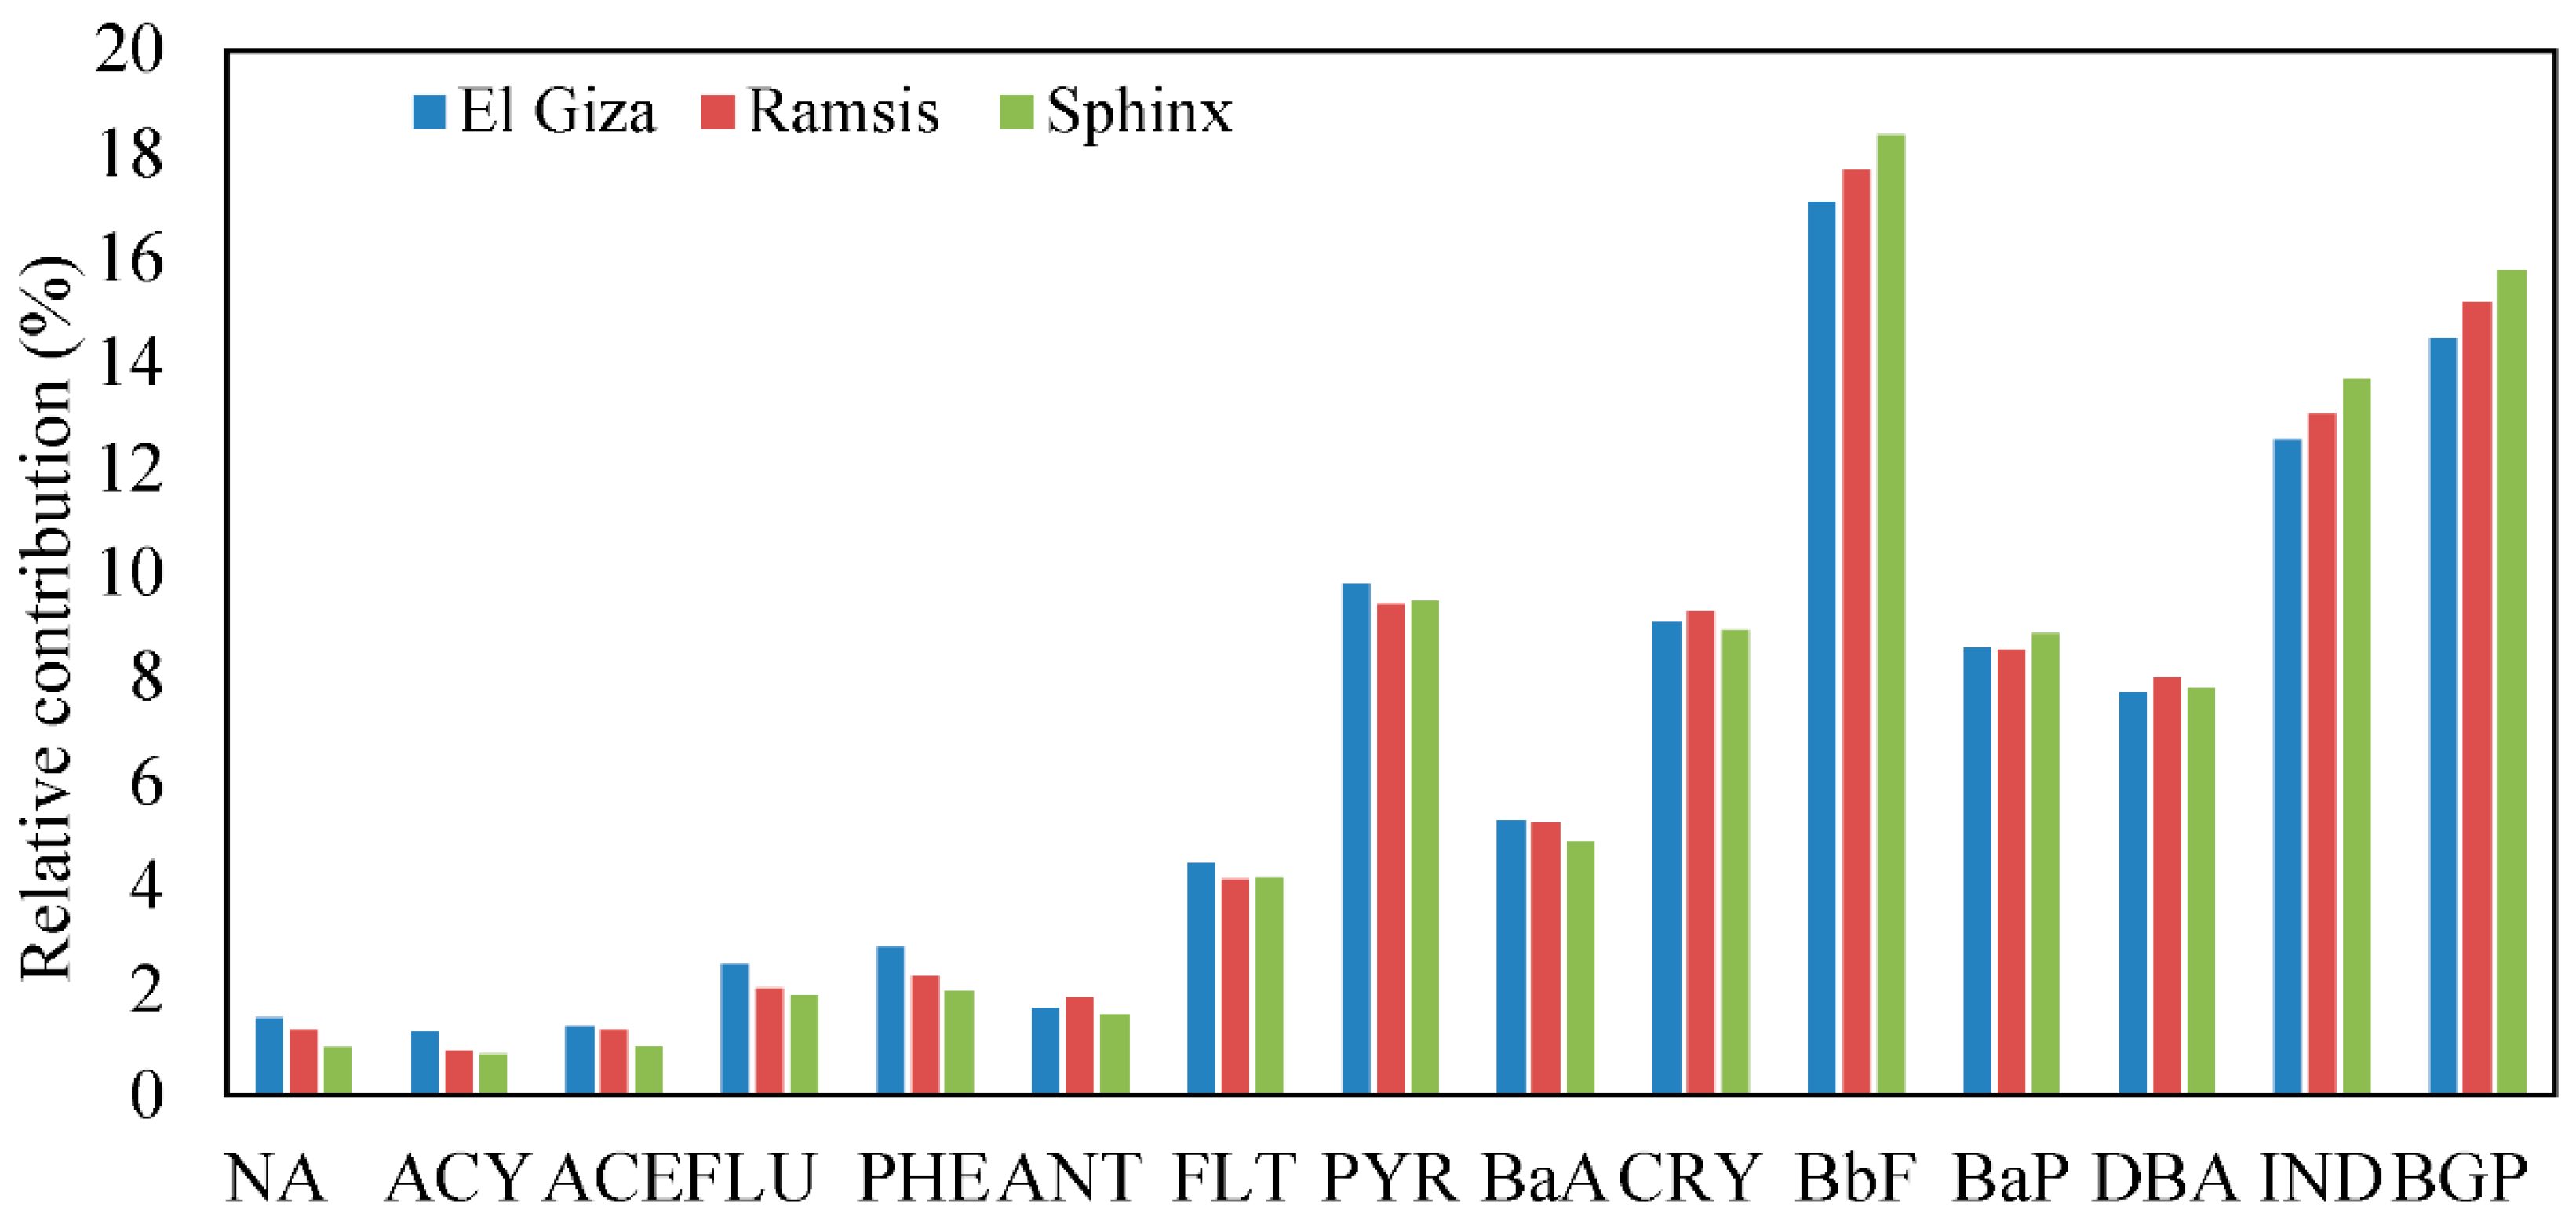
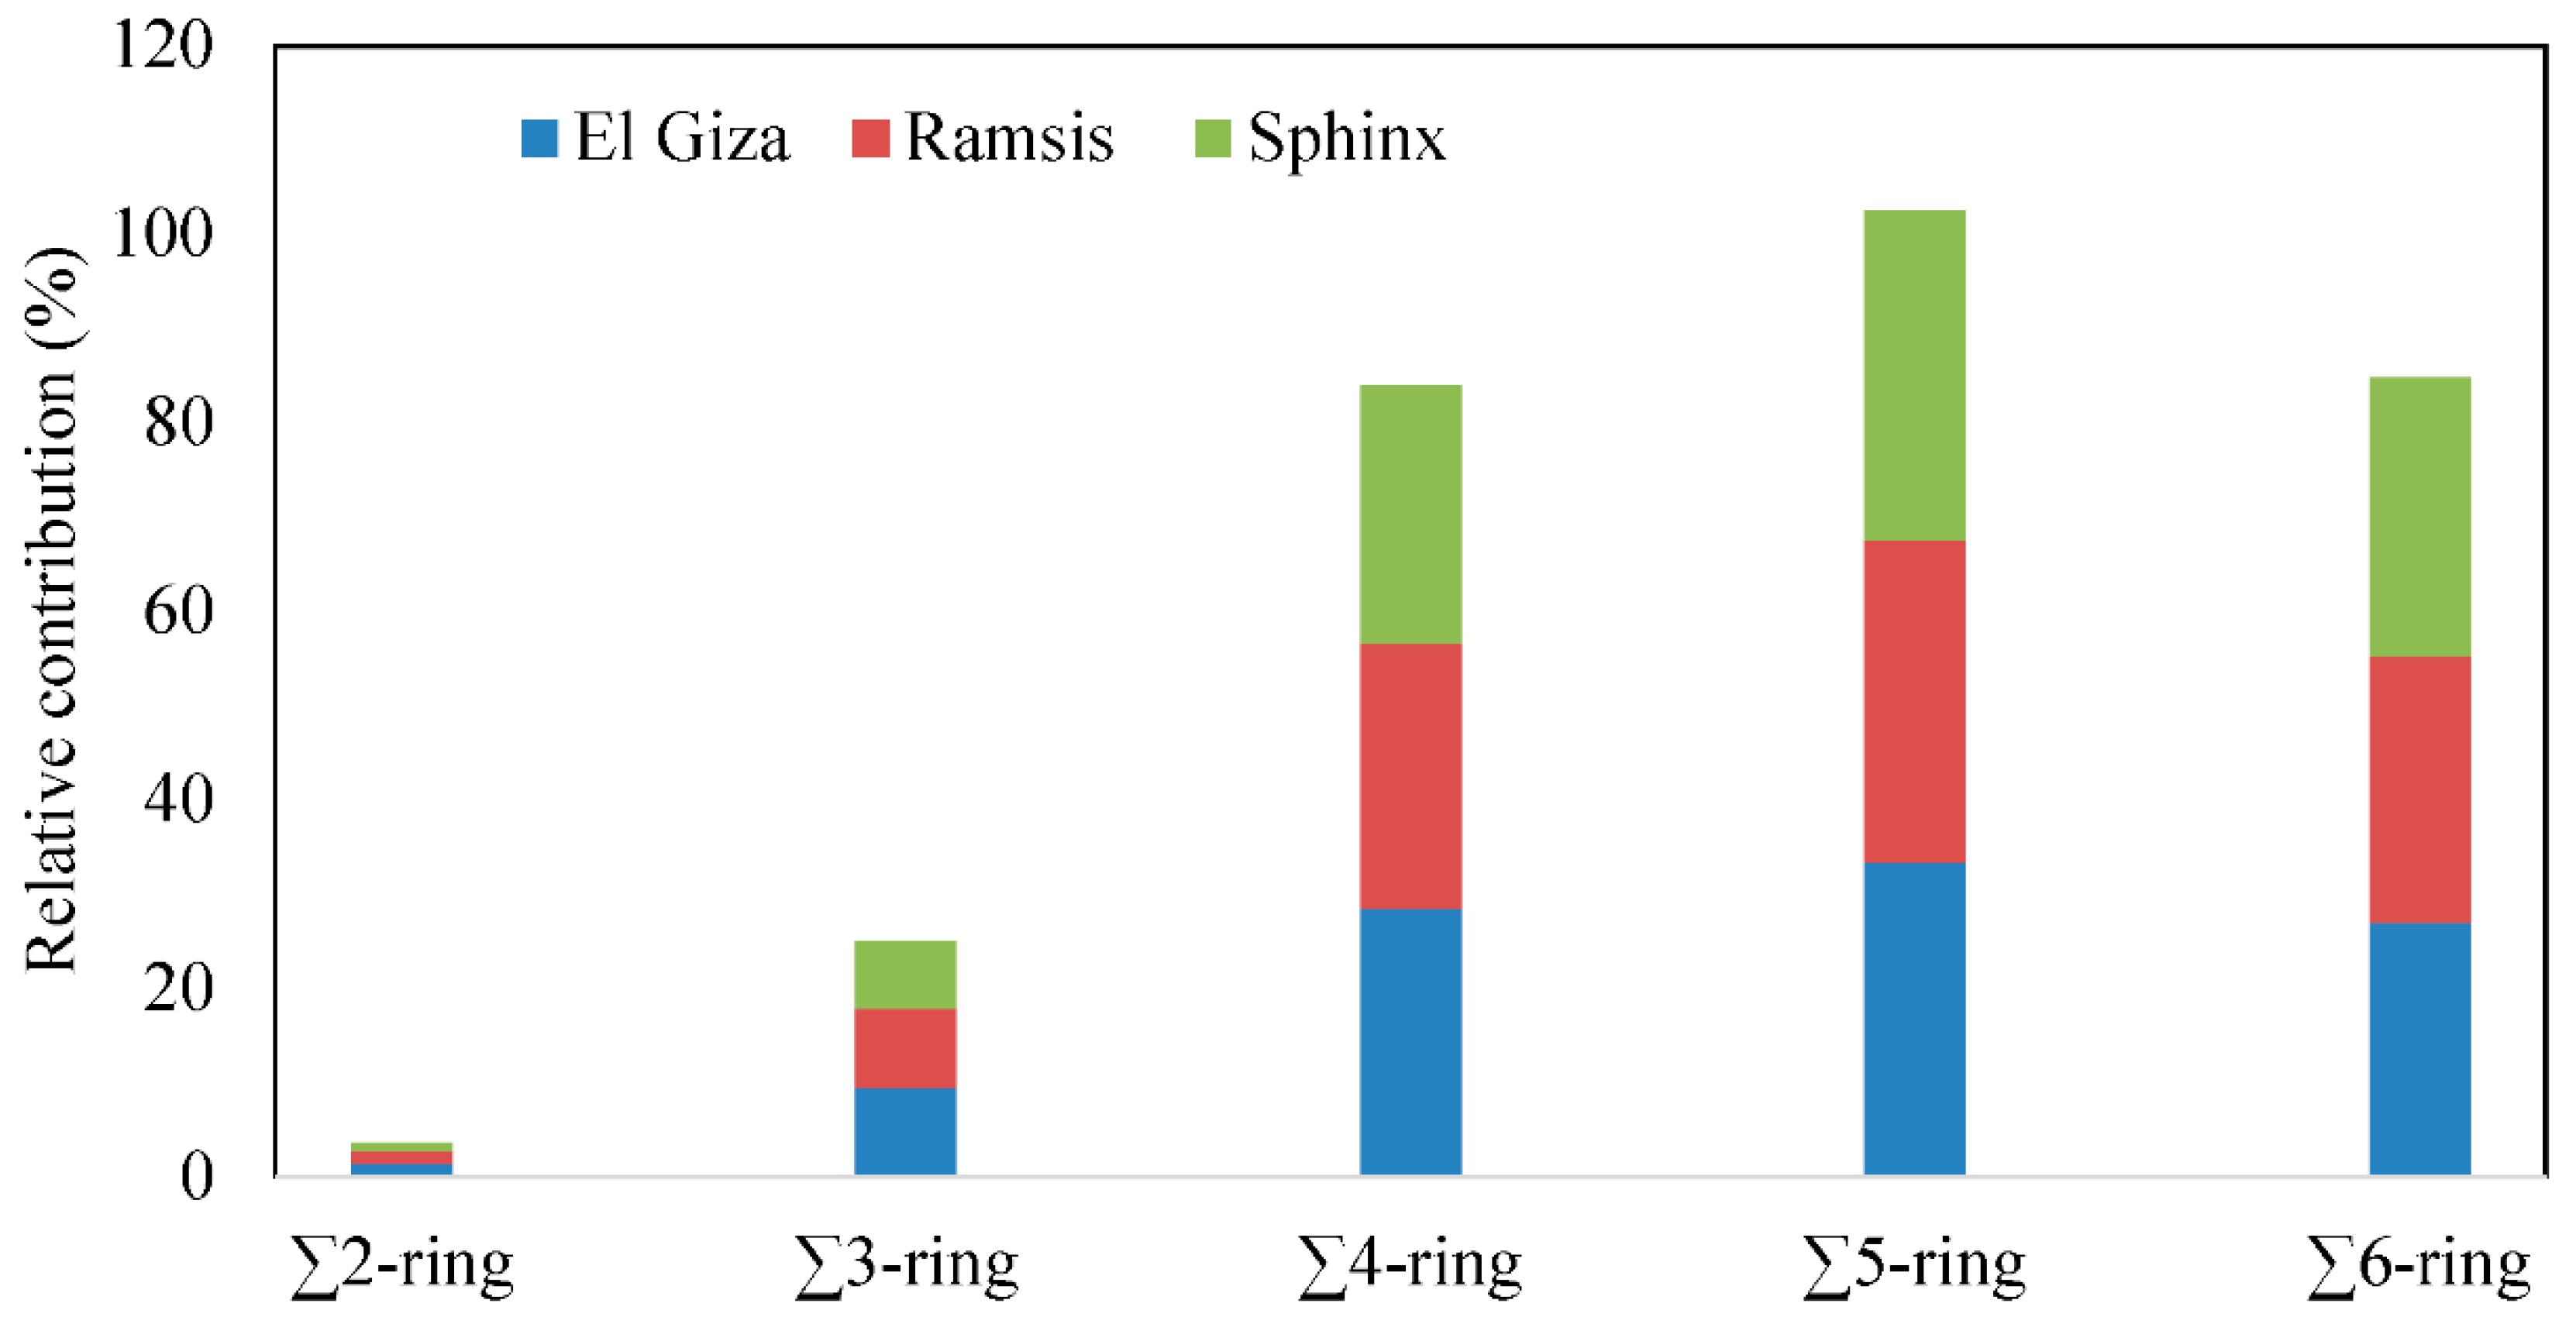
3.2. Distribution of PAH Compounds

The relative contribution of the individual particle-bound PAH compounds to the total particle-bound PAH concentrations in the three square areas during the period of this study are presented graphically in Figure 5. This figure shows that the contribution of the individual particle-bound PAH compounds generally increased with increasing molecular weight in all square areas. The similarity in the distribution of individual PAH compounds in thethree square areas indicates similar emission sources of PAHs in these areas; traffic emissions are the common denominator.The most abundant particle-bound PAHs were BBF, BGP, and IND, whereas NA, ACY, and ACE were least abundant in the three square areas. The distribution of PAH categories based on ring number indicates that the particle-bound PAHs with four to six aromatic rings (89% at El Giza, 90% at Ramsis, and 92% at Sphinx) were predominant (Figure 6). This is in agreement with previous investigators, who found that the distribution of particle-bound PAH compounds depends on molecular weight [47,48]. Fon et al. [49] and Kishida et al. [50] reported that those with four to six PAH rings were the predominant particle-bound PAHs. PAHs with higher molecular weight are minimally volatile and attached to the particulate state, while PAHs with lower molecular weight are often found in a gaseous state [51,52]. In the present study, the predominance of heavy molecular weight PAH compounds in particulate matter in the three square areas indicates that a significant fraction of particle-bound PAHs are emitted from traffic due to the incomplete combustion of fuel [30,43,53,54,55,56,57].

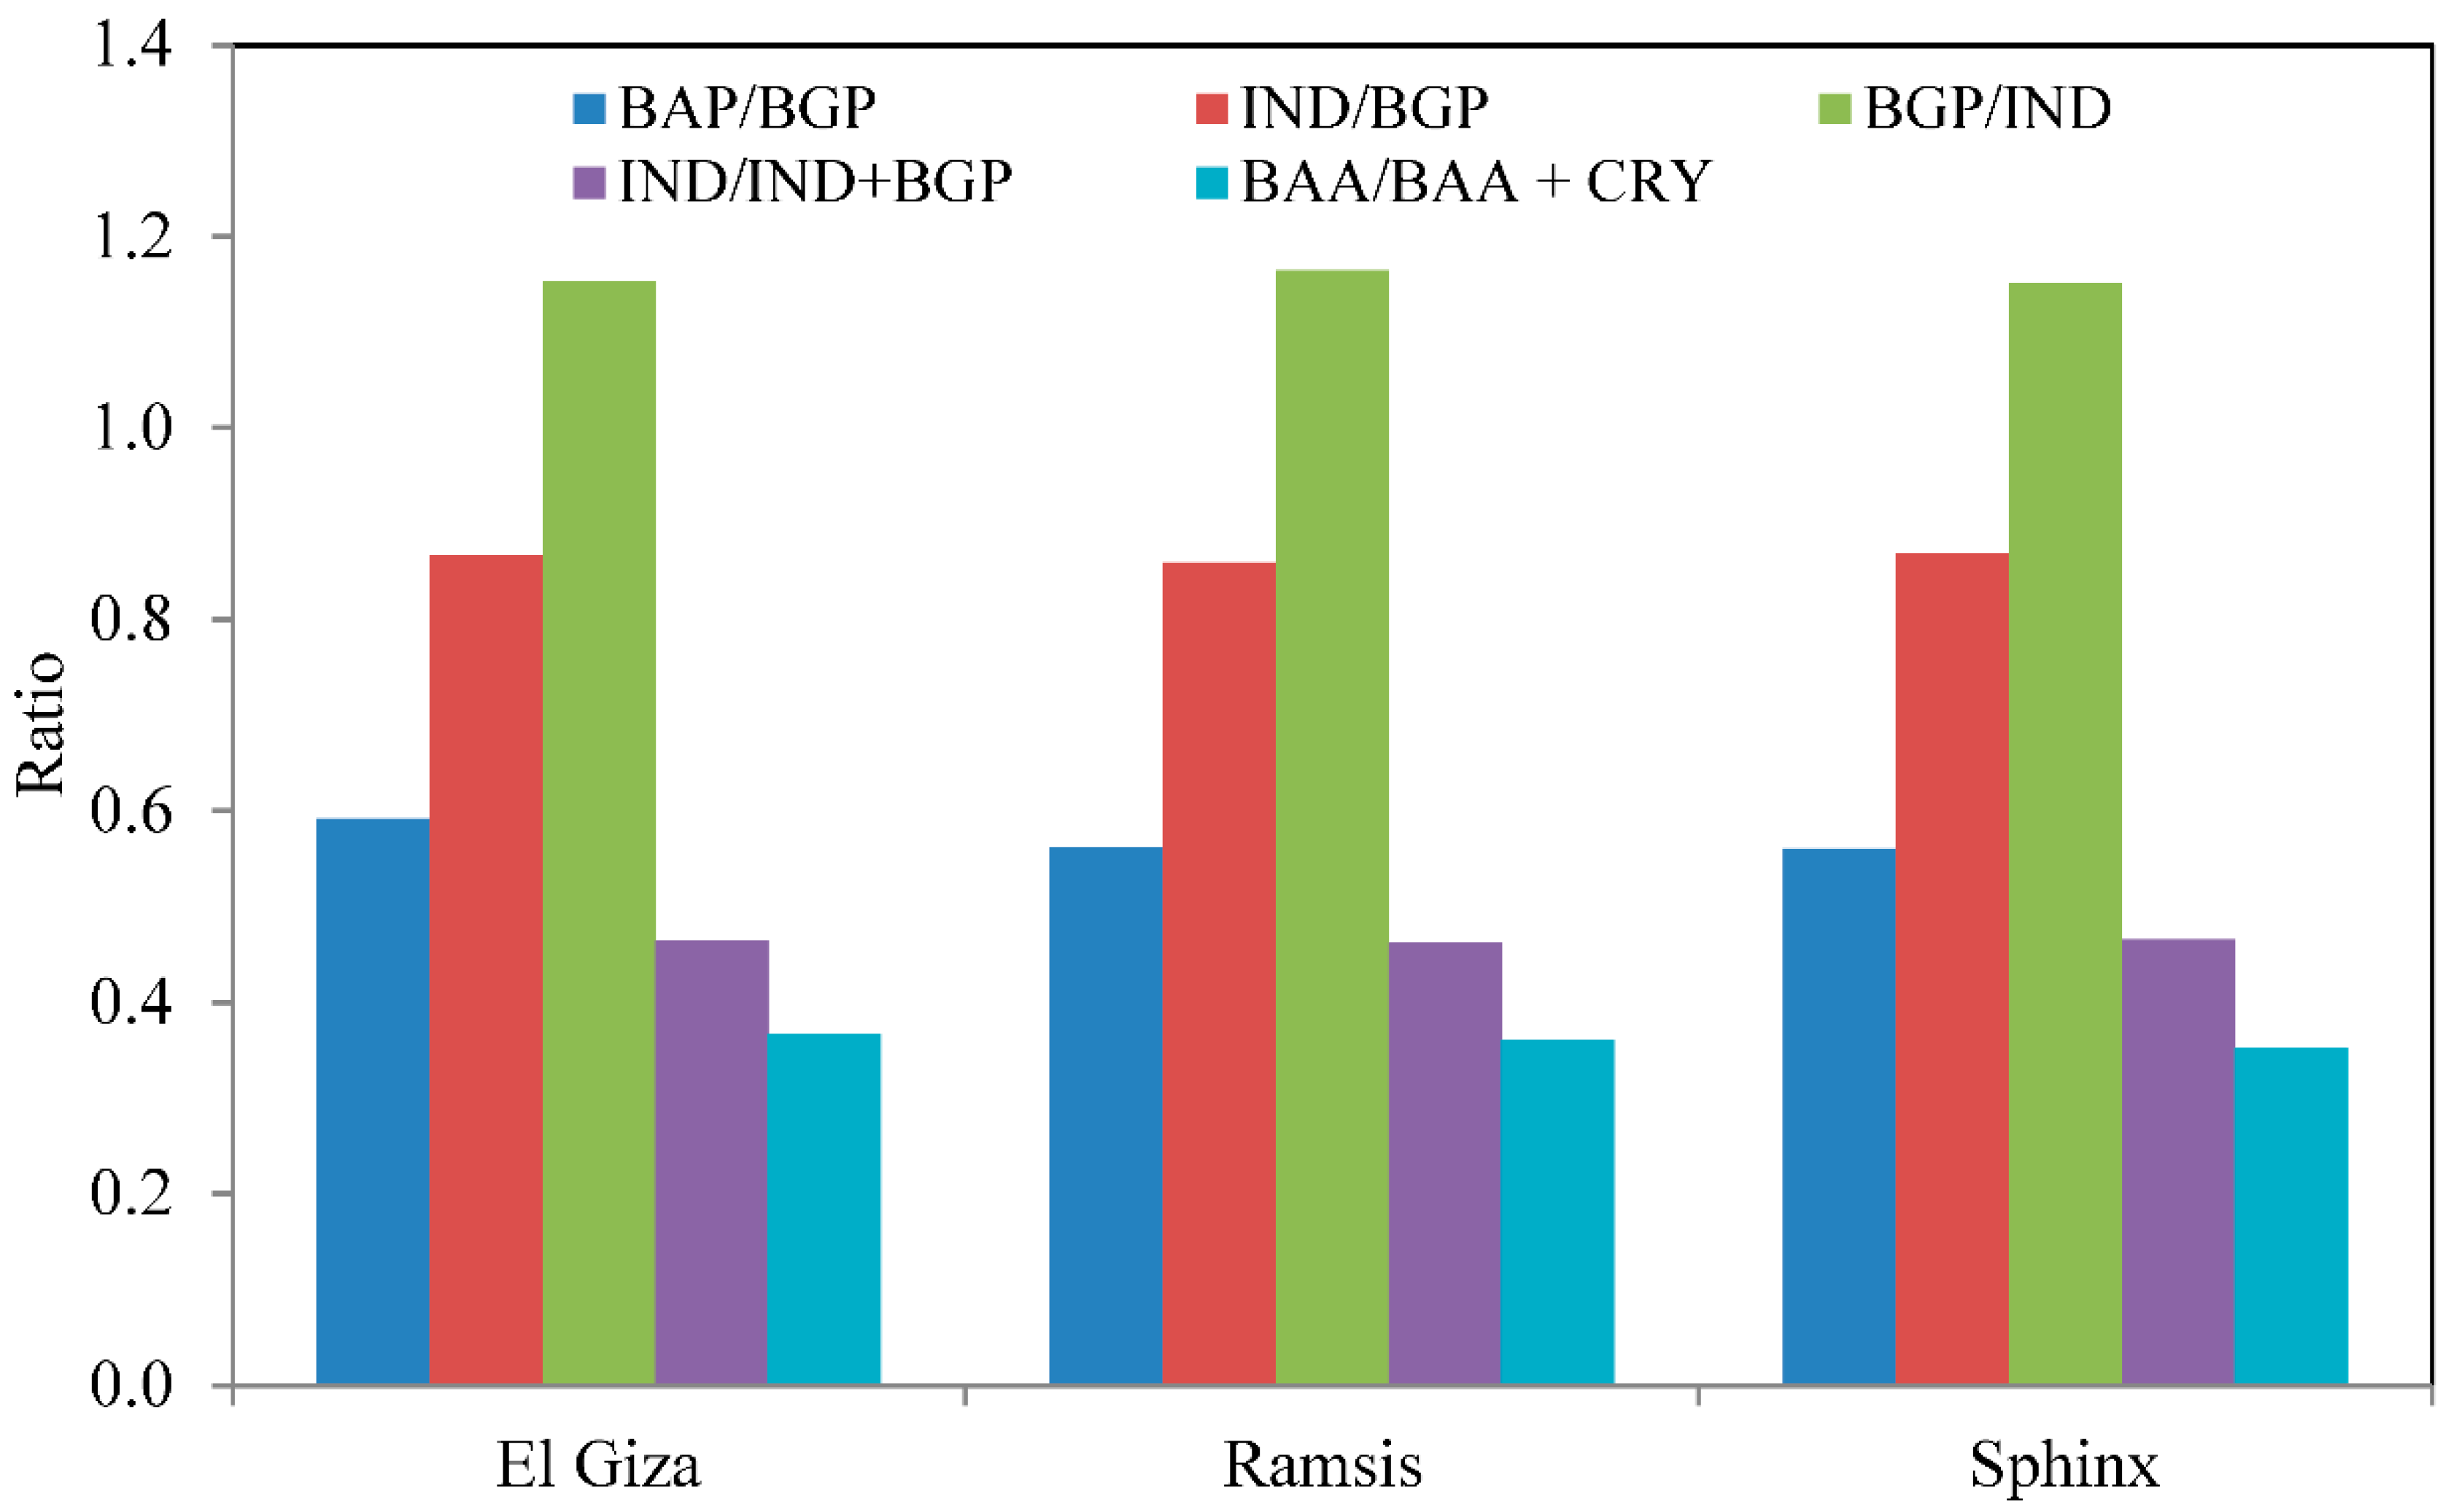
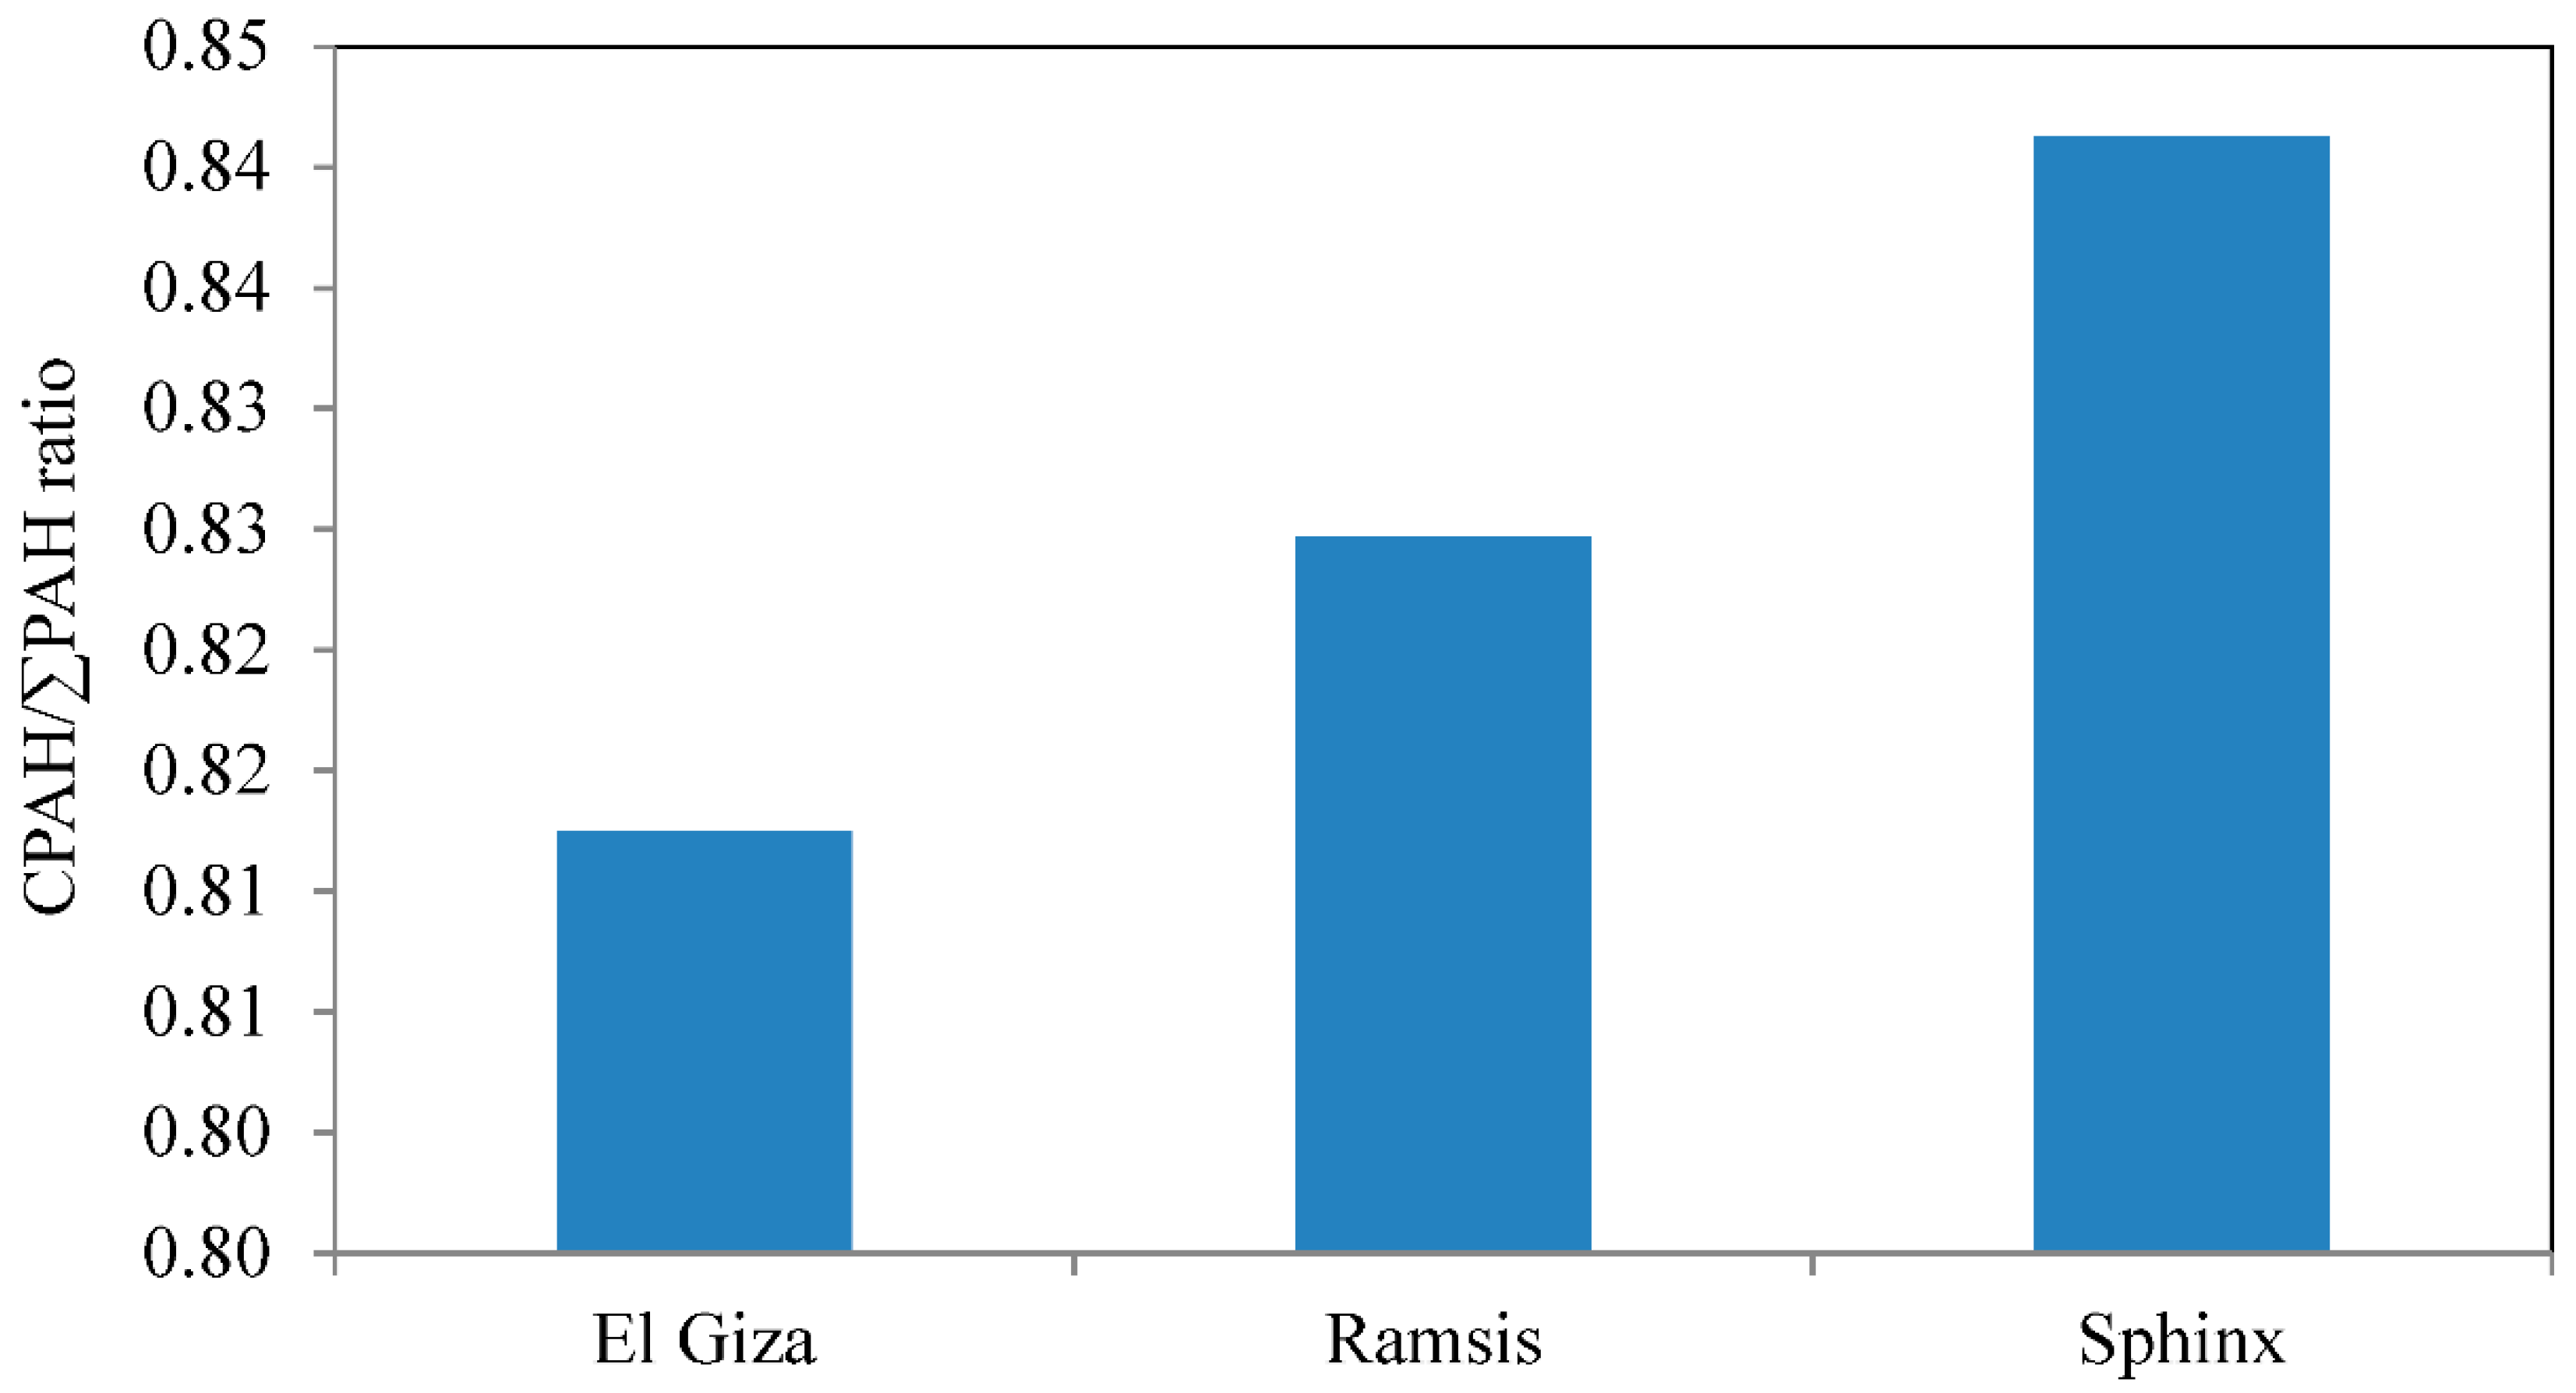
3.3. Source Identification and Evaluation of Diagnostic Ratios

To identify and distinguish the possible sources of atmospheric PAHs, the concentration ratios of the individual particle-bound PAHs as diagnostic tools are used [58,59]. For example, PHE/ANT, ANT/(ANT + PHE), FLT/PYR, FLT/(FLT + PYR), BaP/BGP, BaA/CRY, and IND/BGP are the most commonly used ratios. Lohmann et al. [60] and Ding et al. [61] used the ratio of a more reactive PAH to less reactive PAH to give information about the source identification, photochemical degradation of PAHs, and the aging of the air mass. For example, BaA/CRYconcentration ratio is used as an indicator of aging air masses; aging of atmospheric particulate matter. Lohmann et al. [60] stated that a value of the concentration ratio of BaA/CRY which is higher than 0.40 indicates that the pollution is freshly emitted and photochemical processing of the air mass is relatively lower, while a value of the concentration ratio which is lower than 0.40 indicates that the major sources of particle-bound PAH compounds are not local, or the air masses are aged. The diagnostic concentration ratios of selected particle-bound PAH compounds in the three square areas are presented graphically in Figure 7. The mean concentration ratios of BaA/CRY were 0.58 at El Giza, 0.56 at Ramsis, and 0.54 at Sphinx Square, indicating freshly emitted particle-bound PAH compounds from local emission sources, or that the air masses were not aged. Both BaA/CRY and BaP/BGP concentration ratios are used to identify the sources of PAH emission. The value of the BaA/CRY concentration ratio for vehicle emissions is 0.53 [62]. Moreover, the value of the BaP/BGP concentration ratio which is higher than 0.60 indicates the presence of traffic emissions [63]. The mean values of both BaA/CRY and BaP/BGP concentration ratios were 0.58 and 0.59 at El Giza, 0.0.56 and 0.56 at Ramsis, and 0.54 and 0.56 at Sphenix, respectively (Figure 7). These ratios suggest that vehicular exhaust emissions are the main sources of atmospheric PAHs. Both the values of IND/BGP and BaA/CRY concentration ratios are also used to identify the traffic sources. The concentration ratio of IND/BGP is about 0.40 for gasoline engines, while the ratio approaches 1.00 for diesel engine [64]. The value of BaA/CRY concentration ratios for gasoline engines ranged from 0.28 to 1.20, while the value ranged from 0.17 to 0.36 for diesel engines [51,59]. In the present study, the average IND/BGP and BaA/CRY concentration ratios were 0.0.87 and 0.58 at El Giza, 0.86 and 0.56 at Ramsis, and 0.87 and 0.54 at Sphinx, respectively, indicating contribution of gasoline and diesel vehicles [65]. Both PHE/ANT and FLT/PYR concentration ratios are used to differentiate between the emissions of PAHs from petrogenic versus pyrogenic sources. Baumard et al. [66] reported that a PHE/ANT concentration ratio <10 and a FLT/PYR concentration ratio >1.00 suggest that PAH compounds were emitted from a pyrogenic source, whereas a PHE/ANT ratio >15.00 and an FLT/PYR concentration ratio <1.00 indicate petrogenic origins of PAH compounds. In the present study, the average PHE/ANT and FLT/PYR concentration ratios were 1.70 and 0.45 at El Giza, 1.23 and 0.44 at Ramsis, and 1.30 and 0.44 at Sphinx, respectively (Figure 7). These results indicate that PAH compounds in the three square areas were emitted from both petrogenic and pyrogenic sources. Moreover, the value of the ANT/(ANT + PHE) concentration ratio is used to assess the presence of PAHs from fossil fuels inputs [67], an ANT/(ANT + PHE) ratio <0.1 indicates non-burned fossil fuel inputs, whereas the combustion sources may prevail if the ratio >0.1. The average ANT/(ANT + PHE) concentration ratios in the present study were 0.37 at El Giza, 0.45 at Ramsis, and 0.43 at Sphinx, suggesting combustion-related emission sources.
To distinguish the possible emissions of PAHs from stationary versus mobile combustion sources, the concentration ratio of the total concentrations of eight combustion-related non-alkylated PAH compounds (CPAHs = FLT, PYR, BaA, CRY, BbF, BaP, IND, and BGP) to the total concentration PAH compounds (CPAHs/∑PAHs) is used as a characteristic diagnostic parameter. Rogge et al. [68] concluded that the value of a CPAHs/∑PAHs concentration ratio would be less than one for particle-bound PAH compounds from mobile sources. The average CPAH/∑PAH concentration ratios in the three investigated square areas are presented graphically in Figure 8. From this figure, the average CPAHs/∑PAHs concentration ratios were 0.81 at El Giza, 0.83 at Ramsis, and 0.84 at Sphinx Square. This result indicates that the mobile sources are the principal particle-bound PAH compound contributor to the square area atmosphere of Greater Cairo.

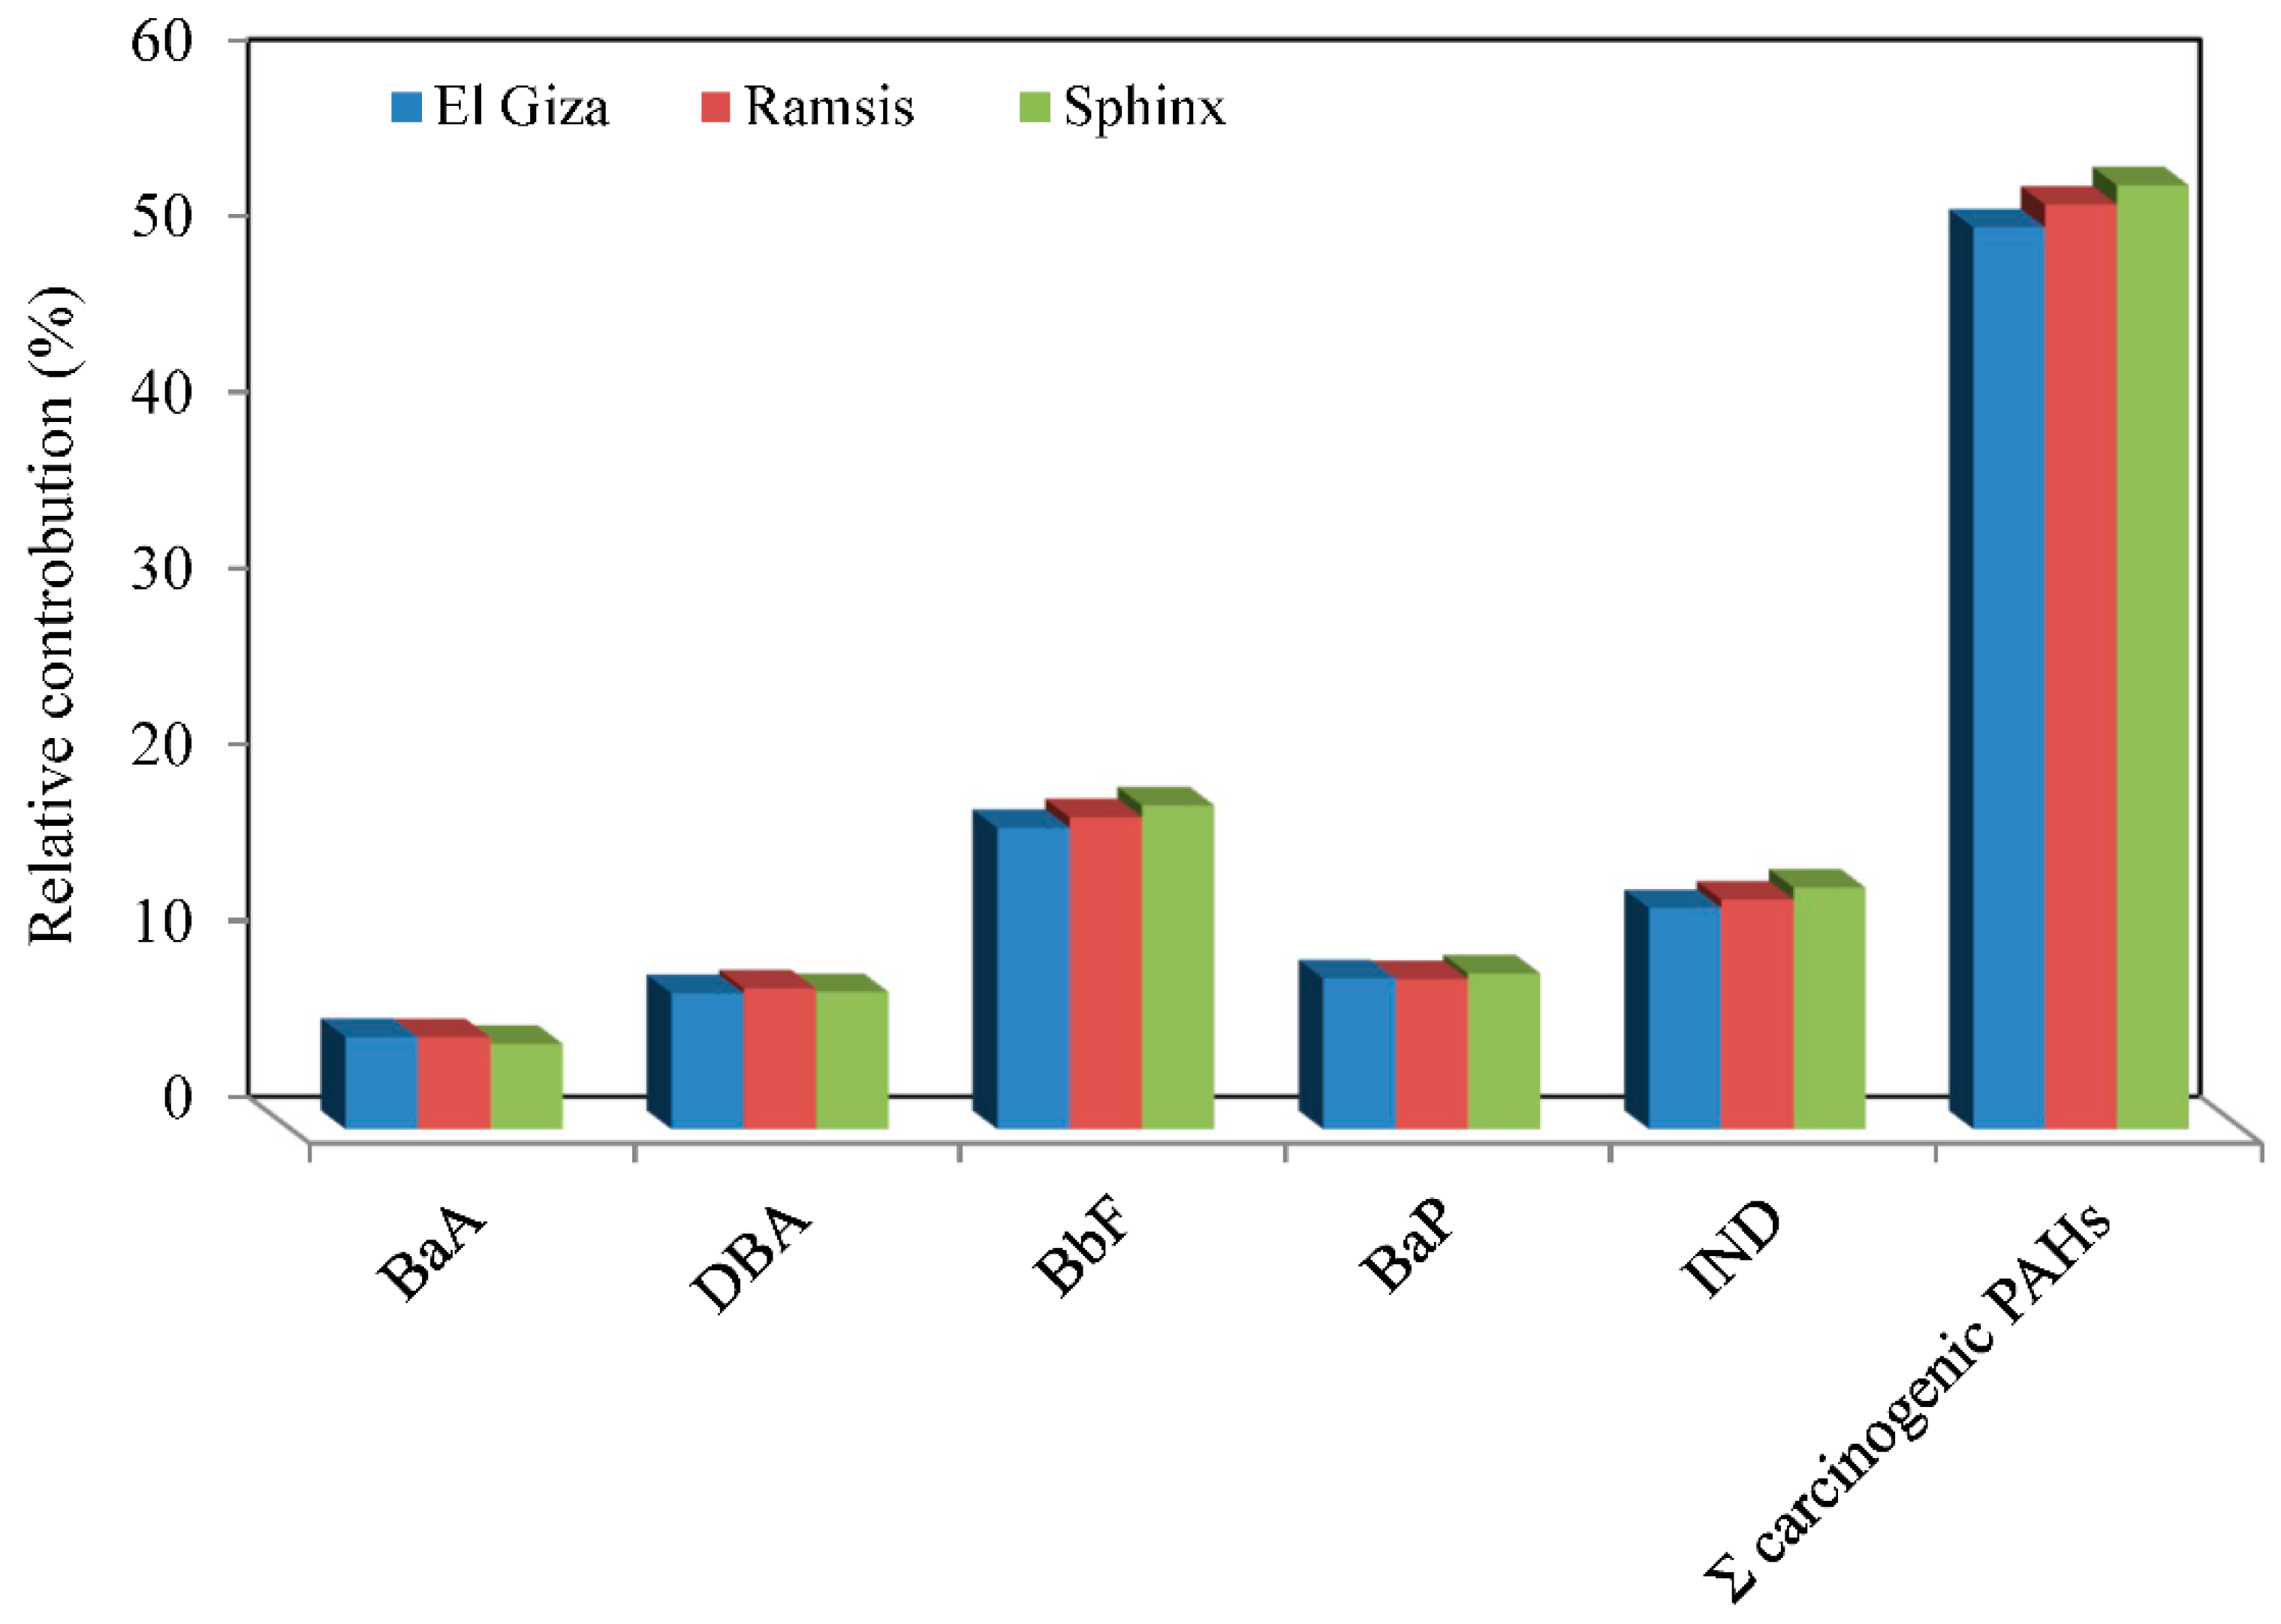
3.4. Health Risk Assessment of Particle-Bound PAH Compounds in the Square Areas

USEPA [69] reported the probable carcinogenic PAHs, including BaA, BbF, BaP, DBA, and IND. The relative contribution of the concentrations of the individual and total carcinogenic PAH compounds (BaA, BbF, BaP, DBA, and IND) to the total concentrations of PAH compounds in the three square areas are presented graphically in Figure 9. This figure shows that the contribution of the concentrations of individual carcinogenic PAH compounds (BaA, BbF, BaP, DBA, and IND) to the total concentrations of PAH compounds were 5.24%, 5.21%, and 4.84% for BaA, 7.72%, 7.99%, and 7.78% for DBA, 17.10%, 17.72%, and 18.38% for BbF, 8.56%, 8.52%, and 8.84% for BaP, 12.56%, 13.04%, and 13.72% for IND at El Giza, Ramsis, and Sphinx Square, respectively. Moreover, the percentages of the total concentrations of carcinogenic PAH compounds (BaA, BbF, BaP, DBA, and IND) to the total concentrations of PAH compounds were 51.18% at El Giza, 52.47% at Ramsis, and 53.57% at Sphinx Square.
Wang et al. [70] and IARC [13,71] reported that BaP has been regarded as one of the most important PAHs because of its potent carcinogenic properties. Moreover, BaP is considered a sufficient index for the carcinogenicity of the whole PAHs [72]. This compound has been widely used as an indicator of air quality, marker for total PAH exposure, and for overall PAH carcinogenicity [71,73,74]. About 88% of BaP in the ambient of British cities was estimated to come from road traffic [58]. Thus, BaP is usually used as a key indicator to evaluate the health risk assessment of PAHs in the atmosphere of urban areas. In the present study, the mean levels of BaP were 491.2 ng/m3, 445.9 ng/m3, and 423.4 ng/m3 at El Giza, Ramsis, and Sphinx Square, respectively. However, there is no Egyptian standard for BaP or any other PAH compounds; BaP concentrations in the present study highly exceed the Italian guided levels for BaP (1.00 ng/m3) [75] and the recommended level (0.25 ng/m3) in Britain [76].
Toxic Equivalent Factors (TEFs) for individual particle-bond PAH compounds are used as a way of comparing the carcinogenicity of the individual PAHs to the carcinogenicity of BaP [77]. These TEFs are used to calculate the health risk associated with the inhalation of carcinogenic PAHs. Based on the value of the concentrations of benzo[a]pyrene equivalent (BaPeq), the cancer potency for each individual PAHs was evaluated. For PAH compounds, the concentrations of BaPeq were calculated by multiplying the concentration of individual PAHs by its corresponding TEF value [36,78]. Table 1 shows the BaPeq concentrations for particle-bound PAH compounds in the three square areas. The concentrations of BaPeq for the individual particle-bound PAHs ranged from 0.07 ng/m3 for ACY to 491.2 ng/m3 for BaP at El Giza, 0.05 ng/m3 for ACY to 445.9 ng/m3 for BaP at Ramsis, and 0.04 ng/m3 for NA, ACy, and ACE to 423.4 ng/m3 for BaP at Sphinx Square. The total carcinogenic activity (TCA) for the total measured PAH compounds was 1149.8, 1067.1, and 986.5 ng/m3 at El Giza, Ramsis, and Sphinx Square, respectively. The relative contribution of the carcinogenic activity for BaP, BbF, BaP, DBA, and IND to the total carcinogenic activity (TCA) for the total measured PAH compounds was calculated (Table 1). From this table, it is clear that BaP and DBA were the most dominant compounds; these accounted for 42.72% and 38.50% (El Giza), 41.79% and 39.17% (Ramsis), and 42.92% and 37.78% (Sphinx) of the TCA of all PAH compounds, respectively. Although the results indicate the importance of BaP and DBA as surrogate compounds for PAHs in the atmosphere of square areas of Greater Cairo, other BaA, BbF, and IND compounds also play a role in the TCA.

4. Conclusions

The atmospheric concentrations of particle-bound PAH compounds in total suspended particulate samples collected during the period of December 2015–February 2016 in three main square areas (El Giza, Ramsis, and Sphinx) of Greater Cairo were measured, while their levels, their distribution profiles, their possible sources, and the health risks associated with the inhalation of particle-bound PAH compounds were characterized. The results of the analysis showed that the average concentrations of total particle-bound PAHs were 5735 ng/m3, 5234 ng/m3, and 4787 ng/m3 at El Giza, Ramsis, and Sphinx Square, respectively. The level concentrations of the total PAH compounds were much higher than those found in some areas in Egypt and in the world. Among the measured particle-bound PAH compounds, the most dominant compounds were BbF, BGP, CRY, DBA, and BaP. Particle-bound PAHs with four to six aromatic rings were the dominant PAHs, with a relative contribution of 89% at El Giza, 90% at Ramsis, and 92% at Sphinx. Diagnostic concentration ratios of PAH compounds indicate that PAHs in the atmosphere of main square areas in Greater Cairo are emitted from both petrogenic and pyrogenic sources, originating mainly from local vehicular exhaust emissions. Based on BaPeq concentrations of the individual particle-bound PAH compounds, BaP and DBA are considered surrogate compounds for PAHs in the atmosphere of the three square areas. The highest total carcinogenic activity (TCA) for the total measured PAH compounds was found at El Giza Square, whereas the lowest TCA was detected at Sphinx Square.

Funding

The National Research Centre, Cairo, Egypt, funded this work.

Conflicts of Interest

The author has no actual or potential conflict of interest including any financial, personal or other relationships with other people or organizations within three years of beginning the submitted work that could inappropriately influence, or be perceived to influence his work.

References

  1. Vardar, N.; Esen, F.; Tasdemir, Y. Seasonal concentrations and partitioning of PAHs in a suburban site of Bursa, Turkey. Environ. Pollut. 2008, 155, 298–307. [Google Scholar] [CrossRef] [PubMed]
  2. Esen, F.; Tasdemir, Y.; Vardar, N. Atmospheric concentrations of PAHs, their possible sources and gas to- particle partitioning at a residential site of Bursa, Turkey. Atmos. Res. 2008, 88, 243–255. [Google Scholar] [CrossRef]
  3. Zhang, Y.; Tao, S. Global atmospheric emission inventory of polycyclic aromatic hydrocarbons (PAHs) for 2004. Atmos. Environ. 2009, 43, 812–819. [Google Scholar] [CrossRef]
  4. Kamal, A.; Cincinelli, A.; Martellini, T.; Malik, R.N. A review of PAH exposure from the combustion of biomass fuel and their less surveyed effect on the blood parameters. Environ. Sci. Pollut. Res. Int. 2015, 22, 4076–4098. [Google Scholar] [CrossRef] [PubMed]
  5. IARC (International Agency for Research on Cancer). Outdoor Air Pollution a Leading Environmental Cause of Deaths Accessed in Dec 2015. 2013. Available online: http://www.iarc.fr/en/media-centre/iarcnews/pdf/pr221_E.pdf (accessed on 11 September 2018).
  6. Hassan, S.K.; Khoder, M.I. Gas-particle concentration, distribution, and health risk assessment of polycyclic aromatic hydrocarbons at a traffic area of Giza, Egypt. Environ. Monit. Assess. 2012, 184, 3593–3612. [Google Scholar] [CrossRef] [PubMed]
  7. El-Mekawy, A.M.; Mohammed, A.M.F.; Hassan, S.K.M. A review of airborne polycyclic aromatic hydrocarbons (PAHs) in Egypt. Egypt. J. Environ. Res. (EJER) 2016, 5, 53–76. [Google Scholar]
  8. USEPA (U.S. Environmental Protection Agency). Toxicological Review of Benzene (NONCANCER EFFECTS), CAS No. 71-43-2. In Support of Summary Informationon on the Integrated Risk Information System (IRIS); USEPA: Washington, DC, USA, October 2002. [Google Scholar]
  9. Kameda, Y.; Shirai, J.; Komai, T.; Nakanishi, J.; Masunaga, S. Atmospheric polycyclic aromatic hydrocarbons: Size distribution, estimation of their risk and their depositions to human respiratory tract. Sci. Total Environ. 2005, 340, 71–80. [Google Scholar] [CrossRef] [PubMed]
  10. Xue, W.L.; Warshawsky, D. Metabolic activation of polycyclic and heterocyclic aromatic hydrocarbons and DNA damage: A review. Toxicol. Appl. Pharmacol. 2005, 206, 73–93. [Google Scholar] [CrossRef] [PubMed]
  11. USEPA (U.S. Environmental Protection Agency). Documentation for the Final 2002 Mobile National Emissions Inventory; version 3; USEPA: Washington, DC, USA, 2007.
  12. Hassanien, M.A.; Abdel-Latif, N.M. Polycyclic aromatic hydrocarbons in road dust over Greater Cairo, Egypt. J. Hazard. Mater. 2008, 151, 247–254. [Google Scholar] [CrossRef] [PubMed]
  13. IARC (International Agency for Research on Cancer). A review of human carcinogens—Part F. Chemical agents and related occupations. Lancet Oncol. 2009, 10, 1143–1144. [Google Scholar] [CrossRef]
  14. Hassanien, M.A. Polycyclic aromatic hydrocarbons and carcinogenic risk assessment in developing countries. In Polycyclic Hydrocarbons: Pollution, Health Effects and Chemistry; Editors: Haines, P.A., Hendrickson, M.D., Eds.; Nova Science Publishers, Inc.: New York, NY, USA, 2009. [Google Scholar]
  15. Park, J.S.; Wada, T.L.; Sweet, S. Atmospheric distribution of polycyclic aromatic hydrocarbons and deposition to Galveston Bay, Texas, USA. Atmos. Environ. 2001, 35, 3241–3249. [Google Scholar] [CrossRef]
  16. Wang, D.G.; Yang, M.; Jia, H.L.; Zhou, L.; Li, Y.F. Polycyclic aromatic hydrocarbons in urban street dust and surface soil: Comparisons of concentration, profile, and source. Arch. Environ. Contam. Toxicol. 2009, 56, 173–180. [Google Scholar] [CrossRef] [PubMed]
  17. Kong, S.; Lu, B.; Ji, Y.; Bai, Z.; Xu, Y.; Liu, Y.; Jiang, H. Distribution and sources of polycyclic aromatic hydrocarbons in size-differentiated re-suspended dust on building surfaces in an oilfield city, China. Atmos. Environ. 2012, 55, 7–16. [Google Scholar] [CrossRef]
  18. Abdel-Shafy, H.I.; Mansour, M.S.M. A review on polycyclic aromatic hydrocarbons: Source, environmental impact, effect on human health and remediation. Egypt. J. Pet. 2016, 25, 107–123. [Google Scholar] [CrossRef]
  19. Kim, E.J.; Oh, J.E.; Chang, Y.S. Effects of forest fire on the level and distribution of PCDD/Fs and PAHs in soil. Sci. Total Environ. 2003, 311, 177–189. [Google Scholar] [CrossRef]
  20. El-Mubarak, A.H.; Rushdi, A.I.; Al-Mutlaq, K.F.; Bazeyad, A.Y.; Simonich, S.L.M.; Simoneit, B.R.T. Identification and source apportionment of polycyclic aromatic hydrocarbons in ambient air particulate matter of Riyadh, Saudi Arabia. Environ. Sci. Pollut. Res. Int. 2014, 21, 558–567. [Google Scholar] [CrossRef] [PubMed]
  21. Boonyatumanond, R.; Murakami, M.; Wattayakorn, G.; Togo, A.; Takada, H. Sources of polycyclic aromatic hydrocarbons (PAHs) in street dust in a tropical Asian mega-city, Bangkok, Thailand. Sci. Total Environ. 2007, 384, 420–432. [Google Scholar] [CrossRef] [PubMed]
  22. Khalili, N.R.; Scheff, P.A.; Holsen, T.M. PAH source fingerprints for coke ovens, diesel and gasoline engines, highway tunnels, and wood combustion emissions. Atmos. Environ. 1995, 29, 533–542. [Google Scholar] [CrossRef]
  23. Binet, S.; Pfohl-Leszkowicz, A.; Brandt, H.; Lafontaine, M.; Castegnaro, M. Bitumen fumes: Review of work on the potential risk to workers and the present knowledge on its origin. Sci. Total Environ. 2002, 300, 37–49. [Google Scholar] [CrossRef]
  24. Dyke, P.H.; Foan, C.; Fiedler, H. PCB and PAH releases from power stations and waste incineration processes in the UK. Chemosphere 2003, 50, 469–480. [Google Scholar] [CrossRef]
  25. Zielinska, B.; Sagebiel, J.; Arnott, W.P.; Rogers, C.F.; Kelly, K.E.; Wagner, D.A.; Lighty, J.S.; Sarofi, A.F.; Palmer, G. Phase and size distribution of polycyclic aromatic hydrocarbons in diesel and gasoline vehicle emissions. Environ. Sci. Technol. 2004, 38, 2557–2567. [Google Scholar] [CrossRef] [PubMed]
  26. Miguel, A.H.; Kirchstetter, T.W.; Harley, R.A.; Hering, S. On-road emissions of particulate polycyclic aromatic hydrocarbons and black carbon from gasoline and diesel vehicles. Environ. Sci. Technol. 1998, 32, 450–455. [Google Scholar] [CrossRef]
  27. Kakimoto, H.; Matsumoto, Y.; Sakai, S.; Kanoh, F.; Arashidani, K.; Tang, N. Comparison of atmospheric polycyclic aromatic hydrocarbons and nitropolycyclic aromatic hydrocarbons in an industrialized city (Kitakyushu) and two commercial cities (Sapporo and Tokyo). J. Health Sci. 2002, 48, 370–375. [Google Scholar] [CrossRef]
  28. Koyano, M.; Mineki, S.; Tsunoda, Y.; Endo, O.; Goto, S.; Ishii, T. Suspended particulate matter in indoor air. J. Health Sci. 2001, 47, 452–459. [Google Scholar] [CrossRef]
  29. Kume, K.; Ohura, T.; Noda, T.; Amagai, T.; Fusaya, M. Seasonal and spatial trends of suspended-particle associated polycyclic aromatic hydrocarbons in urban Shizuoka, Japan. J. Hazard. Mater. 2007, 144, 513–521. [Google Scholar] [CrossRef] [PubMed]
  30. Franco, C.F.J.; de Resends, M.F.; de Furtado, A.L.; Brasil, T.F.; Eberlin, M.N.; Netto, A.D.P. Polycyclic aromatic hydrocarbons (PAHs) in street dust of Rio de Janeiro and Niterói, Brazil: Particle size distribution, sources and cancer risk assessment. Sci. Total Environ. 2017, 599–600, 305–313. [Google Scholar] [CrossRef] [PubMed]
  31. Pereira Netto, A.D.; Krauss, T.M.; Cunha, I.F.; Rego, E.C.P. Polycyclic aromatic hydrocarbons levels in street dust in the central area of Niterói City, RJ, Brazil. Water Air Soil Pollut. 2006, 176, 57–67. [Google Scholar] [CrossRef]
  32. Pandey, S.K.; Kim, K.; Brown, R.J.C. A review of techniques for the determination of polycyclic aromatic hydrocarbons in air. Trends Anal. Chem. 2011, 30, 1716–1739. [Google Scholar] [CrossRef]
  33. Kim, K.H.; Jahan, S.A.; Kabir, E.; Brown, R.J.C. A review of airborne polycyclic aromatic hydrocarbons (PAHs) and their human health effects. Environ. Int. 2013, 60, 71–80. [Google Scholar] [CrossRef] [PubMed]
  34. Hassan, S.K. Atmospheric Polycyclic Aromatic Hydrocarbons and Some Heavy Metals in Suspended Particulate Matter in Urban, Industrial and Residential Areas in Greater Cairo. Ph.D. Thesis, Cairo University, Cairo, Egypt, 2006. [Google Scholar]
  35. Hassan, S.K. Sources and cancer risk of heavyca metals in total suspended particulate in some square areas of Greater Cairo, Egypt. Indian J. Environ. Prot. 2018. accepted. [Google Scholar]
  36. Fang, G.C.; Wu, Y.S.; Chen, M.H.; Ho, T.T.; Huang, S.H.; Rau, J.Y. Polycyclic aromatic hydrocarbons study in Taichung, Taiwan, during 2002–2003. Atmos. Environ. 2004, 38, 3385–3391. [Google Scholar] [CrossRef]
  37. Lee, J.Y.; Kim, Y.P.; Kang, C.H.; Ghim, Y.S.; Kaneyasu, N. Temporal trend and long-range transport of particulate polycyclic aromatic hydrocarbons at Gosan in northeast Asia between 2001 and 2004. J. Geophys. Res. 2006, 111, 1029. [Google Scholar] [CrossRef]
  38. Lee, J.Y.; Kim, Y.P.; Kang, C.H. Characteristics of the ambient particulate PAHs at Seoul, a mega city of Northeast Asia in comparison with the characteristics of a background site. Atmos. Res. 2011, 99, 50–56. [Google Scholar] [CrossRef]
  39. Khillare, P.S.; Balachandran, S.; Hoque, R.R. Profile of PAHs in the diesel vehicle exhaust in Delhi. Environ. Monit. Assess. 2005, 105, 411–417. [Google Scholar] [CrossRef] [PubMed]
  40. Gunawardena, A.; Egodawatta, P.; Godwin, A.A.; Goonetilleke, A. Role of traffic in atmospheric accumulation of heavy metals and polycyclic aromatic hydrocarbons. Atmos. Environ. 2012, 54, 502–510. [Google Scholar] [CrossRef] [Green Version]
  41. Bian, Q.; Alharbi, B.; Collett, J., Jr.; Kreidenweis, S.; Pasha, M.J. Measurements and source apportionment of particle-associated polycyclic aromatic hydrocarbons in ambient air in Riyadh, Saudi Arabia. Atmos. Environ. 2016, 137, 186–198. [Google Scholar] [CrossRef]
  42. Zheng, M.; Fang, M. Particle-associated polycyclic aromatic hydrocarbons in the atmosphere of Hong Kong. Water Air Soil Pollut. 2000, 117, 175–189. [Google Scholar] [CrossRef]
  43. Cvetkovi, A.; Jovasevic-Stojanovic, M.; Markovic, Z.; Ristovski, D. Concentration and source identification of polycyclic aromatic hydrocarbons in the metropolitan area of Belgrade, Serbia. Atmos. Environ. 2015, 112, 335–343. [Google Scholar] [CrossRef]
  44. Peng, L.; Zeng, F.G.; Chen, M. Distribution characteristics and source analysis of n-alkanes (C14-C31) and PAHs in total suspended particulates in urban area of Taiyuan city. Rock Miner. Anal. 2003, 22, 206–210. [Google Scholar]
  45. Sharma, H.; Jain, V.K.; Khan, Z.H. Characterization and source identification of polycyclic aromatic hydrocarbons (PAHs) in the urban environment of Delhi. Chemosphere 2007, 66, 302–310. [Google Scholar] [CrossRef] [PubMed]
  46. Alghamdi, M.A.; Alam, M.S.; Yin, J.; Stark, C.; Jang, E.-H.; Harrison, R.M.; Shamy, M.; Khoder, M.I.; Shabbaj, I.I. Receptor modelling study of polycyclic aromatic hydrocarbons in Jeddah, Saudi Arabia. Sci. Total Environ. 2015, 506–507, 401–408. [Google Scholar] [CrossRef] [PubMed]
  47. Odabasi, M.; Vardar, N.; Sofuoglu, A.; Tasdemir, Y.; Holsn, T.M. Polycyclic aromatic hydrocarbons (PAHs) in Chicago air. Sci. Total Environ. 1999, 27, 57–67. [Google Scholar] [CrossRef]
  48. Cincinelli, A.; Del Bubba, M.; Martellini, T.; Gambaro, A.; Lepri, L. Gas-particle concentration and distribution of n-alkanes and polycyclic aromatic hydrocarbons in the atmosphere of Prato (Italy). Chemosphere 2007, 68, 472–478. [Google Scholar] [CrossRef] [PubMed]
  49. Fon, T.Y.W.; Noriatsu, O.; Hiroshi, S. Polycyclic aromatic hydrocarbons (PAHs) in the aerosol of higashi hiroshima, Japan: Pollution scenario and source identification. Water Air Soil Pollut. 2007, 182, 235–243. [Google Scholar] [CrossRef]
  50. Kishida, M.; Imamura, K.; Takenaka, N.; Maeda, Y.; Viet, P.H.; Bandow, H. Concentrations of atmospheric polycyclic aromatic hydrocarbons in particulate matter and the gaseous phase at roadside sites in Hanoi, Vietnam. Bull. Environ. Contam. Toxicol. 2008, 81, 174–179. [Google Scholar] [CrossRef] [PubMed]
  51. Fang, G.C.; Chang, C.N.; Wu, Y.S.; Fu, P.P.C.; Yang, I.L.; Chen, M.H. Characterization, identification of ambient air and road dust polycyclic aromatic hydrocarbons in central Taiwan, Taichung. Sci. Total Environ. 2004, 327, 135–146. [Google Scholar] [CrossRef] [PubMed]
  52. Hanedar, A.; Alp, K.; Kaynak, B.; Baek, J.; Avsar, E.; Odman, M.T. Concentrations and sources of PAHs at three stations in Istanbul, Turkey. Atmos. Res. 2011, 99, 391–399. [Google Scholar] [CrossRef]
  53. Mastral, A.M.; Lopez, J.M.; Callen, M.S.; Garcia, T.; Murillo, R.; Navarro, V. Spatial and temporal PAH concentrations in Zaragoza, Spain. Sci. Total Environ. 2003, 307, 111–124. [Google Scholar] [CrossRef]
  54. Ohura, T.; Amagai, T.; Fusaya, M.; Matsushita, H. Spatial distributions and profiles of atmospheric polycyclic aromatic hydrocarbon in two industrial cities in Japan. Environ. Sci. Technol. 2004, 38, 49–55. [Google Scholar] [CrossRef] [PubMed]
  55. Rehwagen, M.; Müller, A.; Massolo, L.; Herbarth, O.; Ronco, A. Polycyclic aromatic hydrocarbons associated with particles in ambient air from urban and industrial areas. Sci. Total Environ. 2005, 348, 199–210. [Google Scholar] [CrossRef] [PubMed]
  56. Lammel, G.; Novak, J.; Landlov, A.L.; Dvorsk, A.A.; Klanova, J.; Cupr, P.; Kohoutek, J.; Reimer, E.; Skrdlíkova, L. Sources and distributions of polycyclic aromatic hydrocarbons and toxicity of polluted atmosphere aerosols. In Urban Airborne Particulate Matter: Origins, Chemistry, Fate and Health Impacts; Zereini, F., Wiseman, C.L.S., Eds.; Springer: Berlin, Germany, 2010; pp. 39–62. [Google Scholar]
  57. Hoshiko, T.; Yamamoto, K.; Nakajima, F.; Prueksasit, T. Time-series analysis of polycyclic aromatic hydrocarbons and vehicle exhaust in roadside air environment in Bangkok, Thailand. Procedia Environ. Sci. 2011, 4, 87–94. [Google Scholar] [CrossRef]
  58. Harrison, R.M.; Smith, D.J.T.; Luhana, L. Source apportionment of atmospheric polycyclic aromatic hydrocarbons collected from an urban location in Birmingham, U.K. Environ. Sci. Technol. 1996, 30, 825–832. [Google Scholar] [CrossRef]
  59. Bourotte, C.; Forti, M.C.; Taniguchi, S.; Caruso, M.; Lotufo, P.A. A wintertime study of PAHs in fine and coarse aerosols in Sao Paulo City, Brazil. Atmos. Environ. 2005, 39, 3799–3811. [Google Scholar] [CrossRef]
  60. Lohmann, R.; Northcott, G.L.; Jones, K.C. Assessing the contribution of diffuse domestic burning as a source of PCDD/Fs, PCBs, and PAHs to the U.K. atmosphere. Environ. Sci. Technol. 2000, 34, 2892–2899. [Google Scholar] [CrossRef]
  61. Ding, X.; Wang, X.M.; Xie, Z.Q.; Xiang, C.H.; Mai, B.X.; Sun, L.G.; Zheng, M.; Sheng, G.Y.; Fu, J.M.; Poschl, U. Atmospheric polycyclic aromatic hydrocarbons observed over the North Pacific Ocean and the Arctic area: Spatial distribution and source identification. Atmos. Environ. 2007, 47, 2061–2072. [Google Scholar] [CrossRef]
  62. Dickhut, R.M.; Canuel, E.A.; Gustafson, K.E.; Liu, K.; Arzayus, K.M.; Walker, S.E.; Edgecombe, G.; Gaylor, M.O.; Macdonald, E.H. Automotive sources of carcinogenic polycyclic aromatic hydrocarbons associated with particulate matter in the Chesapeake Bay region. Environ. Sci. Technol. 2000, 34, 4635–4640. [Google Scholar] [CrossRef]
  63. Park, S.S.; Kim, Y.J.; Kang, C.H. Atmospheric polycyclic aromatic hydrocarbons in Seoul, Korea. Atmos. Environ. 2002, 36, 2917–2924. [Google Scholar] [CrossRef]
  64. Caricchia, A.M.; Chiavarini, S.; Pessa, M. Polycyclic aromatic hydrocarbons in the urban atmospheric particulate matter in the city of Naples (Italy). Atmos. Environ. 1999, 33, 3731–3738. [Google Scholar] [CrossRef]
  65. Nassar, H.F.; Tang, N.; Kameda, T.; Toriba, A.; Khoder, M.I.; Hayakawa, K. Atmospheric concentrations of polycyclic aromatic hydrocarbons and selected nitrated derivatives in Greater Cairo, Egypt. Atmos. Environ. 2011, 45, 7352–7359. [Google Scholar] [CrossRef]
  66. Baumard, P.; Budzinski, H.; Michon, Q.; Garrigues, P.; Burgeot, T.; Bellocq, J. Origin and bioavailability of PAHs in the Mediterranean Sea from mussel and sediment. Estuar. Coast. Shelf Sci. 1998, 47, 77–90. [Google Scholar] [CrossRef]
  67. Yunker, M.B.; Macdonald, R.W.; Vingarzan, R.; Mitchell, R.H.; Goyette, D.; Sylvestre, S. PAHs in the Fraser river basin: A critical appraisal of PAH ratios as indicators of PAH sources and composition. Org. Geochem. 2002, 33, 489–515. [Google Scholar] [CrossRef]
  68. Rogge, W.F.; Hildemann, L.M.; Mazurek, M.A.; Cass, G.R. Sources of fine organic aerosol. 2. Noncatalyst and catalyst-equipped automobiles and heavy-duty diesel trucks. Environ. Sci. Technol. 1993, 27, 636–651. [Google Scholar] [CrossRef]
  69. USEPA (U.S. Environmental Protection Agency). National Air Pollutant Emission Trends 1994; Report Number EPA 454/R-95-014; Office of Air Quality Planning and Standards, Research Triangle Park, North Carolina, and USA, USEPA: Washington, DC, USA, 1995.
  70. Wang, X.L.; Tao, S.; Dawson, R.W.; Xu, F.L. Characterizing and comparing risks of polycyclic aromatic hydrocarbons in a Tianjin wastewater-irrigated area. Environ. Res. 2002, 90, 201–206. [Google Scholar] [CrossRef]
  71. IARC (International Agency for Research on Cancer). Air Pollution, Part 1: Some Non-Heterocyclic Polycyclic Aromatic Hydrocarbons and Some Related Industrial Exposures; IARC Monographs on the Evaluation of Carcinogenic Risks to Humans 92: Lyon, France, 2009. [Google Scholar]
  72. WHO (World Health Organization). Polynuclear Aromatic Hydrocarbons; Air quality Guidelines for Europe; WHO Regional Publications, European Series No. 23; World Health Organization: Geneva, Switzerland, 1987; pp. 105–117. [Google Scholar]
  73. WHO (World Health Organization). Air Quality Guidelines for Europe; Regional Publications Eur. Ser. No. 91; Regional Office for Europe: Copenhagen, Denmark, 2000. [Google Scholar]
  74. Lin, T.C.; Chang, F.H.; Hsieh, J.H.; Chao, H.R.; Chao, M.R. Characteristics of polycyclic aromatic hydrocarbons and total suspended particulate in indoor and outdoor atmosphere of a Taiwanese temple. J. Hazard. Mater. 2002, 95, 1–12. [Google Scholar] [CrossRef]
  75. Menichini, E.; Bertolaccini, M.A.; Taggi, F.; Falleni, F.; Monfredini, F. A 3-year study of relationships among atmospheric concentrations of polycyclic aromatic hydrocarbons, carbon monoxide and nitrogen oxides at an urban site. Sci. Total Environ. 1999, 241, 27–37. [Google Scholar] [CrossRef]
  76. Lim, L.H.; Harrison, R.M.; Harrad, S. The contribution of traffic to atmospheric concentrations of polycyclic aromatic hydrocarbons. Environ. Sci. Technol. 1999, 33, 3538–3542. [Google Scholar] [CrossRef]
  77. Petry, T.; Schmid, P.; Schlatter, C. The use of toxic equivalency factors in assessing occupational and environmental health risk associated with exposure to airborne mixtures of polycyclic aromatic hydrocarbons (PAHs). Chemosphere 1996, 32, 639–648. [Google Scholar] [CrossRef]
  78. Nisbet, C.; La Goy, P. Toxic equivalency factors (TEFs) for polycyclic aromatic hydrocarbons (PAHs). Regul. Toxicol. Pharmacol. 1992, 16, 290–300. [Google Scholar] [CrossRef]
Figure 1. Map of Greater Cairo showing the sampling site.
Atmosphere 09 00368 g001
Figure 2. Comparison of the concentrations of each individual polycyclic aromatic hydrocarbon (PAH) compound in total suspended particulate matter collected from El Giza, Ramsis, and Sphinx Square.
Atmosphere 09 00368 g002
Figure 3. Comparison of the concentrations of PAH compound in total suspended particulate matter collected from El Giza, Ramsis, and Sphinx Square, based on aromatic ring number.
Atmosphere 09 00368 g003
Figure 4. Comparison of the concentrations of the total PAH compounds in total suspended particulate matter collected from El Giza, Ramsis, and Sphinx Square.
Atmosphere 09 00368 g004
Figure 5. Relative contribution of the individual PAH compounds to the total concentrations of the PAH compounds in total suspended particulate at El Giza, Ramsis, and Sphinx Square.
Atmosphere 09 00368 g005
Figure 6. Relative contribution of the different categories of PAH based on aromatic ring number to the total concentrations of the PAH compounds in total suspended particulate at El Giza, Ramsis, and Sphinx Square.
Atmosphere 09 00368 g006
Figure 7. Diagnostic concentration ratios of selected PAH compounds.
Atmosphere 09 00368 g007
Figure 8. Relative contribution of combustable PAH compounds to the total PAH compounds at El Giza, Ramsis, and Sphinx Square.
Atmosphere 09 00368 g008
Figure 9. Relative contribution of the carcinogenic PAH compounds to the total concentrations of the PAH compounds at El Giza, Ramsis, and Sphinx Square.
Atmosphere 09 00368 g009
Table 1. BaP equivalent concentrations for particle-bound PAH compounds in the three square areas during the period of study.
PAHsTEF aEl GizaRamsisSphinx
Average Concentration (ng/m3)BaPaquiv. Concentration (ng/m3)Average Concentration (ng/m3)BaPaquiv. Concentration (ng/m3)Average Concentration (ng/m3)BaPaquiv. Concentration (ng/m3)
NA0.00185.70.0964.90.0643.70.04
ACY0.00170.10.0745.20.0538.30.04
ACE0.00175.20.0865.30.0744.70.04
FLU0.001143.20.14107.60.1191.40.09
PHE0.001163.10.16119.20.1295.80.10
ANT0.01095.60.9697.50.9873.40.73
FLT0.001254.50.25216.70.22199.70.20
PYR0.001562.00.56492.30.49453.20.45
BaA0.100300.630.06272.927.29232.023.20
CRY0.010519.75.20484.34.84426.54.27
BbF0.100981.098.10927.392.73880.288.02
BaP1.00491.2491.17445.9445.91423.4423.38
DBA1.00442.7442.68418.0418.00372.7372.68
IND0.100720.172.01682.568.25656.765.67
BGP0.010830.58.30794.67.95756.17.56
Total carcinogenicity activity (TCA)1149.8 1067.1 986.5
Contribution of BaA to the TCA (%)2.61 2.56 2.35
Contribution of Bbf to the TCA (%)8.53 8.69 8.92
Contribution of BaP to the TCA (%)42.72 41.79 42.92
Contribution of DBA to the TCA (%)38.50 39.17 37.78
Contribution of IND to the TCA (%)6.26 6.40 6.66
a Toxic Equivalent Factor (TEF) values from Nisbet and La Goy [78].

