On the Attribution of Changing Reference Evapotranspiration in a Coastal Area of China


1
Ningbo Yinzhou Meteorological Bureau, Ningbo 315000, China
2
Key Laboratory of Watershed Geographic Sciences, Nanjing Institute of Geography and Limnology, Chinese Academy of Sciences, Nanjing 210008, China
3
Ningbo Meteorological Bureau, Ningbo 315000, China
*
Author to whom correspondence should be addressed.
Atmosphere 2018, 9(1), 9; https://doi.org/10.3390/atmos9010009
Submission received: 4 December 2017
/
Revised: 26 December 2017
/
Accepted: 28 December 2017
/
Published: 1 January 2018
(This article belongs to the Section Meteorology)
Abstract
:Reference evapotranspiration (ET0) is a crucial parameter for hydrological modeling, land-atmospheric interaction investigations and agricultural irrigation management. This study investigated changes in ET0 and attributed those changes to climate variations in a coastal area (Zhejiang province) of China by a numerical experiment method. The results indicated that annual ET0 increased significantly (p < 0.05) at a rate of 1.58 mm·year−1 from 1973 to 2013, which was mainly caused by an obvious increase in ET0 in spring. Air temperature and water vapor pressure deficits increased significantly (p < 0.05) at rates of 0.04 °C·year−1 and 0.005 kPa·year−1, respectively, at an annual time scale during the study period, while wind speed and solar radiation decreased significantly (p < 0.05) at rates of −0.01 m/s·year−1 and −3.94 MJ·m−2·day−1·year−1, respectively. The contributions of changes in air temperature, wind speed, water vapor pressure deficits and solar radiation to increases in ET0 were 0.39, −0.56, 2.62 and −0.61 mm·year−1, respectively. The decrease in wind speed and solar radiation negatively affected the increase in ET0, which was offset by the positive effects of the air temperature and water vapor pressure deficits increase, where the water vapor pressure deficits was the dominant factor in increasing ET0 in the coastal area. Moreover, the impact of topography on ET0 was further discussed. ET0 changes at plain stations were approximately 5.4 times those at hill stations, which may be due to the impact of a large water body and the augment of surface roughness from intense human activities in the well-developed plain area. The results are helpful for investigating spatial and temporal changes in the evaporative demand for well-developed regions under energy-limited conditions.
1. Introduction
Reference evapotranspiration (ET0) is an important parameter for hydrological process simulations, land surface model investigations and agricultural irrigation management, especially in humid regions, which reflects a potential demand for evapotranspiration under a certain underlying surface [1,2,3,4]. Under a changing climate, significant decreases in ET0 have been reported all over the world, which are associated with increasing air temperature, also known as an “evaporation paradox” [5,6,7]. However, recent studies indicated that ET0 has shown an increasing trend, and the “evaporation paradox” has disappeared since the late 1990s [8,9,10].
Quantifying changes in ET0 due to climate variations is an important issue in current studies. There are several methods for attributing ET0 changes to climate variables, such as a regression analysis, sensitivity method, detrended method, differentiation approach and numerical modeling [11,12,13,14]. For example, Vicente-Serrano et al. [14] studied the changes in monthly ET0 in Spain by a sensitivity analysis and found there were spatial gradients in ET0 sensitivity. Xu et al. [12] used a detrended method to study ET0 changes in the Yangtze River catchment and concluded that the decrease in total net radiation was the dominant factor for changes in ET0. Liu and Sun [15] assessed atmospheric evaporation demands in 12 state-of-the-art global climate models against D20 pan evaporation observations by a differentiation approach. Sun et al. [16] attributed changes in ET0 to climate variables in southwestern China using numerical experiments. These abundant investigations are beneficial for understanding the dynamic response of evaporative demand changes to complex land-atmospheric interactions [17,18,19].
Up to now, many studies on ET0 changes are available for small catchments, continents and at the global scale [20,21,22]. Changes in ET0 exhibited different trends, and controlling factors varied under different climate conditions at different time scales [3,23,24]. Wang and Dickinson [20] conducted an investigation on global atmospheric evaporative demands over land from 4250 globally distributed stations from 1973 to 2008 and found that the contribution of water vapor pressure deficits to the monthly variability of evaporative demands was much larger than that of solar radiation, wind speed and air temperature at the global scale. In addition, several studies have attempted to investigate the impact of natural factors (i.e., geography, water bodies, and climate conditions) and socio-economic factors on ET0 (i.e., agriculture and household income) [10,25]. For example, Zhang et al. [10] indicated that the amplitude of ET0 changes near a large freshwater lake was larger than that away from the lake, which was due to a larger sensitivity of ET0 to climate variables near the lake. Han et al. [26] found that the decrease in ET0 was accelerated in agricultural stations, with a more significant decrease in the aerodynamic term in arid/semi-arid regions and a more significant decrease in the radiation term in humid regions. Litvak et al. [25] found that evapotranspiration from the total land area was linearly correlated with the median household income in Los Angeles, California.
Zhejiang province is one of the most developed regions in China and is located in the southeastern coastal area of the country [27]. As a critical input for hydro-meteorological predictions, changes in ET0 have been investigated by several researchers [28,29,30]. Xu et al. [28] studied future ET0 changes from 2011 to 2014 by a global sensitivity analysis method that used one regional climate model in Zhejiang province and concluded that intra- and inter-annual changes in ET0 were mainly due to changes in solar radiation, relative humidity and daily minimum temperature. Pan et al. [29] investigated the sensitivity of ET0 to climate variables in the Shengsi Islands in Zhejiang province and found that ET0 was most sensitive to solar radiation in the summer and most sensitive to relative humidity during the remaining seasons. These results are important for the improvement of hydrological modeling, urban flood-drought risk management and the planning of commercial crop irrigation. However, a comprehensive quantification of changes in ET0 to climate variables in Zhejiang province has not been available until recently. Moreover, the influence of topography on ET0 changes has not been clear in this coastal area.
The objectives of this study are (1) to analyze the changes in ET0 and climate variables in Zhejiang province from 1973 to 2013; (2) to quantify the contribution of climate variations to ET0 changes; and (3) to discuss the influence of topography on ET0 changes.
2. Study Area and Data
2.1. Study Area
Zhejiang province is located at the eastern coast of China, south of the Yangtze River Delta (Figure 1), which is one of the most rapidly developed regions in China [31]. The area of this province is 1.02 × 10⁵ km2, and the altitude ranges from −74 to 1922 m. Zhejiang province belongs to the typical Asian monsoon region. The average air temperature is 17.2 °C, the extreme maximum air temperatures is 43.2 °C and the extreme minimum air temperatures is −13.5 °C. The average annual rainfall is 1493.3 mm. The rainstorm days is 4.1 days and 50% of rainstorm occurs during the Mei-Yu period from June to July, which is caused by a persistent stationary front known as the Mei-Yu front [32]. This coastal province is affected by typhoon frequently, which mainly occurred during July to September [33,34]. Zhejiang province is a powerful economic province in China, and the per capita net income ranks the first in China for more than 20 years, which has reached the level of moderately developed countries [35].
2.2. Data
Daily meteorological records from 1973 to 2013 at 46 meteorological stations were collected from Zhejiang Meteorological Bureau and included sunshine duration (hour), wind speeds at 10 m (m/s), relative humidity (%), minimum air temperature (°C), and maximum air temperature (°C). Considering the continuity of meteorological data, missing data from the selected stations were less than 2%. All meteorological data were accumulated into monthly values. If the data missing for a station were more than 9 days in a certain month, then the value of this month was replaced by the average climate value. Climate variables and ET0 for the whole province were averaged from all 46 stations.
The Digital Elevation Model (DEM) data for Zhejiang province was downloaded from the Global Land Cover Facility with a resolution of 90 m × 90 m [36], which was used to analyze the impact of topography on ET0 changes.
3. Methods
3.1. Calculation of ET0
The Penman-Monteith formula, recommended by the Food and Agriculture Organization of the United Nations, was used to estimate ET0 (mm), which represents the evaporative capacity of a hypothetical reference crop with an assumed crop height of 0.12 m, a fixed surface resistance of 70 s·m−1 and an albedo of 0.23 [37]:
where Rn is the net radiation (MJ·m−2·day−1), G is the soil heat flux density (MJ·m−2·day−1), T is the mean air temperature (°C), VPD is the water vapor pressure deficits (kPa), U2 is the wind speed at 2 m (m·s−1), Δ is the slope of the vapor pressure curve versus temperature (kPa·°C−1) and γ is the psychrometric constant (kPa·°C−1).
Wind speed observed at 10 m was adjusted to 2 m by a logarithmic wind speed profile:
G is calculated by:
where Ti and Ti−1 are the air temperature at time i and i − 1.
Solar radiation (Rs) is calculated by:
where as and bs are coefficients, n is the sunshine duration and N is the maximum possible duration of sunshine. Ra is the extraterrestrial radiation calculated by the Angstrom formula [3].
Rn is calculated by:
where α (=0.23) is the albedo of the reference grassland. σ is Stefan-Boltzmann constant (4.903 × 10⁻⁹ MJ·K−4·m−2·day−1), Tmax,k is maximum daily temperature (K = °C + 273.16), Tmin,k is minimum daily temperature (K = °C + 273.16), Rso is clear-sky radiation (MJ·m−2·day−1).
3.2. Attribution of Changes in ET0
A numerical experiment method proposed by Sun et al. [16] was employed to quantify the impact of climate variations on changes in ET0 in this study. For ET0, the combined effects of air temperature, solar radiation, wind speed and water vapor pressure deficits were designed in five experiments to attribute the influence of climate variations on ET0 change, including one control experiment and four sensitivity experiments (Table 1). ET0 calculated by the control experiment represented the combined influence of the four climate variables, whereas the ET0 calculated by each sensitivity experiment represented the combined influence of the other three climate variables, excluding the non-changed variable. The impact of each climate variable on changes in ET0 can then be estimated as:
where L(ET0_CTR) and L(ET0_xi) are the calculated long-term trends in ET0 via a linear regression based on the control test and the sensitivity test, respectively. The variable xi represents either air temperature, solar radiation, wind speed or the water vapor pressure deficits, and C(xi) is the contribution of the corresponding climate variable to ET0 changes. Errors in the experiment analyses can be calculated as:
Then, the relative contribution R(xi) of each climate variable to changes in ET0 can be calculated as:
4. Results and Discussion
4.1. Changes in ET0
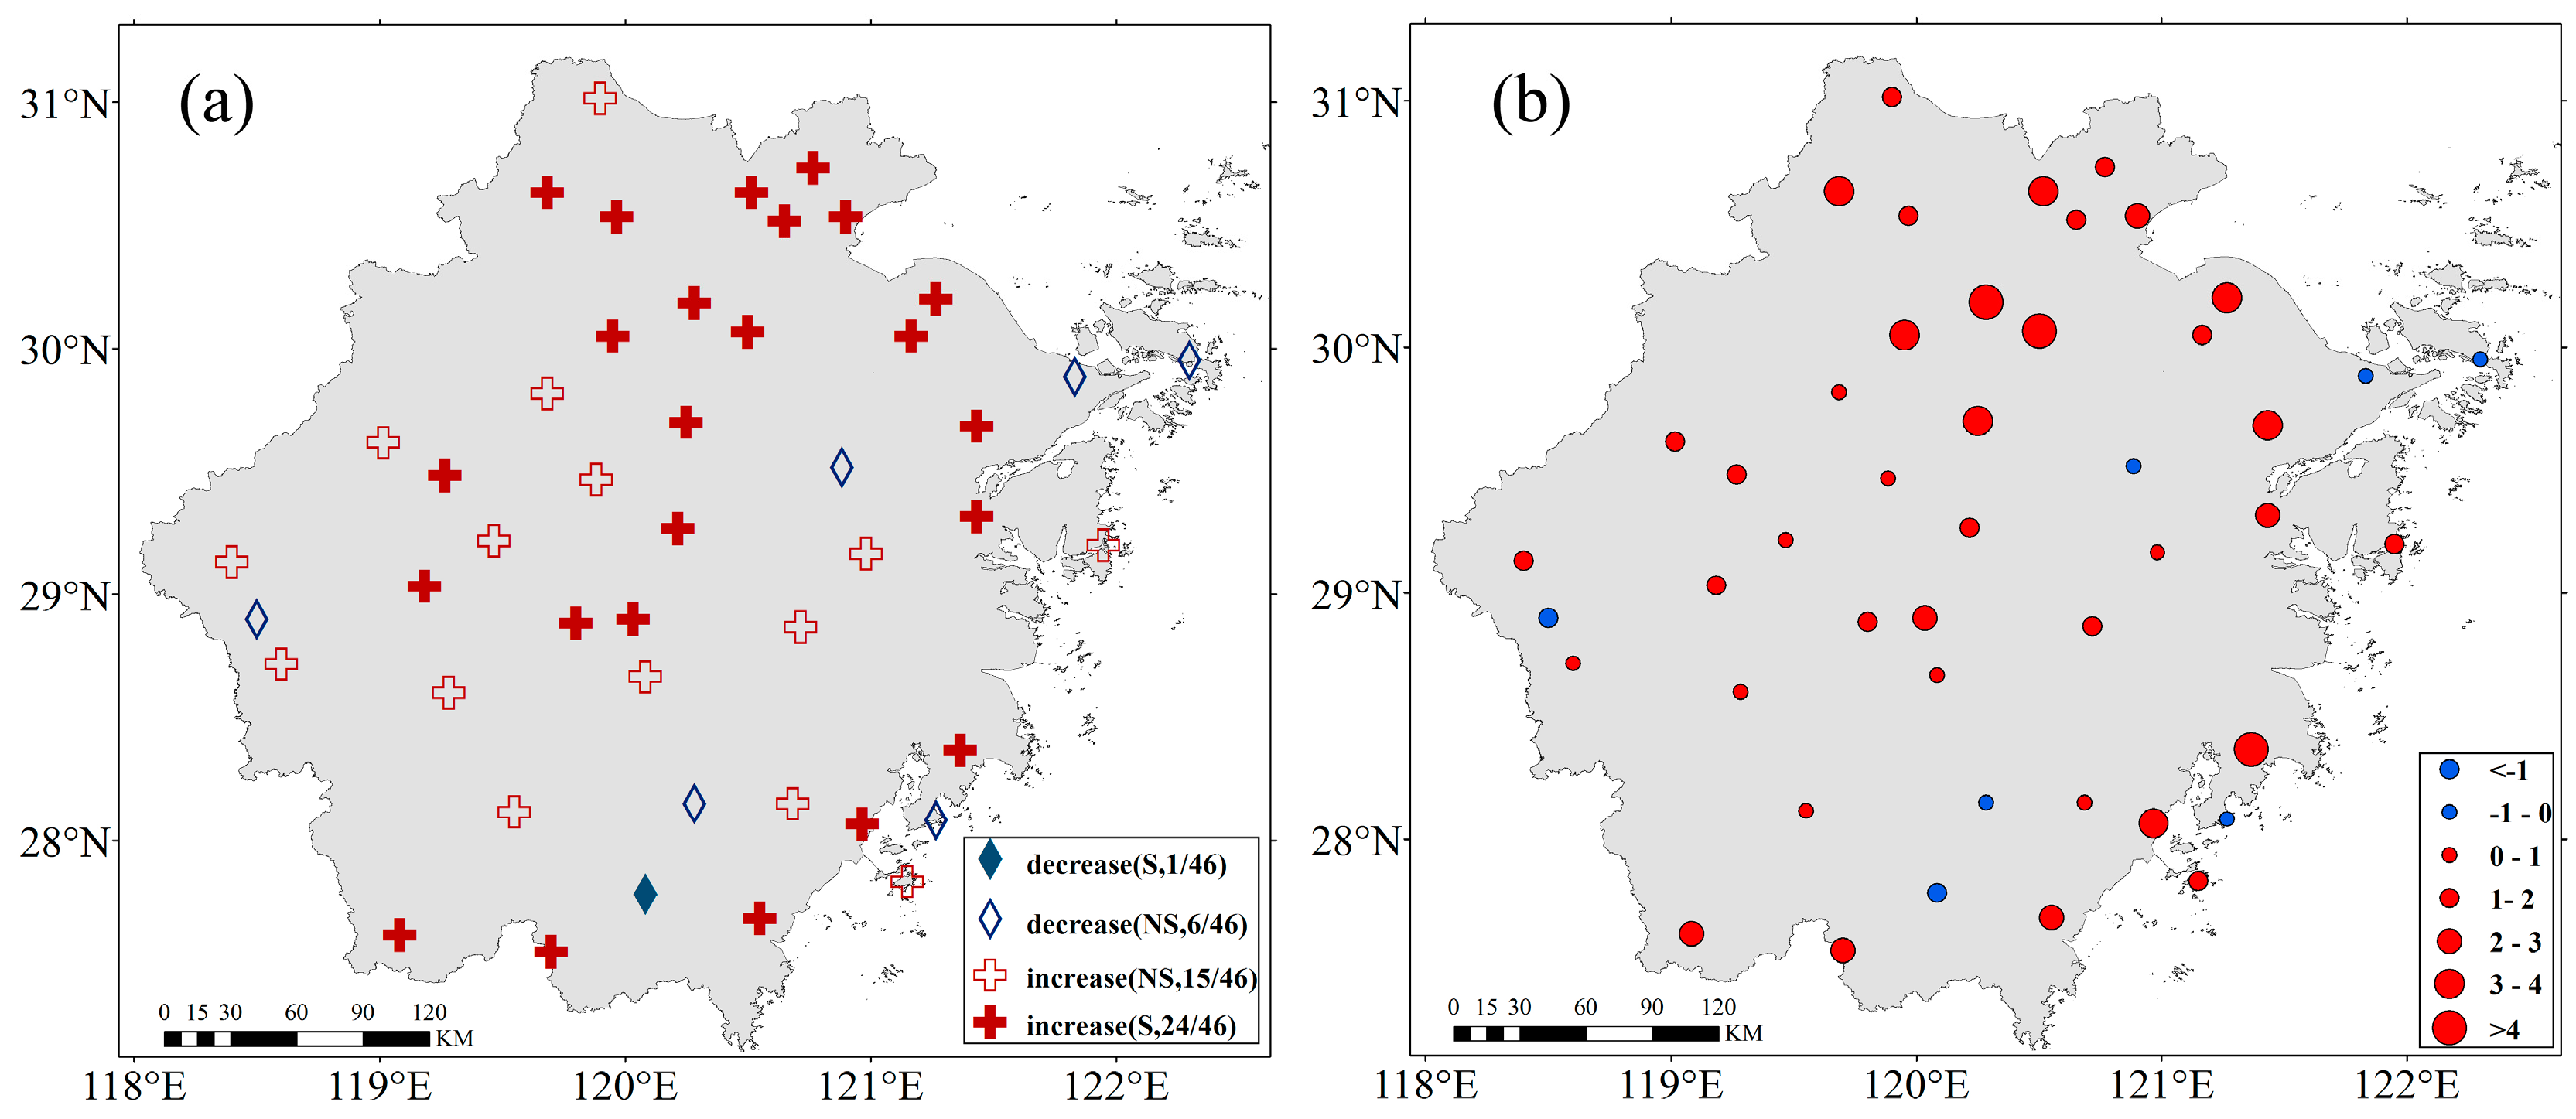
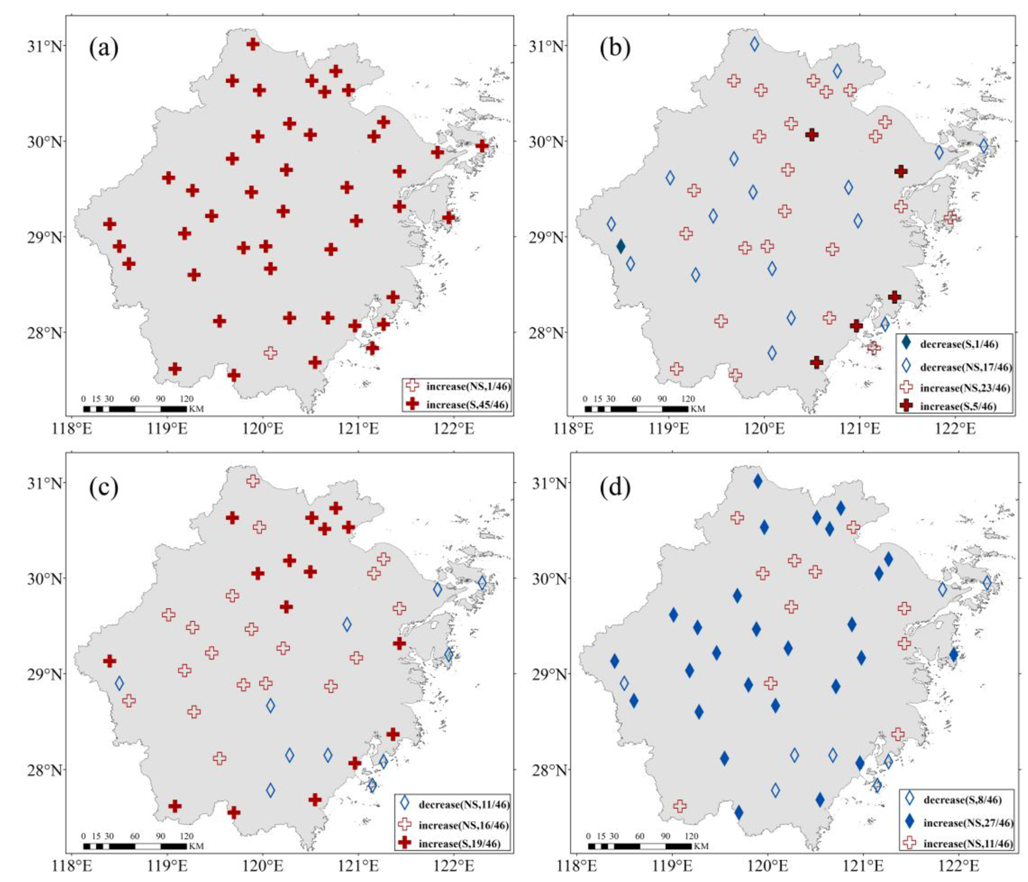
Figure 2 shows the spatial distribution of changes in annual ET0 at 46 meteorological stations in Zhejiang province from 1973 to 2013. Annual ET0 at 39 stations increased during the past 40 years and trends at 24 stations were significant at the 95% level. Highly increasing trends in ET0 were generally located at northern and coastal stations, which are well-developed socio-economic regions. Annual ET0 at 7 stations showed a decreasing trend, and only one station had a trend significant at the 95% level. Annual ET0 increased significantly (p < 0.05) at a rate of 1.58 mm·year−1, which was the provincial average (Table 2). For seasonal distribution, the changes in ET0 clearly varied (Figure 3). It is worth noting that ET0 decreased at 35 stations in winter, and the trends at 8 stations were significant at the 95% level. For the provincial average, ET0 increased at rates of 1.12, 0.23 and 0.34 mm·year−1 during spring, summer and autumn, respectively, whereas ET0 decreased at a rate of −0.17 mm·year−1 in winter.
4.2. Changes in Climate Variables
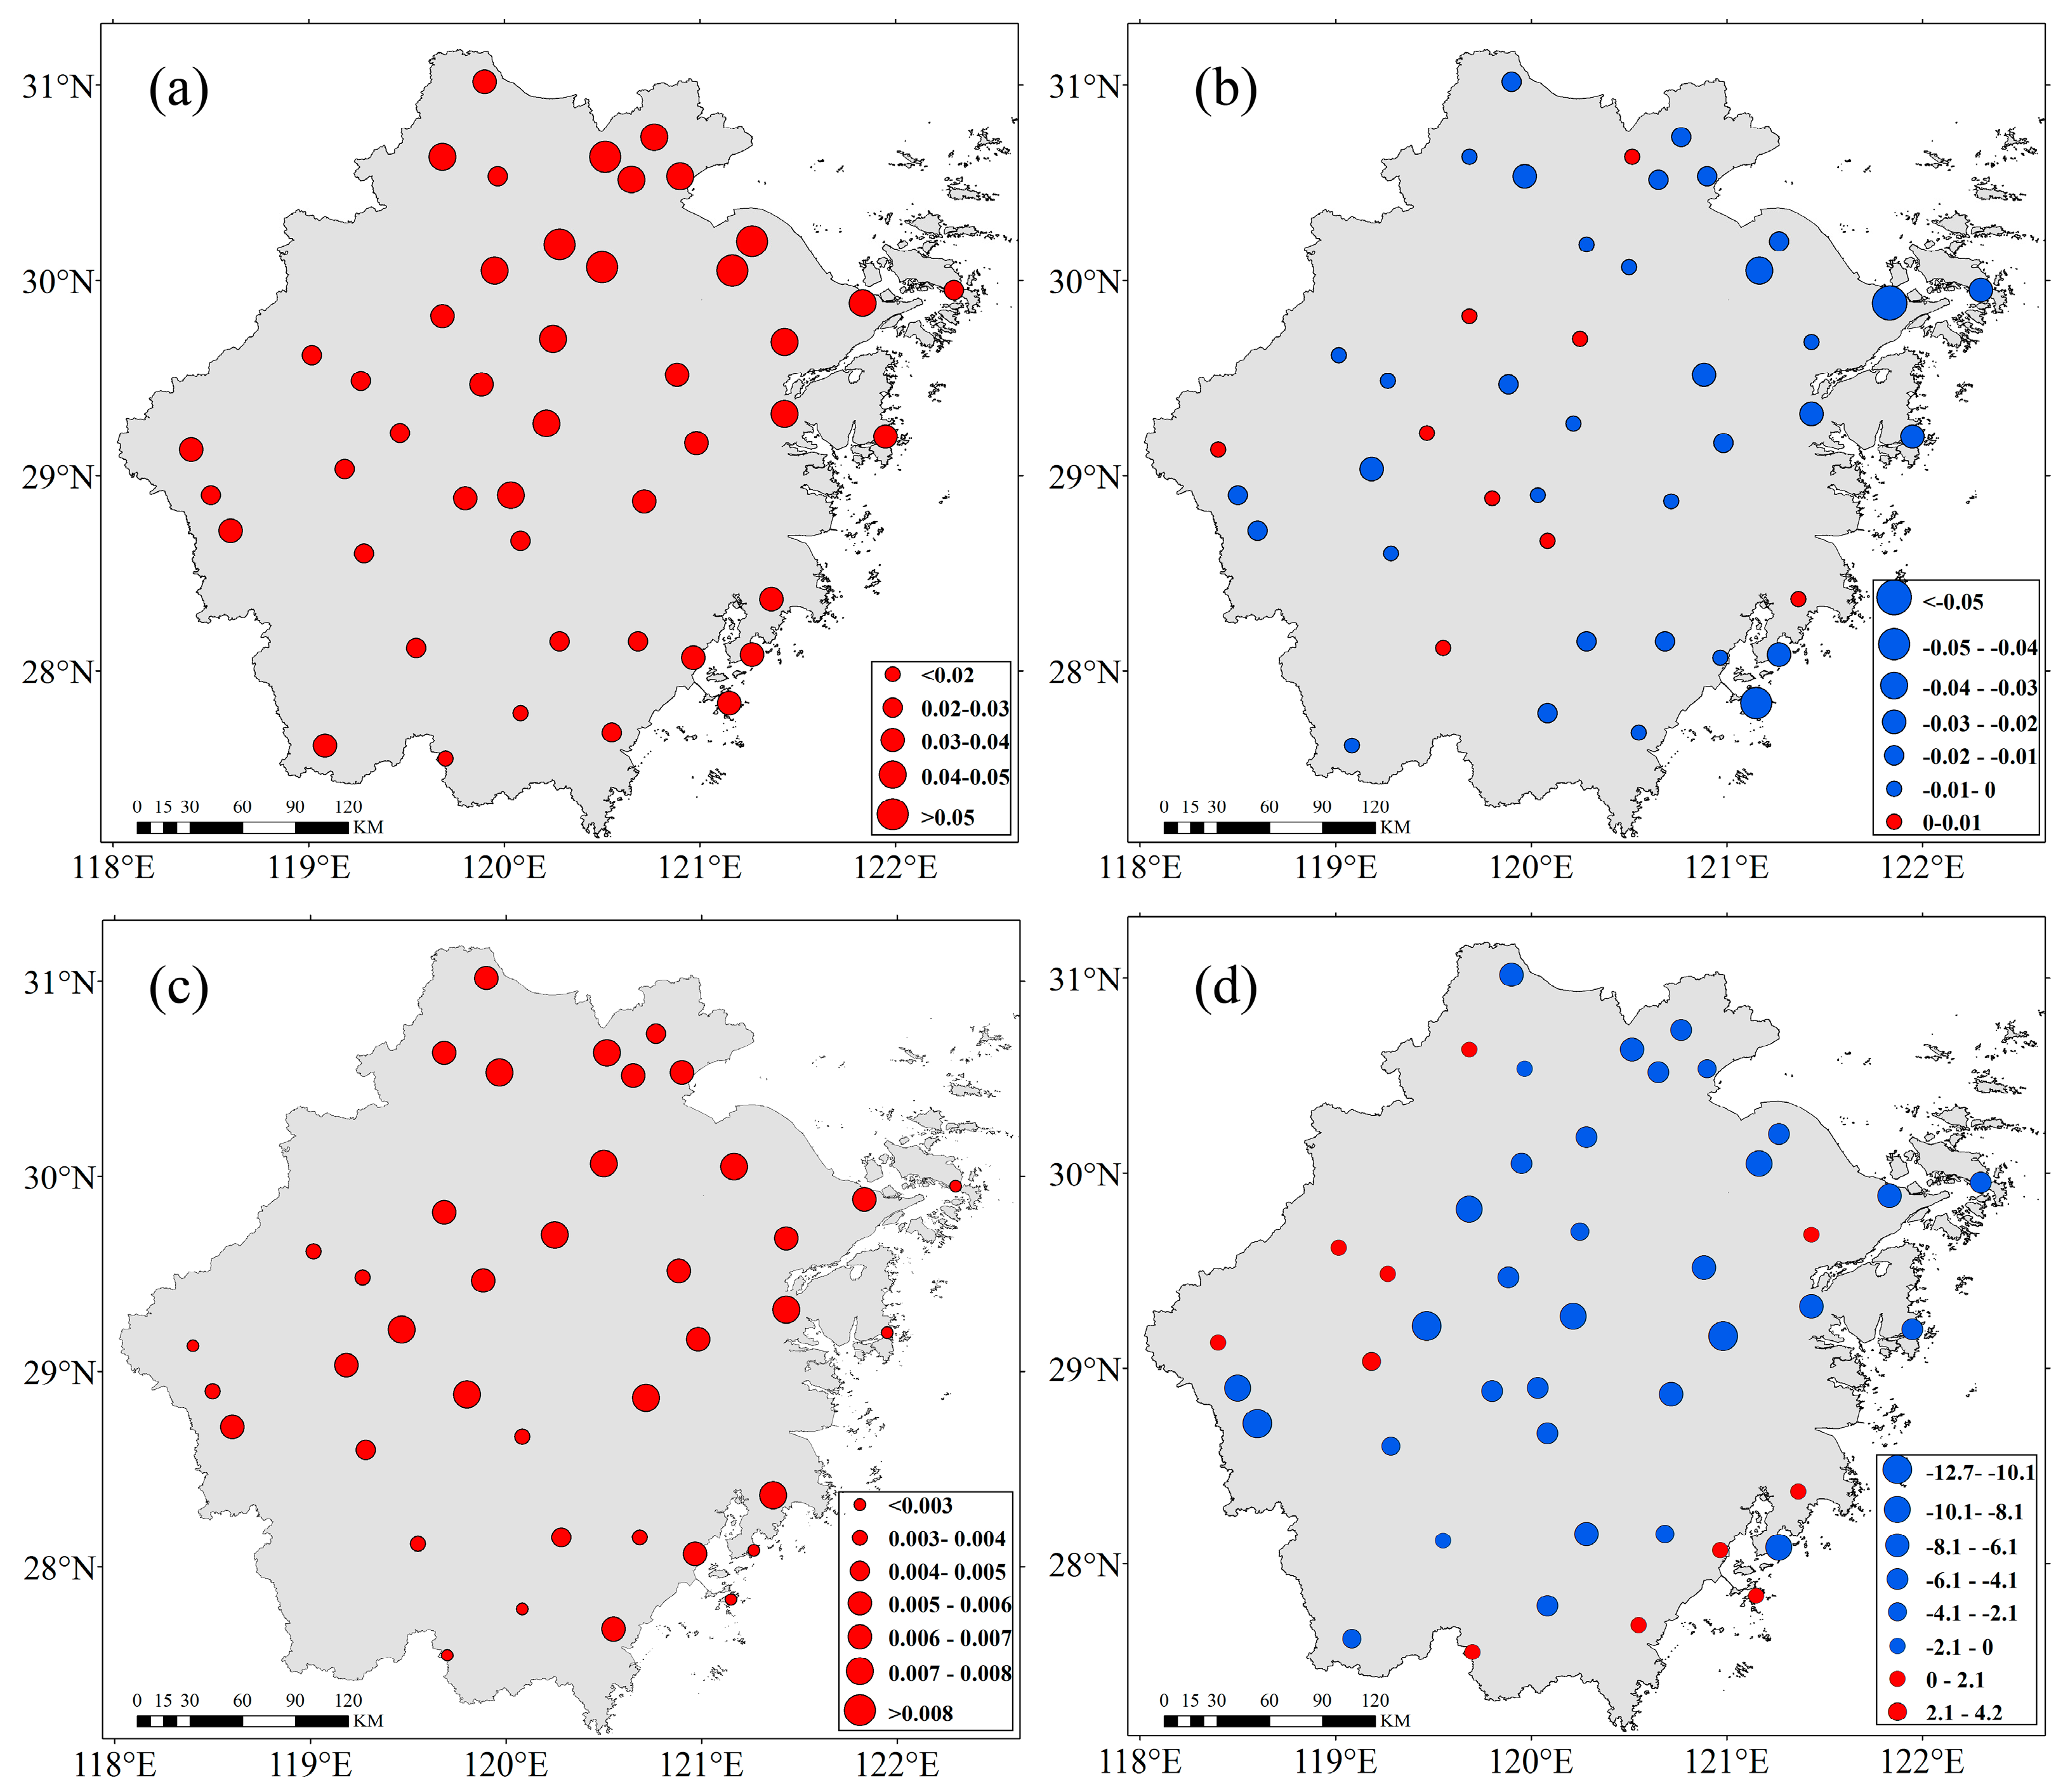
Figure 4 shows the changes in climate variables related to ET0 in Zhejiang province during the period of 1973–2013. The annual mean air temperature at the 46 stations presented an upward trend, and all trends passed the 0.05 significance level by the t-test (Table 3). For the provincial average, the annual mean air temperature increased significantly (p < 0.05) at a rate of 0.04 °C·year−1. Changing rates in air temperature were 0.04, 0.03, 0.03 and 0.03 °C·year−1 during the four seasons, respectively.
Wind speed showed declining trends at 35 stations, and the declining trend was significant (p < 0.05) at 29 stations. Wind speed at the other 11 stations showed rising tendencies, and the increasing trend was significant (p < 0.05) at 4 stations. For the regional average, the decreasing rate of wind speed for the whole province was −0.01 m/s·year−1 (p < 0.05) from 1973 to 2013 at both annual and seasonal time scales.
The water vapor pressure deficits at all 46 stations showed an increasing trend, and the trends were significant at the 0.05 level at 45 stations. Water vapor pressure deficits increased significantly (p < 0.05) by 0.005 kPa·year−1 for the regional average. For the four seasons, the water vapor pressure deficits increased at rates of 0.006, 0.009, 0.005 and 0.001 kPa·year−1, respectively.
Solar radiation decreased at 34 stations, and trends were significant at 26 stations. Solar radiation at the other 12 stations showed an increasing trend. For the provincial average, solar radiation decreased significantly at a rate of −3.94 MJ·m−2·day−1·year−1 from 1973 to 2013. It is worth noting that solar radiation increased at a rate of 1.37 MJ·m−2·day−1·year−1 in the spring.
4.3. Quantification of ET0 Changes
Figure 5 shows there are significant relationships between trends in ET0 from the control test and the accumulated trends in ET0 from the four sensitivity tests at annual and seasonal time scales. The R2 is 0.98, and the relative error is −16.5% at the annual time scale for the provincial average (Table 4). R2 ranges from 0.97 to 0.99, and the relative error ranges from −17.2 to 17.6% for the four seasons. This result indicates that the method used in this study is effective for quantifying the impact of climate variations on ET0 changes.
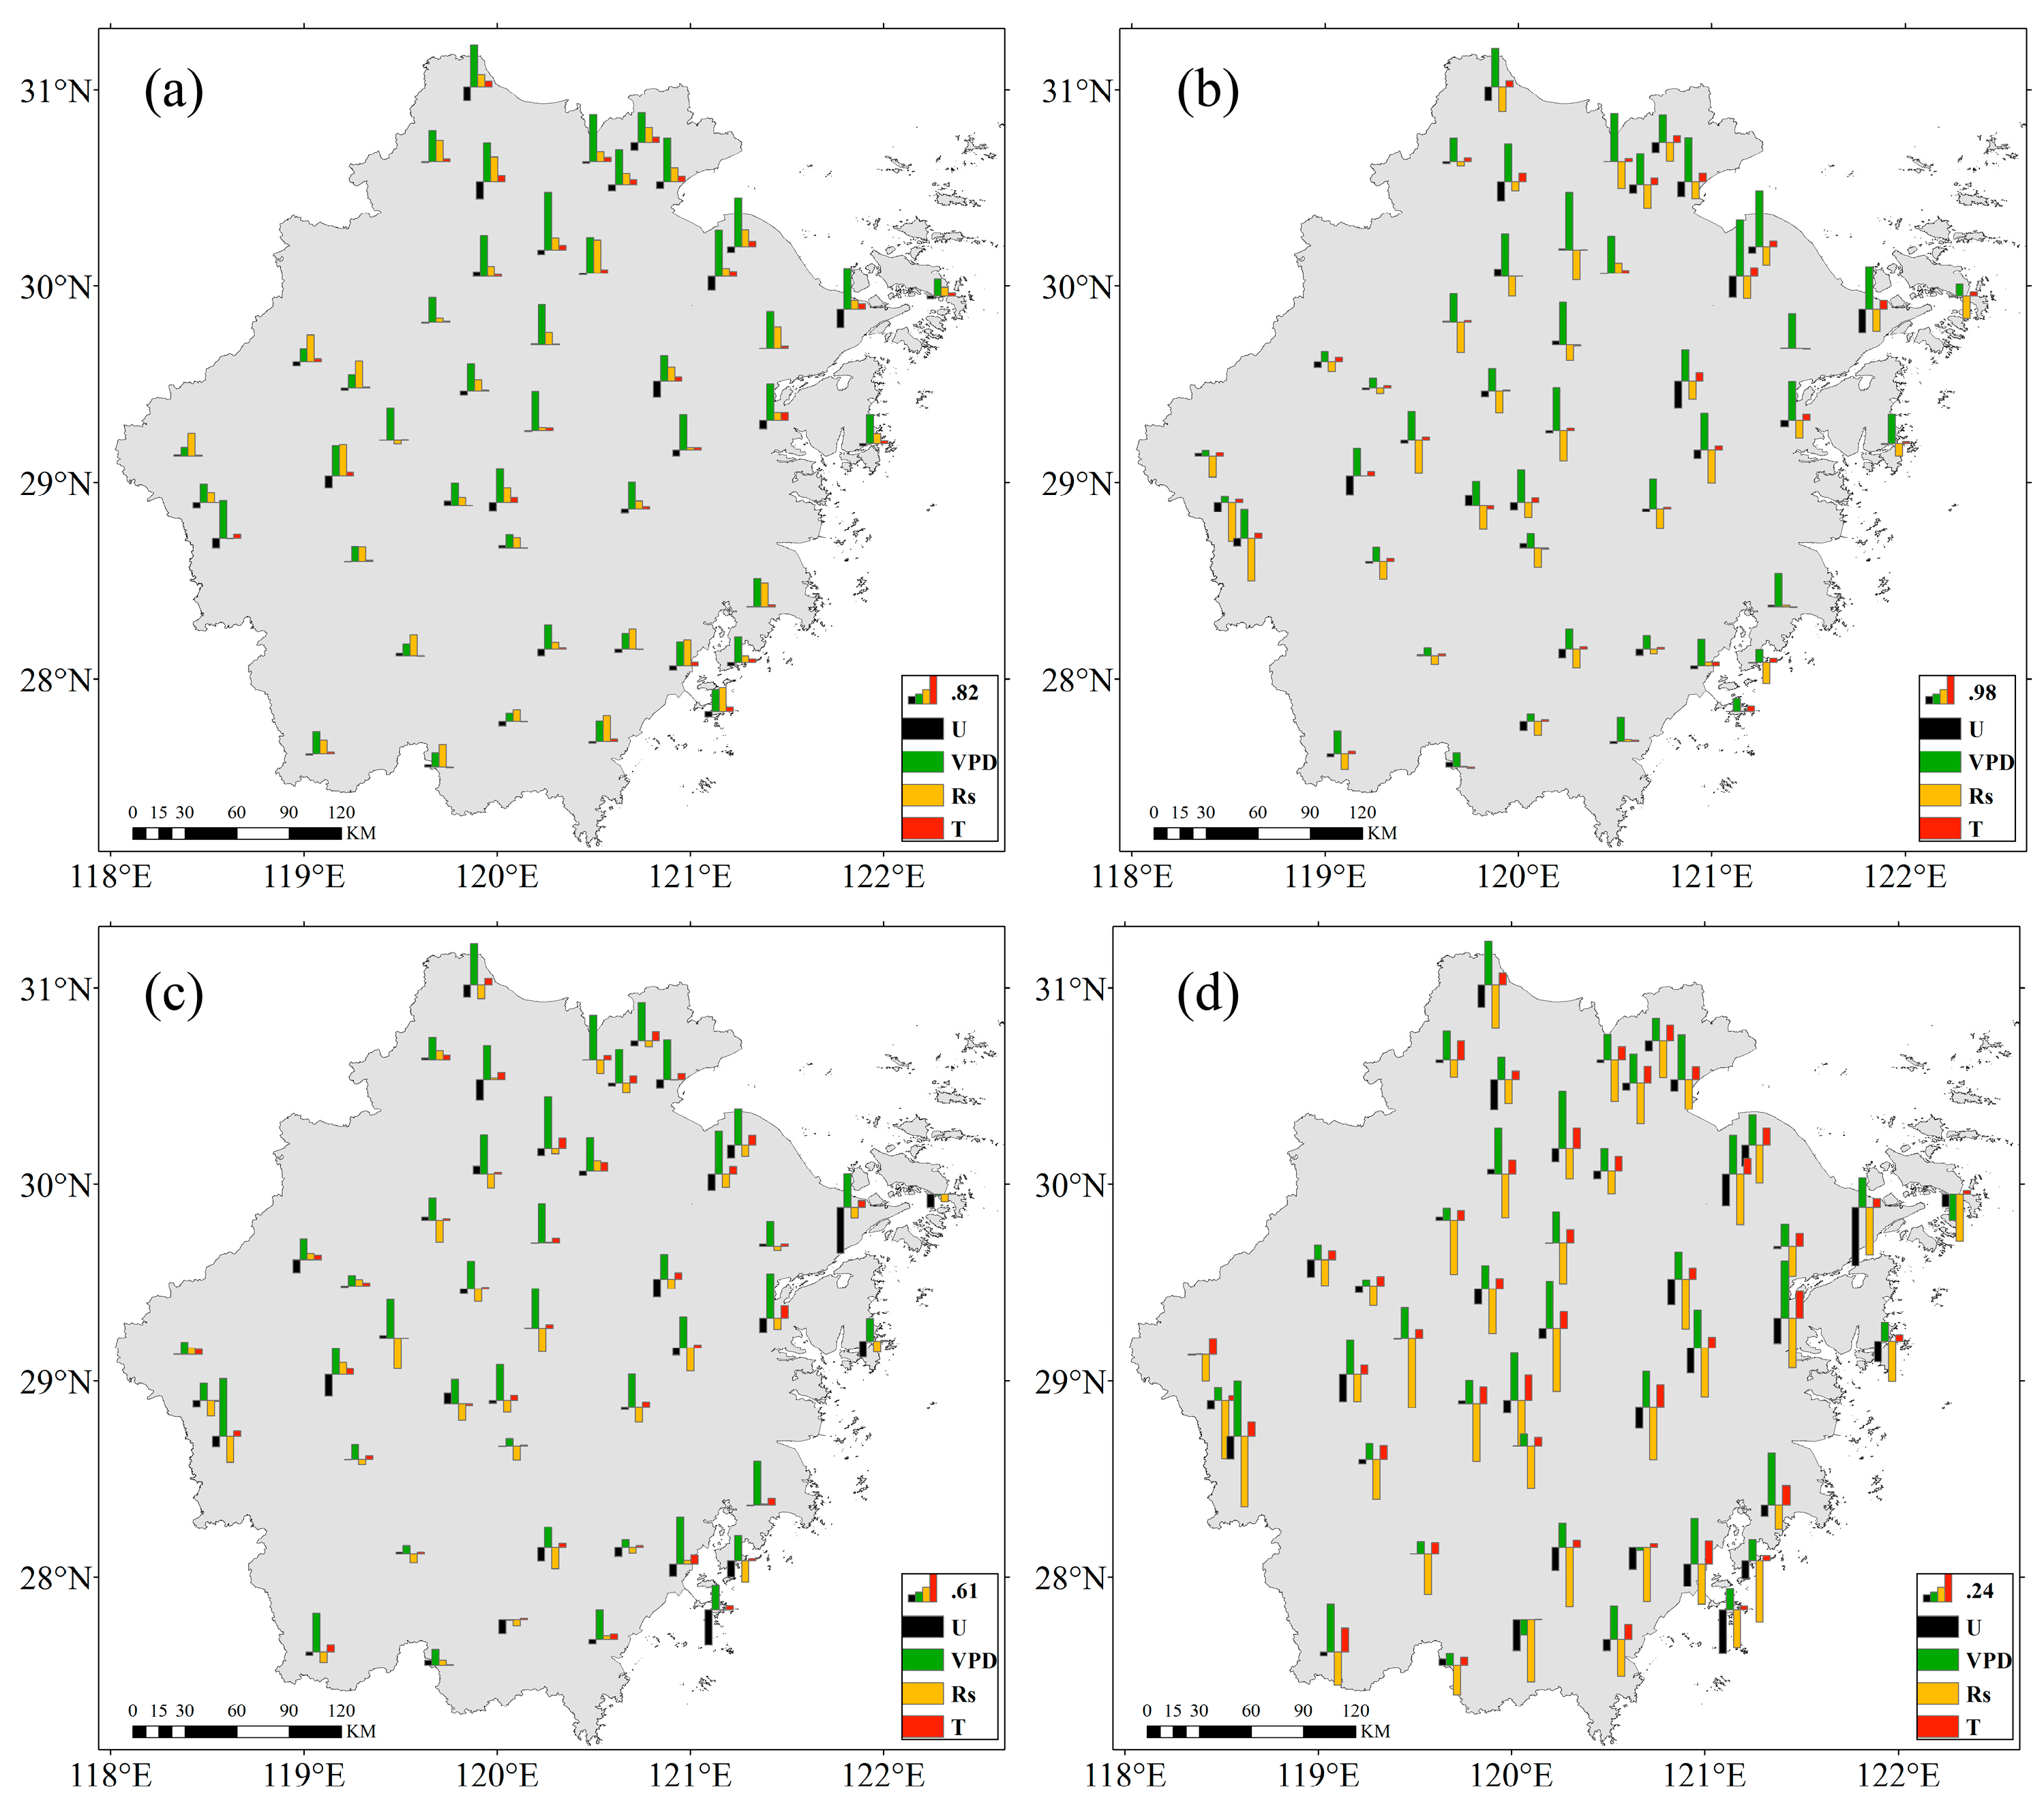
During the period from 1973 to 2013, changes in air temperature, wind speed, water vapor pressure deficits and solar radiation led to changes in ET0 of 0.39, −0.56, 2.62 and −0.61 mm·year−1, respectively, at the annual time scale. The positive effects of the increase in air temperature and water vapor pressure deficits were offset by the negative effects of the decrease in wind speed and solar radiation. The combined effects of the four climate variables led to an increase in ET0 of 1.84 mm·year−1. The increase in the water vapor pressure deficits was the dominant factor for the increase in ET0. For the 46 stations, air temperature, wind speed, water vapor pressure deficits and solar radiation were the dominant factors for changes in ET0 at 0, 1, 43, and 2 stations, respectively (Figure 6).
Seasonally, air temperature and water vapor pressure deficits have positive effects on the increase in ET0 in spring, summer and autumn and negative effects on the decrease in ET0 in winter. The decrease in wind speed has a negative effect on the increase in ET0 in spring, summer and autumn and a negative effect on the decrease in ET0 in winter. The decrease in solar radiation has a negative effect on the increase in ET0 in summer and autumn, but it has a positive effect on ET0 changes in spring and winter. The increase in water vapor pressure deficits is the controlling factor for the increase in ET0 in spring, summer and autumn, while a rapid decrease in solar radiation is the controlling factor for the decrease in ET0 in winter (Figure 7).
4.4. Influence of Topography on ET0 Changes
It seems plausible that the changes in ET0 at plain stations are larger than those at hill stations (Figure 2 and Figure 3), which reflects the impacts of topography on ET0 changes. Therefore, all 46 stations are classified into two categories based on the degree of topographic relief: stations in the plain area, where the degree of topographic relief is lower than 100 m, which reflects the influence of a large water body, and stations in the hill area (25 stations), where the degree of topographic relief is larger than 100 m, which reflects the influence of topography [38,39,40,41].
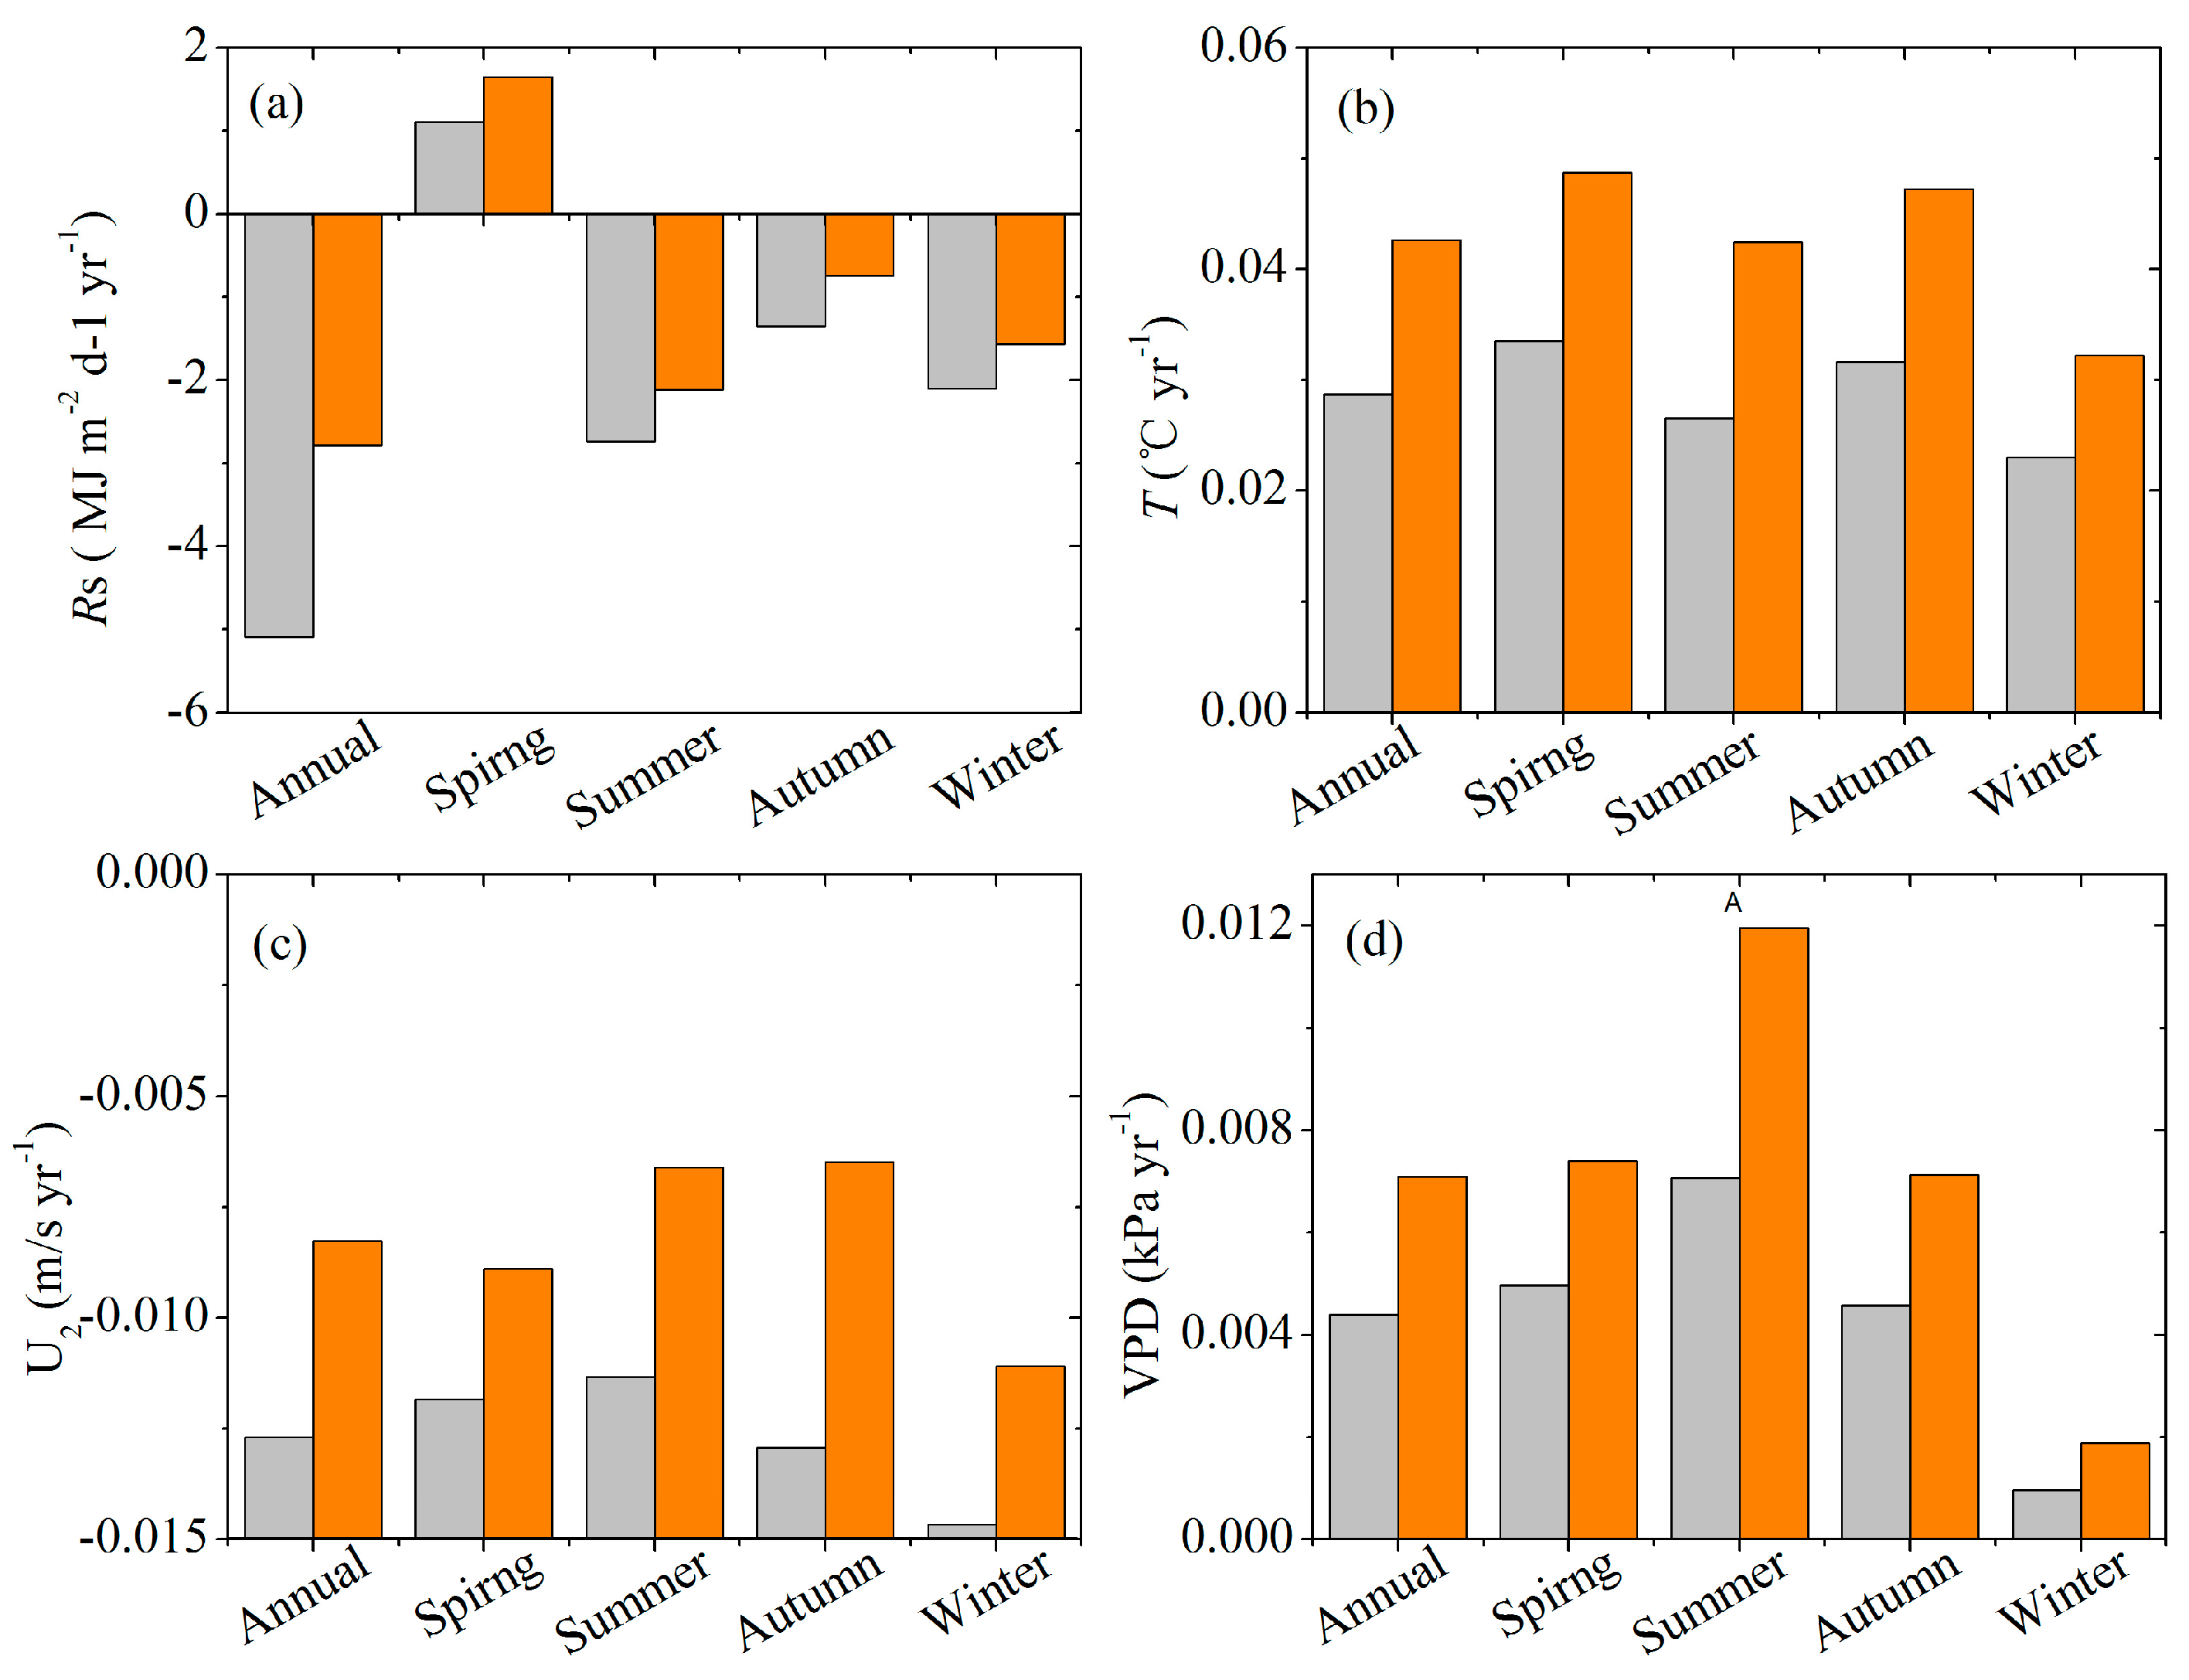
Figure 8 shows the comparison of ET0 changes and the contributions of the two categories. The annual trends in ET0 for the plain category and hill category are 2.67 and 0.50 mm·year−1, respectively. The former increase is 5.4 times the latter one. This might be caused by the location of plain stations in well-developed cites, and intense human activities must influence underlying surface characterizations [42,43]. For example, the increase in air temperature and water vapor pressure deficits for the coastal plain category is 1.5 and is 1.6 times that of the hill category (Figure 9). It is worth noting that the decreases in solar radiation and wind speed for the plain category are smaller than those for the hill category, which has a negative effect on the increase in ET0. The contributions of solar radiation, air temperature, wind speed and water vapor pressure deficits to the increase in ET0 are −12%, 17.92%, −19.3% and 124.2%, respectively, for the plain category, and the increase in water vapor pressure deficits plays a dominant role in ET0 increase. For the hill category, the contributions of solar radiation, air temperature, wind speed and water vapor pressure deficits to the increase in ET0 are −181.1%, 59%, −122.5% and 387.5%, respectively. Although the water vapor pressure deficits is still the dominant factor for ET0 increase, influences from solar radiation and wind speed cannot be ignored either. Moreover, it can be found in Figure 8 that the increase in ET0 in these two categories is due to the rapid increase in ET0 in spring.
Generally, humidity in this coastal province is very high, and the water vapor pressure deficits is the dominant factor affecting changes in ET0. The other two important factors affecting increases in ET0 are wind speed and solar radiation. The coastal Zhejiang province has a strong sea-land breeze due to land-atmosphere interactions [44,45]. Therefore, the decrease in wind speed in the plain category is smaller than that of the hill category, although the increase in surface roughness from intense human activities is much more obvious for the plain category. In addition, the plain category also has a smaller decrease in solar radiation than the hill category. Lin et al. [46] indicated that solar radiation considerably decreases with wind stilling for weakened wind, which amplified the impact of aerosol emissions on solar dimming. The contribution of air temperature to the increase in ET0 is the smallest of the four factors. However, numerous studies have found that air temperature is the dominant factor affecting the increase in ET0 in past decades [13,20,22]. This might be due to the coastal area being characterized by the energy-limited condition, where the impact of air temperature is limited on ET0 increase. In addition, this study considers the water vapor pressure deficits as an influential factor, rather than water vapor pressure, which leads to a different contribution result from previous studies.
5. Conclusions
This study investigated the spatial and temporal changes in ET0 along the coast of Zhejiang province during the period of 1973 to 2013, and a numerical experiment method was used to quantify the contribution of climate variations to changes in ET0. The results indicated that the annual ET0 increased significantly (p < 0.05), with a slope of 1.58 mm·year−1 during the past 40 years. At the seasonal time scale, ET0 increased in spring, summer and autumn but decreased in winter. Air temperature, water vapor pressure deficits, wind speed and solar radiation changed significantly (p < 0.05) at rates of 0.04 °C·year−1, 0.005 kPa·year−1, −0.01 m/s·year−1 and −3.94 MJ·m−2·day−1·year−1, respectively.
The results of the five numerical experiments manifested that changes in air temperature, wind speed, vapor pressure deficits and solar radiation led to annual changes in ET0 by 24.7%, −35.4%, 165.8% and −38.6%, respectively, and the relative error of the numerical experiment method was −16.5%. An increase in the water vapor pressure deficits was the controlling factor for increasing ET0 along the coastal province. The impacts of topography on ET0 changes were further analyzed. The trend in ET0 for the plain category was approximately 5.4 times that of the hill category. This might be caused by the influence of a large water body, as well as the augment of surface roughness by intense human activities in the well-developed plain area.
This study provides a comprehensive understanding of ET0 changes in a well-developed coastal province and highlights the important role of water vapor pressure deficits to increases in ET0. Further investigation is required to properly quantify the influence of human activities on evaporative demand, such as the urban heat island effect and the augment of surface roughness. Our results are helpful for hydrological modeling, land-atmospheric interaction simulations and irrigation of eco-agriculture planning.
Acknowledgments
This research was supported by the Natural Science Foundation of China (41771039) and the Foundation of Yinzhou science and technology Bureau (Yinzhou Science [2014]99 and Yinzhou Science [2015]96).
Author Contributions
Renying Gu performed the design of experiments, the data processing and wrote the manuscript. Dan Zhang edited the English language and gave constructive suggestions towards the whole structure. Anhua Liao helped data quality control and dealt with missing data. Huayu Shen calculated the reference evapotranspiration. Xiaotong Zhao and Jingru Pan helped English grammar and sentence modification.
Conflicts of Interest
The authors declare no conflict of interest.
References
- Cleverly, J.; Eamus, D.; Gorsel, E.V.; Chen, C.; Rumman, R.; Luo, Q.; Coupe, N.R.; Li, L.; Kljun, N.; Faux, R. Productivity and evapotranspiration of two contrasting semiarid ecosystems following the 2011 global carbon land sink anomaly. Agric. For. Meteorol. 2016, 220, 151–159. [Google Scholar] [CrossRef]
- Milly, P.C.D.; Dunne, K.A. Potential evapotranspiration and continental drying. Nat. Clim. Chang. 2016, 6, 946–949. [Google Scholar] [CrossRef]
- Zhang, D.; Liu, X.; Zhang, Q.; Liang, K.; Liu, C. Investigation of factors affecting intra-annual variability of evapotranspiration and streamflow under different climate conditions. J. Hydrol. 2016, 543, 759–769. [Google Scholar] [CrossRef]
- Liu, X.; Yang, T.; Hsu, K.; Liu, C.; Sorooshian, S. Evaluating the streamflow simulation capability of PERSIANN-CDR daily rainfall products in two river basins on the Tibetan Plateau. Hydrol. Earth Syst. Sci. 2017, 21, 169–181. [Google Scholar] [CrossRef]
- Brutsaert, W.; Parlange, M.B. Hydrologic cycle explains the evaporation paradox. Nature 1998, 396, 30. [Google Scholar] [CrossRef]
- Cong, Z.T.; Yang, D.W.; Ni, G.H. Does evaporation paradox exist in China? Hydrol. Earth Syst. Sci. 2008, 13, 357–366. [Google Scholar] [CrossRef]
- Hobbins, M.T.; Ramírez, J.A.; Brown, T.C. Trends in pan evaporation and actual evapotranspiration across the conterminous U.S.: Paradoxical or complementary? Geophys. Res. Lett. 2004, 31, 405–407. [Google Scholar] [CrossRef]
- Liu, X.; Luo, Y.; Zhang, D.; Zhang, M.; Liu, C. Recent changes in pan-evaporation dynamics in China. Geophys. Res. Lett. 2011, 38, 142–154. [Google Scholar] [CrossRef]
- Mcvicar, T.R.; Roderick, M.L.; Donohue, R.J.; Li, L.T.; Niel, T.G.V.; Thomas, A.; Grieser, J.; Jhajharia, D.; Himri, Y.; Mahowald, N.M. Global review and synthesis of trends in observed terrestrial near-surface wind speeds: Implications for evaporation. J. Hydrol. 2012, 416–417, 182–205. [Google Scholar] [CrossRef]
- Zhang, D.; Hong, H.; Zhang, Q.; Nie, R. Effects of climatic variation on pan-evaporation in the Poyang lake basin, China. Clim. Res. 2014, 61, 29–40. [Google Scholar] [CrossRef]
- Sun, S.; Chen, H.; Ju, W.; Yu, M.; Hua, W.; Yin, Y. On the attribution of the changing hydrological cycle in Poyang lake basin, china. J. Hydrol. 2014, 514, 214–225. [Google Scholar] [CrossRef]
- Xu, C.Y.; Gong, L.; Jiang, T.; Chen, D.; Singh, V.P. Analysis of spatial distribution and temporal trend of reference evapotranspiration and pan evaporation in Changjiang (Yangtze river) catchment. J. Hydrol. 2006, 327, 81–93. [Google Scholar] [CrossRef]
- Zhang, D.; Liu, X.; Hong, H. Assessing the effect of climate change on reference evapotranspiration in China. Stoch. Environ. Res. Risk Assess. 2013, 27, 1871–1881. [Google Scholar] [CrossRef]
- Vicente-Serrano, S.M.; Azorin-Molina, C.; Sanchez-Lorenzo, A.; Revuelto, J.; Morán-Tejeda, E.; López-Moreno, J.I.; Espejo, F. Sensitivity of reference evapotranspiration to changes in meteorological parameters in Spain (1961–2011). Water Resour. Res. 2015, 50, 8458–8480. [Google Scholar] [CrossRef]
- Liu, W.; Sun, F. Assessing estimates of evaporative demand in climate models using observed pan evaporation over China. J. Geophys. Res. Atmos. 2016, 121, 8329–8349. [Google Scholar] [CrossRef]
- Sun, S.; Chen, H.; Sun, G.; Ju, W.; Wang, G.; Li, X.; Yan, G.; Gao, C.; Huang, J.; Zhang, F. Attributing the changes in reference evapotranspiration in southwest China using a new separation method. J. Hydrometeorol. 2017, 18, 777–798. [Google Scholar] [CrossRef]
- Fisher, J.B.; Whittaker, R.J.; Malhi, Y. Et come home: Potential evapotranspiration in geographical ecology. Glob. Ecol. Biogeogr. 2015, 20, 1–18. [Google Scholar] [CrossRef]
- Pereira, L.S.; Allen, R.G.; Smith, M.; Raes, D. Crop evapotranspiration estimation with fao56: Past and future. Agric. Water Manag. 2015, 147, 4–20. [Google Scholar] [CrossRef]
- Kool, D.; Agam, N.; Lazarovitch, N.; Heitman, J.L.; Sauer, T.J.; Bengal, A. A review of approaches for evapotranspiration partitioning. Agric. For. Meteorol. 2014, 184, 56–70. [Google Scholar] [CrossRef]
- Wang, K.; Dickinson, R.E. A review of global terrestrial evapotranspiration: Observation, modeling, climatology, and climatic variability. Rev. Geophys. 2012, 50, RG2005. [Google Scholar] [CrossRef]
- Garcia, M.; Raes, D.; Allen, R.; Herbas, C. Dynamics of reference evapotranspiration in the Bolivian highlands (Altiplano). Agric. For. Meteorol. 2004, 125, 67–82. [Google Scholar] [CrossRef]
- Liu, X.; Zhang, D. Trend analysis of reference evapotranspiration in northwest China: The roles of changing wind speed and surface air temperature. Hydrol. Process. 2013, 27, 3941–3948. [Google Scholar] [CrossRef]
- Vicente-Serrano, S.M.; Azorin-Molina, C.; Sanchez-Lorenzo, A.; Revuelto, J.; López-Moreno, J.I.; González-Hidalgo, J.C.; Moran-Tejeda, E.; Espejo, F. Reference evapotranspiration variability and trends in Spain, 1961–2011. Glob. Planet. Chang. 2014, 121, 26–40. [Google Scholar] [CrossRef]
- Sun, S.; Chen, H.; Wang, G.; Li, J.; Mu, M.; Yan, G.; Xu, B.; Huang, J.; Wang, J.; Zhang, F. Shift in potential evapotranspiration and its implications for dryness/wetness over southwest China. J. Geophys. Res. Atmos. 2016, 121, 9342–9355. [Google Scholar] [CrossRef]
- Litvak, E.; Manago, K.F.; Hogue, T.S.; Pataki, D.E. Evapotranspiration of urban landscapes in Los Angeles, California at the municipal scale. Water Resour. Res. 2017, 53, 4236–4252. [Google Scholar] [CrossRef]
- Han, S.; Xu, D.; Wang, S. Decreasing potential evaporation trends in China from 1956 to 2005: Accelerated in regions with significant agricultural influence? Agric. For. Meteorol. 2012, 154–155, 44–56. [Google Scholar] [CrossRef]
- Ye, X.; Wei, Y.D. Geospatial analysis of regional development in china: The case of Zhejiang province and the Wenzhou model. Eurasian Geogr. Econ. 2005, 46, 445–464. [Google Scholar] [CrossRef]
- Xu, Y.P.; Pan, S.; Fu, G.; Tian, Y.; Zhang, X. Future potential evapotranspiration changes and contribution analysis in Zhejiang province, east China. J. Geophys. Res. Atmos. 2014, 119, 2174–2192. [Google Scholar] [CrossRef]
- Pan, S.; Gao, X.; Ma, C.; Zhang, X.; Xu, Y. A Total-order Sensitivity Analysis of Potential Evapotranspiration in Shengsi Islands. China Rural Water Hydropower 2014, 35–38. (In Chinese) [Google Scholar] [CrossRef]
- Ye, H.; Shi, X.; Li, D.; Xu, Z. Spatiotemporal characteristics of agricultural climate resources in Zhejiang Province. Acta Agric. Zhejiangensis 2014, 26, 1021–1030. (In Chinese) [Google Scholar]
- Zhang, F. Zhejiang Province is the first place in the whole country to build awell-off society. Stat. Sci. Pract. 2006, 8, 4–6. (In Chinese) [Google Scholar]
- Ge, Q.S.; Guo, X.F.; Zheng, J.Y.; Hao, Z.X. Meiyu in the middle and lower reaches of the Yangtze River since 1736. Chin. Sci. Bull. 2008, 53, 107–114. [Google Scholar] [CrossRef]
- Yu, L.-N.; Lei, Y.; Cao, M.L.; Chen, C.X. Statistical analysis on the tropical cyclones affected and landfalled on Zhejiang in recent 58 years. J. Oceanogr. Taiwan Strait 2007, 2, 007. [Google Scholar]
- Feng, L.H.; Luo, G.Y. Analysis on fuzzy risk of landfall typhoon in Zhejiang province of China. Math. Comput. Simul. 2009, 79, 3258–3266. [Google Scholar] [CrossRef]
- Yang, Z.; Jin, X. Effects of input of land resource on economic growth based on panal data-A case of Zhejiang province. Yangtze River Watershed Resour. Environ. 2009, 18, 409–415. (In Chinese) [Google Scholar]
- Global Land Cover Facility. Available online: ftp://ftp.glcf.umd.edu/glcf/SRTM (accessed on 10 October 2017).
- Allen, R.G.; Pereira, L.S.; Raes, D.; Smith, M. Crop evapotranspiration—Guidelines for computing crop water requirements—FAO irrigation and drainage paper 56. FAO Rome 1998, 300, 1–15. [Google Scholar]
- Feng, Z.; Tang, Y.; Yang, Y.; Zhang, D. The Relief Degree of Land Surface in China and Its Correlation with Population Distribution. Acta Geogr. Sin. 2007, 10, 1073–1082. (In Chinese) [Google Scholar]
- Roering, J.J.; Kirchner, J.W.; Dietrich, W.E. Characterizing structural and lithologic controls on deep-seated landsliding: Implications for topographic relief and landscape evolution in the oregon coast range, USA. Geol. Soc. Am. Bull. 2005, 117, 654–668. [Google Scholar] [CrossRef]
- Reed, D.; Anderson, T.; Dempewolf, J.; Metzger, K.; Serneels, S. The spatial distribution of vegetation types in the serengeti ecosystem: The influence of rainfall and topographic relief on vegetation patch characteristics. J. Biogeogr. 2009, 36, 770–782. [Google Scholar] [CrossRef]
- Zhu, H.; Chen, N.; Liu, H.; Tang, G. Extracting landform fluctuate degree from 1:10,000 scale DEM—A scale of Shanbei plateau. Sci. Surv. Mapp. 2005, 30, 86–88. (In Chinese) [Google Scholar]
- Vautard, R.; Cattiaux, J.; Yiou, P.; Thépaut, J.-N.; Ciais, P. Northern hemisphere atmospheric stilling partly attributed to an increase in surface roughness. Nat. Geosci. 2010, 3, 756–761. [Google Scholar] [CrossRef]
- McVicar, T.R.; Roderick, M.L. Atmospheric science: Winds of change. Nat. Geosci. 2010, 3, 747–748. [Google Scholar] [CrossRef]
- Wang, Y.; Di Sabatino, S.; Martilli, A.; Li, Y.; Wong, M.; Gutiérrez, E.; Chan, P. Impact of land surface heterogeneity on urban heat island circulation and sea-land breeze circulation in Hong Kong. J. Geophys. Res. Atmos. 2017, 122, 4332–4352. [Google Scholar] [CrossRef]
- Sequera, P.; González, J.E.; McDonald, K.; LaDochy, S.; Comarazamy, D. Improvements in land-use classification for estimating daytime surface temperatures and sea-breeze flows in southern California. Earth Interact. 2016, 20, 1–32. [Google Scholar] [CrossRef]
- Lin, C.; Yang, K.; Huang, J.; Tang, W.; Qin, J.; Niu, X.; Chen, Y.; Chen, D.; Lu, N.; Fu, R. Impacts of wind stilling on solar radiation variability in China. Sci. Rep. 2015, 5, 15135. [Google Scholar] [CrossRef] [PubMed]
Figure 1.
Sketch map of the study area.
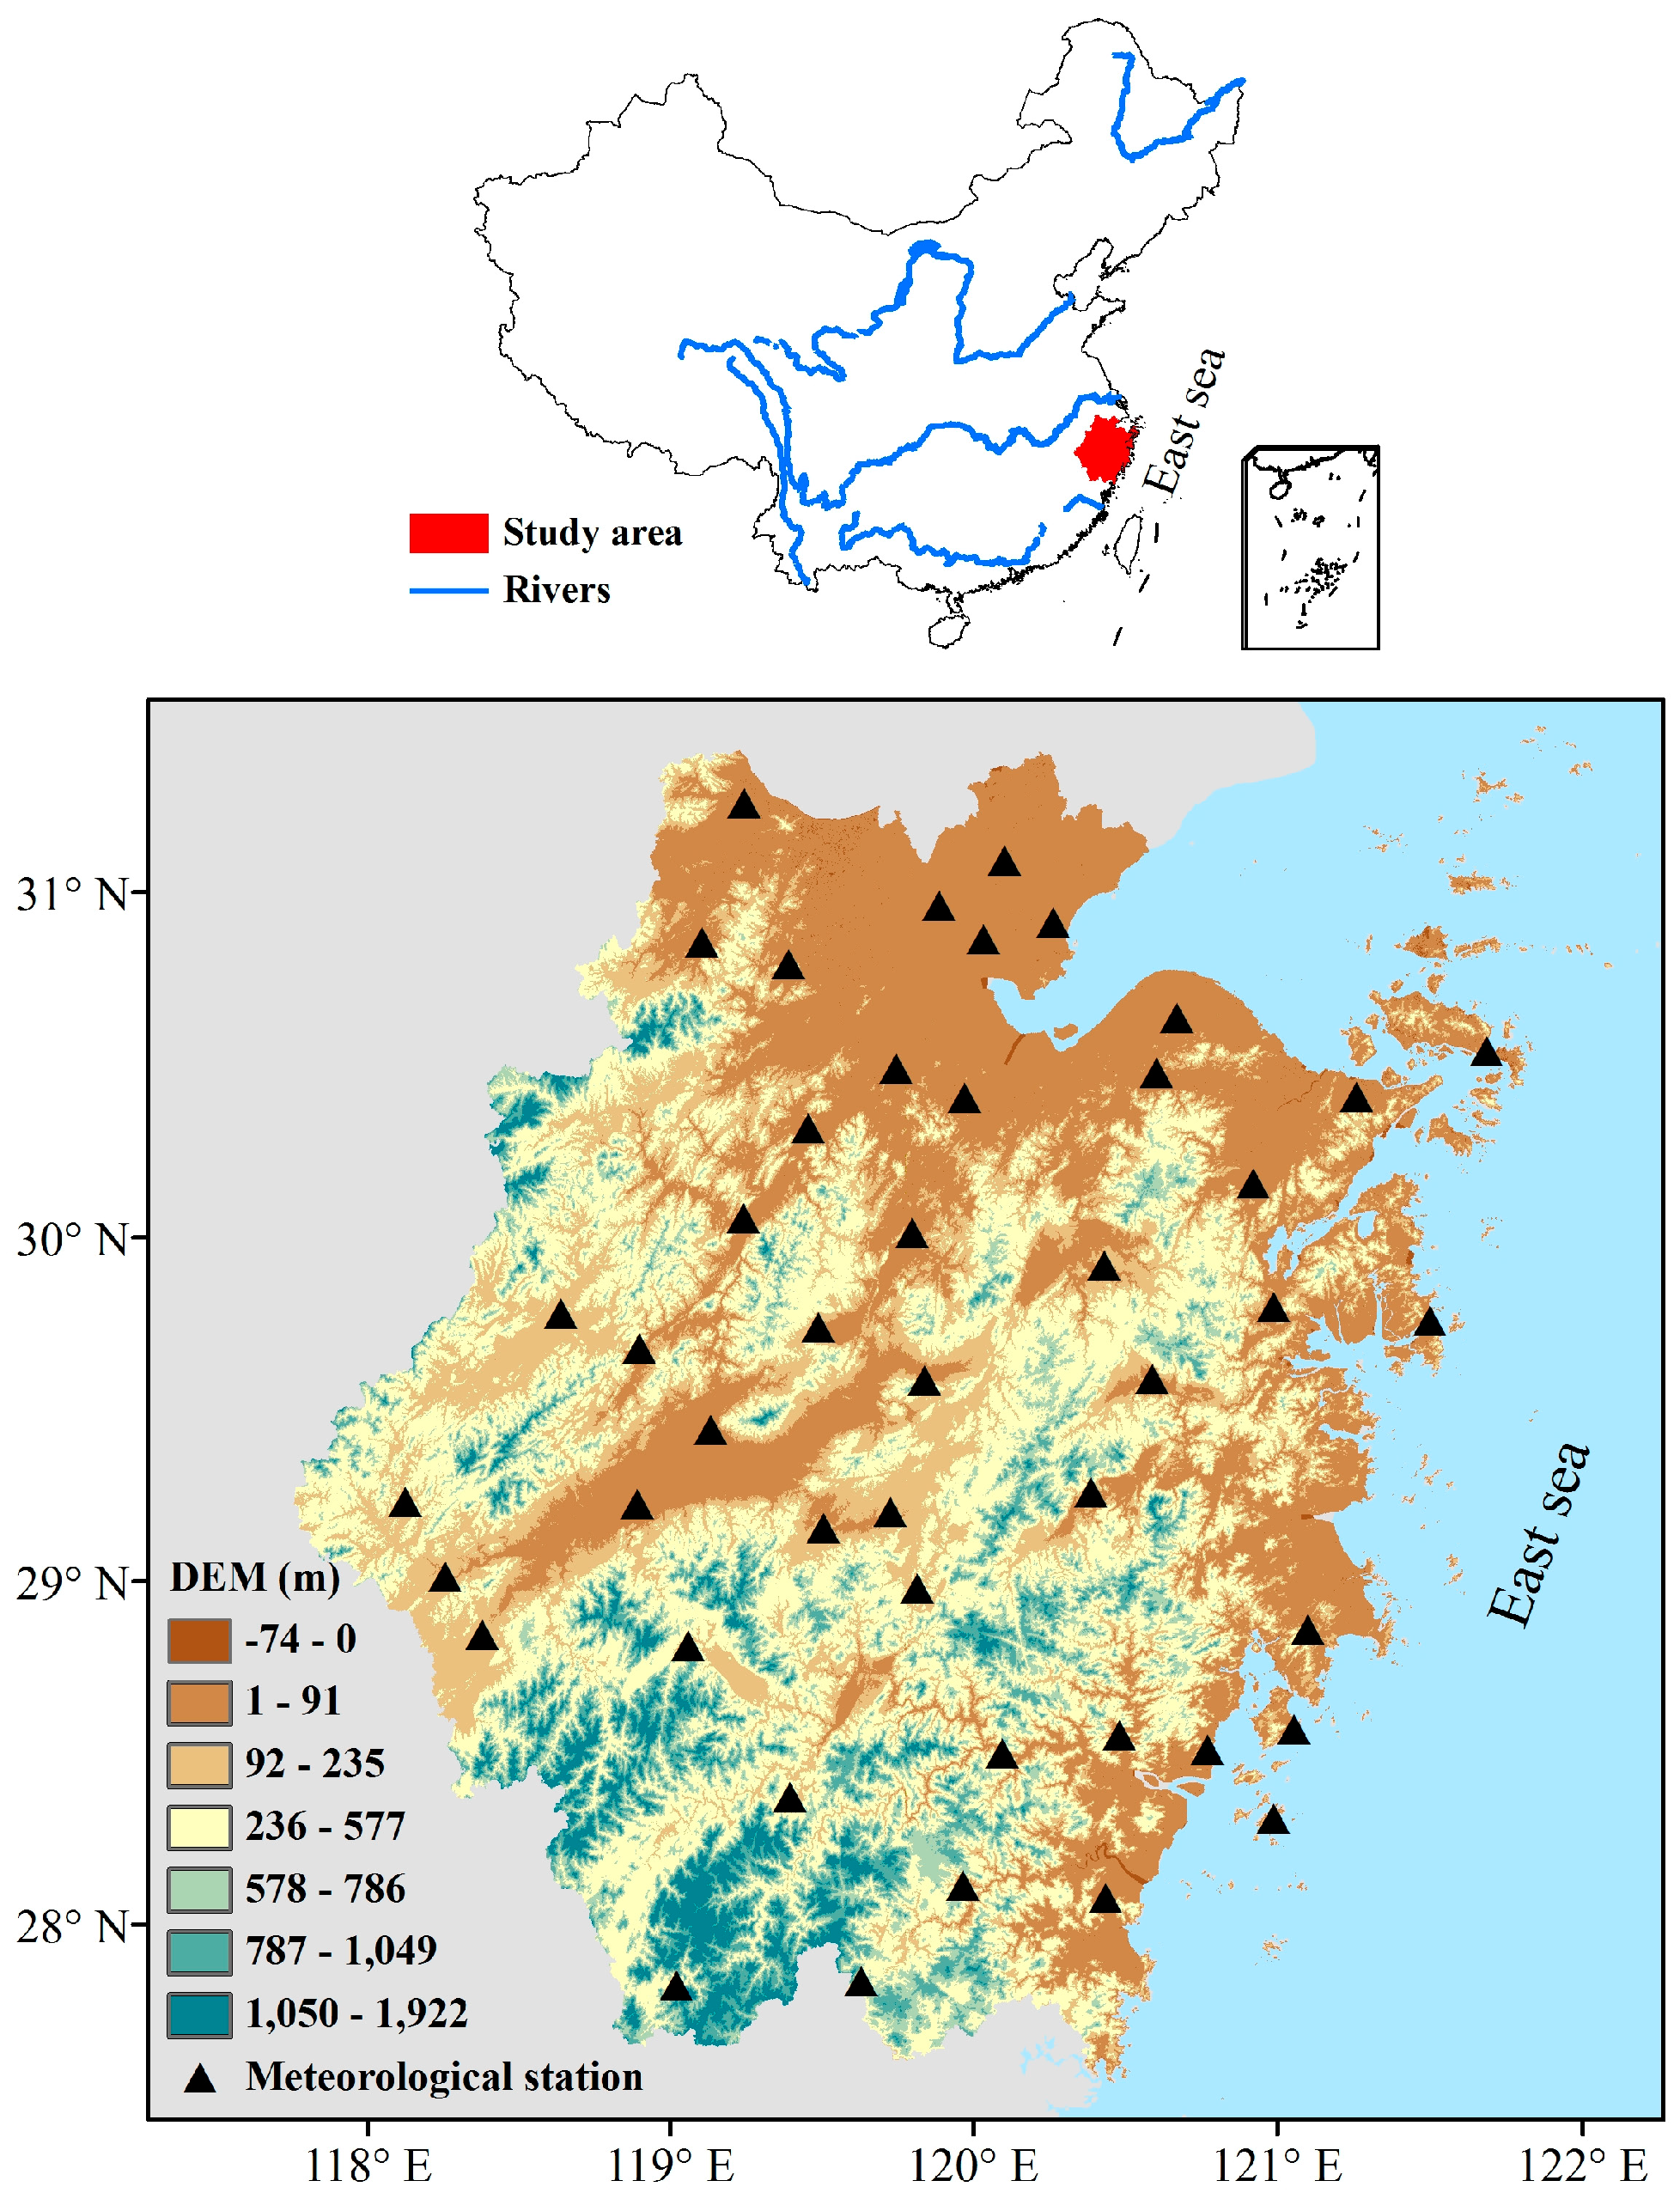
Figure 2.
(a) Significance of changes in annual ET0 at 46 meteorological stations in Zhejiang Province from 1973 to 2013. S and NS in the figure legend indicate significance and insignificance at p = 0.05, respectively. The numbers given after S or NS indicate the number of stations out of 46 stations that fall these categories; (b) Slopes in annual ET0 at 46 meteorological stations.

Figure 3.
Trends in ET0 at 46 meteorological stations in Zhejiang Province from 1973 to 2013 in (a) spring; (b) summer; (c) autumn and (d) winter.
Figure 3.
Trends in ET0 at 46 meteorological stations in Zhejiang Province from 1973 to 2013 in (a) spring; (b) summer; (c) autumn and (d) winter.

Figure 4.
Trends in (a) air temperature (°C·year−1); (b) wind speed (m/s·year−1); (c) water vapor pressure deficits (kPa·year−1) and (d) solar radiation (MJ·m−2·day−1·year−1) from 1973 to 2013 at 46 meteorological stations in Zhejiang Province.
Figure 4.
Trends in (a) air temperature (°C·year−1); (b) wind speed (m/s·year−1); (c) water vapor pressure deficits (kPa·year−1) and (d) solar radiation (MJ·m−2·day−1·year−1) from 1973 to 2013 at 46 meteorological stations in Zhejiang Province.

Figure 5.
Relationships between trends in ET0 by the control test, as well as accumulated trends in ET0 by the four sensitivity tests.
Figure 5.
Relationships between trends in ET0 by the control test, as well as accumulated trends in ET0 by the four sensitivity tests.
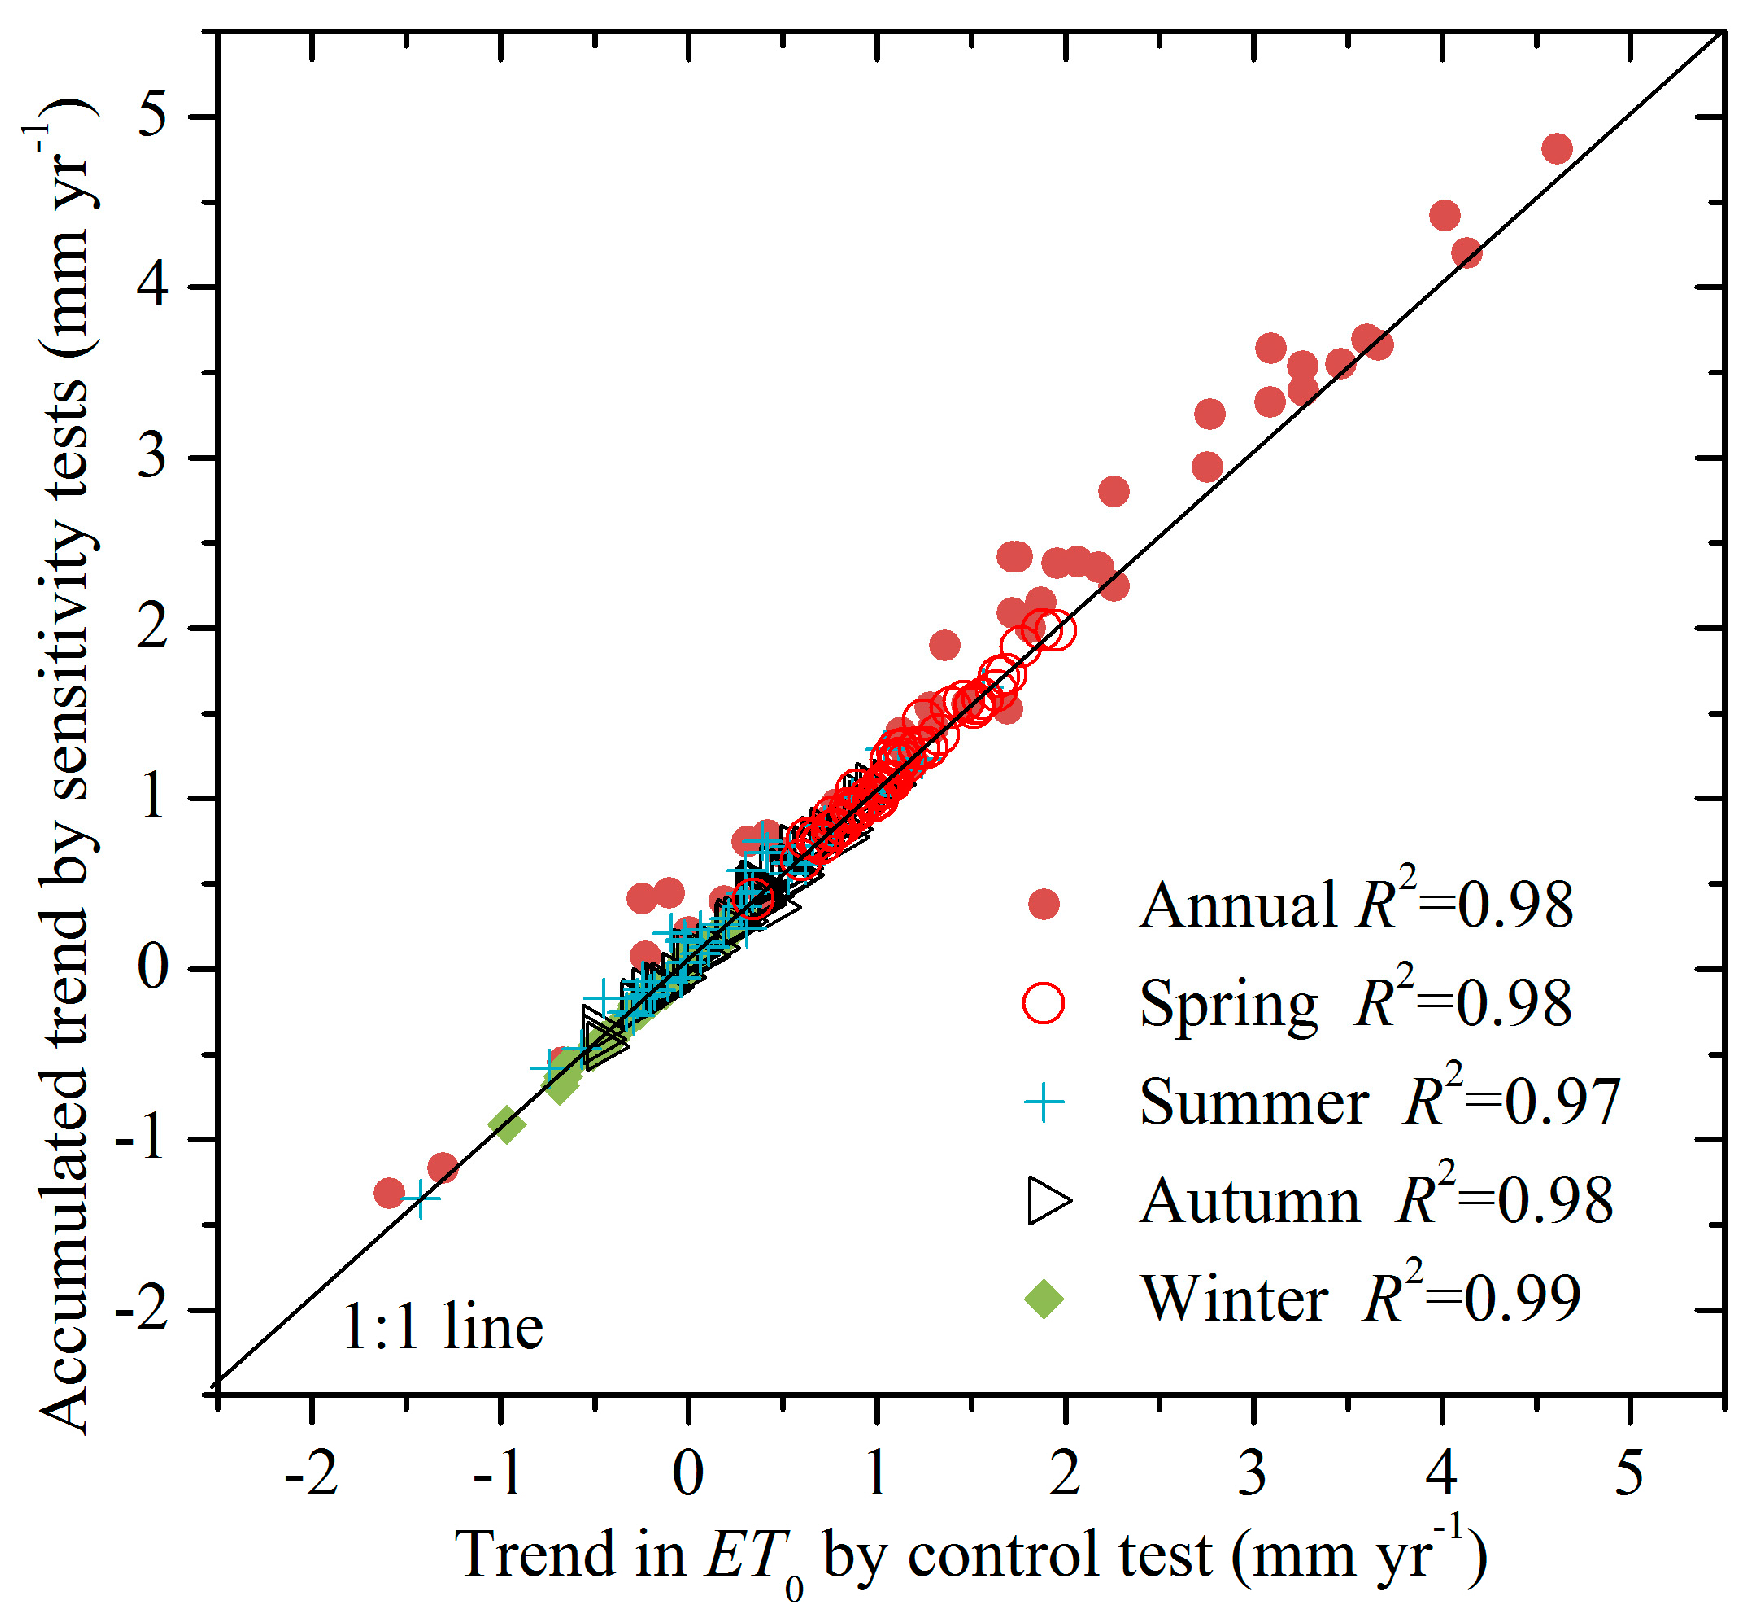
Figure 6.
Contribution of climatic variations to changes in annual ET0 at 46 stations in Zhejiang province.
Figure 6.
Contribution of climatic variations to changes in annual ET0 at 46 stations in Zhejiang province.
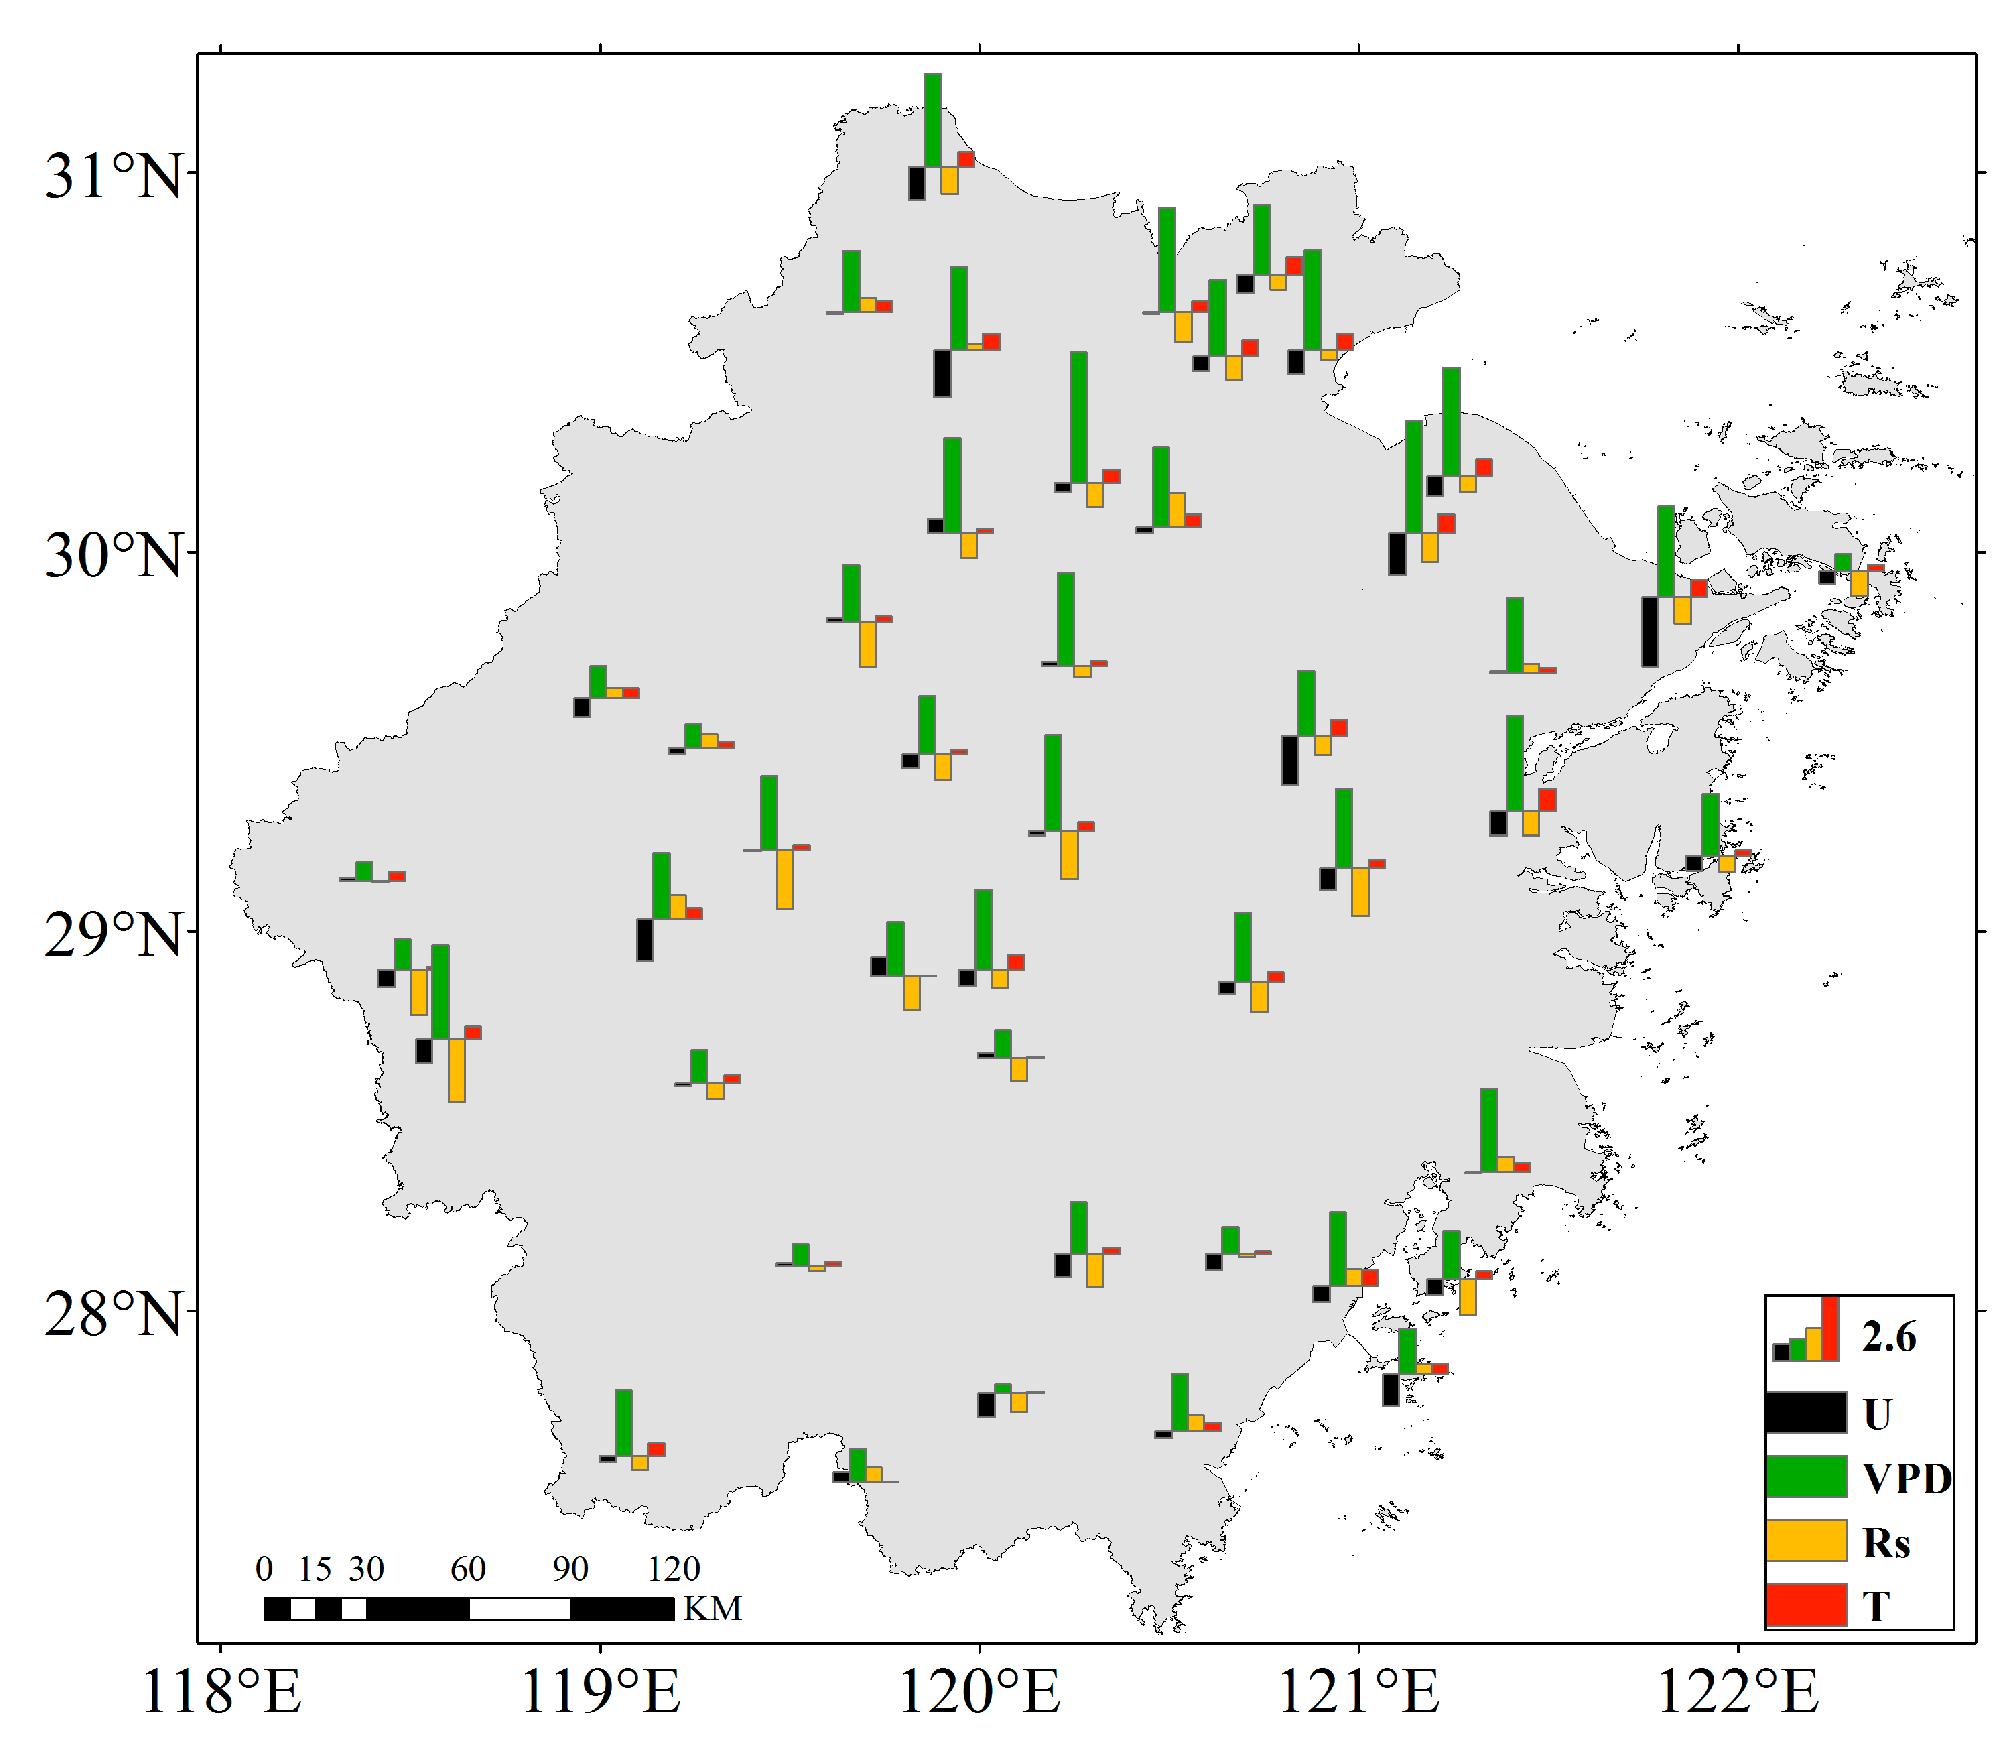
Figure 7.
The same as Figure 6, but for (a) spring; (b) summer; (c) autumn and (d) winter.
Figure 7.
The same as Figure 6, but for (a) spring; (b) summer; (c) autumn and (d) winter.

Figure 8.
Comparisons of ET0 and its contributions for the (a) plain category and (b) hill category.
Figure 8.
Comparisons of ET0 and its contributions for the (a) plain category and (b) hill category.
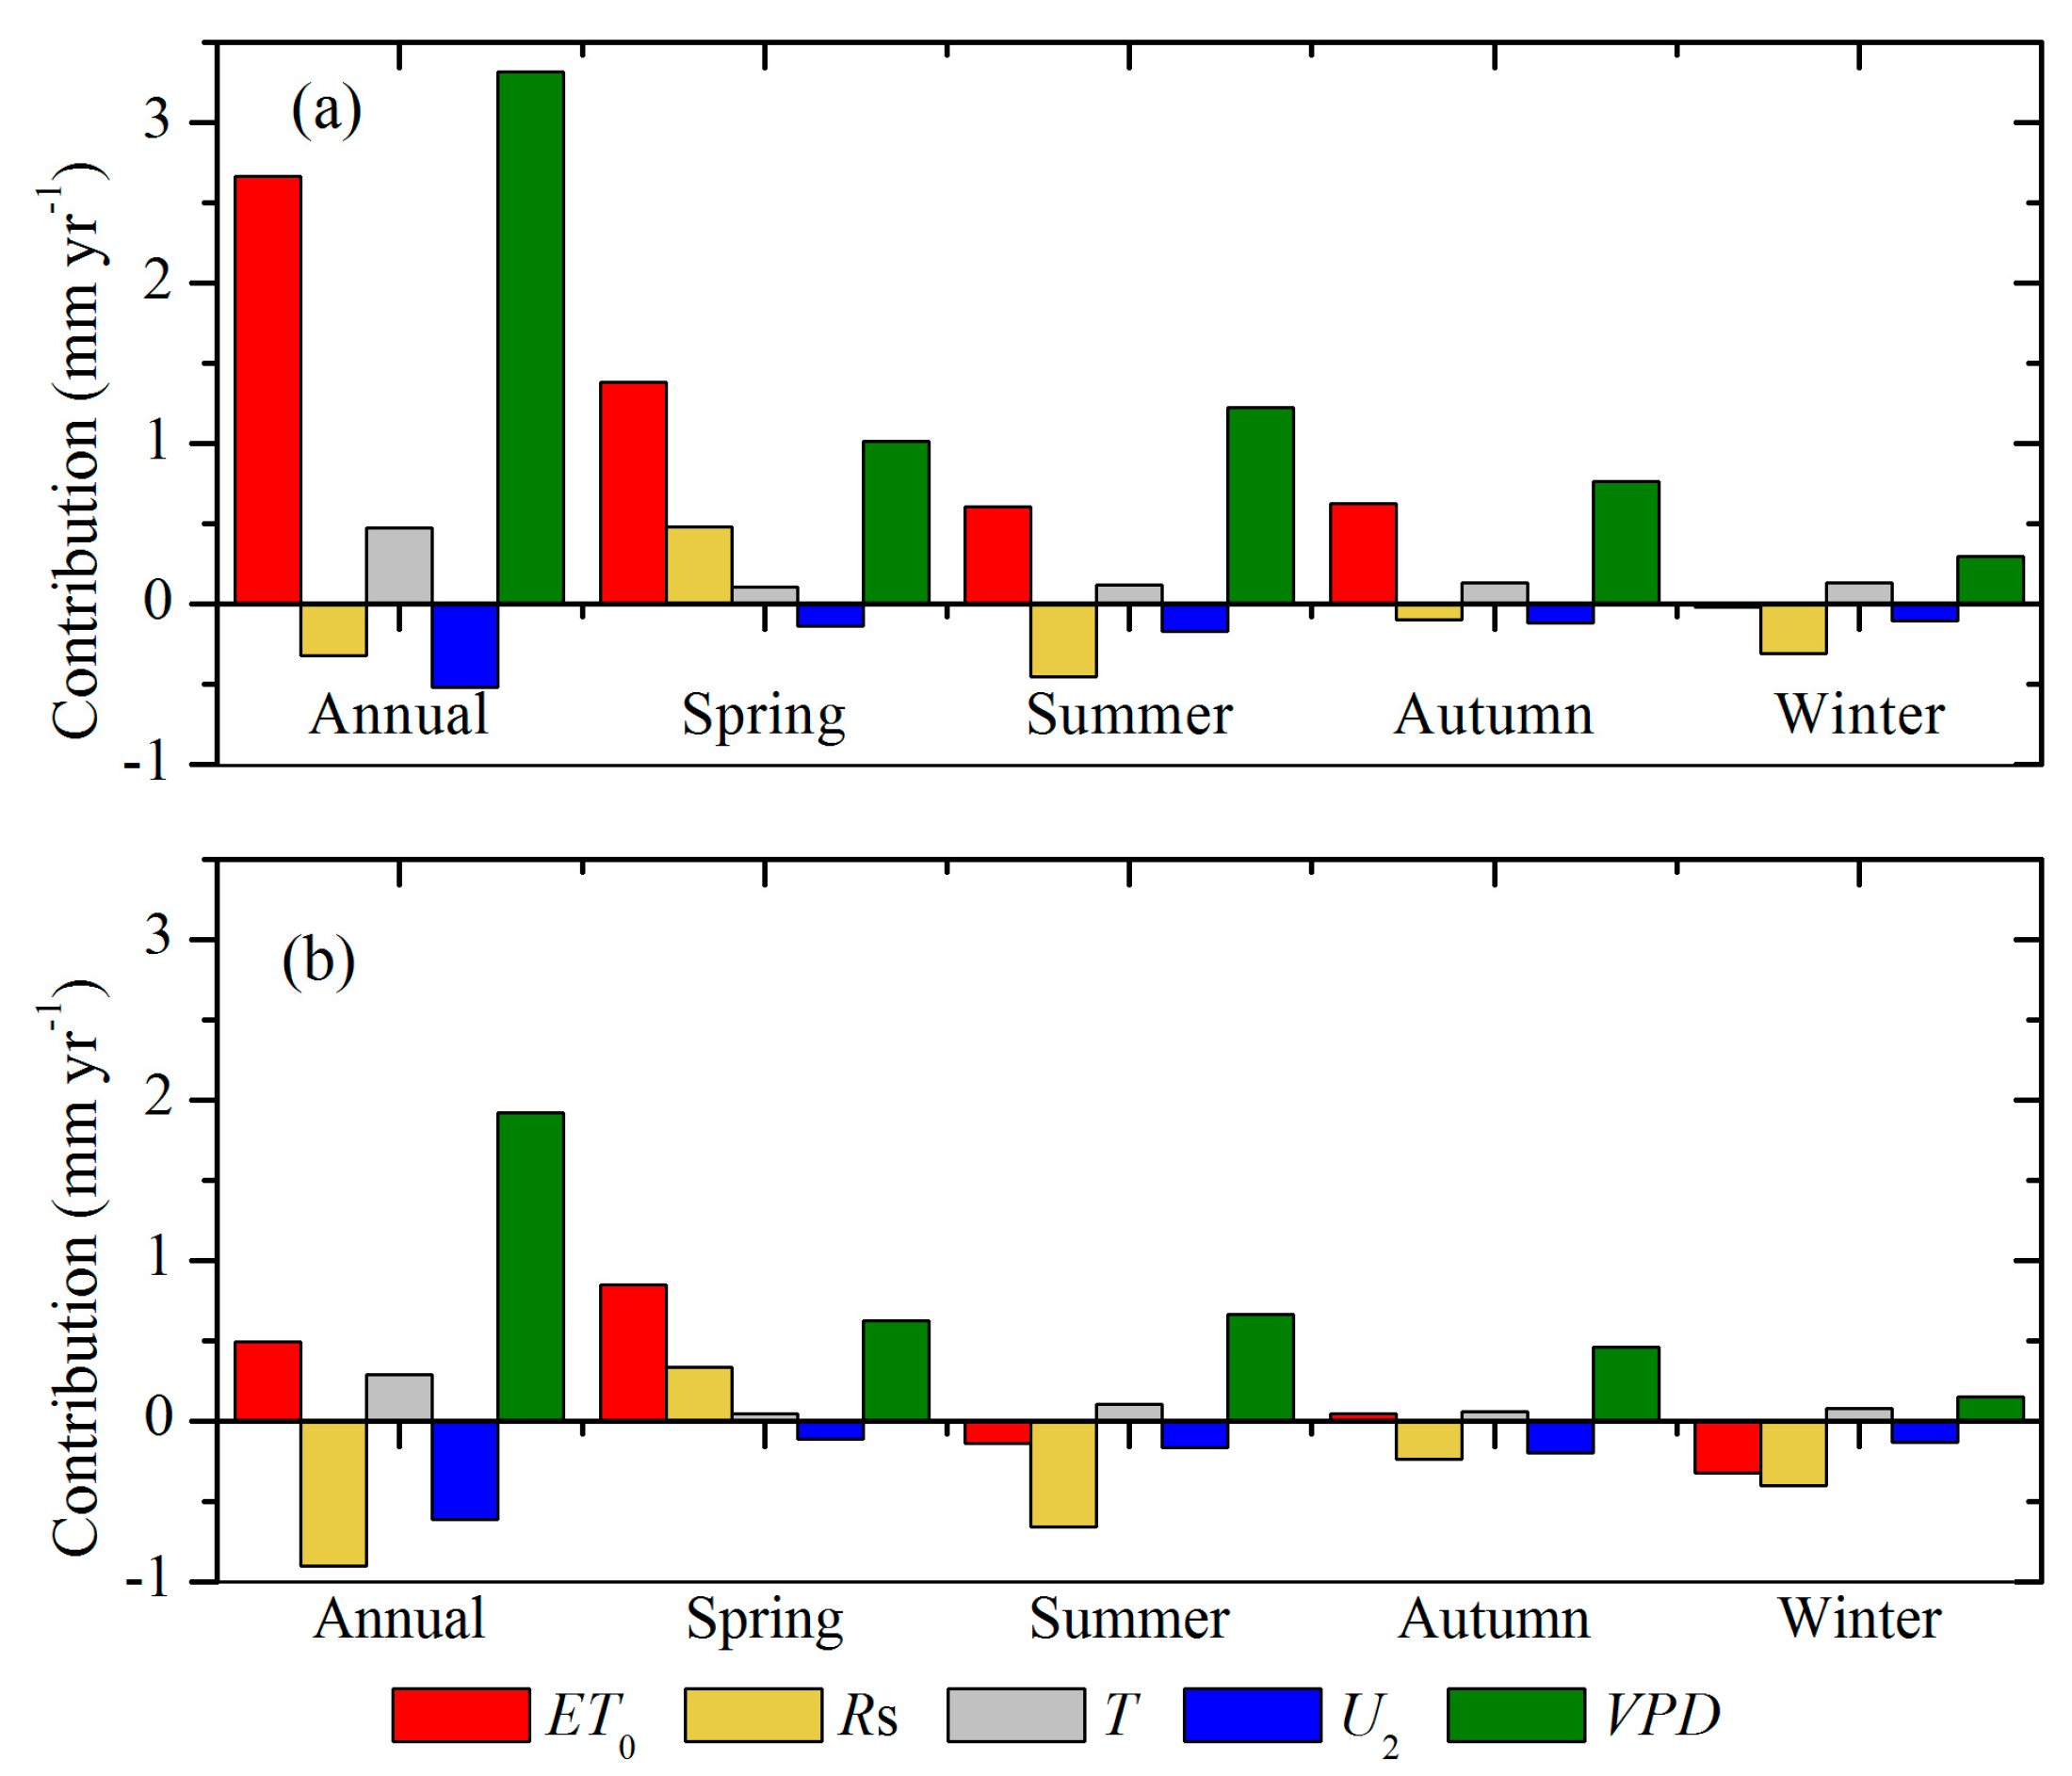
Figure 9.
Comparisons of (a) solar radiation, (b) air temperature, (c) wind speed and (d) water vapor pressure deficits variations for the plain category (orange bar) and the hill category (gray bar).
Figure 9.
Comparisons of (a) solar radiation, (b) air temperature, (c) wind speed and (d) water vapor pressure deficits variations for the plain category (orange bar) and the hill category (gray bar).


Table 1.
Numerical experiment design for ET0 contribution.
| Experiment | Description |
|---|---|
| Control Test: ET0_CTR | air temperature, solar radiation, wind speed, actual vapor pressure from 1973–2013 |
| Temperature Test: ET0_T | air temperature maintained in 1973, the others same as the control test |
| Solar radiation Test: ET0_Rs | solar radiation maintained in 1973, the others same as the control test |
| Wind speed Test: ET0_U2 | wind speed maintained in 1973, the others same as the control test |
| Actual vapor pressure Test: ET0_VPD | water vapor pressure deficits maintained in 1973, the others same as the control test |
Table 2.
Trends in ET0 and climate variables in the study area during the period of 1973–2013.
| Variable | Annual | Spring | Summer | Autumn | Winter |
|---|---|---|---|---|---|
| ET0 (mm·year−1) | 1.58 * | 1.12 * | 0.23 | 0.34 | −0.17 |
| T (°C·year−1) | 0.04 * | 0.04 * | 0.03 * | 0.03 * | 0.03 * |
| U2 (m/s·year−1) | −0.01 * | −0.01 * | −0.01 * | −0.01 * | −0.01 * |
| VPD (kPa·year−1) | 0.005 * | 0.006 * | 0.009 * | 0.005 * | 0.001 * |
| Rs (MJ·m−2·day−1·year−1) | −3.94 * | 1.37 | −2.43 * | −1.05 | −1.84 * |
Note: * means the slope is significant at the level of 0.05 by t-test.
Table 3.
Number of stations (out of 46 stations) with ET0 and climate variables changes at annual and seasonal time scales.
Table 3.
Number of stations (out of 46 stations) with ET0 and climate variables changes at annual and seasonal time scales.
| Time | Trend | ET0 | T | U2 | VPD | Rs |
|---|---|---|---|---|---|---|
| Annual | Upward | 39(24) | 46(46) | 11(4) | 46(45) | 12(0) |
| Downward | 7(1) | 0 | 35(29) | 0 | 34(26) | |
| Spring | Upward | 46(45) | 46(45) | 11(3) | 46(46) | 42(14) |
| Downward | 0 | 0 | 35(27) | 0 | 4(0) | |
| Summer | Upward | 28(5) | 46(45) | 14(4) | 46(45) | 3(0) |
| Downward | 18(1) | 0 | 32(23) | 0 | 43(24) | |
| Autumn | Upward | 35(16) | 46(45) | 14(5) | 46(44) | 9(0) |
| Downward | 11(0) | 0 | 32(23) | 0 | 37(13) | |
| Winter | Upward | 11(0) | 46(27) | 10(3) | 43(35) | 0 |
| Downward | 35(8) | 0 | 36(30) | 3(0) | 46(33) |
Note: the number in the brackets indicates the number of stations where its trend is significant at the level of 0.05 by t-test.
Table 4.
Contributions of climate variations to ET0 changes in Zhejiang province during the period from 1973 to 2013.
Table 4.
Contributions of climate variations to ET0 changes in Zhejiang province during the period from 1973 to 2013.
| Variable | Annual | Spring | Summer | Autumn | Winter | |
|---|---|---|---|---|---|---|
| Contribution (mm·year−1) | ET0 | 1.58 | 1.12 | 0.29 | 0.34 | −0.17 |
| T | 0.39 | 0.08 | 0.11 | 0.10 | 0.11 | |
| U2 | −0.56 | −0.12 | −0.17 | −0.16 | −0.12 | |
| VPD | 2.62 | 0.82 | 0.95 | 0.61 | 0.22 | |
| Rs | −0.61 | 0.41 | −0.55 | −0.17 | −0.35 | |
| Error | −0.26 | −0.07 | −0.05 | −0.04 | −0.03 | |
| Relative contribution (%) | T | 24.7 | 7.1 | 37.9 | 29.4 | −64.7 |
| U2 | −35.4 | −10.7 | −58.6 | −47.1 | 70.6 | |
| VPD | 165.8 | 73.2 | 327.6 | 179.4 | −129.4 | |
| Rs | −38.6 | 36.6 | −189.7 | −50.0 | 205.9 | |
| Error | −16.5 | −6.2 | −17.2 | −11.8 | 17.6 |
© 2018 by the authors. Licensee MDPI, Basel, Switzerland. This article is an open access article distributed under the terms and conditions of the Creative Commons Attribution (CC BY) license (http://creativecommons.org/licenses/by/4.0/).
Share and Cite
MDPI and ACS Style
Gu, R.; Zhang, D.; Liao, A.; Shen, H.; Zhao, X.; Pan, J. On the Attribution of Changing Reference Evapotranspiration in a Coastal Area of China. Atmosphere 2018, 9, 9. https://doi.org/10.3390/atmos9010009
AMA Style
Gu R, Zhang D, Liao A, Shen H, Zhao X, Pan J. On the Attribution of Changing Reference Evapotranspiration in a Coastal Area of China. Atmosphere. 2018; 9(1):9. https://doi.org/10.3390/atmos9010009
Chicago/Turabian StyleGu, Renying, Dan Zhang, Anhua Liao, Huayu Shen, Xiaotong Zhao, and Jingru Pan. 2018. "On the Attribution of Changing Reference Evapotranspiration in a Coastal Area of China" Atmosphere 9, no. 1: 9. https://doi.org/10.3390/atmos9010009
Note that from the first issue of 2016, this journal uses article numbers instead of page numbers. See further details here.