Article

Improvement in the Modeled Representation of North American Monsoon Precipitation Using a Modified Kain–Fritsch Convective Parameterization Scheme

1
Physical Science and Engineering Division, King Abdullah University of Science and Technology, Thuwal 23955, Saudi Arabia
2
Department of Hydrology and Atmospheric Sciences, University of Arizona, Tucson, AZ 85721, USA
3
Department of Meteorology, Hanoi University of Science, Hanoi 10000, Vietnam
*
Author to whom correspondence should be addressed.
Atmosphere 2018, 9(1), 31; https://doi.org/10.3390/atmos9010031
Submission received: 26 November 2017 / Revised: 8 January 2018 / Accepted: 10 January 2018 / Published: 19 January 2018
(This article belongs to the Special Issue WRF Simulations at the Mesoscale: From the Microscale to Macroscale)

Abstract

:
A commonly noted problem in the simulation of warm season convection in the North American monsoon region has been the inability of atmospheric models at the meso-β scales (10 s to 100 s of kilometers) to simulate organized convection, principally mesoscale convective systems. With the use of convective parameterization, high precipitation biases in model simulations are typically observed over the peaks of mountain ranges. To address this issue, the Kain–Fritsch (KF) cumulus parameterization scheme has been modified with new diagnostic equations to compute the updraft velocity, the convective available potential energy closure assumption, and the convective trigger function. The scheme has been adapted for use in the Weather Research and Forecasting (WRF). A numerical weather prediction-type simulation is conducted for the North American Monsoon Experiment Intensive Observing Period 2 and a regional climate simulation is performed, by dynamically downscaling. In both of these applications, there are notable improvements in the WRF model-simulated precipitation due to the better representation of organized, propagating convection. The use of the modified KF scheme for atmospheric model simulations may provide a more computationally economical alternative to improve the representation of organized convection, as compared to convective-permitting simulations at the kilometer scale or a super-parameterization approach.

1. Introduction

The North American monsoon (NAM) is the principal driver of summertime severe weather in the Southwest U.S. Given sufficient atmospheric instability and moisture, monsoon thunderstorms typically initiate during daytime over the highest terrain in association with the mountain-valley circulations. Given favorable dynamic conditions of vertical wind shear and synoptic-scale upward motion, these thunderstorms may organize into mesoscale convective systems (MCSs) that propagate off the terrain in the direction of the upper-level steering flow [1,2,3]. During these types of monsoon burst periods convective precipitation associated with MCSs tends to propagate from the high terrain into the low deserts [4]. For example, the convective environment is much more favorable for MCSs to reach the urban areas of Tucson and Phoenix and westward into the low southwest deserts and the Colorado River valley. Monsoon-related severe weather hazards are most favored during these periods, and include microbursts, dust storms, flash flooding and lightning [5,6,7].
Though there are synoptic-scale dynamical features that facilitate convective organization during these monsoon burst periods, in particular transient inverted troughs [8,9,10,11], the convection itself occurs on the meso-γ scale [12] with a spatial extent on the order of one to tens of kilometers. Development of monsoon convection is strongly tied to a diurnal cycle, with air-mass type thunderstorms forming over the highest terrain in early to mid-afternoon [13]. On the days when organized convection occurs, convective outflow boundaries and their convergence zones may initiate new lines of convection [4,14,15]. Gulf surges, or pulses of low-level moisture from the Gulf of California, are also typical during monsoon burst periods and enhance the low-level atmospheric moisture necessary to sustain organized convection west of the Mogollon Rim in Arizona [16,17,18]. Propagating MCSs may be relatively long-lived, persisting for more than several hours into the evening and early morning [15,19,20].
Numerical atmospheric models can be used to represent monsoon convection. However, as we discuss in [21] with reference to the warm season in the western and central United States, regional models used at spatial resolution on the order of tens of kilometers, or the meso-β scale, have a particular spatial pattern of bias in their simulated precipitation. They tend to overestimate precipitation in areas of complex terrain and underestimate precipitation in areas with more homogeneous terrain, where organized convection accounts for a greater proportional of the precipitation. Coarse resolution of meso-α to meso-β numerical atmospheric models (whether they are global or regional) generally leads to a poor representation of the terrain-forced diurnal cycle of convection [22,23]. This also adversely affects models’ ability to represent organized, propagating convection, for example MCSs that occur during the North American monsoon as described in analyses of radar data [20,24]. The likely reasons why coarse-resolution models fail to represent the diurnal cycle well is because of their poor representation of terrain forcing, mesoscale meteorological features (e.g., gulf surges), land-atmosphere coupling, and, most importantly, parameterized convective precipitation. We have demonstrated in a prior work that a commonly used numerical atmospheric model, the Weather Research and Forecasting (WRF) model, is basically incapable of simulating a mesoscale convective system during an Intensive Observing Period of the North American Monsoon Experiment (NAME) with a ten-kilometer grid spacing [25]. These simulations used a parameterization configuration nominally similar to that of the quasi-operational WRF forecasting system at the Department of Hydrology and Atmospheric Sciences at the University of Arizona. This conclusion in [25] is consistent with other work that considered simulation of organized convection during NAME with either different regional atmospheric models and/or model domain and parameterization configurations [3,26].
A substantial body of work over the past thirty years has demonstrated the importance of the meso-γ-scale for simulation of convection, or the convective-permitting scale on the order of a kilometer [27,28,29,30,31]. At this scale, the dynamic pressure (or non-hydrostatic) effects within thunderstorms may be explicitly simulated, and these are critical to the evolution and movement and of organized convection. This would specifically include the structure of MCSs, with leading convective lines and trailing stratiform precipitation regions [25]. Meso-γ orographic effects on the dynamic structure of airflow over mountains have also been well documented. Doyle and Durran [32] depicted the formation of low-level rotors, horizontal vorticity, and waves propagating to upper levels caused by a 600 m high mountain. There are demonstrations of the presence of dynamic pressure perturbation which may be associated with flow and precipitation over complex terrain [33,34]. One possible alternative to convective-permitting simulations at the meso-γ is the technique of super-parameterization [35,36,37], in which a two-dimensional cloud-resolving model is essentially statistically imbedded within the grid cell of a coarser resolution model. The use of super-parameterization has been demonstrated to add value in organized convective processes in global climate models, for example producing a more realistic Madden Julian Oscillation in the tropics, as compared to a more traditional Arakawa–Schubert scheme [37,38]. More pertinent to this work, super-parameterization has demonstrated value added in improving the representation of MCS-driven convective precipitation in the central U.S. [39,40], but there are still uncertainties in the sensitivities of the microphysics formulation and the MCS-like signal they simulate is a ‘fledging one.’ The super-parameterization approach is also two to three orders of magnitude more expensive than current climate models [41].
It may be possible to modify existing commonly used cumulus parameterization schemes in atmospheric models to better represent organized convection, as opposed to convective-resolving simulations or super-parameterization, with the advantage of reduced computational expense. Our previous work in [42] proposed a modification to the Kain–Fritsch (KF) convective parameterization scheme (CPS) to better account for dynamic pressure effects in complex terrain for coarse-resolution, meso-β scale simulations. Specifically, that study modified the scheme with new diagnostic equations to compute the updraft velocity, the convective available potential energy (CAPE) closure assumption, and the convective trigger function. These modifications better account for dynamic pressure effects by taking the vertical gradient of the pressure perturbation into account. The modified KF CPS was initially incorporated into the Regional Atmospheric Modeling System (RAMS) and used to simulate an extreme heavy rainfall event from 24 to 26 November 2004 in the mountainous provinces of central Vietnam that resulted in severe flooding along local rivers. With the modified CPS, the model produced precipitation that was more consistent with available observed gauge data and satellite-derived precipitation estimates. Moreover, the modified KF CPS generated larger and deeper stratiform clouds, increased the resolved (non-convective) precipitation, and it better represented a large, well-developed MCS that covered the central portion of the country. It is important to note that these types of improvements are achieved at almost the same computational cost as with the use of the native KF scheme.
Though the study of [42] considered only one specific case, it highly motivates further testing of the modified KF CPS in environments of complex terrain where organized mesoscale convective systems are climatologically very important but relatively challenging to represent in a numerical atmospheric model. We investigate in this work whether the modified KF CPS applied in Vietnam may help alleviate some of the aforementioned problems in modeling organized convection in the North American monsoon region. The nature of North American monsoon precipitation in Mexico is somewhat similar to central Vietnam during their winter season (November–February). The crucial common characteristic, as relevant to this study, is the strong orographic effect on MCS-driven precipitation. Both regions: (1) have steeply sloped mountain ranges (Sierra Madre Occidental and Truong Son Mountains) in relative close proximity to a coastline (on the order of 100 km or less) and (2) are located near warm bodies of water (Eastern Pacific/Gulf of California and South China Sea) that provide a moisture source for convective precipitation. The monsoonal circulations force ascending motion on the windward side of the mountain ranges, facilitating the initiation of convection that organizes and propagates toward the coast. Relevant prior studies that describe the nature of monsoonal precipitation in central Vietnam in relation to orographic forcing include [43,44,45,46]. The overarching goal of this paper is to help demonstrate the value added of the modified KF simulation of MCS-type convection, specifically that initiates over complex terrain in a monsoonal circulation.
We will demonstrate the effectiveness of the modified KF CPS within the WRF model for a well-documented case of organized convection in the North American monsoon region. Specifically, the case we consider here is Intensive Observing Period (IOP) 2 from NAME, which has been previously studied with the use of a convective-permitting NWP-type simulation in [3,25]. These two works both show that the explicit representation of convection at the meso-γ scale, without the use of a convective parameterization, is necessary for a reasonable representation of a large, westward propagating MCS in the Mexican state of Sonora, which occurred during the IOP, and its associated outflow boundary that enhanced a gulf surge. In using the same simulation design as in [25], we aim to show that application of the modified KF CPS on the meso-β scale helps to better represent the physical structure of the MCS and its associated precipitation, in a similar way as the previously discussed Vietnam case.

2. Data Analysis and Methods

2.1. Overview of NAME Intensive Observing Period 2

We conduct our atmospheric model sensitivity experiments on the IOP 2 of the NAME during the summer of 2004. As we have summarized previously in [25] and basically restate here from that work in this sub-section, the Intensive Observing Periods (IOPs) are periods of higher frequency data collection that focus on specific meteorological features of interest during the monsoon, embedded within an overall enhanced observing period (EOP). Some specific scientific goals of the IOPs included better characterization and physical understanding of: (1) Mean moisture flux over the NAME Tier I region (basically northwest Mexico encompassing the Mexican states of Sonora, Sinaloa and part of Durango as well as southern Arizona in the U.S.); (2) the structure of the low-level jet in the Gulf of California; (3) the genesis and propagation of gulf surges; (4) middle and upper-level easterly inverted troughs; (5) inland penetration of the sea breeze and planetary boundary layer evolution and convective development over the Sierra Madres; and (6) the evolution of mesoscale convective systems. Potentially improved representation of organized convection in numerical atmospheric models is most closely aligned with the latter two of these NAME IOP science objectives.
Over the entire course of NAME, a total of ten IOPs were called. The detailed weather forecast and post-event discussions are maintained on the NAME website [47]. IOP 2, which took place from 11 July 2004 to 14 July 2004, is the most important of the IOPs considered, and has been the most comprehensively investigated [2,3,25,48]. Therefore, our results presented in Section 3 will be for this event. IOP 2 was the first major outbreak of organized convection during the 2004 season, and heralded the (climatologically late) onset of the monsoon in Arizona. It had a major gulf surge triggered by the passage of a tropical cyclone (Blas) near the southern end of the Gulf of California, an inverted trough located just east of the core monsoon region, and well organized MCSs in both Sonora and Arizona that propagated all the way to the Colorado River Valley and Gulf of California over multiple days. Analysis of the NAME-generated observational datasets and convective-resolving simulations considering IOP 2, from aforementioned references, have demonstrated: (1) The importance of northeasterly flow and anomalous northeasterly shear, due to the presence of the inverted trough, in creating an environment favorable for convective organization, and (2) the influence of MCSs in strengthening Gulf surges, through their convective outflow boundaries.

2.2. Regional Atmospheric Model Simulation Design for NAME IOP 2

The IOP 2 is retrospectively simulated using the Advanced Research Weather Research and Forecasting (ARW-WRF) Model, version 3.1.1 [49]. A multiple grid nesting procedure is used that approximately mimics the NAME Tier region structure (Figure 1). The coarsest grid (132 × 134 grid points at 30 km grid spacing) covers most of the contiguous U.S.; and the intermediate grid (265 × 262 grid points at 10 km grid spacing) covers the Southwest U.S. and northern Mexico. A convective-permitting finest grid (573 × 345 grid points at 2.5 km) is employed over the NAME Tier I region, to investigate the impact of the modified KF scheme on this domain. There are 37 levels in the vertical on eta levels. The model simulations of NAME IOP 2 is approximately 48 h in length and are initialized 6 h prior to the start of the IOP 2, as this is a sufficient period to allow for model spin-up and consistent with practices used to generate quasi-operational WRF numerical weather prediction (NWP) forecasts at the University of Arizona, Department of Hydrology and Atmospheric Sciences (UA-HAS) at a grid spacing of 1.8 km [50].
The model physical parameterizations are also mostly consistent with those of the existing UA-HAS WRF NWP system. Common parameterizations include: The Lin et al. scheme for microphysics [52]; Eta surface layer [53]; Mellor-Yamada-Janic (MYJ) planetary boundary layer [53]; NOAH land surface model [54]; Rapid Radiative Transfer Model (RRTMG) shortwave and longwave radiation [55]. Convection is parameterized using the KF CPS [56], in its standard form available within the WRF package and with the modifications of [42], to be specifically summarized later here in Section 2.5. As in the UA-HAS quasi-operational NWP system, there is no parameterization of convection on the convective-permitting (2.5 km) grid.

2.3. Observational Data

Atmospheric lateral boundary forcing data for WRF simulations is specified by the Global Forecast System (GFS) final (FNL) analyses prepared by the National Centers for Environmental Prediction (NCEP). The FNL Operational Global Analysis data are on one degree grids prepared operationally every six hours. These data are derived from the Global Data Assimilation System (GDAS), which continuously collects observational data from the Global Telecommunications System (GTS), and other sources [57]. North American Regional Reanalysis data [58] is used to initialize the soil moisture in lieu of FNL data as FNL data for 2004 only has two soil moisture levels. NARR soil moisture is generated by the NOAH land surface model, which is equivalent to the land surface model that is used within the WRF simulation. For verification, both the quality controlled NCEP Stage IV radar and gauge data [59] and the Tropical Rainfall Measuring Mission (TRMM) satellite data were used to compare measured rainfall to model rainfall. Geostationary Operational Environmental Satellite (GOES) 10 satellite data is used in comparison against the WRF simulations. We note that in [25], the results from the WRF simulations with application of the native KF CPS were compared to the Colorado State University (CSU) NAME surface dataset, discussed in detail in [60,61]. As our main objective here is to show differences in model simulations, we refer the reader to that previous paper for the observational comparisons of the IOP 2 simulations, but do reference these observational data in Section 4 as necessary.

2.4. Regional Climate Model Simulation

In addition to the simulation of NAME IOP-2, we also repeat the dynamical downscaling of the NCEP-NCAR Reanalysis with WRF as recently described in [62] but with the modified KF CPS for continuous 60-year period 1950–2010. This regional climate model (RCM) simulation encompasses a domain of the contiguous U.S. and Mexico at a grid spacing of 35 km. The model parameterizations are nominally similar to the NAME IOP2 simulation and spectral nudging is employed to maintain the variability of large-scale circulation features. Our objective in conducting this RCM simulation is to evaluate whether the modified KF CPS can help alleviate some of the aforementioned known biases in warm season precipitation that seem to be common to RCMs, that is, overestimation of precipitation in mountainous areas and underestimation of precipitation in areas with more homogeneous terrain where the organized convection accounts for a greater proportion of the warm season precipitation [21].

2.5. Modifying the Kain–Fritsch CPS to Account for Vertical Dynamic Pressure Effects

Modifications of the KF CPS in WRF are following [42]. Summary of the key points of the modifications are listed here for brevity. We refer the reader for a more thorough derivation and theoretical consideration of the scheme modifications to that previous paper. Modifications are started from the equation of motion in a locally steady state, so just the advective components are retained in an Eulerian framework of expansion of the total derivative of wind. Considering the expression for the grid-scale vertical advective component (left hand side of equation below)
w ¯ w ¯ z = g ( T T 0 R C p p p 0 ) θ 0 π z + A D V  
where the right side of the equation the first term is the buoyancy in its full form, accounting for both perturbation temperature and dynamic pressure (p′), the second term is the vertical gradient of the Exner function perturbation (basically equivalent to the vertical gradient of the dynamic pressure), and the last term (ADV) is the advection of vertical velocity due to the grid-scale horizontal velocity. Note here that the perturbation quantities (prime terms) are computed as the difference between the grid-resolved quantity minus a synoptic-base state computed from hydrostatic balance. We calculate the ratio of vertical gradient of the pressure perturbation and buoyancy force, expressed with these difference terms, as
  P B = θ 0 ( π ¯ π 0 ) z g ( T u T 0 T 0 R C p p ¯ p 0 p 0 )
We introduce modified buoyancy at every model vertical level that takes the dynamic pressure perturbations with the above ratio
  F ( z ) = g T u ( z ) T ¯ ( z ) T ¯ ( z ) [ 1 + P B ( z ) ]  
This function basically adds a weighting factor to buoyancy that explicitly accounts for the vertical gradient of dynamic pressure. This can be used to create a modified Convective Available Potential Energy (CAPE) closure assumption
  CAPE = L C L C T F ( z ) d z  
We then add a new convective trigger function that considers this dynamic pressure-modified CAPE. A potential updraft source layer (USL) that initiates convection must satisfy 2 conditions:
  • The modified CAPE within an updraft source layer must be positive in order to support convection
    [ w m i x 2 + 2 USLbase LCL F ( z ) d z > 0 ,   w m i x > 0 w m i x 2 + 2 USLbase LCL F ( z ) d z > 0 ,   w m i x < 0  
  • There must be positive modified CAPE within an updraft source layer (USL) that is sufficient to overcome any convective inhibition through the depth of the USL to the lifting condensation level.
    F USL = USLbase USLtop F ( z ) d z > 0  

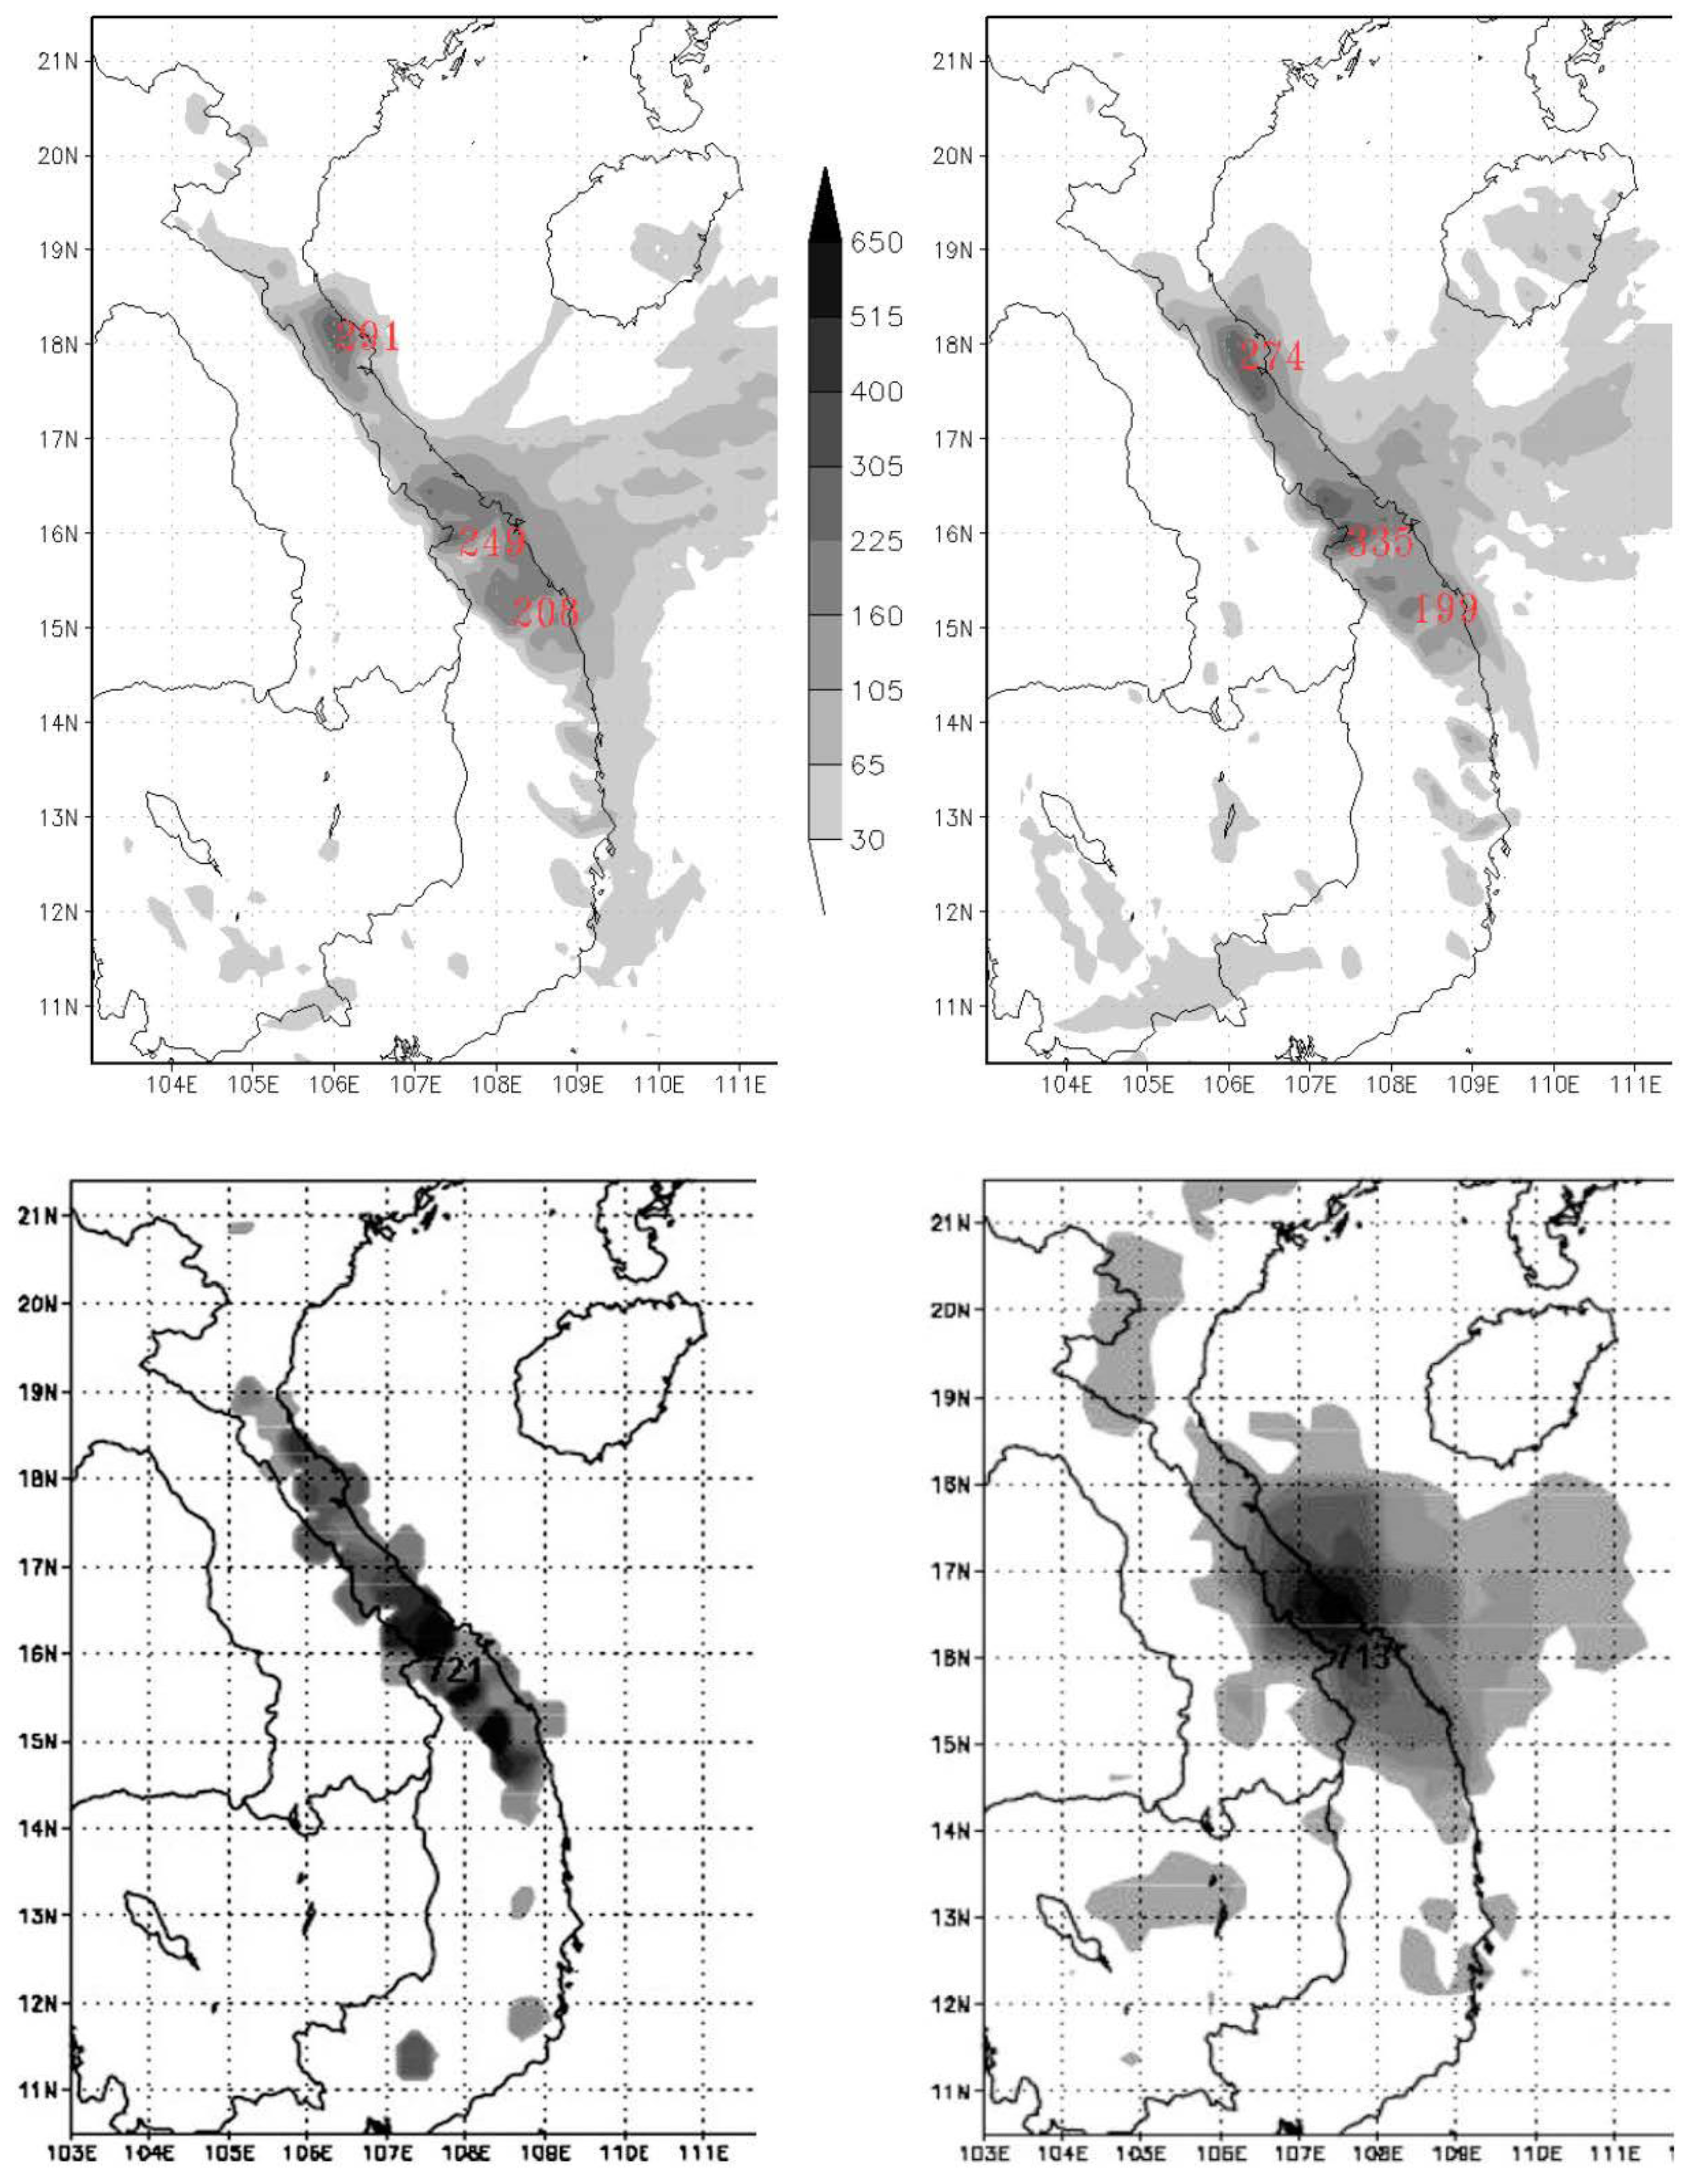
3. Evaluation of the Modified KF CPS for the Vietnam Case in WRF

We first test the modified KF CPS with the same case study for Vietnam simulated with the RAMS model in [42], to verify the value gained by this CPS, which is similarly implemented in WRF, before applying it to simulation of North American monsoon organized convection for NAME IOP2. We use a nominally similar experimental design in terms of domain configuration, NCEP-NCAR reanalysis boundary forcing data, and WRF model parameterizations as previously described in Section 2. There are two nested grids with a grid spacing of 40 and 10 km, respectively. Additionally, we add a third convective-permitting grid of 2.5 km, with the CPS turned off. For brevity, we just show the final comparison results for model simulated precipitation for the 48-h model period starting 0 UTC 24 November 2004. Reproduction of all the accompanying model-simulated atmospheric variables is omitted for the Vietnam case, as that will be done in more detail for the NAME IOP2 simulation later to demonstrate the value added of the modified KF CPS on the atmospheric circulation fields. The main objective in that previous paper [42] was to better represent the precipitation maxima in central Vietnam associated with a MCS, estimated to be 721 mm from an in-situ rain gauge measurement at the station of Thuong Nhat (16.128° N, 107.688° E) and 713 mm in remote-sensed satellite data from the Tropical Rainfall Measuring Mission (TRMM) product.
In the original RAMS simulation in [42], the modified KF CPS increases the precipitation maxima at Thuong Nhat station from 345 mm to 673 mm on a 10-km intermediate grid (see [42], their Figure 7). Application of the native KF CPS in WRF simulations produces comparatively less rain compared to RAMS (249 mm as in Figure 2). Even though the modified KF CPS with WRF does not produce double the amount of precipitation as in RAMS at the Thuong Nhat station location, it still does yield 335 mm, about a third more than the simulation with the native KF CPS. A third nested interior domain with 2.5 km grid spacing shows the impact of applying the modified KF CPS as boundary forcing to the convective-permitting grid where the CPS has been turned off. Results of the same 48-h rainfall are shown in Figure 3. Considering boundary forcing from the intermediate grid with the native KF CPS, the convective-permitting grid produces local maxima of 653 mm and 665 mm near the Thuong Nhat station. Use of the modified KF CPS on the intermediate grid downscaled to the convective-permitting 2.5 km grid produces a local maximum that is nearly twice as much at 1285 mm.
Though the absolute precipitation amounts are different between the RAMS and WRF simulations, basically the same general conclusions hold in comparing simulations with the native and modified KF CPSs. In both cases, the modified KF CPS not only produces more precipitation on the intermediate 10 km resolution domain that is closer to the observed values from rain gauge and satellite-derived estimates. But perhaps more importantly, application of the modified KF CPS is substantially modifying the model-simulated precipitation on the convective-permitting 2.5 km resolution domain. Thus, for the original case of MCS development in central Vietnam where the modified KF was first demonstrated with RAMS, we have been able to reproduce similar results with WRF. In applying the modified KF scheme to the NAM region as the next step in this work, we select a well-documented NAME IOP in which organized MCS-type convection occurred in northwest Mexico. The application of the modified KF scheme to two different cases of MCS development forced by complex terrain in a monsoonal circulation is the binding meteorological tie between these two simulation experiments.

4. Application of the Modified KF CPS in WRF Simulation of NAME IOP2

The objective of the presentation of WRF model simulation results of NAME IOP2 in this Section is to show that the modified KF CPS produces improved results, as compared to that with the native KF CPS, in two respects. First, we want to show that the modified KF CPS produces precipitation that compares better to available observed products of precipitation, as archived in NAME data inventories, especially in reducing the positive precipitation bias over the highest terrain. Second, we want to evaluate if the modified KF CPS more realistically in physically represents the gulf surge and MCS that occurred during the IOP. Note that a more comprehensive analysis of the NAME IOP2 simulations with the use of the native KF scheme is documented in a separate publication [25].

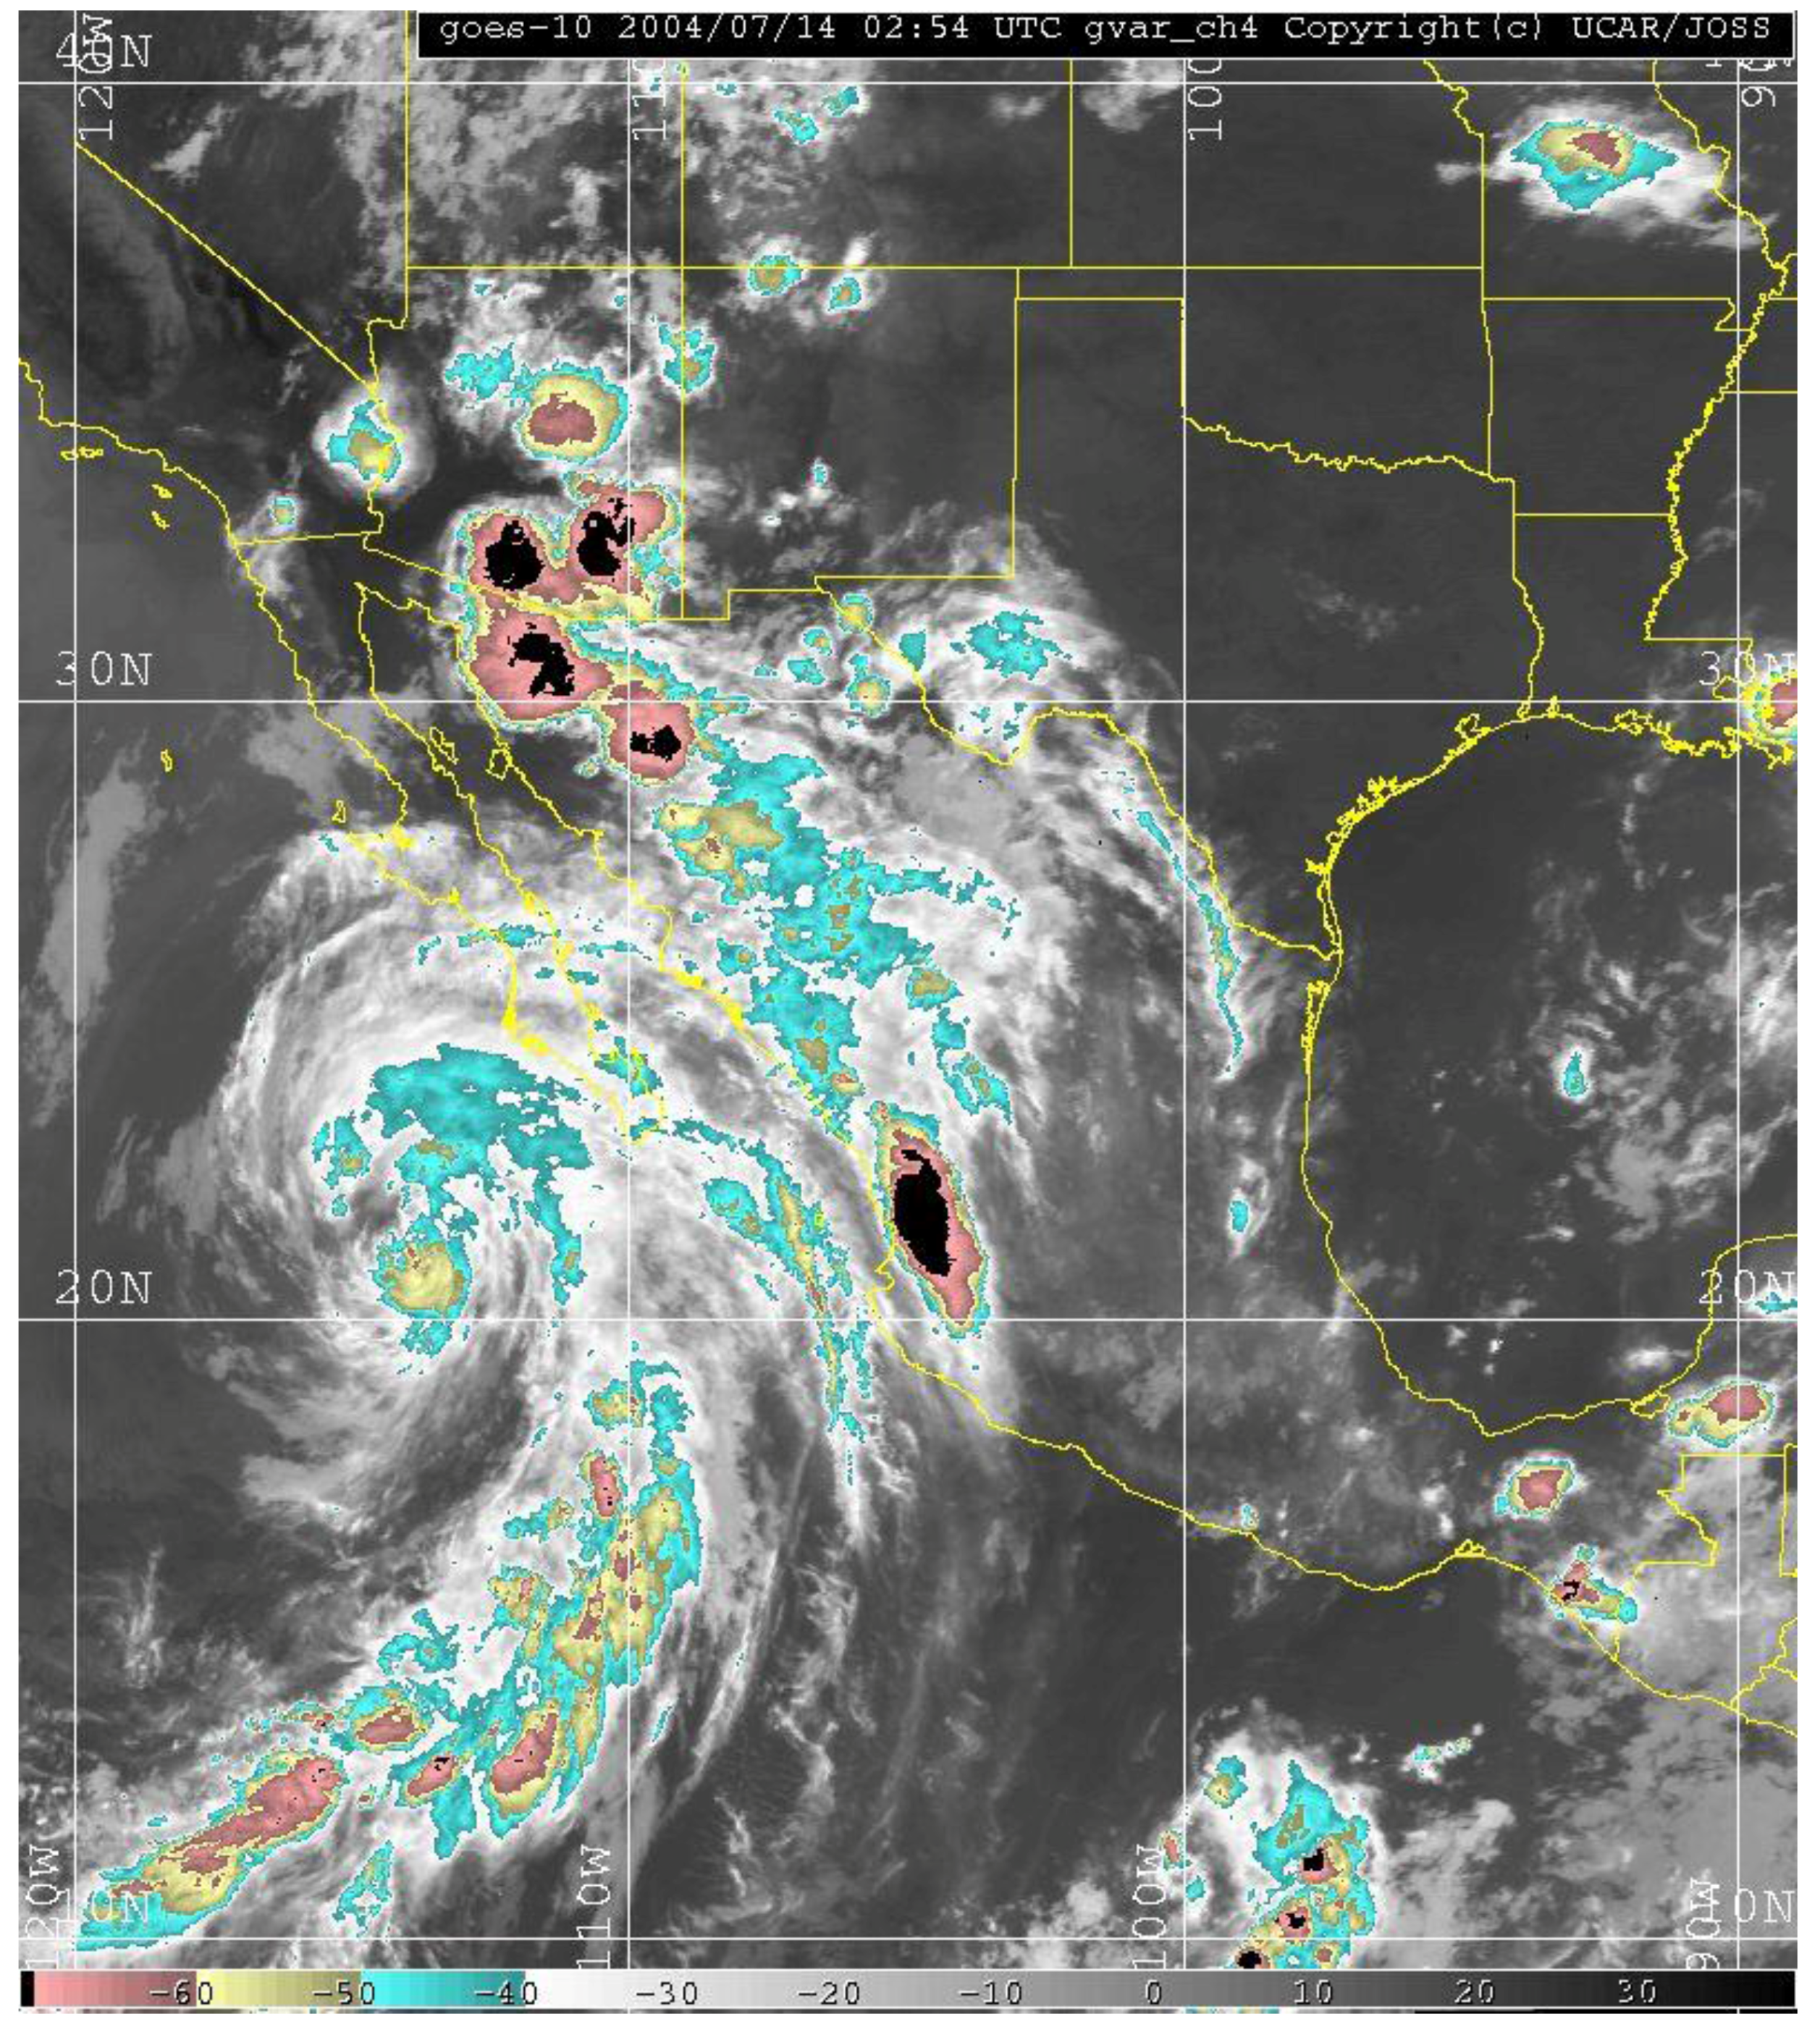
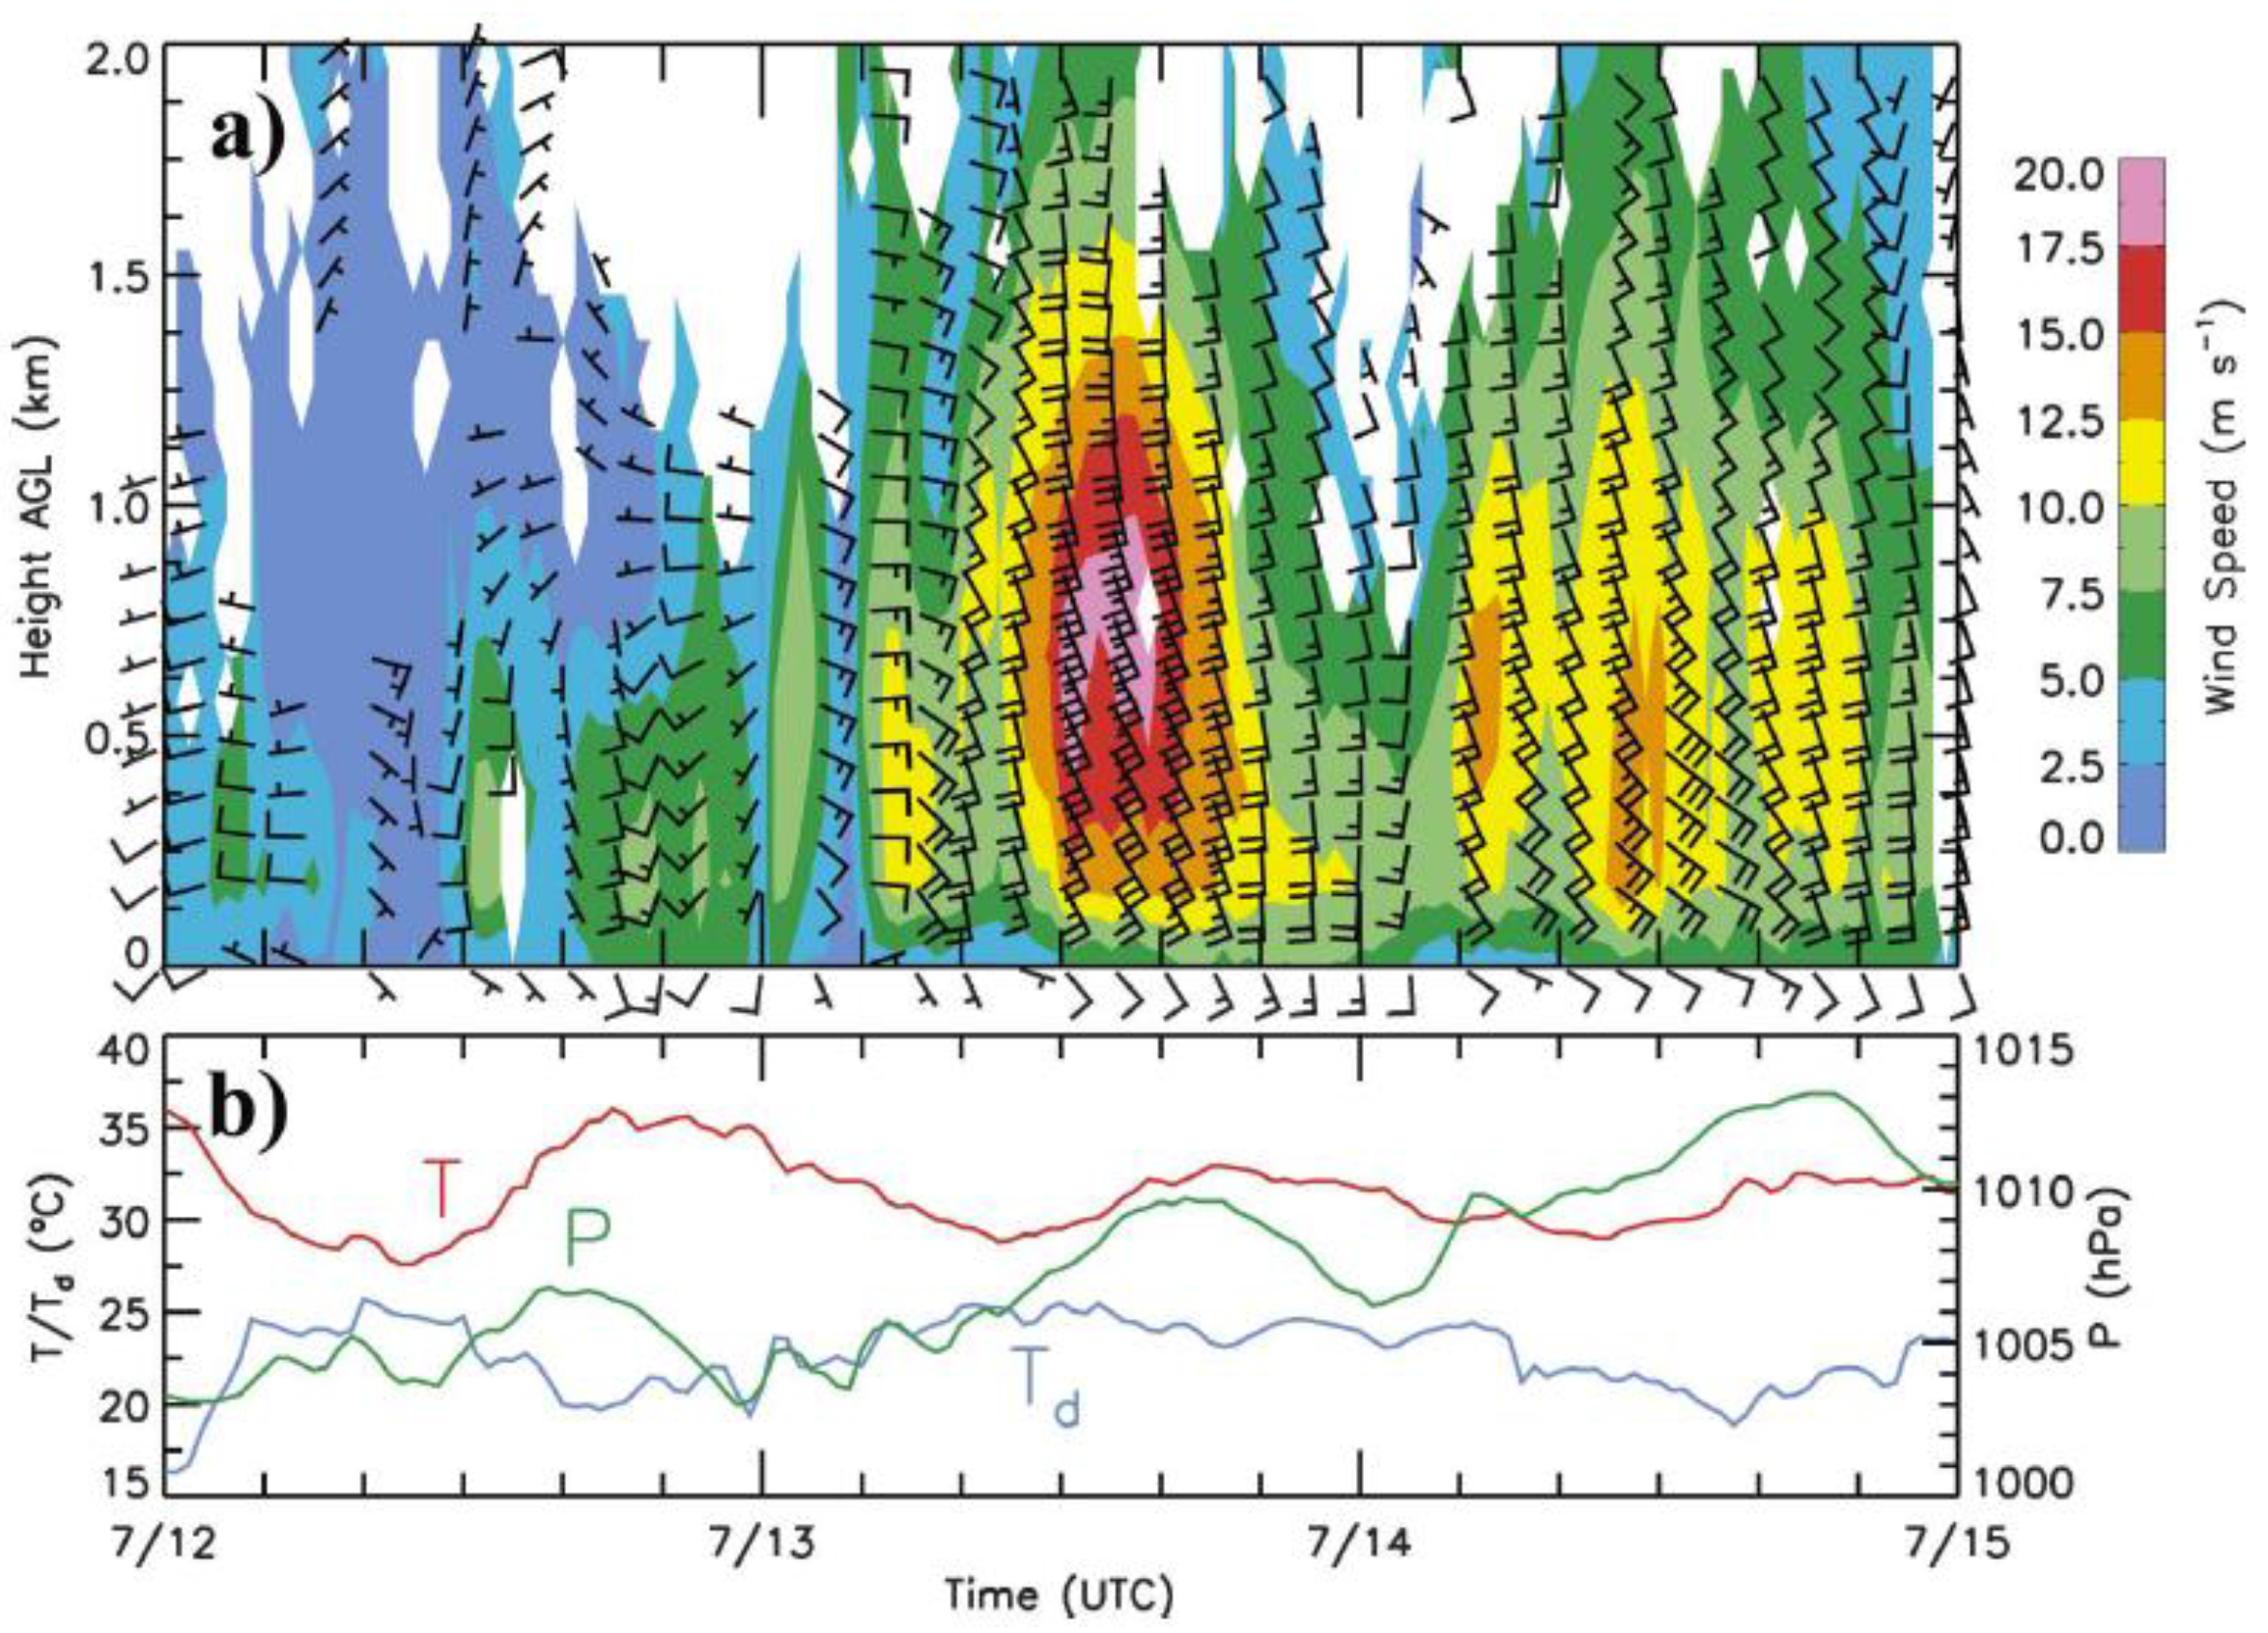
4.1. Review of Meteorological Conditions during NAME IOP2

The meteorological conditions during NAME IOP2 are well illustrated by GOES enhanced infrared satellite imagery as shown in Figure 4 near the time of 3Z 14 July 2004 (7 p.m. local time in Arizona). From the satellite-derived outgoing long-wave radiation (OLR) it is clear that there is organized convective precipitation occurring, with multiple MCSs present in northern Sonora and southern Arizona. At this time, these MCSs are propagating westward toward the Gulf of California and the Colorado River Valley from their starting places in the Sierra Madre Occidental and Mogollon Rim. The leading edge of the strongest MCS has reached the northern coast of the Gulf of California. The development of these MCSs is facilitated by low-level moisture (below about 800 hPa) supplied by a strong gulf surge in the Gulf of California, triggered by the passage of tropical storm Blas located several hundred miles southwest of the southern tip of Baja California.
The strong gulf surge that traveled the entire length of the Gulf of California is one of the most distinguishing features of NAME IOP2, and has been documented extensively from the NAME observational network in [48]. Figure 5 shows, taken from this paper, the wind profiler data during the surge for Puerto Peñasco, located at the northern end of the Gulf of California. The surge was most pronounced at this location, as compared to the other NAME wind profiler stations along the coast of the Gulf of California. The surge is strongest during the approximate period 9 UTC to 18 UTC (2 a.m. to 11 a.m. local Arizona time) on 13 July, with a maximum wind speed of more than 20 m s−1 measured by the wind profiler instrument half kilometer above the ground surface at 15 UTC (8 a.m. local Arizona time).

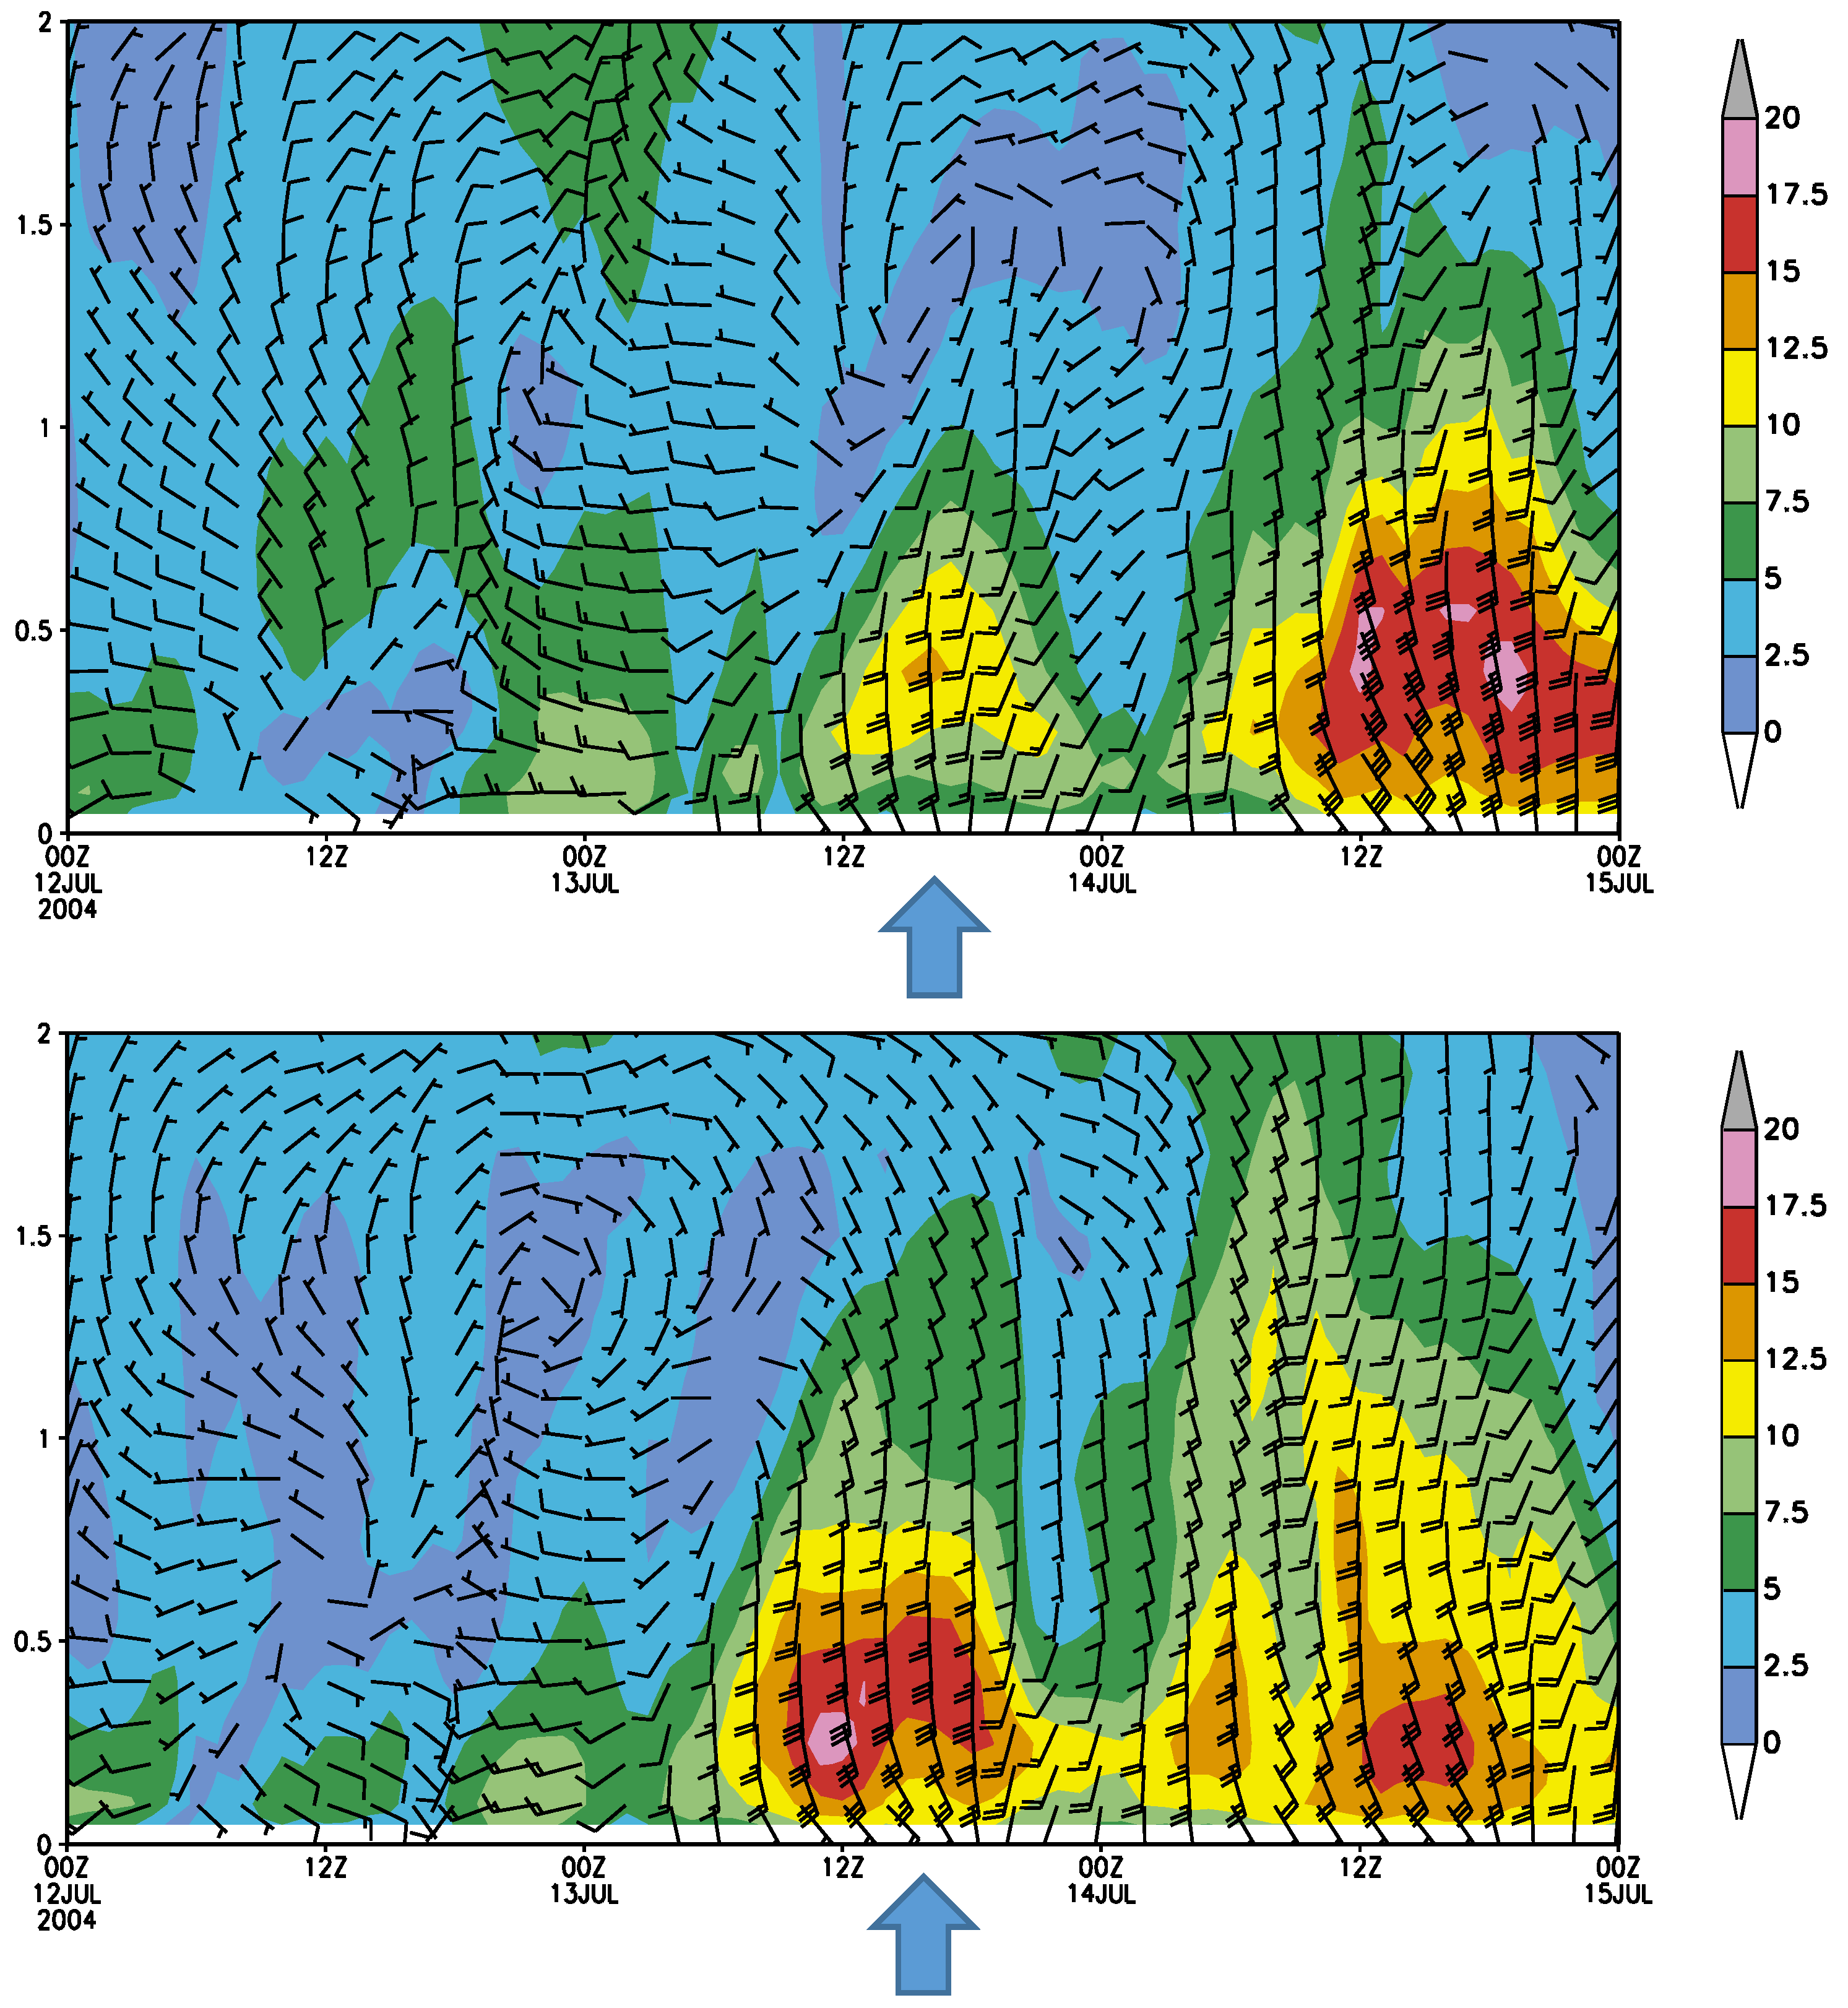
4.2. Model Representation of the Gulf Surge

The surge evaluation applied to the WRF model output at Puerto Peñasco just consider the intermediate 10-km grid where convective parameterization is applied in Figure 6. The simulation with the native KF has two clear deficiencies, as compared to the observed wind profiler data. The low-level moisture surge is not strong enough during the observed time of the surge. Model simulated southerly winds are only on the order of 10 to 15 m s−1 within the lowest 1000 m above the land surface. The timing of the maximum of the surge is also incorrect with maximum wind values of 17.5 m s−1 in the lowest kilometer above the surface and occurring nearly a day after the observed event. The modified KF CPS improves upon both the magnitude and timing of the gulf surge, producing a wind speed on the order of 15 to 20 m s−1 in the lowest kilometer within 6 h of the time when the observed 20 m s−1 wind maximum occurred. Though the wind maximum of the gulf surge is still underestimated, and the surge is not as deep, the modified KF CPS still performs much better in simulating the NAME IOP2 gulf surge, particularly in terms of the timing.

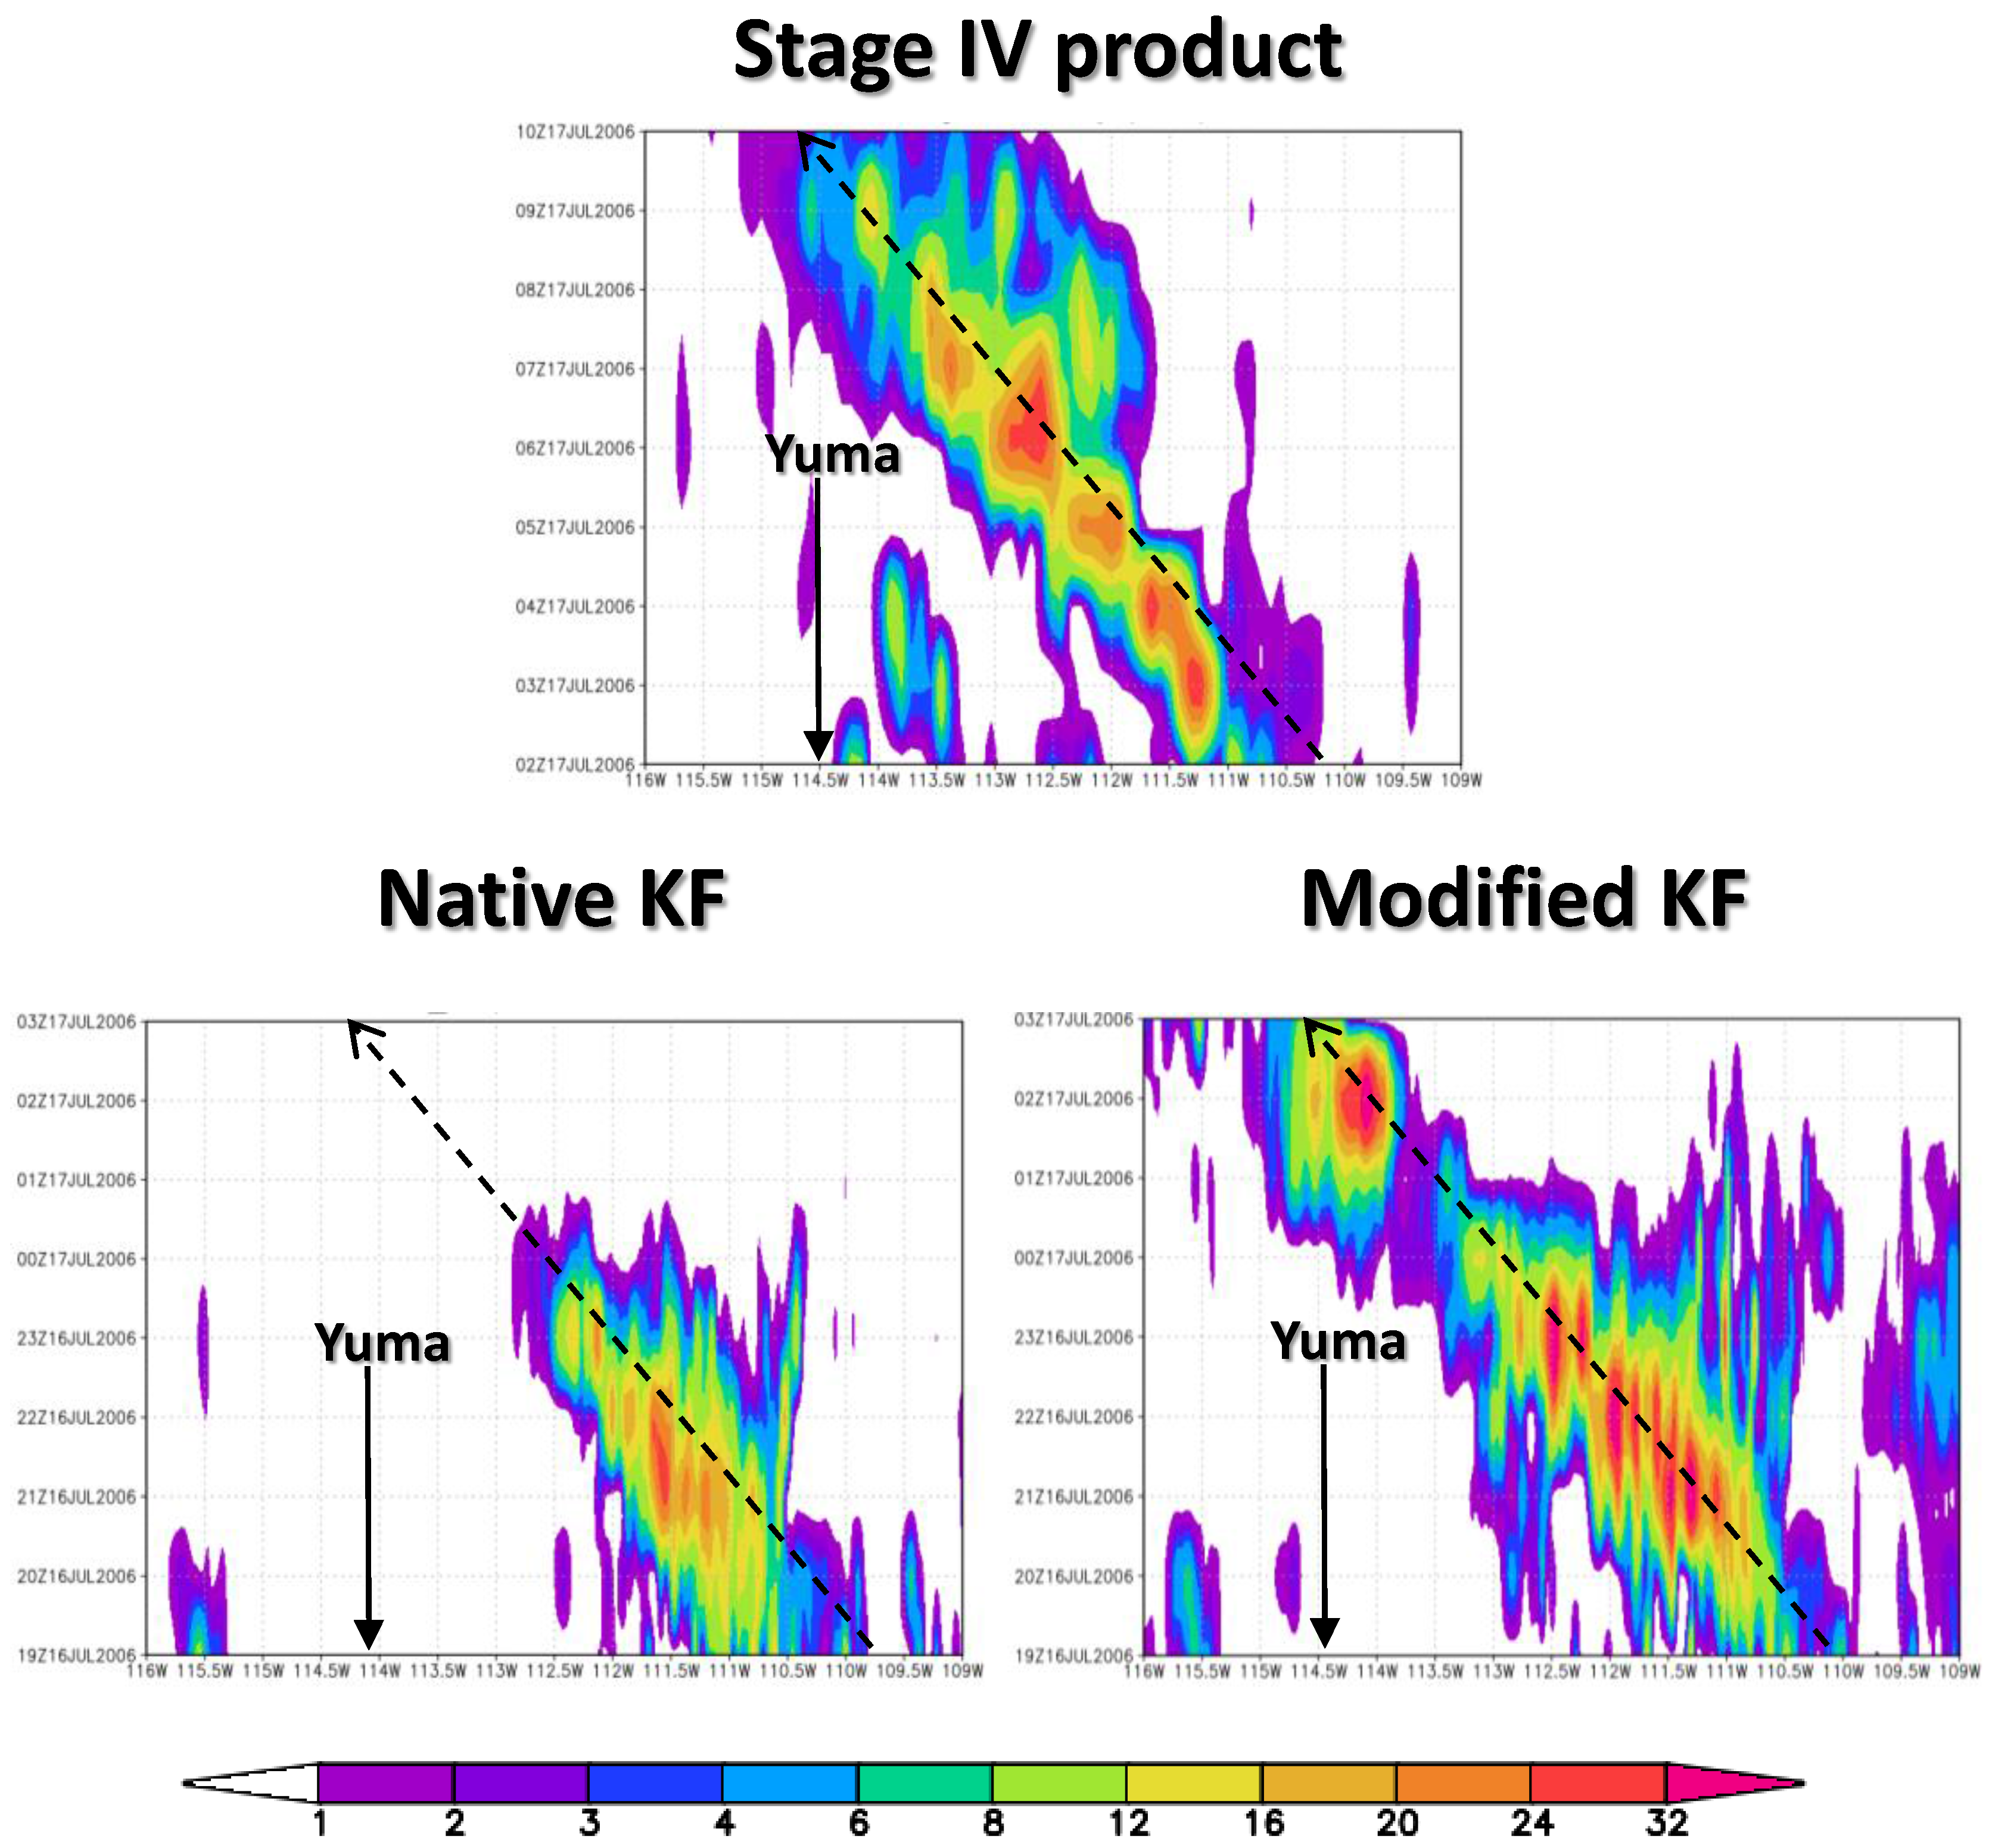
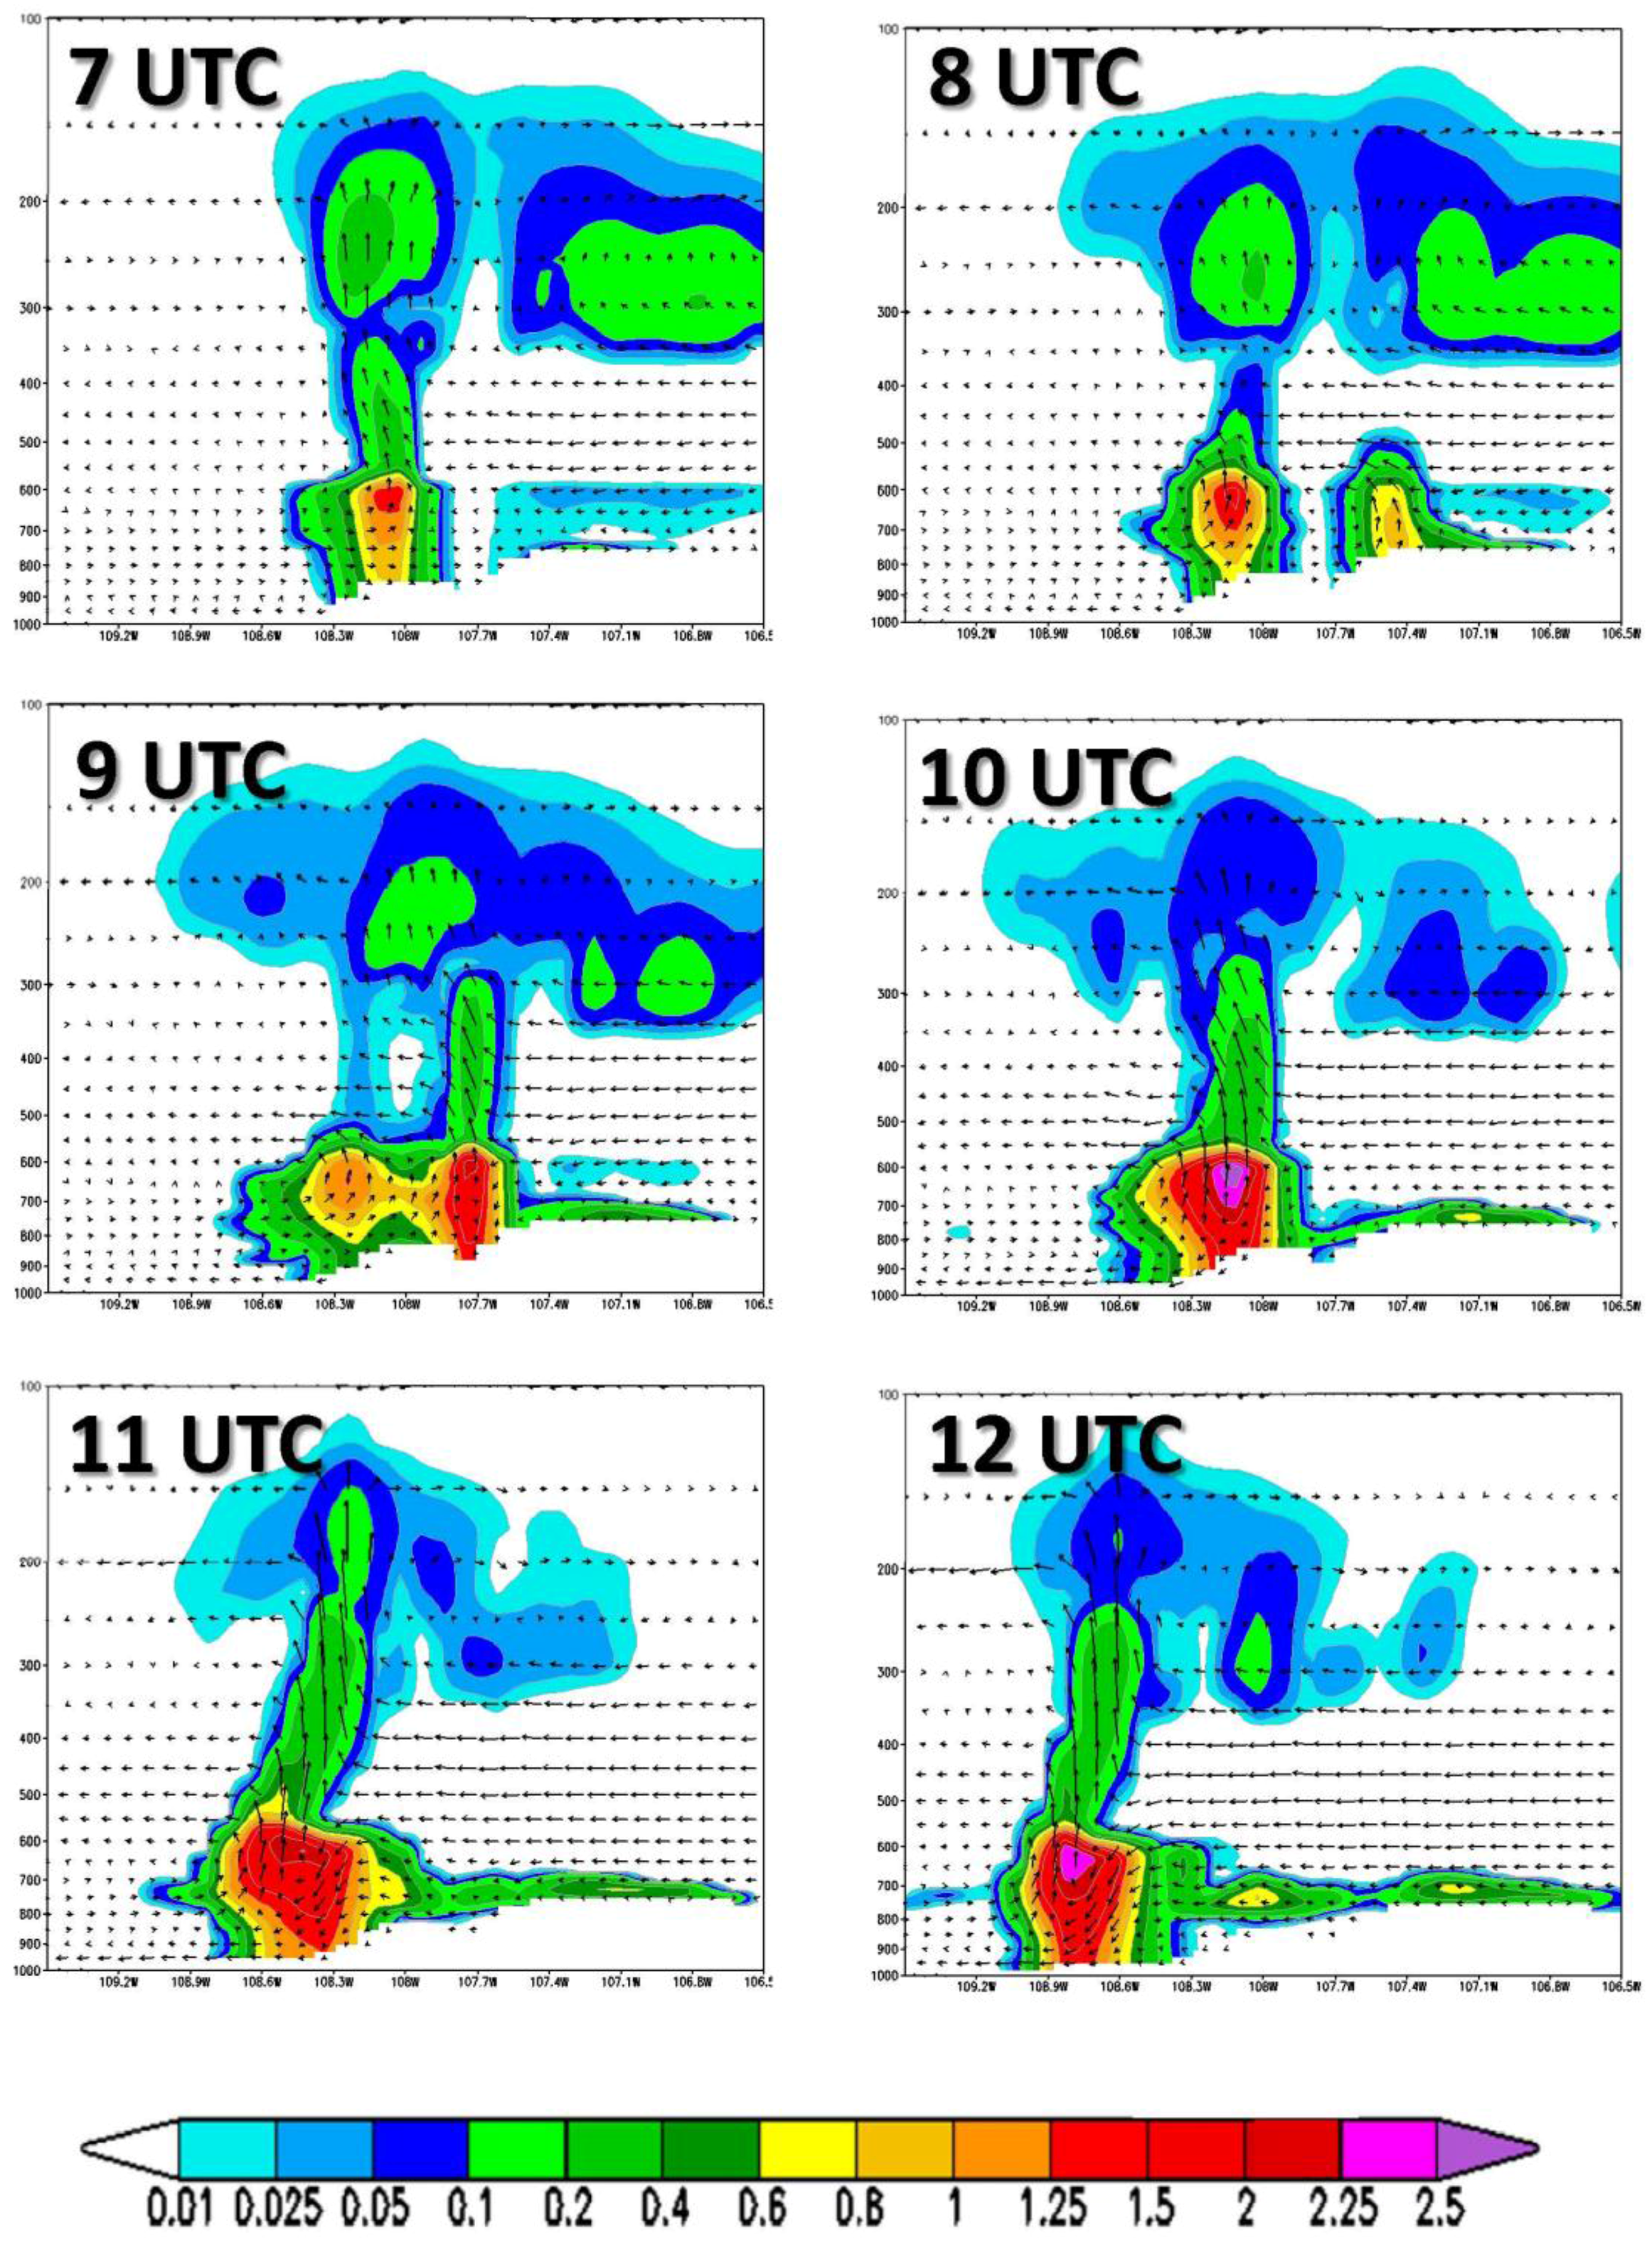
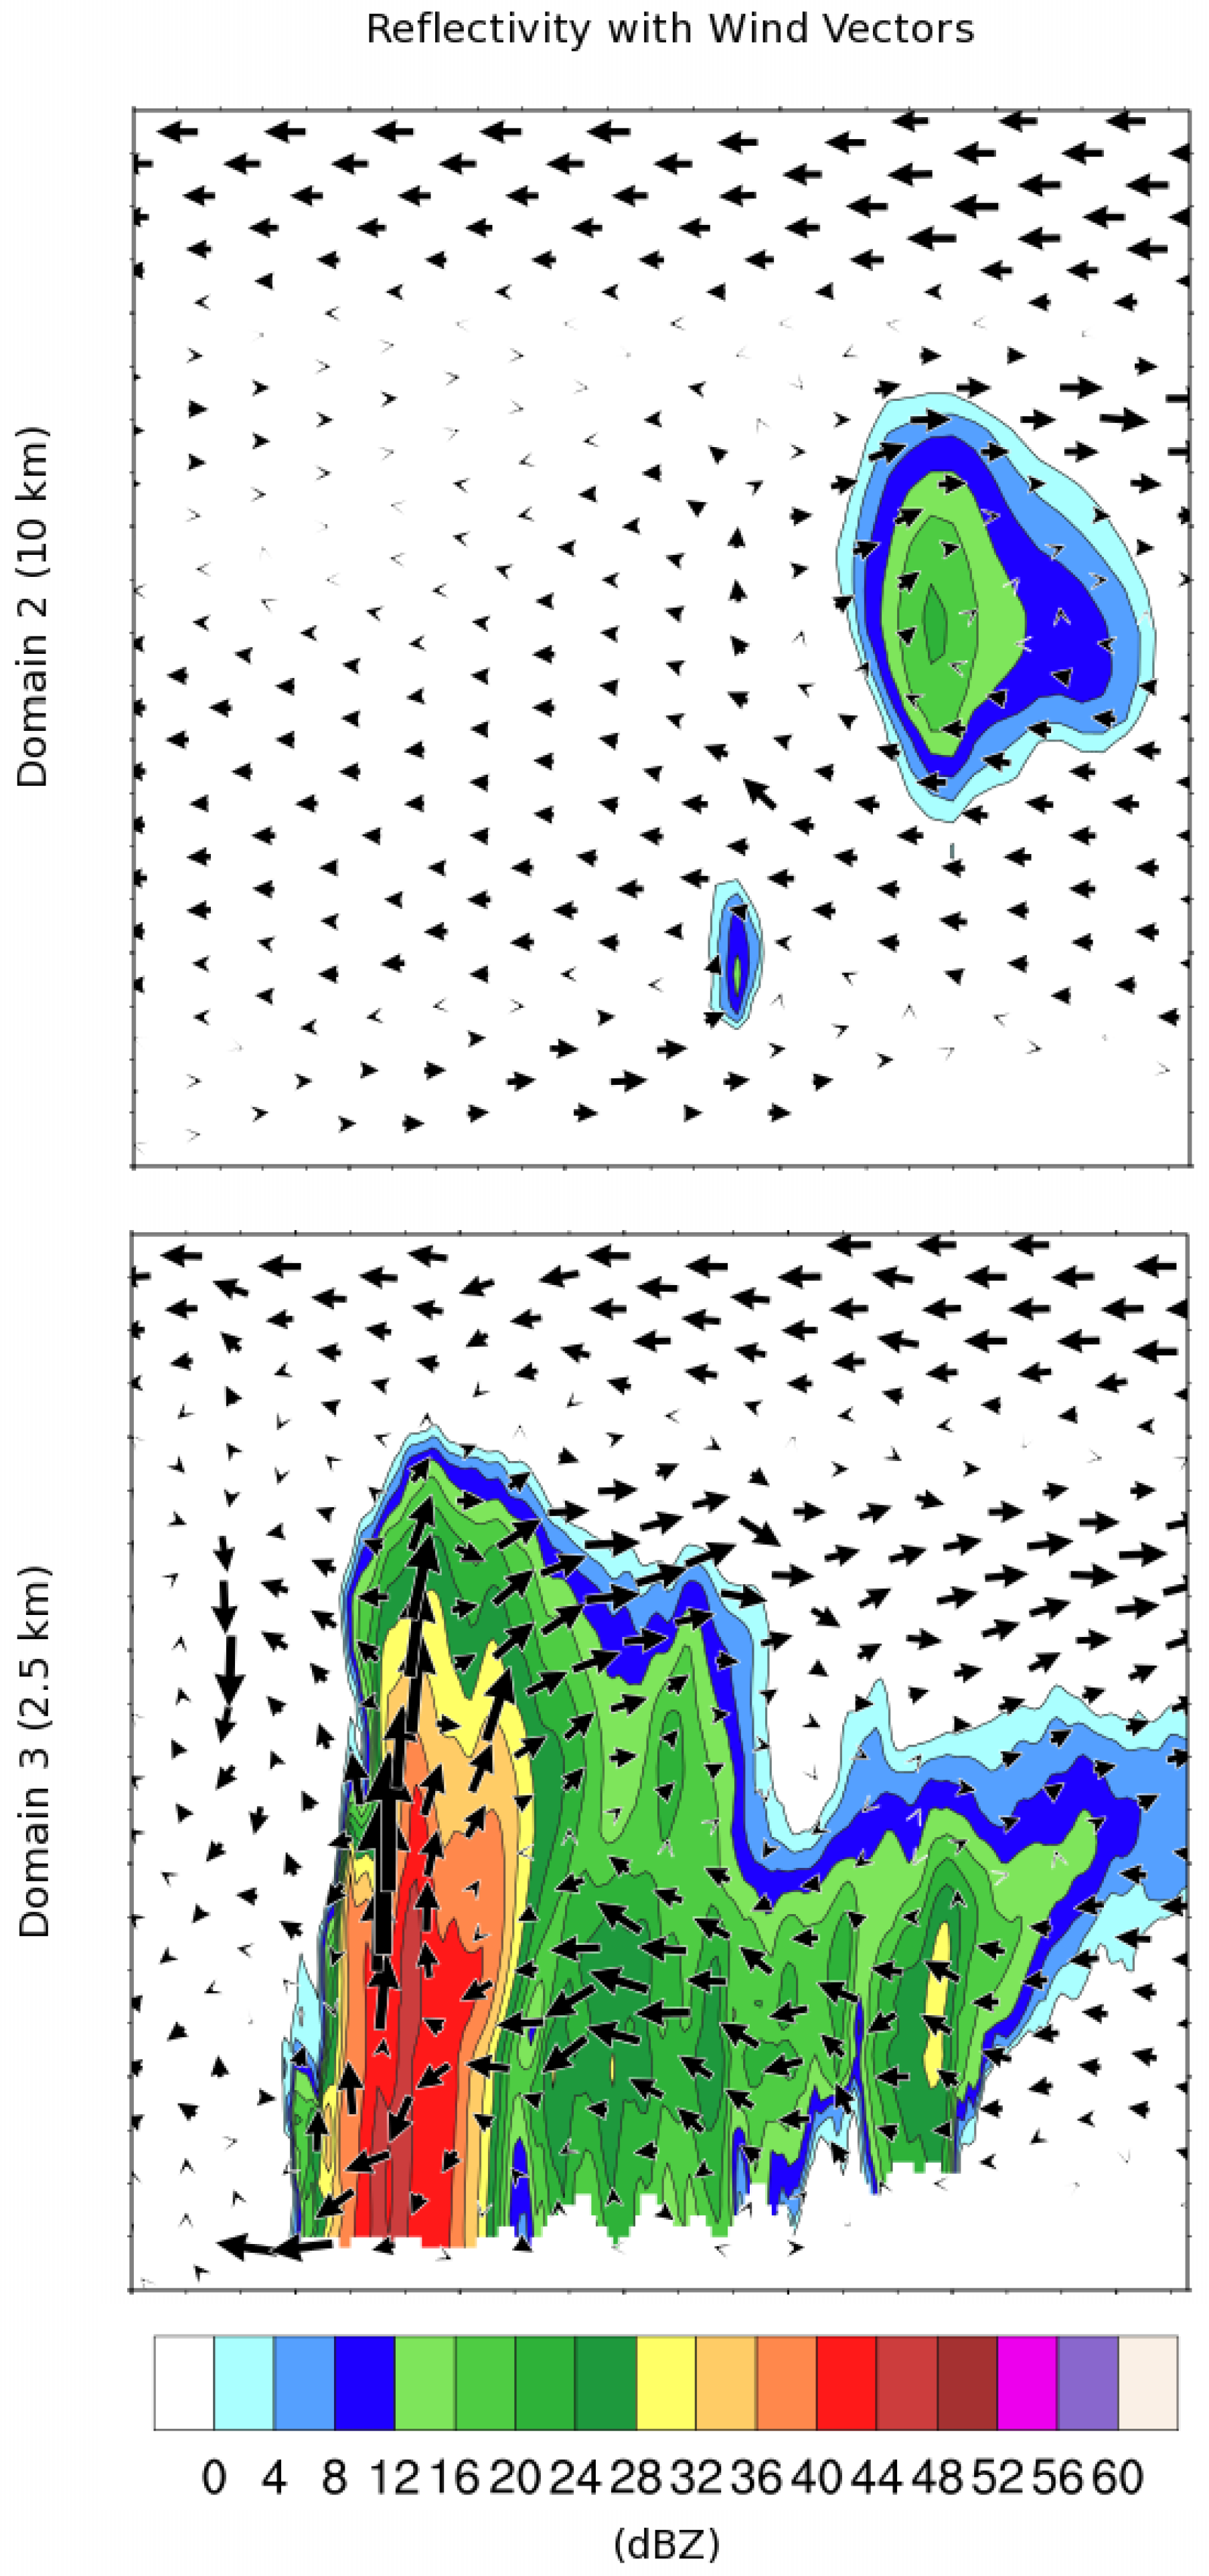
4.3. Cross Sectional Analysis of Condensate Mixing Ratio at High Temporal Resolution

Cross sections of the total condensate mixing ratio and wind field simulated by the model are shown for latitude 26.8° N in Figure 7 in approximate relation to the time of MCS development during the afternoon of 13 July, from 7 UTC to 12 UTC (12 noon to 5 p.m. local time). The simulations are saved at ten-minute intervals, as that is the necessary temporal scale to visualize the convective development and propagation. However hourly panels plotted in Figure 7 are sufficient to show the MCS organization and propagation. Note that we are only showing in these figures the results with the modified KF CPS. With use of just the native KF CPS on the 10-km grid, convection develops directly over the peak of the Sierra Madre Occidental mountains and does not propagate, hence the corresponding figure for the native KF CPS is not shown. By contrast, the use of the convective-permitting scale produces convection with a MCS-type structure, with a leading convective line, organized inflows and outflows, and a trailing stratiform precipitation region (Figure 8). Thus, the use of the modified KF CPS produces a result that much more closely matches the [25] simulation on their convective-permitting grid, even though not as detail due to simulated on a much coarser grid (4 times coarser). Both the modified KF CPS on the 10-km grid and the convective-permitting grid reproduce MCSs in their mature stage per criteria of Houze [63].
The time evolution of the total condensate mixing ratio and wind velocity clearly show convective organization and propagation via the mechanism of outflow boundaries triggering new convective lines. As the simulation progresses, the leading convective line becomes more intense, with higher total condensate mixing ratios and stronger updrafts and a well-defined gust front as the MCS moves westward off the Sierra Madre Occidental towards the Gulf of California. Near the end of the period in Figure 8 during the hour of 11 Z to 12 Z there is even a signature of a trailing stratiform precipitation region and rear inflow jet near 700 hPa. The very important conclusion from the cross-sectional analysis is that the use of the modified KF CPS permits the development of MCS-type convection during the NAM in a manner that is very similar to what can be achieved using convective-permitting simulation, at much finer grid spacing and much more computational expense. It is the MCS outflow boundary that is also responsible for intensifying the modeled gulf surge. Our observations identified that the modified KF CPS better represents MCS-type cloud structure and the process of convective development and propagation basically matches what was found for the RAMS simulations in the Vietnam case [42].

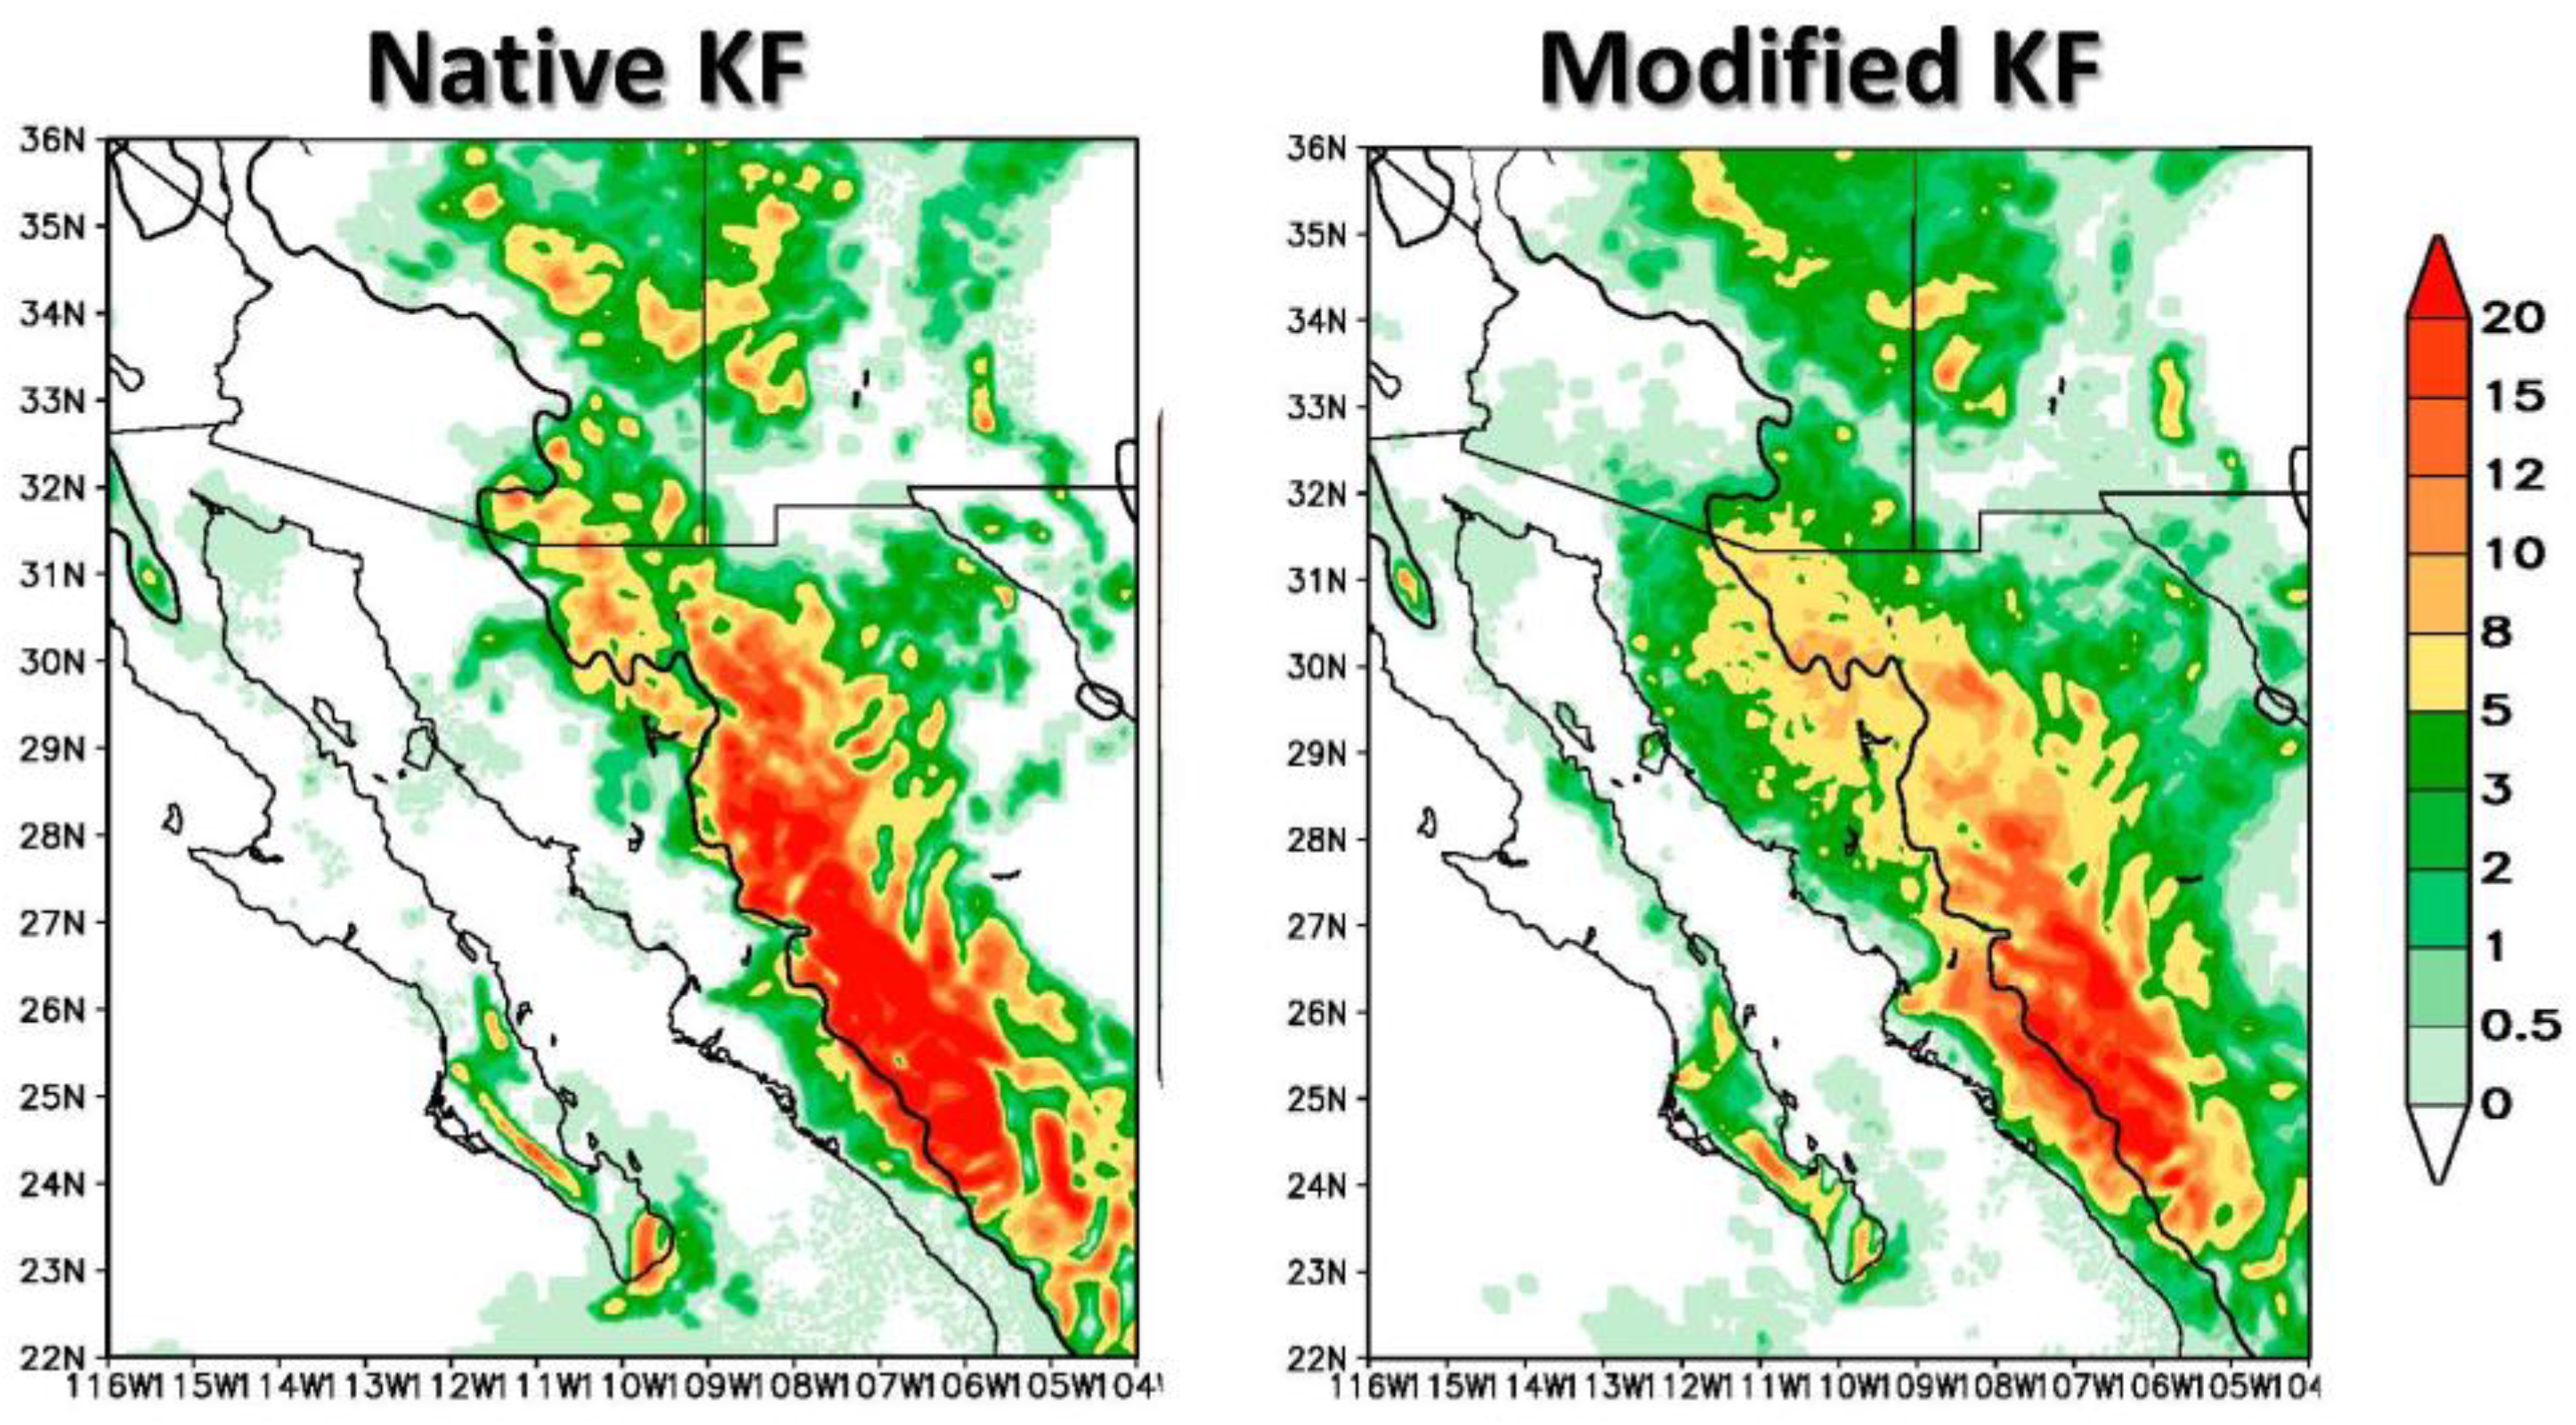
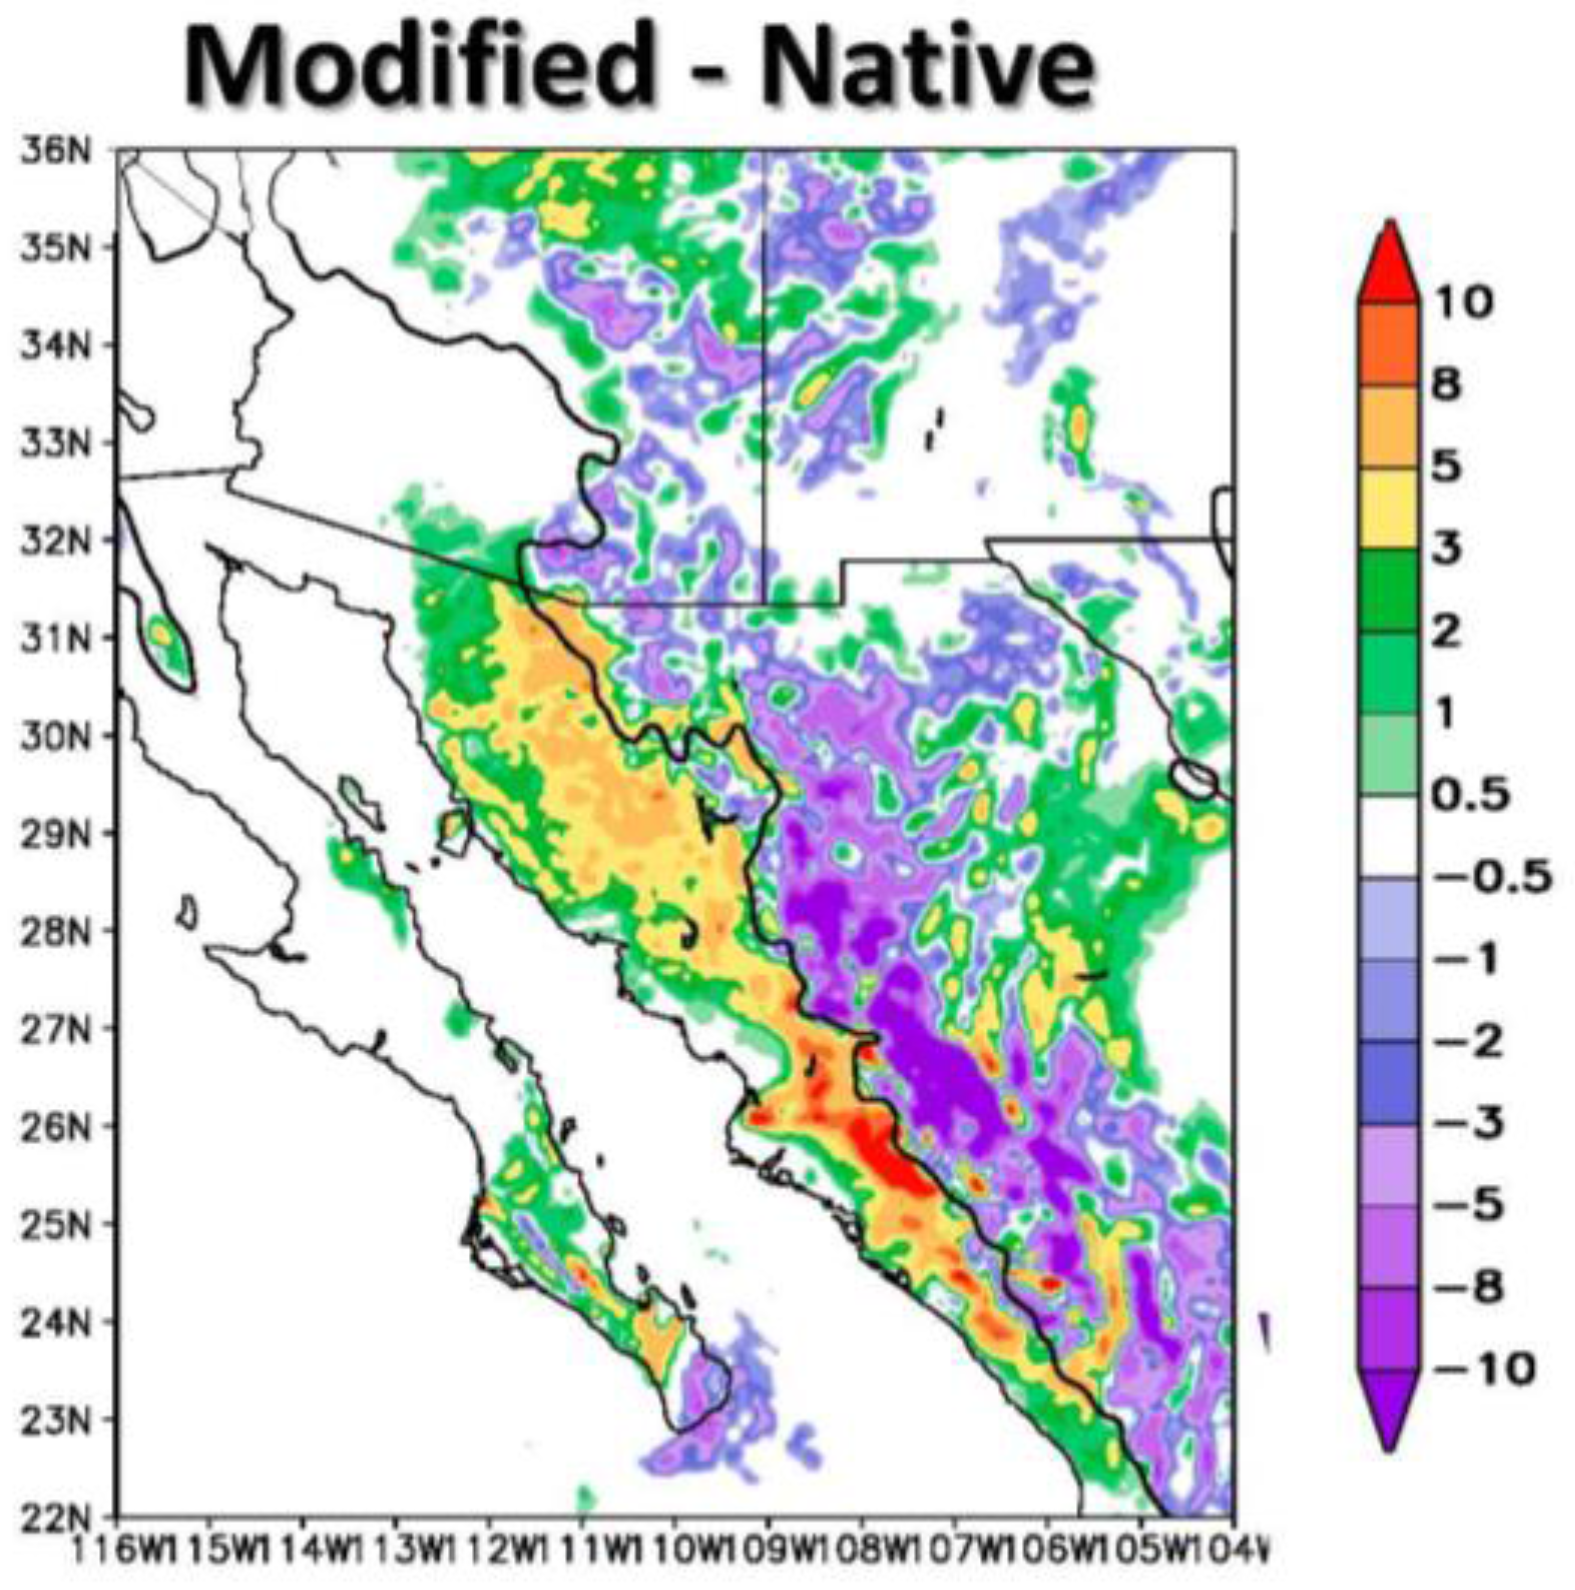
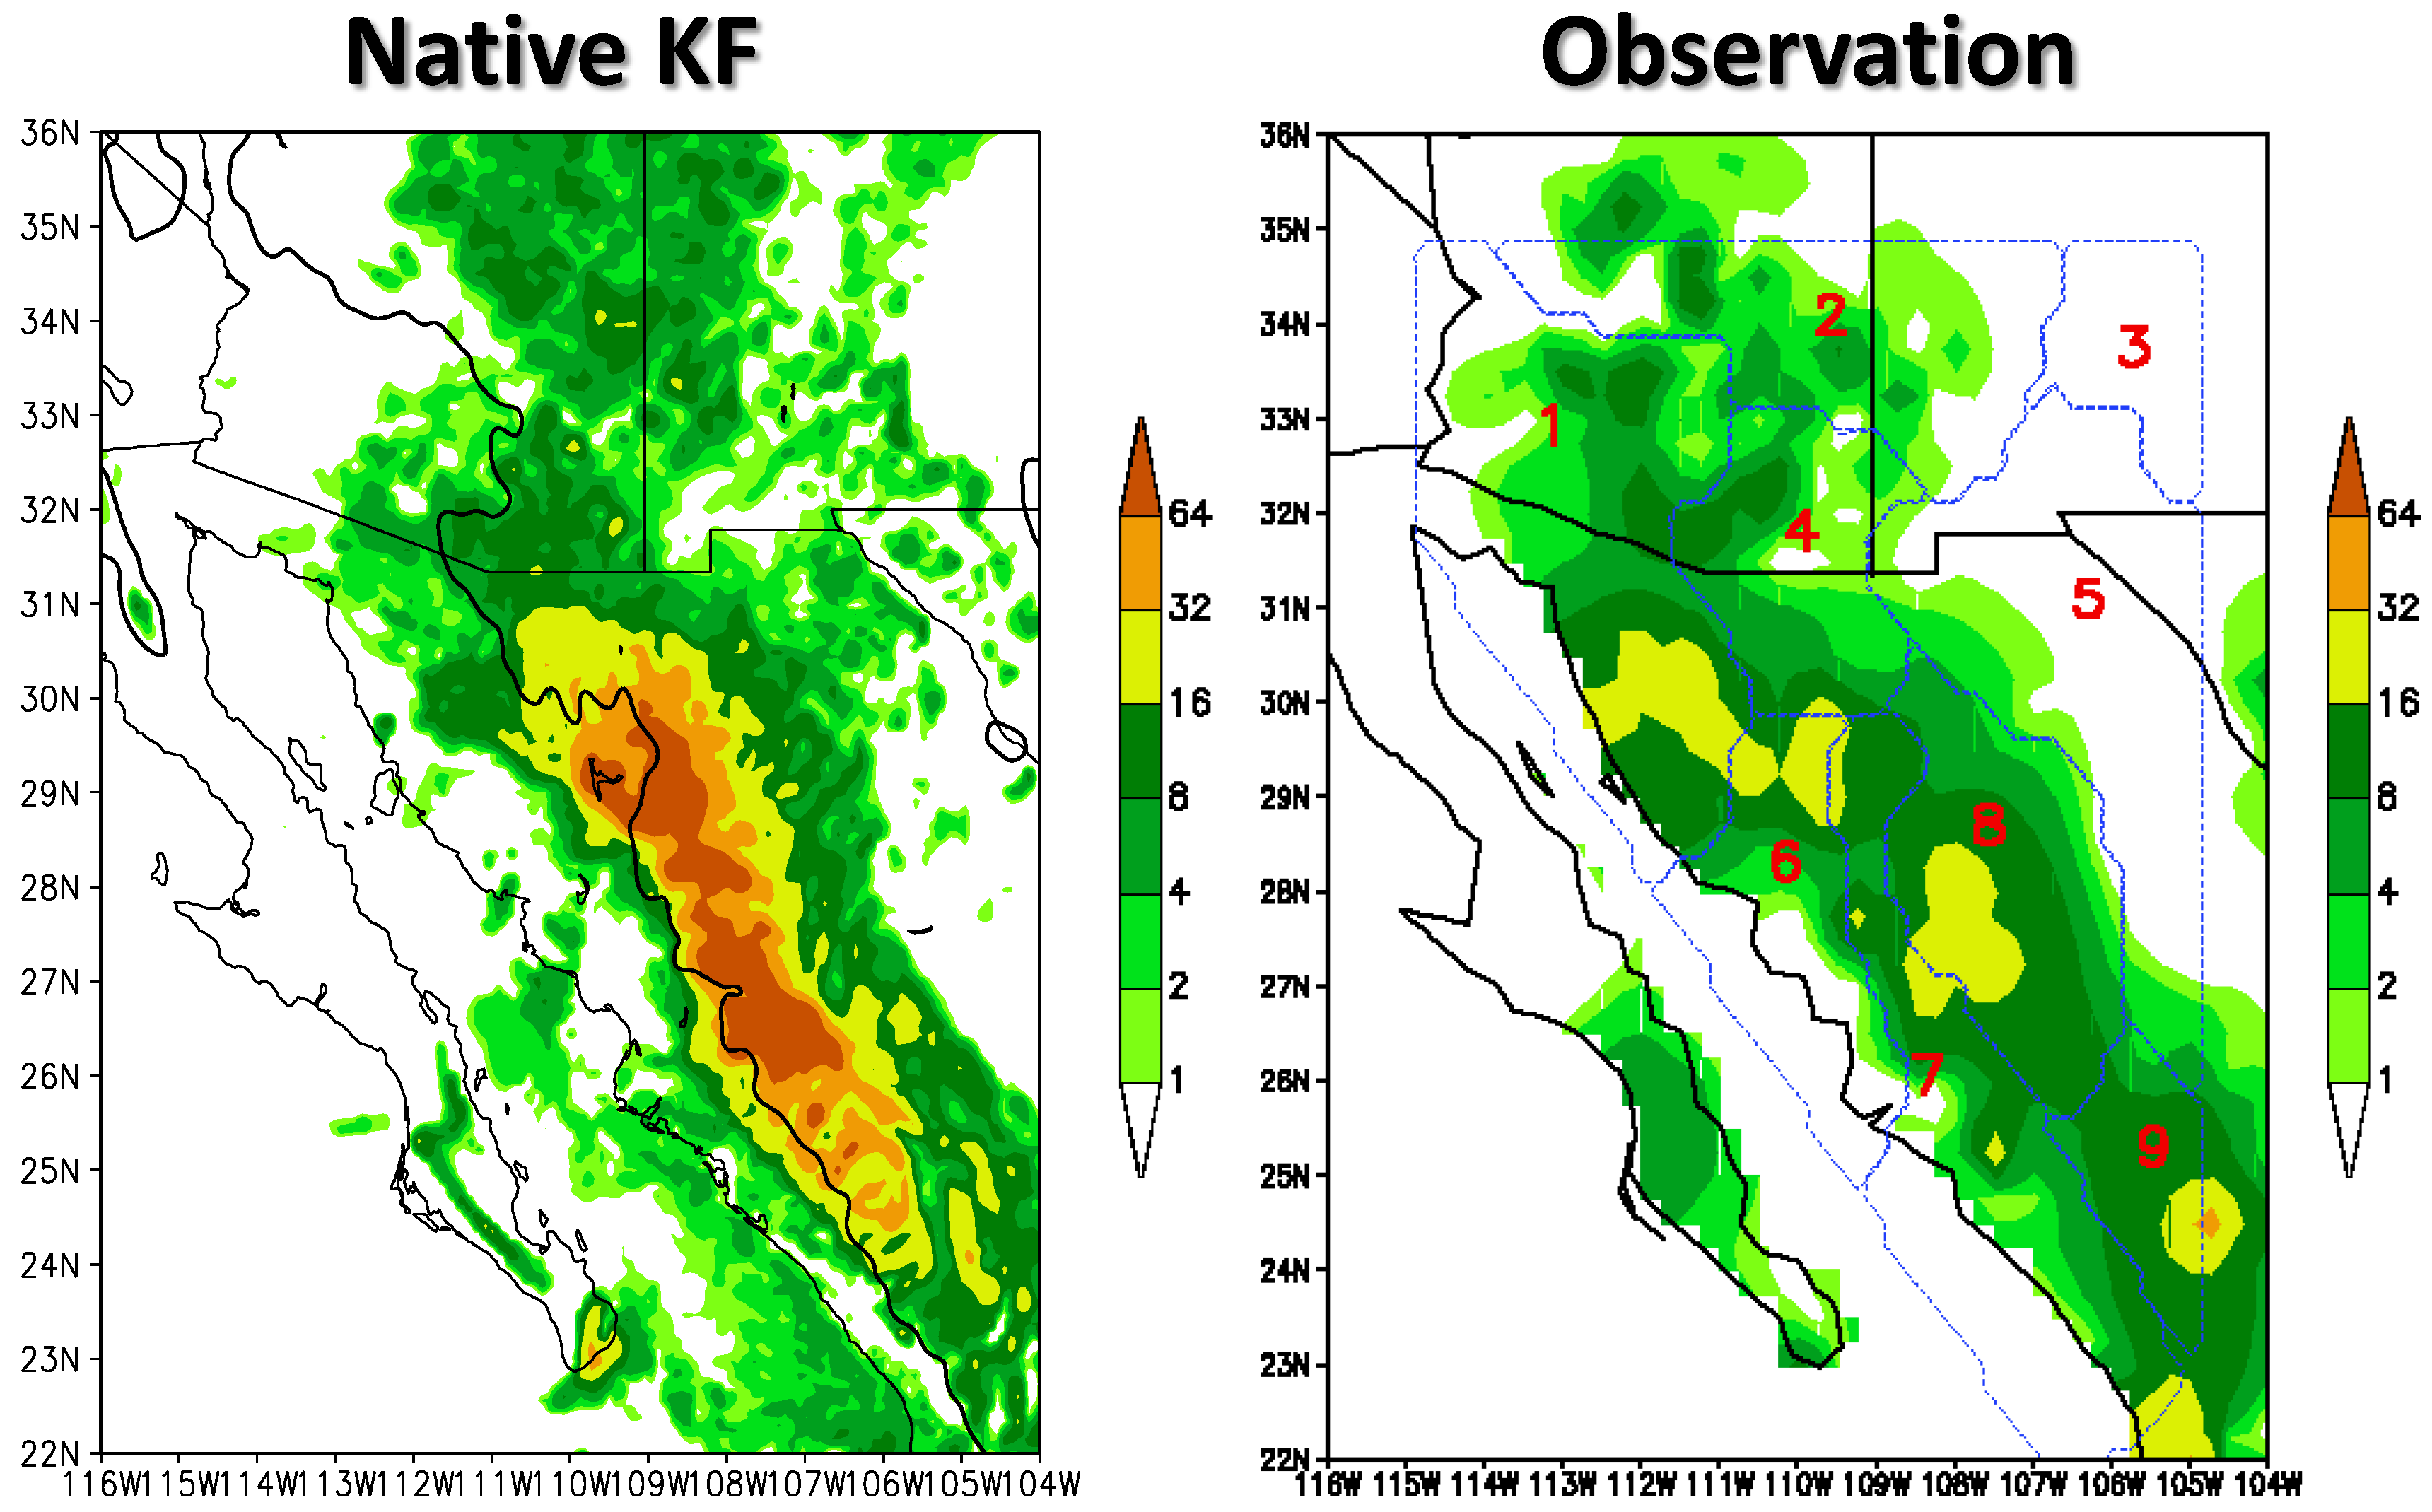
4.4. Differences in Model Simulated Precipitation and Comparison with Observations

The 24 h observed and modeled precipitation for NAME IOP2 is shown in Figure 9 for the 10 km WRF grid, along with the differences in model-simulated precipitation given by the modified and native KF CPSs. The specific period is 12 UTC 13 July to 12 UTC 14 July. Observed precipitation is from the NAME observational rain gauge network. On the top left of the figure is the model-accumulated precipitation using the native KF CPS. This CPS, as suspected, overestimates precipitation over the Sierra Madre Occidental (SMO) where convection is initiated but underestimates it further west, more a distance from the mountains and toward the coast of the Gulf of California. Use of the modified KF CPS, on the lower left of the figure, reduces the precipitation over the SMO but increases the precipitation further west toward the coast, thus matching the NAME gauge-derived precipitation observations better. Specifically considering the differences between the modified and native KF CPSs in the lower right panel, the modified KF CPS clearly reduces the precipitation that occurs directly over the SMO. The reduction in the 24-h model simulated precipitation is greater than 25 mm (one inch) in some places. Increases in precipitation nearer to the coast with modified KF, for example to the north and west of the city of Hermosillo, are on the order of 8–16 mm. This is about half the total model simulated precipitation. Interestingly, there seems to be specific elevation transition point of approximately 1000 m that effectively separates those geographic areas on the domain where use of the modified KF CPS is decreasing precipitation versus where it is increasing it. For reference the 1000 m elevation contour is included on the figure. Below this elevation, it is fair to conclude that more of the precipitation is accounted for by westward propagating MCSs that occurred during the IOP, as discussed earlier in the cross-sectional analysis.
To further illustrate the improved representation of the propagating MCSs in the simulation with the modified KF CPS, we look more closely at the diurnal cycle of precipitation. The observed diurnal pattern in precipitation is shown in Figure 10 for two six hour periods corresponding to 18 UTC 13 July to 0 UTC 14 July (11 a.m.–5 p.m. local Arizona time) and 0 UTC 14 July to 6 UTC 14 July (5 p.m.–11 p.m. local Arizona time). Two sources of observational data are shown in Figure 9, both have sufficient temporal resolution to capture this diurnal evolution of precipitation, the Stage IV combined radar-gauge product and the TRMM satellite-derived precipitation. Stage IV is the better product in terms of spatial and temporal resolution, but its coverage does not extend south of the U.S.-Mexico border while the TRMM product does. These two periods approximately reflect the two distinct periods of development of monsoon thunderstorms in the context of the diurnal cycle. Air-mass type thunderstorms develop in early to late afternoon over complex terrain, as indicated by isolated areas of precipitation occurring more over the peaks of the terrain. Larger, more organized convective lines form with more intense precipitation during the late afternoon to evening hours, reflecting the organization of westward propagating MCSs. The TRMM data indicate that the strongest MCS, with highest rainfall during this period exceeding 20 mm, is located in northwestern Sonora, northwest of the city of Hermosillo, corresponding well with the areas of lowest OLR and coldest cloud tops on the enhanced infrared imagery of NAME IOP2 shown earlier in Figure 4.
Since we already know that the modified KF CPS is mostly improving the ability of WRF to simulate organized MCS-type convection, we show the model-simulated precipitation differences between the modified and native KF CPSs in Figure 11. This figure is nearly identical to Figure 8, but just focuses to the late afternoon to early evening period when the MCSs are most apparent in the TRMM data and enhanced infrared satellite imagery. The difference in model-simulated precipitation on the far right of the figure is entirely consistent with Figure 9, but the pattern differences previously noted become even more apparent during the peak time of MCS development. Use of the modified KF CPS decreases the precipitation above an elevation of 1000 m, directly over the SMO, but increases below 1000 m, further west in lowland desert areas toward the Gulf of California and away from the mountain range.

5. Value Added in a Regional Climate Modeling Experiment

Given the improvements observed in the simulation of organized, propagating convection for the NAME IOP2 case, we want to evaluate if the modified KF CPS can help alleviate the noted common biases in the simulation of warm season precipitation within the North American monsoon region in long-term, regional climate model (RCM) simulations. As described earlier in the methods section, the dynamical downscaling of the NCEP-NCAR reanalysis for the period 1950–2010 described in [62] is repeated with use of the modified KF CPS. This RCM simulation is categorized as type 2 dynamical downscaling, from the classification of [57], in which the initial conditions within the regional model are forgotten and lateral boundary forcing may be considered from a retrospective atmospheric reanalysis, as a “perfect” representation of the observed atmosphere.

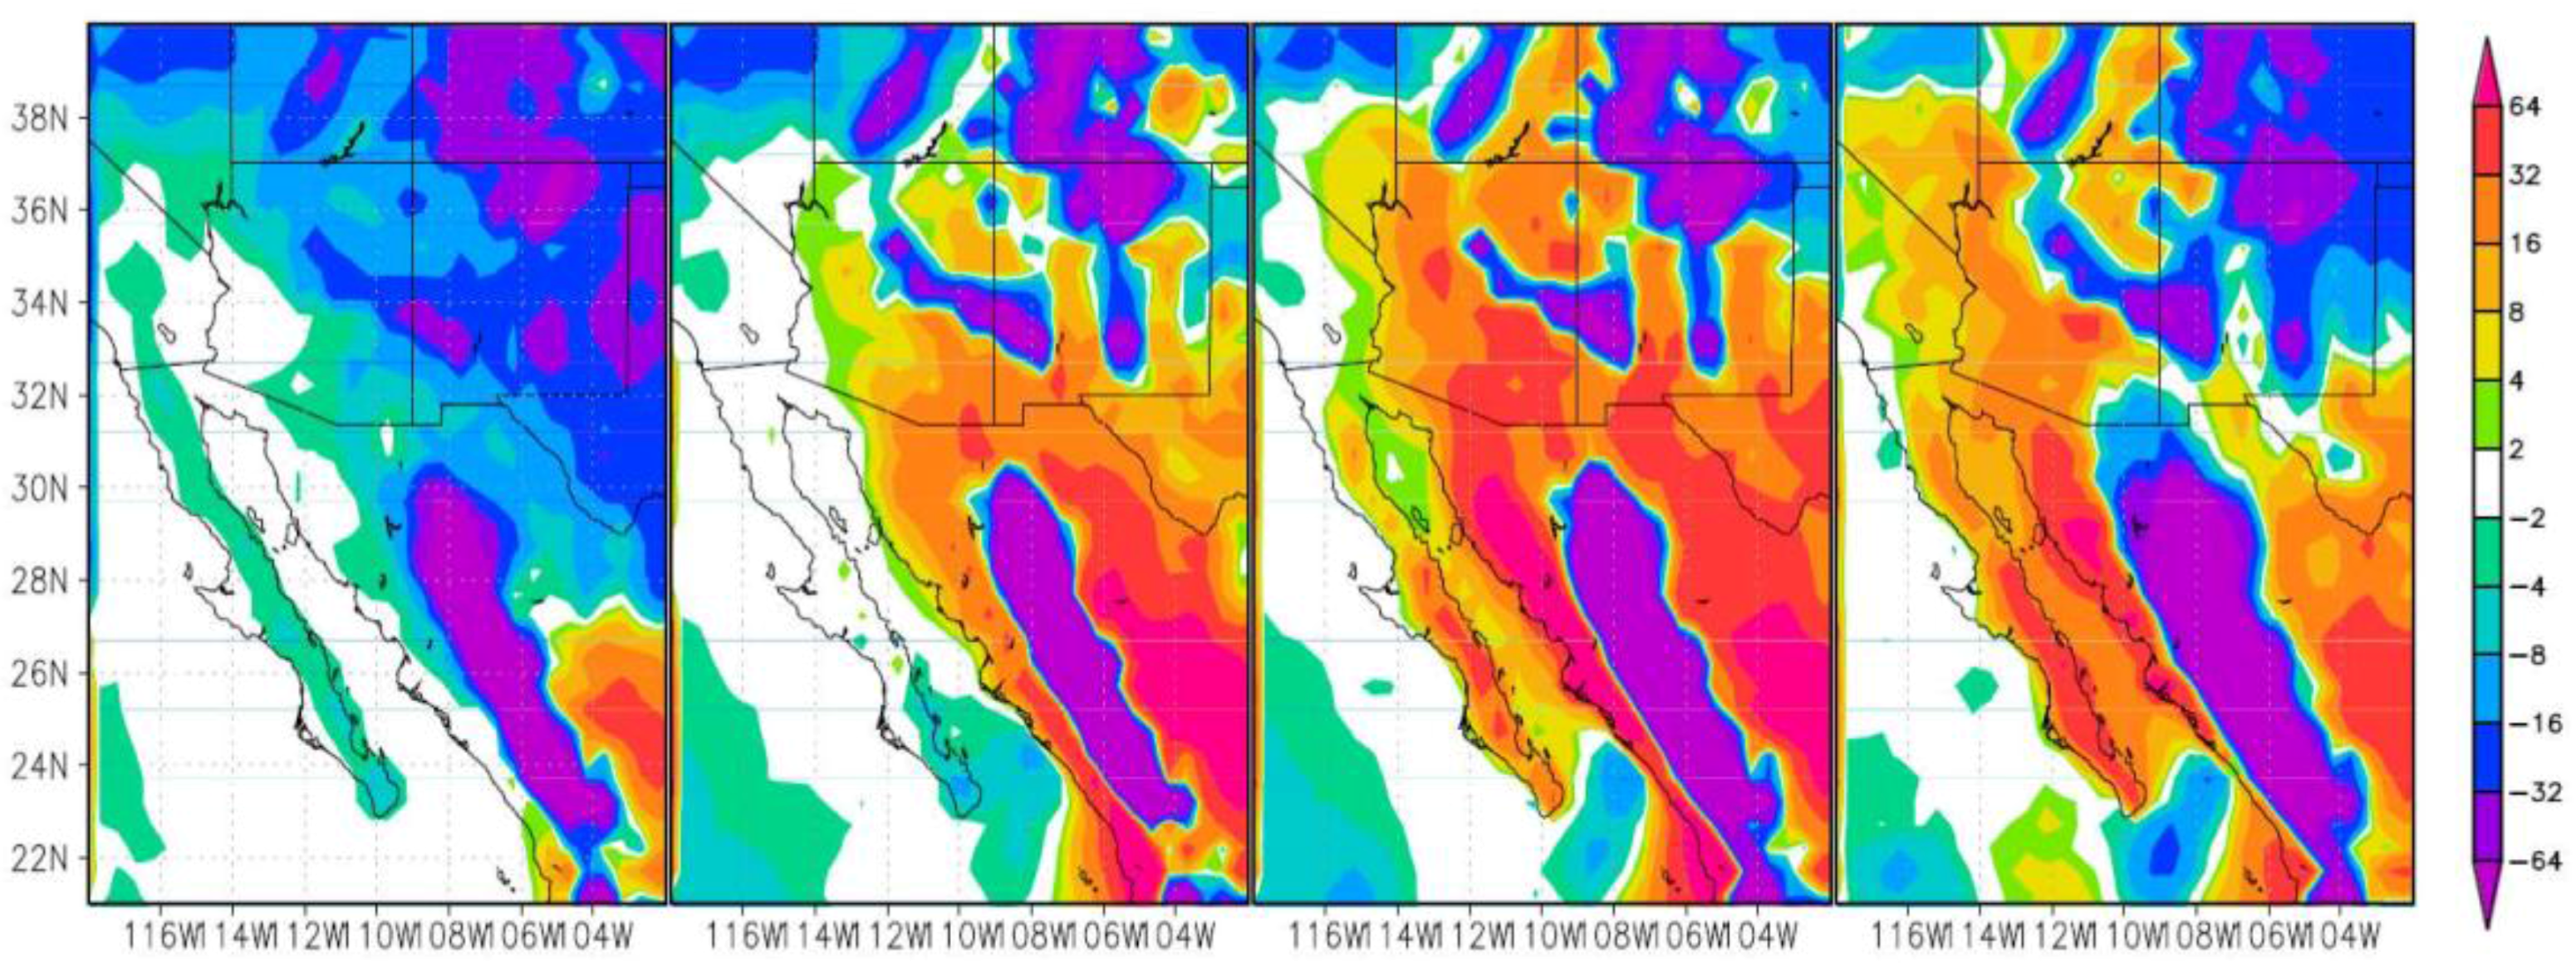
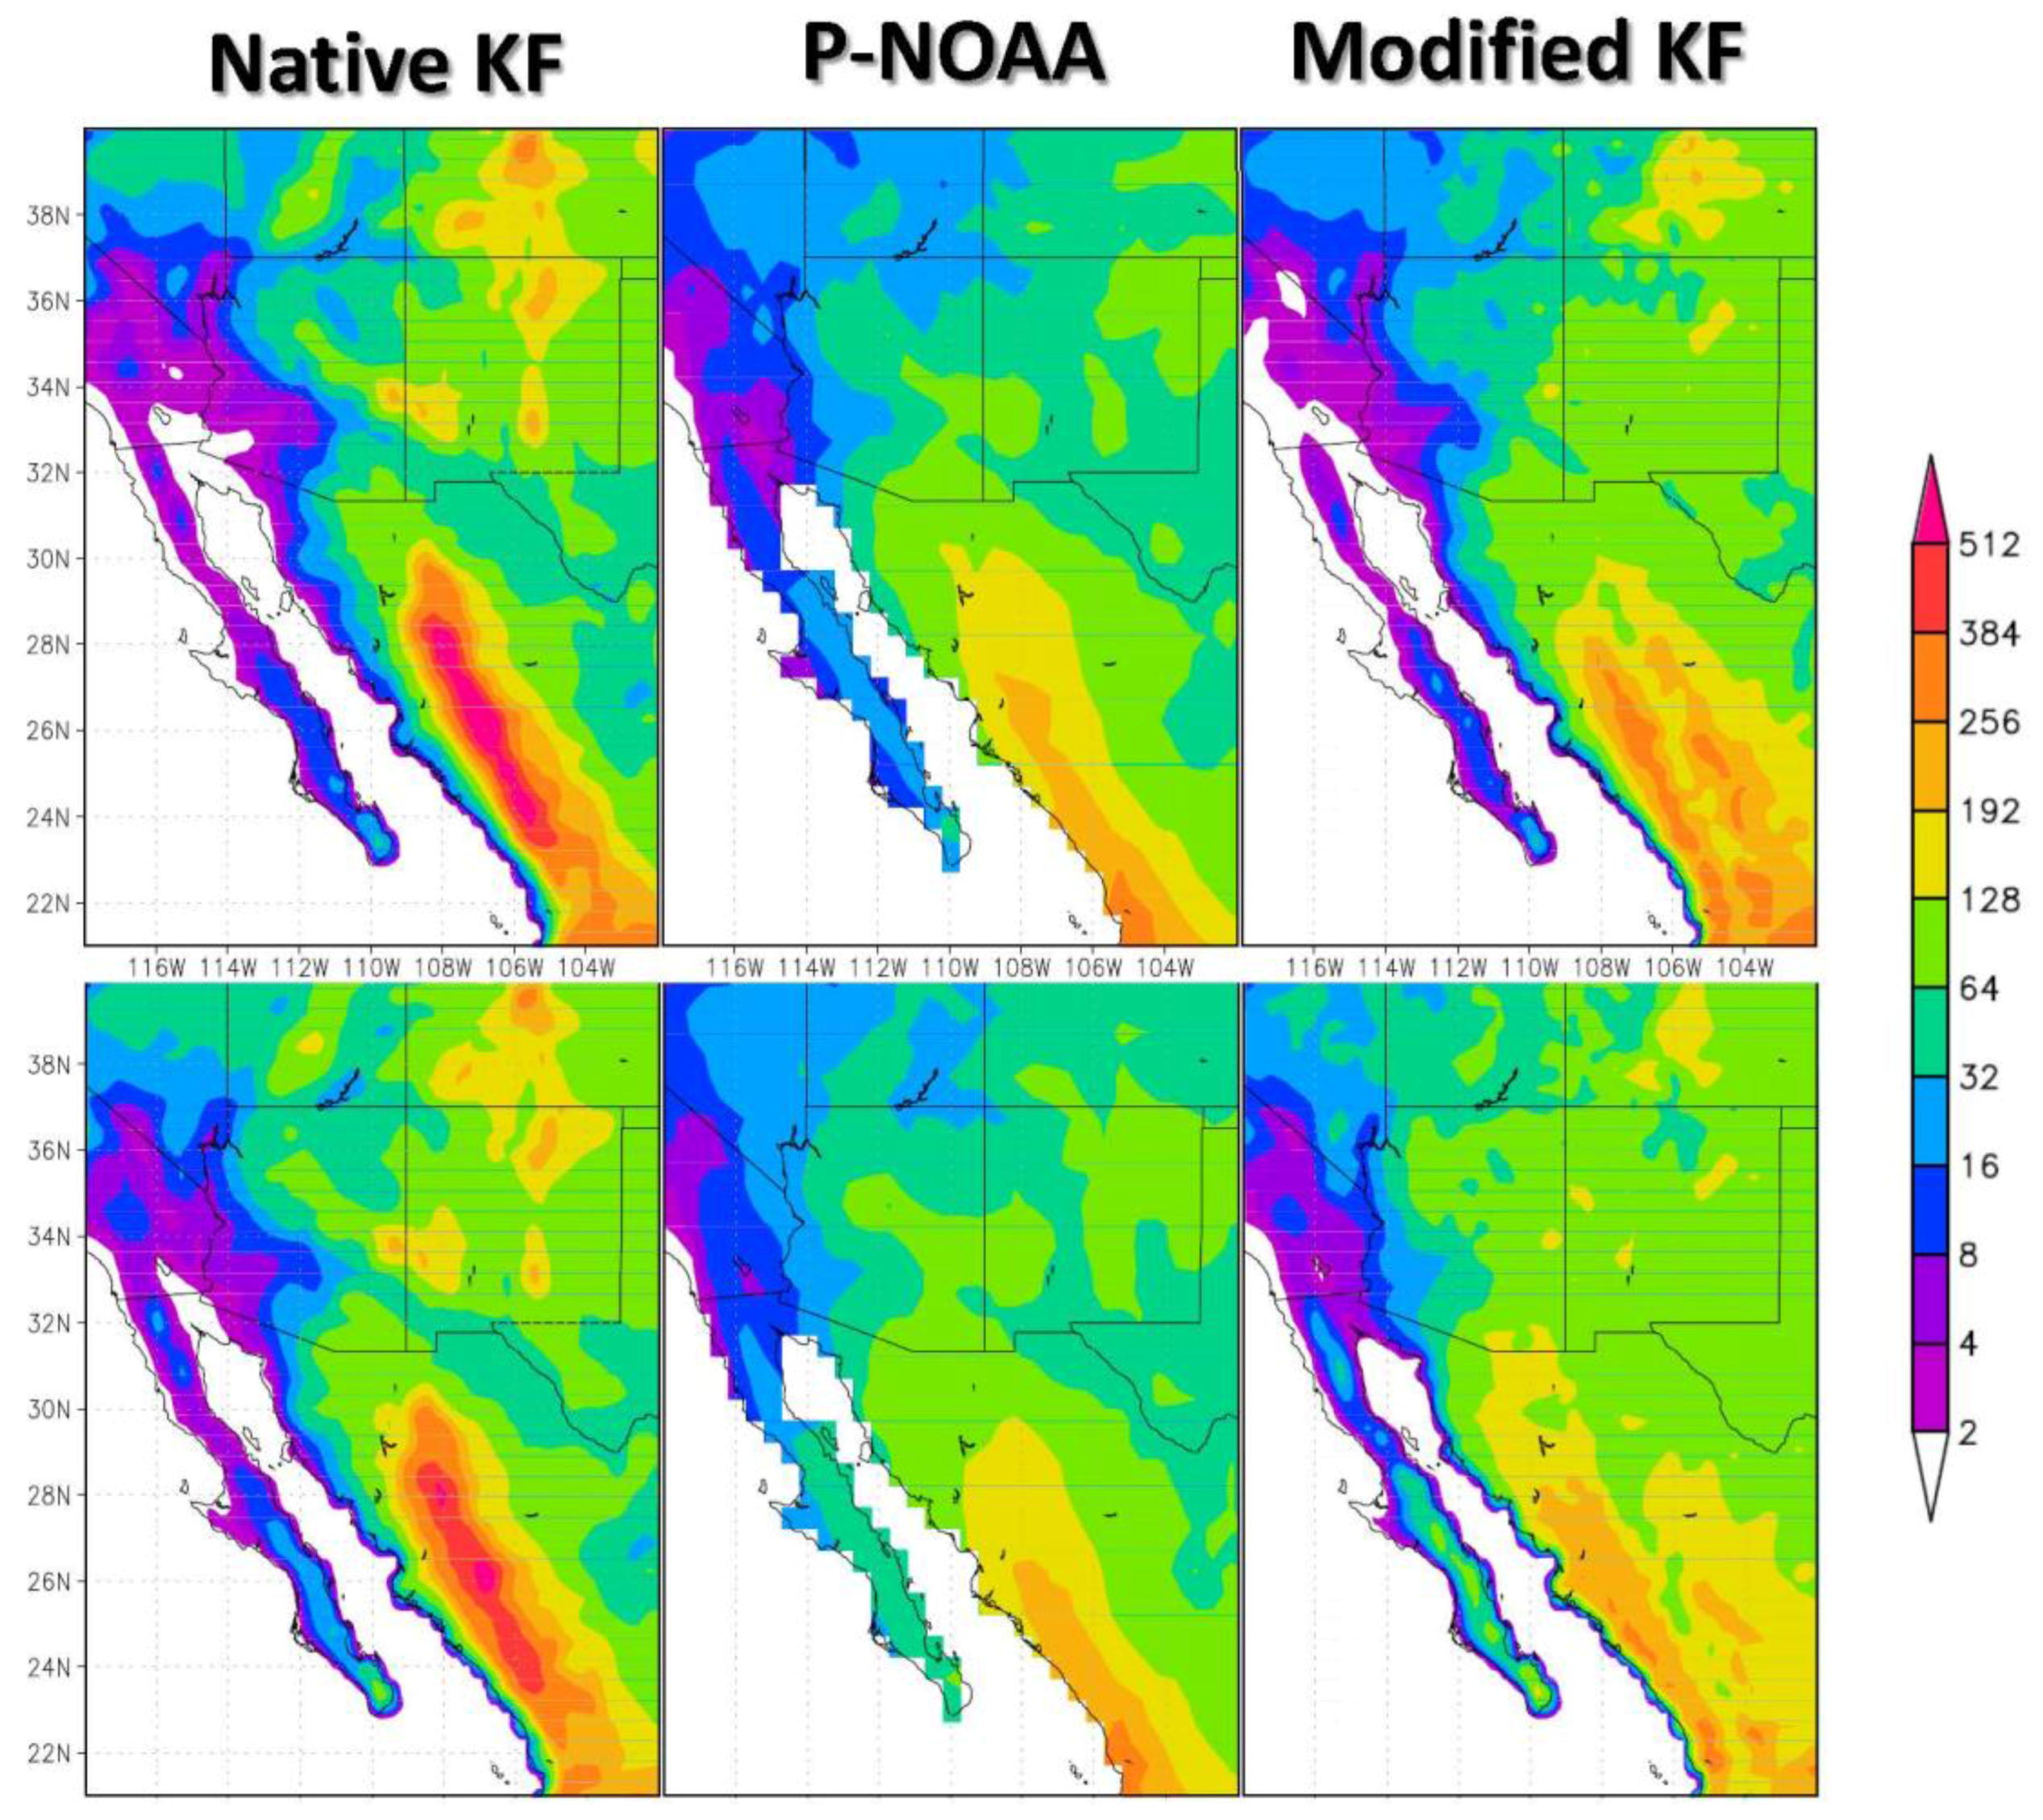
5.1. Changes in Model-Simulated Monsoon Precipitation in the 60-Year RCM Experiment

The 60-year average precipitation of July and August is shown in Figure 12 for the simulation with the native and modified KF CPSs, and a 0.5° by 0.5° gridded National Oceanic and Atmospheric Administration (NOAA) long-term U.S.-Mexico precipitation data set product (P-NOAA) [59] over the region of the Southwest U.S. and northwest Mexico. The maximum in precipitation in the P-NOAA data is located just west of the SMO crest, with precipitation amounts during the monsoon on the order of 200–250 mm per month. In the RCM simulation with the native KF CPS, not surprisingly, monsoon precipitation is overestimated directly over the SMO crest, with amounts exceeding 400 mm at the highest elevations, nearly double that of observed. The modified KF CPS is able to substantially reduce the model-simulated precipitation over the SMO, but about half, and shift the maxima in precipitation further west toward the coast, generally more in accordance with the P-NOAA observations.
The bias pattern in downscaled reanalysis precipitation during the warm season in North America with WRF has been described in [21], as previously mentioned. Figure 13, taken from their paper, shows this bias pattern. Generally speaking for the North American monsoon region, WRF when used as a RCM overestimates precipitation over the highest complex terrain and underestimates it at lower elevations. We show the warm season monthly differences between the use of the modified and native KF CPSs in Figure 14. Consistent with the earlier analysis, the modified KF CPS decreases precipitation over the highest mountains of the SMO and Mogollon Rim and increases it at lower elevations where organized convection accounts for a greater proportion of monsoon precipitation. The monthly average precipitation differences can be as high as 60 mm (more than 2 inches) in some places. There is also a notable overall regional reduction in monsoon precipitation during the initiation of the monsoon in June in Mexico. During this time, any monsoon precipitation would be from air-mass type thunderstorms that would typically be relatively weaker with higher cloud bases because the atmosphere has not been moistened enough. These early season thunderstorms would be more likely to be confined to mountain areas, with less of a tendency to organize. The positive differences in precipitation off the peaks of the mountain ranges become apparent from July onward through September, when the monsoon is in its mature phase and organized convection would be more likely to occur. The basic conclusion is that the same types of improvements in model-simulated precipitation demonstrated for a numerical weather prediction-type experiment of NAME IOP2 are also present in the 60-year RCM experiment.

5.2. Simulating Extreme Weather Events at Convective-Permitting Scales

One of our research interests is to use long-term sources of dynamically downscaled data as a database for simulation of extreme weather events, for short-term numerical weather prediction-type simulations. How would use of downscaled reanalysis data with the modified KF CPS as the WRF boundary condition affect the simulation of organized convection for specific extreme weather events simulated at a convective-permitting scale, with the CPS deactivated on the convective-permitting grid? We show a sample simulation result of model-simulated organized convection at 2.5 km grid spacing for an event that took place on 16 July 2006 in Figure 15. This simulation uses the long-term WRF RCM experiments just described with the native and modified KF CPSs as boundary forcing. WRF model results and the corresponding Stage IV data are shown in the form of a Hovmöller diagram of hourly precipitation averaged latitudinally across the state of Arizona during the peak of a convective event. The Hovmöller figures are constructed such that each point displays the maximum rainfall of the current longitude taken from 30.6° N to 33.6° N:
r m ( x , t ) = max 30.6 y 33.6 r ( x , y , t )
where r(x,y,t) is hourly rainfall at longitude x, latitude y, and time t. rm(x,t) is latitudinal maximum rainfall at longitude x, and time t. This is to show the propagation of the storm.
The comparison of WRF model-simulated hourly precipitation is much better overall on the convective-permitting grid with use of boundary forcing from the RCM simulation with the modified KF CPS. It is able to simulate an organized MCS that propagates westward toward the city of Yuma, AZ, very similar to the Stage IV observations. By contrast, the same simulation using the boundary forcing from the RCM simulation with the native KF CPS presents a comparatively weaker MCS that does not propagate westward across the entire state of Arizona.

6. Summary and Discussion

We have demonstrated the value added of the modified KF CPS originally described in [42] in dynamical downscaling paradigms of numerical weather prediction and regional climate modeling with WRF. We first verified that the modified KF CPS is able to reproduce the results of the extreme precipitation event in Vietnam considered in their original RAMS study. Though the WRF simulated precipitation amounts are different than RAMS for the Vietnam case, we find that use of the modified KF CPS similarly increases the modeled precipitation amounts on a ten-kilometer grid such that they are closer to observations. Next, we repeated the NAME IOP 2 WRF modeling experiments described in [25] with the modified KF CPS. Clear and dramatic improvements in the model simulations were found in the following aspects: Representation of the vertical structure and timing of the gulf surge, organization and propagation of a MCS, and alleviation of model-simulated precipitation biases, by decreasing the precipitation over complex terrain and increasing more off the terrain in lowland desert regions toward the Gulf of California.
We also repeated the dynamical downscaling of an atmospheric reanalysis originally described in [62] with the modified KF CPS. Similar to the NWP-type simulations of NAME IOP2, use of the modified KF CPS yields results that compare better with observed precipitation, alleviating well-known positive biases in the regional model-simulated rainfall over the SMO, for example as described in [21]. Monsoon precipitation also increases in more lowland areas at further distance from terrain, where MCS-type convection would account for a greater proportion of the total monsoon precipitation. When the RCM simulations are further dynamically downscaled to convective-permitting scales (2.5 km) in WRF to simulate extreme precipitation events, we find that the use of the RCM simulation with the modified KF CPS also has a positive impact on the representation of organized convection, even though the CPS is not activated on this grid.
The modified KF CPS is better because it produces a more physically realistic representation of the formation and development of MCSs during the North American monsoon on the meso-β scale. It thus helps to address a fundamental problem in regional modeling of North American monsoon precipitation that has been noted in multiple studies in the NAME literature, including some of our own prior work. We emphasize that the goal of this present work was to show the value added of the modified KF CPS in the context of: (1) WRF employed regional climate model with meso-β scale grid spacing, where convective parameterization must necessarily be applied, and (2) simulating MCSs that develop in association with complex terrain in monsoonal climates. We suggest future work should evaluate the use of the modified KF CPS in comparison to convective-permitting simulations and atmospheric model simulations that utilize super-parameterization approaches, in terms of the aspects of physical representation of organized convection and computational efficiency. Further testing of the modified scheme is also necessary to evaluate its performance in a broader variety of climatic regimes that are subject to organized convection.

Acknowledgments

This work was principally supported by the US Department of Energy Award Number DE-SC0001172 grant. Additional support from the Strategic Environmental Research and Development Program (SERDP, project RC-2205) through the U.S. Departments of Defense and Energy and U.S. Environmental Protection Agency. We thank two anonymous reviewers for their comments which improved the quality of the manuscript.

Author Contributions

Thang Luong and Christopher Castro conceived and designed the experiments; all authors performed the experiments and analyzed the data; William Cassell contributed reagents/materials/analysis tools; Thang Luong and Christopher Castro wrote the paper.

Conflicts of Interest

The authors declare no conflict of interest.

References

  1. Castro, C.L.; Pielke, R.A.; Adegoke, J.O. Investigation of the summer climate of the contiguous United States and Mexico using the regional atmospheric modeling system (RAMS). Part 1: Model climatology (1950–2002). J. Clim. 2007, 20, 3844–3865. [Google Scholar] [CrossRef]
  2. Finch, Z.O.; Johnson, R.H. Observational analysis of an upper-level inverted trough during the 2004 North American Monsoon Experiment. Mon. Weather Rev. 2010, 138, 3540–3555. [Google Scholar] [CrossRef]
  3. Newman, A.; Johnson, R.H. Mechanisms for precipitation enhancement in a North American monsoon upper-tropospheric trough. J. Atmos. Sci. 2012, 69, 1775–1792. [Google Scholar] [CrossRef]
  4. Watson, A.I.; Lopez, R.E.; Holle, R.L. Diurnal cloud-to-ground lightning patterns in Arizona during the southwest monsoon. Mon. Weather Rev. 1994, 122, 1716–1725. [Google Scholar] [CrossRef]
  5. Douglas, M.W.; Maddox, R.A.; Howard, K.; Reyes, S. The Mexican monsoon. J. Clim. 1993, 6, 1665–1677. [Google Scholar] [CrossRef]
  6. Adams, D.K.; Comrie, A.C. The North American monsoon. Bull. Am. Meteorol. Soc. 1997, 78, 2197–2213. [Google Scholar] [CrossRef]
  7. Ray, A.J.; Garfin, G.M.; Wilder, M.; Vasquez-Leon, M.; Lenart, M.; Comrie, A.C. Applications of monsoon research: Opportunities to inform decision making and reduce regional vulnerability. J. Clim. 2007, 20, 1608–1627. [Google Scholar] [CrossRef]
  8. Pytlak, E.; Goering, M.; Bennett, A. Upper tropospheric troughs and their interaction with the North American monsoon. In Proceedings of the 19th Conference in Hidrology AMS, San Diego, CA, USA, 9–13 January 2005. [Google Scholar]
  9. Bieda, S.W.; Castro, C.L.; Mullen, S.L.; Comrie, A.C.; Pytlak, E. The relationship of transient upper-level troughs to variability of the North American monsoon system. J. Clim. 2009, 22, 4213–4227. [Google Scholar] [CrossRef]
  10. Seastrand, S.; Serra, Y.; Castro, C.; Ritchie, E. The dominant synoptic-scale modes of North American monsoon precipitation. Int. J. Climatol. 2015, 35, 2019–2032. [Google Scholar] [CrossRef]
  11. Lahmers, T.M.; Castro, C.L.; Adams, D.K.; Serra, Y.L.; Brost, J.J.; Luong, T. Long-term changes in the climatology of transient inverted troughs over the North American monsoon region and their effects on precipitation. J. Clim. 2016, 29, 6037–6064. [Google Scholar] [CrossRef]
  12. Pielke, R.A.; Pearce, R.P. Mesoscale Modeling of the Atmosphere. Meteorological Monographs; Springer: Berlin, Germany, 1994; Volume 25, pp. 1–167. [Google Scholar]
  13. Janowiak, J.E.; Dagostaro, V.J.; Kousky, V.E.; Joyce, R.J. An examination of precipitation in observations and model forecasts during name with emphasis on the diurnal cycle. J. Clim. 2007, 20, 1680–1692. [Google Scholar] [CrossRef]
  14. Smith, W.P.; Gall, R.L. Tropical squall lines of the Arizona monsoon. Mon. Weather Rev. 1989, 117, 1553–1569. [Google Scholar] [CrossRef]
  15. McCollum, D.M.; Maddox, R.A.; Howard, K.W. Case-study of a severe mesoscale convective system in central Arizona. Weather Forecast. 1995, 10, 643–665. [Google Scholar] [CrossRef]
  16. Douglas, M.W. The summertime low-level jet over the gulf of California. Mon. Weather Rev. 1995, 123, 2334–2347. [Google Scholar] [CrossRef]
  17. Zehnder, J.A. Dynamic mechanisms of the gulf surge. J. Geophys. Res. Atmos. 2004, 109. [Google Scholar] [CrossRef]
  18. Schiffer, N.J.; Nesbitt, S.W. Flow, moisture, and thermodynamic variability associated with gulf of California surges within the North American monsoon. J. Clim. 2012, 25, 4220–4241. [Google Scholar] [CrossRef]
  19. Rotunno, R.; Klemp, J.B.; Weisman, M.L. A theory for strong, long-lived squall lines. J. Atmos. Sci. 1988, 45, 463–485. [Google Scholar] [CrossRef]
  20. Lang, T.J.; Ahijevych, D.A.; Nesbitt, S.W.; Carbone, R.E.; Rutledge, S.A.; Cifelli, R. Radar-observed characteristics of precipitating systems during name 2004. J. Clim. 2007, 20, 1713–1733. [Google Scholar] [CrossRef]
  21. Castro, C.L.; Chang, H.I.; Dominguez, F.; Carrillo, C.; Schemm, J.K.; Juang, H.M.H. Can a regional climate model improve the ability to forecast the North American monsoon? J. Clim. 2012, 25, 8212–8237. [Google Scholar] [CrossRef]
  22. Collier, J.C.; Zhang, G.J. Effects of increased horizontal resolution on simulation of the North American monsoon in the NCAR CAM3: An evaluation based on surface, satellite, and reanalysis data. J. Clim. 2007, 20, 1843–1861. [Google Scholar] [CrossRef]
  23. Lee, M.I.; Schubert, S.D.; Suarez, M.J.; Held, I.M.; Lau, N.C.; Ploshay, J.J.; Kumar, A.; Kim, H.K.; Schemm, J.K.E. An analysis of the warm-season diurnal cycle over the continental United States and Northern Mexico in general circulation models. J. Hydrometeorol. 2007, 8, 344–366. [Google Scholar] [CrossRef]
  24. Nesbitt, S.W.; Gochis, D.J.; Lang, T.J. The diurnal cycle of clouds and precipitation along the sierra madre occidental observed during name-2004: Implications for warm season precipitation estimation in complex terrain. J. Hydrometeorol. 2008, 9, 728–743. [Google Scholar] [CrossRef]
  25. Cassell, W.W.; Castro, C.L.; Luong, T.M.; Arellano, A. Simulating organized convection during the 2004 north american monsoon experiment and its sensitivity to the specification of initial conditions. Atmósfera 2017. Sumitted. [Google Scholar]
  26. Li, J.; Sorooshian, S.; Higgins, W.; Gao, X.; Imam, B.; Hsu, K. Influence of spatial resolution on diurnal variability during the North American monsoon. J. Clim. 2008, 21, 3967–3988. [Google Scholar] [CrossRef]
  27. Klemp, J.B.; Wilhelmson, R.B. Simulation of 3-dimensional convective storm dynamics. J. Atmos. Sci. 1978, 35, 1070–1096. [Google Scholar] [CrossRef]
  28. Klemp, J.B.; Wilhelmson, R.B. Simulations of right-moving and left-moving storms produced through storm splitting. J. Atmos. Sci. 1978, 35, 1097–1110. [Google Scholar] [CrossRef]
  29. Finley, C.A.; Cotton, W.R.; Pielke, R.A. Numerical simulation of tornadogenesis in a high-precipitation supercell. Part I: Storm evolution and transition into a bow echo. J. Atmos. Sci. 2001, 58, 1597–1629. [Google Scholar] [CrossRef]
  30. Cai, H.Q.; Wakimoto, R.M. Retrieved pressure field and its influence on the propagation of a supercell thunderstorm. Mon. Weather Rev. 2001, 129, 2695–2713. [Google Scholar] [CrossRef]
  31. Xu, K.M.; Randall, D.A. Updraft and downdraft statistics of simulated tropical and midlatitude cumulus convection. J. Atmos. Sci. 2001, 58, 1630–1649. [Google Scholar] [CrossRef]
  32. Doyle, J.D.; Durran, D.R. The dynamics of mountain-wave-induced rotors. J. Atmos. Sci. 2002, 59, 186–201. [Google Scholar] [CrossRef]
  33. Chu, C.M.; Lin, Y.L. Effects of orography on the generation and propagation of mesoscale convective systems in a two-dimensional conditionally unstable flow. J. Atmos. Sci. 2000, 57, 3817–3837. [Google Scholar] [CrossRef]
  34. Chen, S.H.; Lin, Y.L. Effects of moist froude number and cape on a conditionally unstable flow over a mesoscale mountain ridge. J. Atmos. Sci. 2005, 62, 331–350. [Google Scholar] [CrossRef]
  35. Grabowski, W.W.; Smolarkiewicz, P.K. CRCP: A cloud resolving convection parameterization for modeling the tropical convecting atmosphere. Physica D 1999, 133, 171–178. [Google Scholar] [CrossRef]
  36. Grabowski, W.W. Coupling cloud processes with the large-scale dynamics using the cloud-resolving convection parameterization (CRCP). J. Atmos. Sci. 2001, 58, 978–997. [Google Scholar] [CrossRef]
  37. Randall, D.; Khairoutdinov, M.; Arakawa, A.; Grabowski, W. Breaking the cloud parameterization deadlock. Bull. Am. Meteorol. Soc. 2003, 84, 1547–1564. [Google Scholar] [CrossRef]
  38. Arakawa, A.; Schubert, W.H. Interaction of a cumulus cloud ensemble with large-scale environment. Part I. J. Atmos. Sci. 1974, 31, 674–701. [Google Scholar] [CrossRef]
  39. Elliott, E.J.; Yu, S.; Kooperman, J.; Morrison, H.; Wang, M.; Pritchard, M.S. Sensitivity of summer ensembles of fledgling superparameterized U.S. Mesoscale convective systems to cloud resolving model microphysics and grid configuration. J. Adv. Model. Earth Syst. 2016, 8, 634–649. [Google Scholar] [CrossRef]
  40. Kooperman, G.J.; Pritchard, M.S.; Somerville, R.C.J. Robustness and sensitivities of central U.S. Summer convection in the super-parameterized CAM: Multi-model comparison with a new regional EOF index. Geophys. Res. Lett. 2013, 40, 3287–3291. [Google Scholar] [CrossRef]
  41. Grabowski, W.W. An improved framework for superparameterization. J. Atmos. Sci. 2004, 61, 1940–1952. [Google Scholar] [CrossRef]
  42. Nguyen, M.T.; Tran, T.T.; Pielke, R.A.; Castro, C.L.; Leoncini, G. A modified Kain-Fritsch scheme and its application for the simulation of an extreme precipitation event in Vietnam. Mon. Weather Rev. 2009, 137, 766–789. [Google Scholar]
  43. Phan, V.T.; Ngo-Duc, T.; Ho, T.M.H. Seasonal and interannual variations of surface climate elements over Vietnam. Clim. Res. 2009, 40, 49–60. [Google Scholar] [CrossRef]
  44. Nguyen-Le, D.; Matsumoto, J.; Ngo-Duc, T. Onset of the rainy seasons in the eastern Indochina Peninsula. J. Clim. 2015, 38, 5645–5666. [Google Scholar] [CrossRef]
  45. Yokoi, S.; Matsumoto, J. Collaborative effects of cold surge and tropical depression-type disturbance on heavy rainfall in central Vietnam. Mon. Weather Rev. 2008, 136, 3275–3287. [Google Scholar] [CrossRef]
  46. Xu, H.; Xie, S.P.; Wang, Y.; Zhuang, W.; Wang, D. Orographic effects on south china sea summer climate. Meteorol. Atmos. Phys. 2008, 100, 275–289. [Google Scholar] [CrossRef]
  47. The North American Monsoon Experiment Website. Available online: http://catalog.eol.ucar.edu/name/catalog/missions.Html (accessed on 20 November 2017).
  48. Rogers, P.J.; Johnson, R.H. Analysis of the 13–14 July gulf surge event during the 2004 North American Monsoon Experiment. Mon. Weather Rev. 2007, 135, 3098–3117. [Google Scholar] [CrossRef]
  49. Skamarock, W.C. Coauthors. A Description of the Advanced Research WRF Version 3; NCAR Tech. Note NCAR/TN-475+STR; National Center for Atmospheric Research: Boulder, CO, USA, 2008; pp. 1–113. [Google Scholar]
  50. The UA-HAS Weather Forecast Website. Available online: http://www.atmo.arizona.edu/index.php?section=weather (accessed on 20 november 2017).
  51. Higgins, W.; Gochis, D.J. Synthesis of results from the North American Monsoon Experiment (NAME) process study. J. Clim. 2007, 20, 1601–1607. [Google Scholar] [CrossRef]
  52. Lin, Y.L.; Farley, R.D.; Orville, H.D. Bulk parameterization of the snow field in a cloud model. J. Clim. Appl. Meteorol. 1983, 22, 1065–1092. [Google Scholar] [CrossRef]
  53. Janjic, Z.I. The step-mountain eta coordinate model—Further developments of the convection, viscous sublayer, and turbulence closure schemes. Mon. Weather Rev. 1994, 122, 927–945. [Google Scholar] [CrossRef]
  54. Tewari, M.; Chen, F.; Wang, W.; Dudhia, J.; LeMone, M.A.; Mitchell, K.; Ek, M.; Gayno, G.; Wegiel, J.; Cuenca, R.H. Implementation and verification of the unified NOAH land surface model in the WRF model. In Proceedings of the 20th Conference on Weather Analysis and Forecasting/16th Conference on Numerical Weather Prediction, Seattle, WA, USA, 14 January 2004; pp. 11–15. [Google Scholar]
  55. Iacono, M.J.; Delamere, J.S.; Mlawer, E.J.; Shephard, M.W.; Clough, S.A.; Collins, W.D. Radiative forcing by long-lived greenhouse gases: Calculations with the AER radiative transfer models. J. Geophys. Res. Atmos. 2008, 113. [Google Scholar] [CrossRef]
  56. Kain, J.S. The Kain-Fritsch convective parameterization: An update. J. Appl. Meteorol. 2004, 43, 170–181. [Google Scholar] [CrossRef]
  57. Castro, C.L.; Pielke, R.A.; Leoncini, G. Dynamical downscaling: Assessment of value retained and added using the regional atmospheric modeling system (RAMS). J. Geophys. Res. Atmos. 2005, 110. [Google Scholar] [CrossRef]
  58. Mesinger, F.; DiMego, G.; Kalnay, E.; Mitchell, K.; Shafran, P.C.; Ebisuzaki, W.; Jovic, D.; Woollen, J.; Rogers, E.; Berbery, E.H.; et al. North American regional reanalysis. Bull. Am. Meteorol. Soc. 2006, 87, 343–360. [Google Scholar] [CrossRef]
  59. Vose, R.S.; Applequist, S.; Squires, M.; Durre, I.; Menne, M.J.; Williams, C.N.; Fenimore, C.; Gleason, K.; Arndt, D. Improved historical temperature and precipitation time series for U.S. climate divisions. J. Appl. Meteorol. Clim. 2014, 53, 1232–1251. [Google Scholar] [CrossRef]
  60. Johnson, R.H.; Ciesielski, P.E.; McNoldy, B.D.; Rogers, P.J.; Taft, R.K. Multiscale variability of the flow during the North American Monsoon Experiment. J. Clim. 2007, 20, 1628–1648. [Google Scholar] [CrossRef]
  61. Ciesielski, P.E.; Johnson, R.H. Diurnal cycle of surface flows during 2004 NAME and comparison to model reanalysis. J. Clim. 2008, 21, 3890–3913. [Google Scholar] [CrossRef]
  62. Chang, H.I.; Castro, C.L.; Carrillo, C.M.; Dominguez, F. The more extreme nature of us warm season climate in the recent observational record and two “well-performing” dynamically downscaled CMIP3 models. J. Geophys. Res. Atmos. 2015, 120, 8244–8263. [Google Scholar] [CrossRef]
  63. Houze, R.A. Cloud Dynamics; Academic Press: San Diego, CA, USA, 1993; p. 573. [Google Scholar]
Figure 1. Illustrative maps of the North American monsoon region under study. (Top left) North American Monsoon Experiment tier domains (Figure 1 from [51] ©American Meteorological Society. Used with permission). (Top right) WRF model domains used for simulation, with model grid spacing of 30, 10, and 2.5 km corresponding to domains 1, 2, and 3. (Bottom left) WRF domain 3 zoomed in, with the locations of cities and landmarks referenced within the text. The areas used to compute the cross section of a simulated MCS during NAME IOP 2 indicated. (Bottom right) Some key geographic areas referenced within the text.
Atmosphere 09 00031 g001
Figure 2. Accumulated precipitation (mm) for 48-h for Vietnam MCS case originally considered with RAMS model. Top: Equivalent WRF simulation results on domain 2 (10 km grid spacing) with native KF (left) and modified KF (right). Values of local precipitation maxima indicated in red. Bottom: Corresponding objective analyses of the observed gauge-derived precipitation (left), and TRMM data (right). Number in black is the absolute maxima at the location of the Thuong Nhat station (16.128° N, 107.688° E).
Atmosphere 09 00031 g002
Figure 3. Accumulated precipitation 48-h precipitation (mm) for Vietnam MCS case for the area of central Vietnam. Top: WRF simulated precipitation on convective-permitting domain 3 (2.5 km grid spacing) for native KF (left) and modified KF (right). Values of local precipitation maxima indicated in red. Bottom: Equivalent objective analyses of the observed gauge-derived precipitation (left), and TRMM data (right). Number in black is the absolute maxima measured at Thuong Nhat station (16.128° N, 107.688° E).
Atmosphere 09 00031 g003
Figure 4. GOES 10 satellite enhanced infrared imagery (4 km_ch4_thermal-IR) during period of MCS development within NAME IOP 2. Specific time of image is 0254 UTC 14 July 2004. From NCAR/EOL.
Atmosphere 09 00031 g004
Figure 5. Puerto Peñasco (a) wind profiler and (b) surface data from 0000 UTC 12 July to 0000 UTC 15 July. In (a), wind speed (m s−1) is plotted every half-hour and wind barbs every 2 h. One full barb equals 5 m s−1. Data not plotted for times and heights of low data confidence. In (b), surface temperature (°C, red), dewpoint temperature (°C, blue), and pressure (hPa, green) are averaged and plotted every half-hour. This figure is from [48], their Figure 4, ©American Meteorological Meteorological Society. Used with permission.
Atmosphere 09 00031 g005
Figure 6. WRF model simulation of the gulf surface at Puerto Peñasco during NAME IOP 2 from native KF (top), and modified KF (bottom), presented equivalently the wind profiler observations as shown in Figure 5a. Blue upward pointing arrow below x-axis indicates the approximate timing of the observed gulf surge.
Atmosphere 09 00031 g006
Figure 7. Cross-section of modified WRF model simulated total water condensation (kg kg−1) from 7 UTC to 12 UTC 14 July. Each panel indicates model output at the specified UTC time as labeled. Wind vectors are scaled such that the horizontal wind is ten times larger than the vertical wind in order to show updrafts and downdrafts. The vertical planes to construct the cross section are defined at latitude 26.8° N extending in the x-axis from 109.5° W to 106.5° W. The y-axis is log pressure scaling from 1000 mb at surface to 100 mb near the tropopause.
Atmosphere 09 00031 g007
Figure 8. Cross-sections of WRF model simulated radar reflectivity (dBZ) on domains 2 and 3 at 0300 UTC 14 July (top and bottom panels, respectively). Wind vectors on radar reflectivity panel are scaled such that the horizontal wind is ten times larger than the vertical wind. The vertical planes to construct the cross section are defined intersecting a point at 29.69° N and 111.4° W and extending along constant latitude from 112.5° W to 107.5° W, and the frames have a height of about 20 km. They are averages of parallel planes north and south of the center and extend through the depth of the model. Figure from [25], submitted manuscript.
Atmosphere 09 00031 g008
Figure 9. Accumulated precipitation (mm) for 24-h (12 UTC 13 July to 12 UTC 14 July) of NAME IOP2. Left: WRF simulation results for domain 2 (10 km) with native KF (top) and modified KF (bottom). Right: Equivalent results from NAME Tier-1 observational network (top), and difference between the 2 WRF simulations (bottom). Thin black contour on panels with WRF model results indicates the 1000 m elevation contour.
Atmosphere 09 00031 g009aAtmosphere 09 00031 g009b
Figure 10. Accumulated precipitation (mm) for the Stage IV product (left), and TRMM satellite data (right), respectively, for the 6-h period 0000 UTC 14 July to 0600 UTC 14 July during NAME IOP 2.
Atmosphere 09 00031 g010
Figure 11. Top: WRF simulated accumulated precipitation (mm) on convective-permitting domain 3 for the 6-h period 0000 UTC 14 July to 0600 UTC 14 during NAME IOP 2, for native KF (left) and modified KF (right). Bottom: Difference between the two simulation results. The thin black contour indicates the 1000 m elevation contour.
Atmosphere 09 00031 g011aAtmosphere 09 00031 g011b
Figure 12. Monthly mean precipitation (mm month-1) averaged over 60-year (1951–2010) of July (top) and August (bottom) for WRF with native KF scheme (left), P-NOAA observation (middle), and WRF with modified KF scheme (right) on domain 1 (35 km grid spacing).
Atmosphere 09 00031 g012
Figure 13. Average warm season (JJAS) precipitation bias (mm day−1) for WRF-NCEP (P-BIAS = RCM minus P-NOAA observation). Red (blue) colors indicate precipitation overestimation (underestimation) by WRF. From [21] ©American Meteorological Society. Used with permission.
Atmosphere 09 00031 g013
Figure 14. Differences of monthly mean precipitation (mm month−1) averaged over 1951–2010 period from left to right: June (far left), July (middle left), August (middle right), and September (far right). Differences are Modified KF minus Native KF, considering WRF domain 1 (35 km grid spacing).
Atmosphere 09 00031 g014
Figure 15. Hovmöller diagrams of hourly precipitation (mm) of a MCS-type monsoon thunderstorm propagating West-Northwesterly toward Yuma, Arizona, on July 16th 2006 for Stage IV product (top) and WRF simulations on convective-permitting domain 3 (2.5 km) with native KF (bottom left) and modified KF (bottom right).
Atmosphere 09 00031 g015

