Article

The Impact of Sampling Medium and Environment on Particle Morphology

1
Collaborative Innovation Center of Atmospheric Environment and Equipment Technology, School of Environmental Science and Engineering, Nanjing University of Information Science & Technology, Nanjing 210044, China
2
Department of Chemistry and Environmental Science, New Jersey Institute of Technology, Newark, NJ 07102, USA
3
Department of Chemical Biological and Pharmaceutical Engineering, New Jersey Institute of Technology, Newark, NJ 07102, USA
4
Center for Functional Nanomaterials, Brookhaven National Laboratory, Upton, NY 11973, USA
*
Author to whom correspondence should be addressed.
Atmosphere 2017, 8(9), 162; https://doi.org/10.3390/atmos8090162
Submission received: 23 July 2017 / Revised: 25 August 2017 / Accepted: 26 August 2017 / Published: 29 August 2017
(This article belongs to the Special Issue Morphology and Internal Mixing of Atmospheric Particles)

Abstract

:
Sampling on different substrates is commonly used in laboratory and field studies to investigate the morphology and mixing state of aerosol particles. Our focus was on the transformations that can occur to the collected particles during storage, handling, and analysis. Particle samples were prepared by electrostatic deposition of size-classified sodium chloride, sulfuric acid, and coated soot aerosols on different substrates. The samples were inspected by electron microscopy before and after exposure to various environments. For coated soot, the imaging results were compared against mass-mobility measurements of airborne particles that underwent similar treatments. The extent of sample alteration ranged from negligible to major, depending on the environment, substrate, and particle composition. We discussed the implications of our findings for cases where morphology and the mixing state of particles must be preserved, and cases where particle transformations are desirable.

1. Introduction

Atmospheric aerosols play a major role in regional air quality and global climate [1,2,3,4]. The effects of aerosols are highly dependent on the particle number concentration, and also on the particle size, composition, mixing state, phase state, and morphology. The knowledge of these properties is crucial for an accurate prediction of the environmental impacts of aerosols.
Although some current instrumentation is capable of online analysis of aerosol particles [5,6,7,8,9,10], the aerosol community is heavily reliant on off-line sampling, due to lower costs and a more comprehensive range of particle characterization methods available. Typically, a series of samples are collected during laboratory experiments or field measurements, with several replicates to ensure sufficient statistics. The samples are stored for hours, days, or even months, before being transported to the analysis facility, either by the researcher or over a commercial carrier. Finally, the samples are analyzed by the researcher or by the facility staff. Electron microscopy (EM) is a widely used off-line technique for particle analysis because it can provide a direct evaluation of the particle size and morphology [11]; also, particle composition can be assessed when EM is augmented by such methods as Energy-Dispersive X-ray Spectroscopy (EDX) or Electron Energy Loss Spectroscopy (EELS).
At every step in the above sequence, from collection through analysis, sample alteration is possible to a degree that the collected particles may fail to represent the original airborne particles, both individually and statistically. For instance, the collection of samples is often conducted by aerodynamic deposition of airborne particles on various substrates in a low-pressure cascade impactor [12]. This method may discriminate against solid particles, which tend to bounce off the substrate surface [13,14]. Greasing the substrate reduces particle bouncing, but is not always applicable when the sample is intended for EM imaging and chemical analysis. Since the impaction of particles occurs at a high velocity, the fragmentation of loosely connected agglomerates is possible, such as those produced by the Brownian coagulation of soot aggregates originally emitted by diesel engines; the original aggregates, however, are strongly bound and do not fragment upon impact [15]. Although the presence of a small amount of organic adsorbates stabilizes coagulation-produced agglomerates [15], thick liquid coatings could themselves be lost (“shaken off”) upon impaction of particles against substrate [16,17]. Collection approaches using electrostatic deposition [18,19], diffusion [15], or thermophoresis [20] are more gentle, but there are a number of factors which limit their use. Collection by filtration on porous membranes is by itself non-damaging [21], but typically requires a sputtered metal overcoat to make the sample electrically conductive, if it is intended for EM analysis. Also, such membrane samples by design are only suitable for examination by Scanning Electron Microscopy (SEM), but not for Transmission Electron Microscopy (TEM) because the membrane is not transparent to the electron beam. Thus, the choice of the particle collection and analysis methods imposes significant constraints on the choice of sampling substrates. While any sufficiently flat substrate that can be made electrically conductive by metal sputtering is suitable for SEM analysis, the application of TEM is limited to thin-film or web-like substrates that are sufficiently transparent for the electron beam.
A common limitation of standard TEM and SEM approaches comes from the need to place the particle sample under high vacuum, where evaporation of volatile and semi-volatile particle components is possible [22,23]. This problem is exacerbated by exposure of particles to the electron beam, leading to thermal evaporation and surface charging, reducing the image resolution and contrast. A lower accelerating voltage can be used to minimize this problem, but at the expense of a reduced resolution. One way to minimize sample damage is by using Environmental EM methods (i.e., ETEM and ESEM), where the sample is held at several millibar or even atmospheric pressure. Also, sample encapsulation under a thin membrane can be used to protect particles from high vacuum conditions [24].
Another frequently overlooked aspect of sample analysis involves substrate-particle interactions, which may depend strongly on the particle and substrate composition. For instance, interaction with the surface of beryllium substrate has been proposed to explain the failure to observe sulfuric acid particles after deposition [17]. The deliquescence point of water soluble particles [25] and mixing state of organic/inorganic aerosol particles [26] have been shown to depend on the hydrophilic properties of substrates. Hydrophilicity, or generally, the surface energy of the substrate, controls the ability of the particle material to wet the substrate surface, and hence the shape of liquid particles. At the limit of perfect wetting, a particle may lose its spherical shape entirely by spreading in a thin layer. Similarly, a core-and-shell particle may lose its liquid coat to the surface of substrate. The rate of transport from the particle to the surface is slow for thin coats [27]. However, thickly coated particles may potentially experience a significant coating loss within hours or even minutes, depending on the viscosity of the liquid layer [27], which depend on the degree of particle aging. To reduce photo-induced changes, particle samples are commonly kept refrigerated in the dark [21], but chemical changes are still possible through dark oxidation by molecular oxygen and neutralization of particle-phase acids by ubiquitous ammonia. Additionally, temperature and humidity swings during storage and transport present yet another possible cause of sample modification. For instance, for a sample sealed at 25 °C and 50% relative humidity (RH), a 10 °C drop in temperature would increase the RH to 93%, resulting in the deliquescence of most inorganic particle constituents and associated morphological changes in the particles. Indeed, freezing and thawing cycles of collected particles have been shown to cause severe particle agglomeration due to water uptake [24]. Finally, even for perfect samples, the human factor may contribute to a bias during image analysis through particle discrimination based on size and shape, as discussed previously [28,29,30].
The goal of this study was to investigate the role of particle-substrate interactions and changing environmental conditions on the outcome of morphological analysis for several types of submicron aerosols. We examined aerosol particles composed of sodium chloride, sulfuric acid, untreated soot, and sulfuric acid-coated soot. Sodium chloride is a crystalline material with deliquescence and efflorescence RH of 75 and 45%, respectively. Sulfuric acid is a low volatile, highly hygroscopic liquid whose water content depends on the ambient RH. Coated soot particles are aggregates of hydrophobic graphitic spheres with a thin layer of hygroscopic sulfuric acid. The particles were collected on several types of substrates (lacey grids, untreated silicon, hydrophobic silicon, and silicon nitride), exposed to varying temperature/humidity conditions, and analyzed to elucidate factors leading to significant morphological changes.

2. Experiments

2.1. Particle Generation, Processing, and Mass-Mobility Analysis

Soot aerosol was produced by the combustion of natural gas in an inverted diffusion burner [31]. A global flame equivalence ratio of 0.5 was used to form fractal particles with a negligible fraction of organic carbon [19,32]. Sodium chloride and sulfuric acid aerosols were produced by nebulization of the corresponding aqueous solutions in a constant output atomizer (Aerosol Generator 3076, TSI Inc., Shoreview, MN, USA). In all cases, the generated aerosol was diluted with particle-free, purified air, and then passed through a diffusion drier filled with silica gel, a Nafion drier (PD-07018T-24MSS, Perma Pure LLC., Lakewood, NJ, USA), and a bipolar diffusion charger (Po-210, 400 μCi, NRD Staticmaster, New York, NY, USA). An integrated system (Figure S1 in Supplementary Materials) consisting of two differential mobility analyzers (DMA 3081, TSI Inc., Shoreview, MN, USA), an aerosol particle mass analyzer (APM 3601, Kanomax Inc., Andover, NJ, USA), and a condensation particle counter (CPC 3772, TSI Inc., Shoreview, MN, USA) was used to size-classify and characterize aerosols [33]. A more detailed description of the aerosol system can be found in [19].
Sodium chloride and sulfuric acid particles were directly collected on substrates after size-classification. In the case of soot particles, processing could be applied before particle collection; this involved the coating of particles with sulfuric acid and/or exposure to elevated relative humidity. For coating, the soot aerosol was passed through a pick-up chamber half-filled with sulfuric acid (80 wt %) that was maintained at a controlled temperature (52 ± 2 °C). Following the coating application, the aerosol was either directly collected in the precipitator or passed through a drier/humidifier (PD-07018T-24MSS, Perma Pure LLC., Lakewood, NJ, USA), and then collected. The amount of sulfuric acid on soot particles and the associated change in the particle mobility diameter induced by coating and humidification were monitored through Tandem DMA and DMA-APM measurements, and reported as growth factors by diameter (Gfd) and mass (Gfm), respectively. The Gfd and Gfm were calculated from the ratios of the processed particle mobility diameter and particle mass (Dp, mp) over the initial diameter and mass (Do, mo), respectively. In all cases, following size-classification, soot aerosol was passed through a thermal denuder maintained at 300 °C to remove residual organics.

2.2. Substrates, Collection Procedures, and Sample Processing

Particles were collected in a custom-made electrostatic precipitator [19] similar to the one described earlier [18]. Lacey grids (01883, Ted Pella, Inc., Redding, CA, USA), silicon wafer chips (16008, Ted Pella, Inc., Redding, CA, USA), and silicon nitride window chips (301.3892, Hummingbird Scientific, Lacey, WA, USA) were used as collection substrates. Lacey grids have a Formvar/Carbon layer with web-like structure on a 300 mesh copper grid. Upon collection, some particles attached themselves to the fibers where the particle-fiber contact area was relatively small, while other particles landed on flat areas. Lacey grids were used as is, without any treatment. Silicon chips were sonicated in methanol to remove possible contamination, and dried with high purity nitrogen before use. Cleaned untreated silicon chips were hydrophilic. To obtain hydrophobic silicon chips, cleaned chips were immersed in a dichlorodimethylsilane solution (5% DCDMS in toluene, Sigma-Aldrich, St. Louis, MO, USA), rinsed sequentially with toluene and methanol, and dried with high-purity nitrogen. To verify the effect of the DCDMS treatment, a 3-μL water droplet was placed on the surface of both DCDMS -treated and untreated silicon chips. Images of the droplets (Figure 1) taken by a digital camera (eheV1-USBplus, Oasis Scientific, Taylors, SC, USA) indicated that the average contact angle increased from 45° to 92° after the DCDMS treatment (Table 1), confirming that the wettability of the silicon surface was reduced significantly (for reference, the wetting angle for water on Teflon was 104°). The wetting angle was determined from digital images using image-processing software (Adobe Photoshop, Adobe Systems Inc., Mountain View, CA, USA). Silicon nitride chips in ETEM experiments were used as received. These chips have a narrow-slit window covered with a 50 nm thick silicon nitride membrane. A regular chip and a spacer chip were sandwiched together to create a controlled environment for ETEM imaging of particle samples.
Particle samples collected on lacey grids and silicon chips were processed off-line and then imaged by SEM. The conditions corresponding to each of the three types of processing environments are described in Table 2. During Type I processing, substrates with collected particles were exposed to a 92–96% RH inside a small stainless steel cylindrical chamber for 20 min. Such exposure might correspond to a moderate change in environmental conditions during sample transport or contact with the operator’s breath. The relative humidity inside the chamber was maintained using a humidified flow obtained by passing particle-free, purified air through a single 30 cm long Nafion tube (TT-050, 0.042″ ID, 0.053″ OD, Perma Pure LLC., Lakewood, NJ, USA) immersed in warm distilled water. The relative humidity was measured by a RH sensor (SRH77A, Cooper Atkins, Middlefield, CT, USA). Type II processing involved exposing the samples to a 55% RH in an open holder box (PELCO® X-TREME, Ted Pella, Inc., Redding, CA, USA) placed inside a plastic bag. Next, the box was hermetically sealed and transferred to a freezer maintained at −20 °C. After 12 h of storage, the box was removed from the freezer, brought to room temperature, and then opened to expose the samples to ambient air (RH 16–55%, as noted in each case). Type III processing was similar to Type II, but after removal from the freezer, the box was opened immediately, allowing ambient water vapor to condense on particle samples. Condensation and surface flooding could be observed visually, with the amount of condensed water strongly dependent on the ambient humidity (RH 16–20% for Type IIIa and RH 50% for Type IIIb). The samples collected on silicon nitride chips were humidified in situ during ETEM imaging, using a 0.5 mL/min flow of helium that passed through the single-tube Nafion humidifier described above.

2.3. Electron Microscopy and Image Processing

Most of the particle samples were imaged with a LEO 1530VP Field Emission Scanning Electron Microscope (FE-SEM), using a 5 kV accelerating voltage. A limited number of samples were studied by FEI Titan 80–300 ETEM located in the Center for Functional Nanomaterials at Brookhaven National Lab, using a 300 kV accelerating voltage. No metal or carbon film coating was applied to the particle samples before imaging. The SEM and ETEM images were manually pre-processed using Adobe Photoshop to adjust contrast and/or gray level in order to separate particles from the substrate background. For soot aggregates on silicon and silicon nitride, adjusting the levels was sufficient, but for soot aggregates on lacey grid samples, a manually drawn outline was required because the aggregates and lacey fibers had a comparable level of gray and/or contrast. For sulfuric acid and sodium chloride particles on all substrates, adjustment of gray level was sufficient to separate the particles from the image background.
Processed images were used to measure particle dimensions and morphology. In the case of soot, the aggregate convexity (Figure S2) was determined [21,34]. Convexity is the ratio of the aggregate projected area Aa over the area of the convex hull polygon Apolygon, as defined by Equation (1):
Convexity   = A a A p o l y g o n
where Aa and Apolygon were determined from the images using MATLAB-based code written in-house (Text S2). The convexity characterizes the compactness of soot aggregates, varying between 0 and 1, with the larger value corresponding to more compact aggregates.

3. Results and Discussion

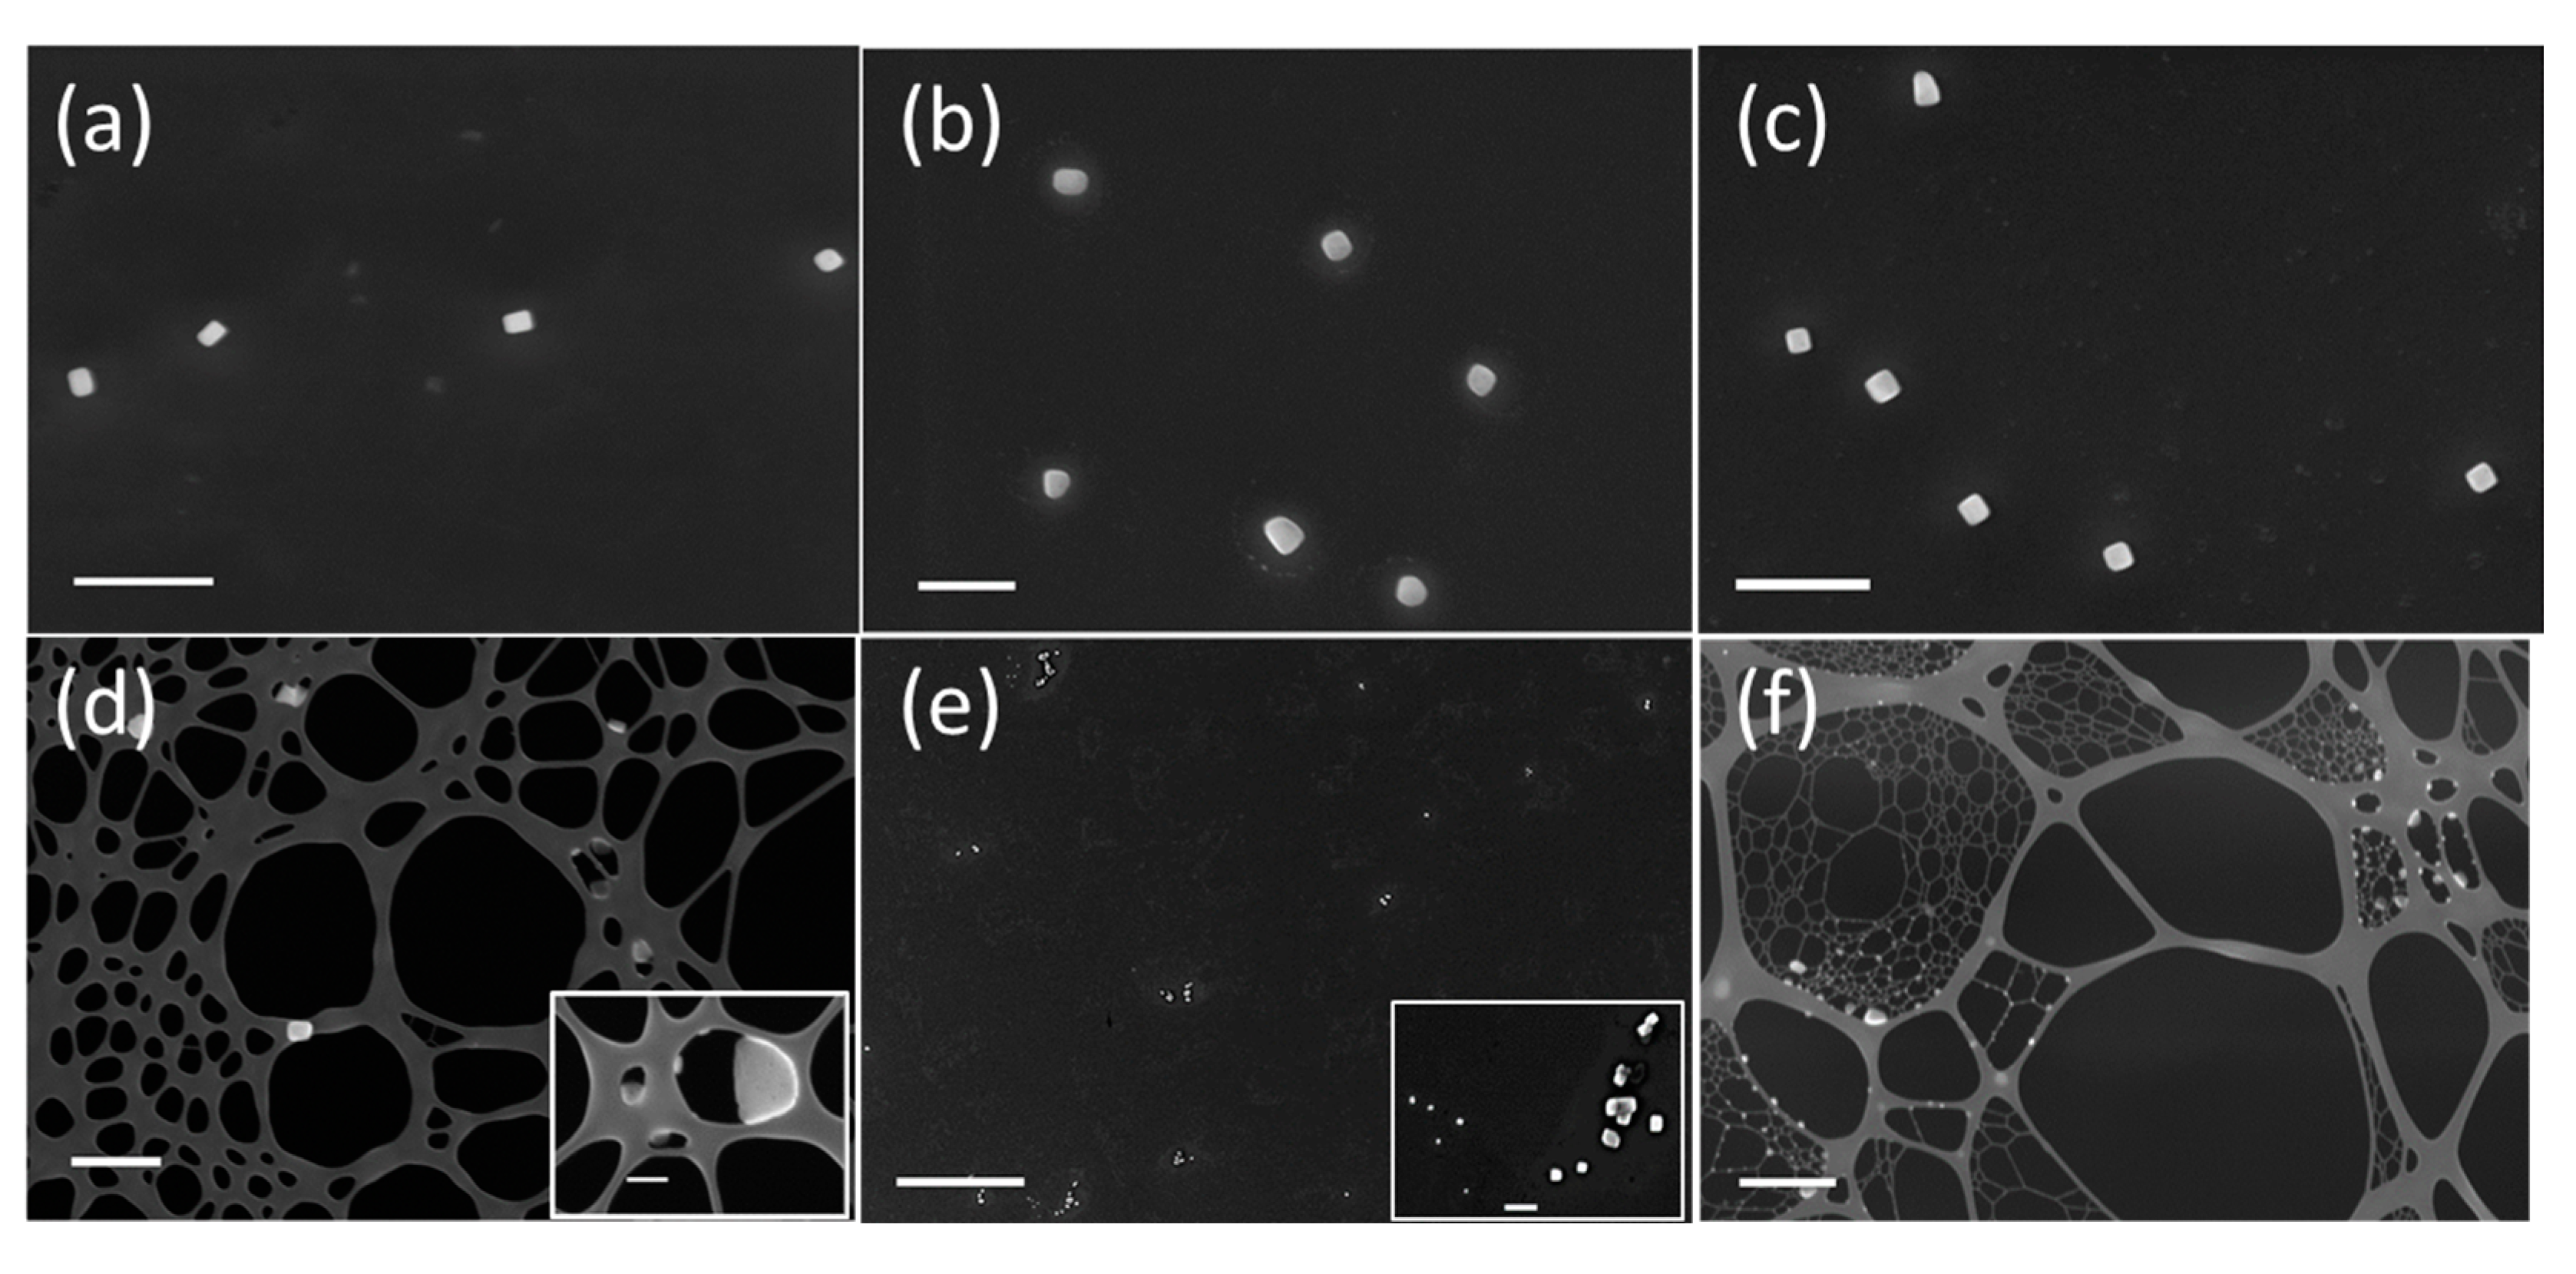
3.1. Sodium Chloride
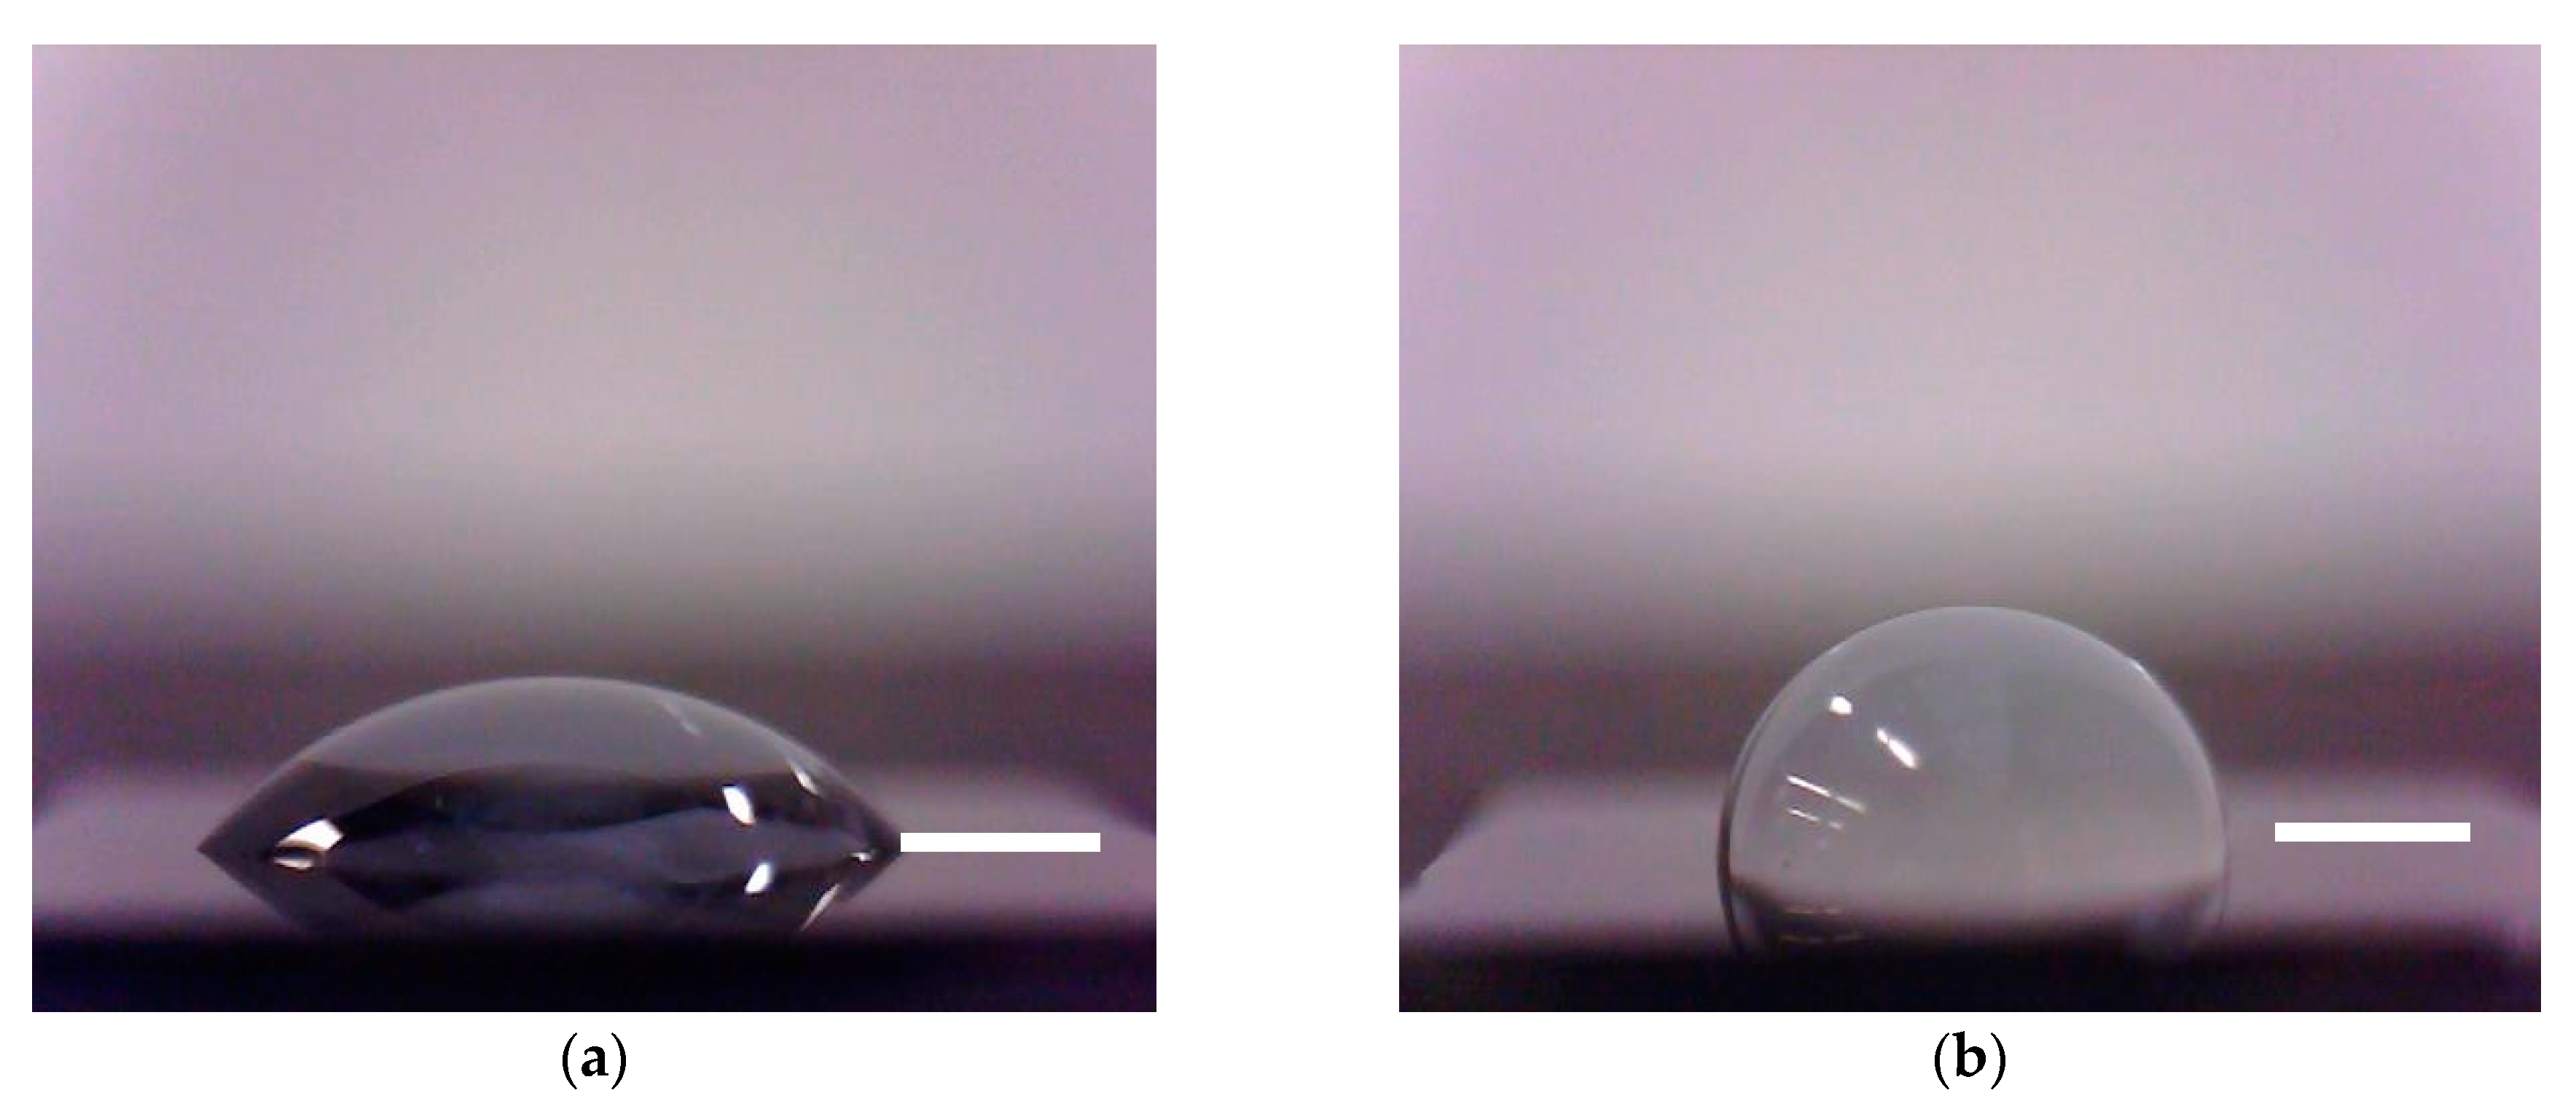
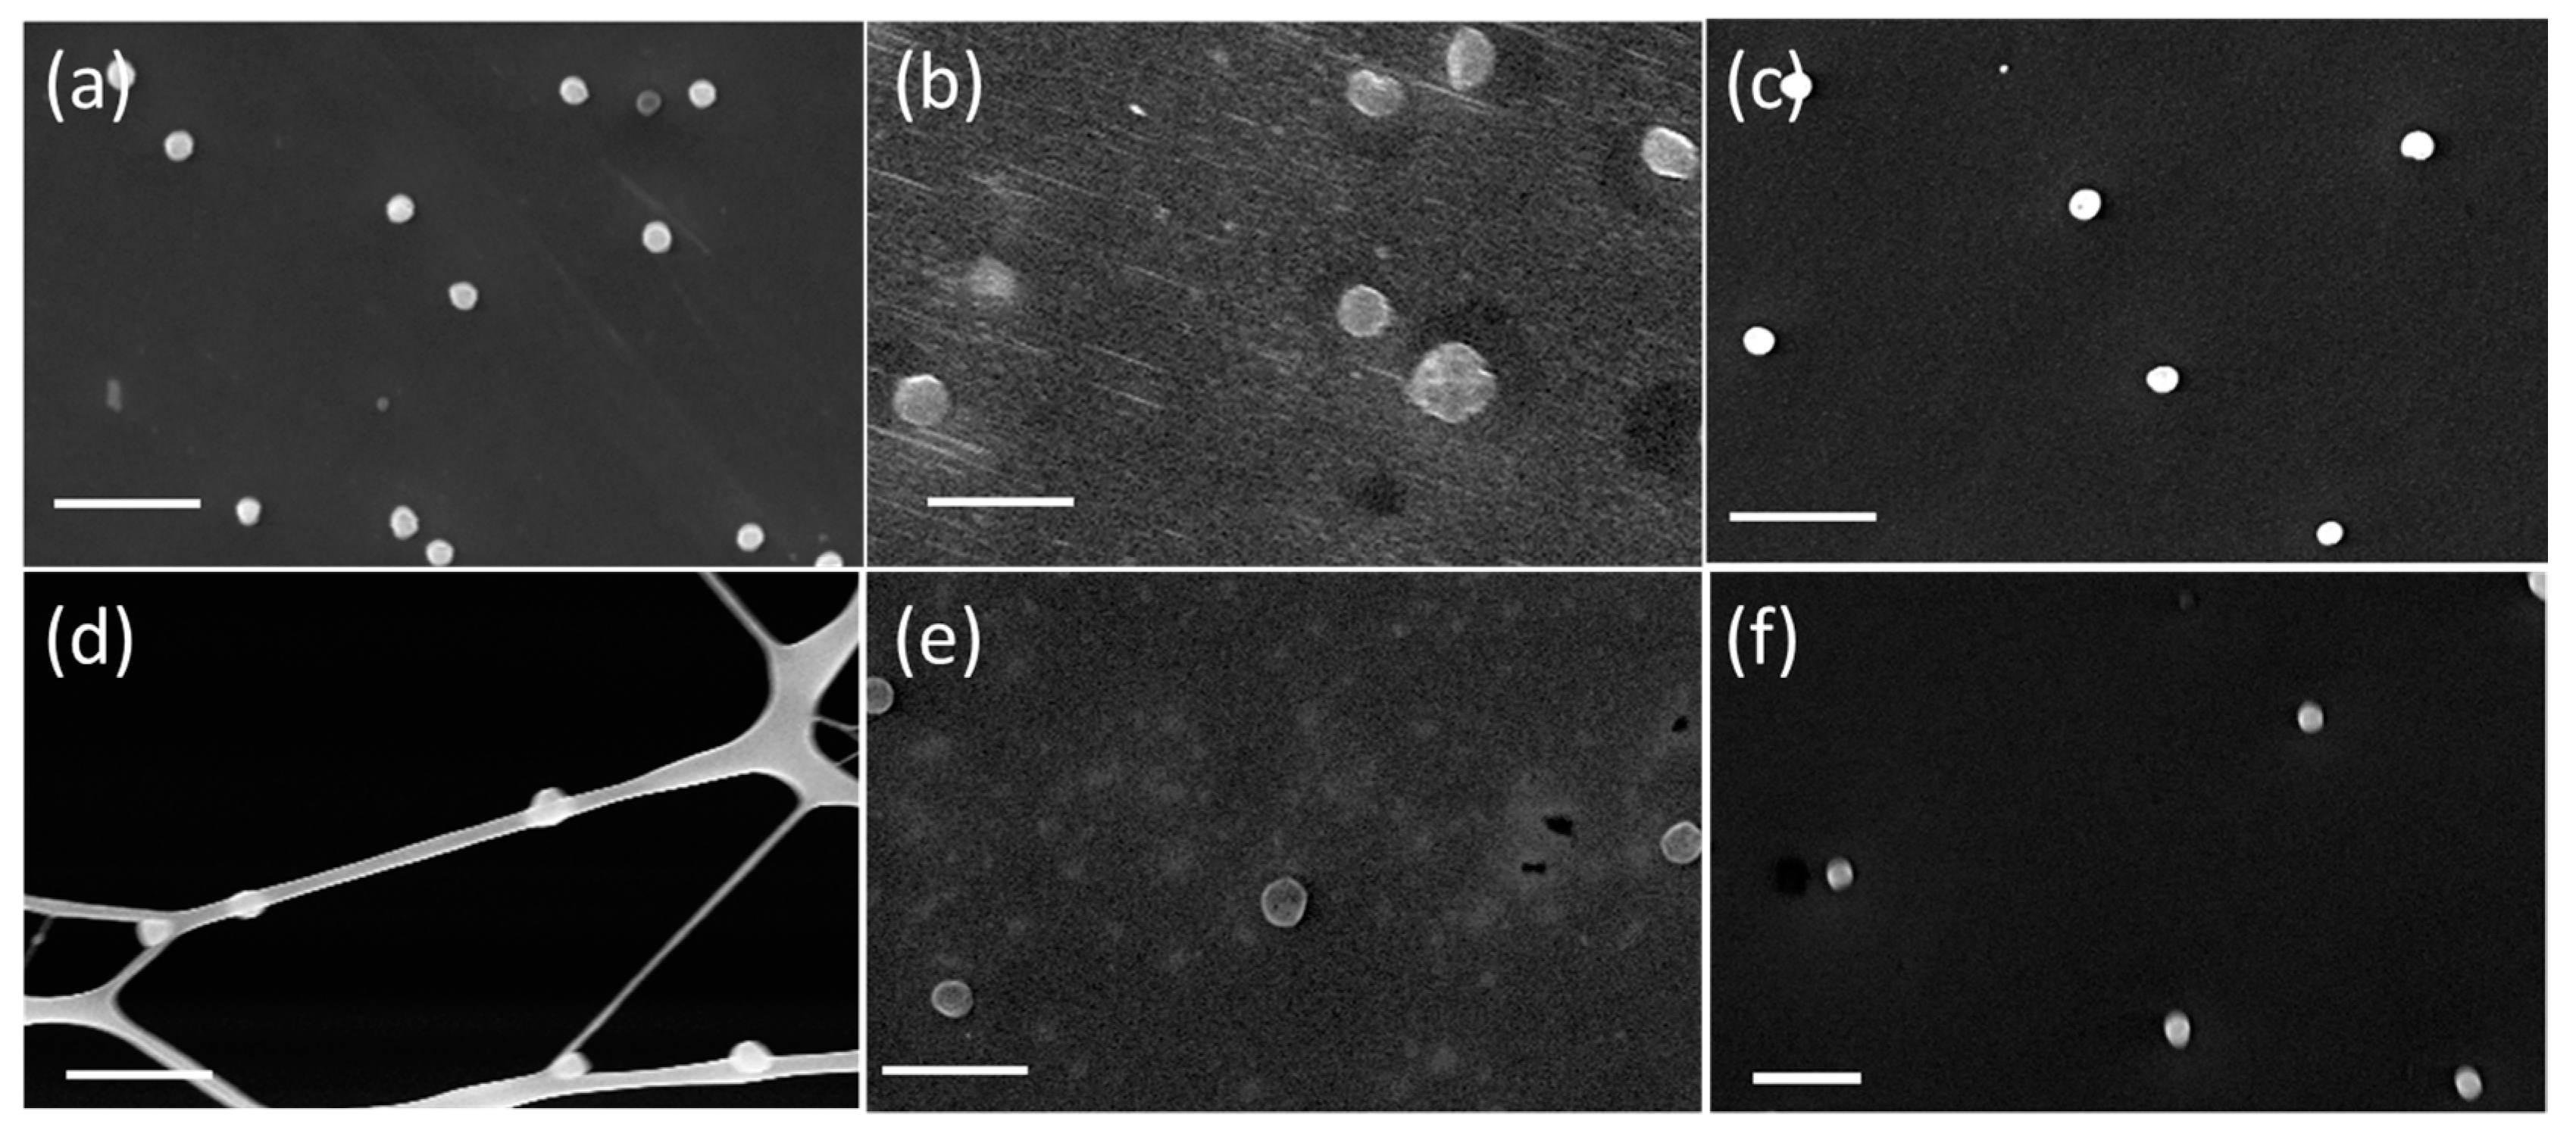
Figure 2 shows sodium chloride particles with an initial mobility diameter of 200 nm that were collected on several different substrates and treated following procedures described in Table 2. As expected, the untreated particles appeared as cubes with well-defined edges (Figure 2a) because the highest RH experienced by these particles during sample manipulation never exceeded 50%, which is well below the 75% deliquescence RH of sodium chloride. For treated particles, the appearance depended on several factors, including the procedure, the maximum level of RH, and the type of substrate. The particles were stable under the electron beam at magnifications below ×100 k. At magnifications exceeding ×700 k, the resistive heating from the electric current delivered by the electron beam caused particle melting and then re-crystallization into a set of smaller particles.
For sodium chloride particles subjected to Type I treatment (94% RH), morphological changes varied from negligible to major, depending on the substrate. Particles supported by untreated silicon chips lost their sharp edges, becoming roundish; some particles even acquired non-cubic shapes (Figure 2b). Also, light circular spots developed around some of the particles. Presumably, these spots were composed of a thin deposit of sodium chloride, which led to surface charging around the particles due to the poor electrical conductivity of crystalline sodium chloride. From this behavior, we inferred that the sodium chloride crystals were converted to aqueous droplets at high humidity, and the droplets partially spread over the surface. After water evaporation, most droplets re-crystallized to form individual particles, but the shape of those particles was significantly affected by the interactions between the aqueous droplets and the hydrophilic substrate. On the other hand, most particles that were collected on hydrophobic silicon restored their original cubic structure (Figure 2c) because of poor surface wetting. Overall, particles subjected to Type I treatment on hydrophobic silicon chips appeared nearly indistinguishable from the original dry sodium chloride particles (Figure 2a).
The response of sodium chloride collected on lacey grids depended strongly on the particle location within the grid. Particles adhering to the fibers, far away from lacey holes, maintained their cubic morphology or became somewhat roundish after Type I treatment (Figure 2d). However, particles located near small lacey holes changed their morphology entirely. It appears that after deliquescence, the aqueous solution was drawn into the holes, and when the water evaporated, sodium chloride re-crystallized within the holes, forming solid plugs (Figure 2d inset).
Subjecting samples of sodium chloride to Type II treatment (Cold storage) caused only negligible changes in the particle morphology. The Type II treatment was designed to reproduce a typical sampling routine, whereby a particle sample is sealed at a 55% indoor RH, transferred to the freezer, and upon removal from the freezer is allowed to equilibrate thermally before exposure to ambient air. The lack of discernible changes in the particle morphology on different substrates indicates that the particles were never exposed to an RH above the deliquescence point of sodium chloride. We believe this was caused by the freeze-drying effect due to the container walls being cooled faster than the particle sample, which was mounted in the middle of the container on a thermally non-conductive support. Water vapor diffused from the warmer sample region to the colder wall region, where it condensed, keeping the RH near the sample relatively low. If particle samples were mounted directly on the container wall, the impact would have been significant, as shown in [24], where the sample cooling and thawing at the same rate as cooling and thawing of the container walls resulted in water condensation, deliquescence, and coalescence of the particles.
Under the Type III treatment (Flooding), the sample box was opened immediately after removal from the freezer, allowing no temperature equilibration. Evidently, ambient RH was a key factor in determining the extent of sample change in this case. When exposed to a 50% RH (Type IIIb), the surface of the cold substrates was heavily flooded by the water condensate and no particles could be observed afterwards on either untreated silicon or hydrophobic silicon. Apparently, the particles were dissolved and washed away completely by the thick water layer. When ambient RH was lower than 20% (Type IIIa), some particles could be observed on the substrates, but their appearance was different from that of the original particles. As shown in Figure 2e, these new particles were of non-uniform sizes and clustered in groups. In this case, the level of water saturation was sufficient to activate sodium chloride particles into supermicron-sized droplets, but insufficient to flood the surface. The droplets grew in size and coalesced to form continuous areas while the sample was still cold. When the sample temperature increased and water evaporated, the dissolved sodium chloride re-crystallized randomly on the surface defects, forming particles of a broad range of sizes (Figure 2e inset), with some particles as large as several micrometers. A similar behavior was seen in [24] where freezing or thawing particles without humidity regulation caused morphology changes, while controlling the humidity decreased the severity of change observed in particle size and shape.
When Type III treatment was applied to lacey grids, particles were recovered in all cases and no difference in the particle appearance was noted between the experiments conducted at a 16 or 45% RH. The particles were not washed off because the extent of surface flooding was prevented by the Kelvin effect, due to the small radius of curvature of the fibers. Figure 2f shows that Type IIIb treatment of lacey grids triggered a sequence of droplet activation, coalescence, and re-crystallization, producing random groups of sodium chloride particles of a broad size range. As seen previously with Type I treatment, some of the sodium chloride particles re-crystallized within the lacey holes.

3.2. Sulfuric Acid

Experiments with sulfuric acid aerosol were conducted using DMA1 set to 200 nm. Sulfuric acid droplets collected on hydrophilic and hydrophobic silicon chips appeared as nearly perfect spheres with similar average diameters of 229 ± 21 nm (Figure 3a) and 237 ± 15 nm, respectively. A small number of droplets with multiple charges and larger sizes were also observed, but those were excluded from the average diameter calculation. For samples prepared on a lacey grid, a significant difference was observed between the droplets on the fibers and the flat area, 204 ± 21 nm and 292 ± 20 nm, respectively. The agreement between the SEM and DMA diameters for droplets on fibers indicates that they remained nearly spherical after deposition. In other cases, some flattening occurred from the droplet-surface interaction. The behavior of submicron droplets of concentrated sulfuric acid was drastically different from that of millimeter-scale droplets, which wet the silicon chip surface almost perfectly and spread to form a thin film, due to a stronger gravitational force (Table 1).
The 200 nm droplets of sulfuric acid were stable under the electron beam at lower magnifications, but evaporated within seconds at magnifications exceeding ×200 k. Exposure of the droplets deposited on hydrophilic silicon to Type I treatment (Humidified) resulted in roundish particles of non-uniform shape and a significantly larger final diameter, 387 ± 36 nm (Figure 3b). The increase in the average diameter relative to the unprocessed sample was caused by droplet flattening after undergoing the humidification/drying cycle. First, at high RH the droplet footprint may have doubled from water absorption, because the hygroscopic growth factor of sulfuric acid droplets between 5 and 94% RH is about 2. The coalescence of adjacent droplets may have caused an additional increase in size. Next, when water was lost through evaporation upon drying, the droplets did not retreat to their original sizes, but flattened instead because of the adhesion to the substrate surface. The presence of darker spots around the droplets, probably the residue of sulfuric acid after the droplet retreat, confirms this hypothesis. The uneven shape of processed droplets could be caused by the submicron-scale surface roughness. Also, it is possible that sulfuric acid in the droplets was partially or completely neutralized by ammonia, which is ubiquitous in ambient air. We estimated that in the presence of mere 10 parts per billion, a common indoors ammonia level [35,36], it takes only few minutes to neutralize sulfuric acid inside the 200 nm droplets. The resulting salts, ammonium bisulfate (efflorescence RH 10%) and ammonium sulfate (efflorescence RH 39%), would crystallize upon drying under the SEM vacuum to form non-spherical particles. It has been reported that neutralization of sulfuric acid particles by ammonia makes them more stable under the electron beam [17].
For droplets on hydrophobic silicon chips and lacey grid fibers, the diameter increased to 259 ± 26 nm and 265 ± 23 nm, respectively after Type I treatment (Figure 3c,d). Less significant changes in the droplet appearance and size on hydrophobic silicon may have resulted from a larger wetting angle of dilute sulfuric acid (Table 1), leading to less droplet spreading at high RH. In the case of fibers, the lesser impact may be due to a lower contact area with the droplets.
On all substrates, Type II treatment (Cold storage) produced less significant changes to sulfuric acid droplets than Type I treatment (Figure 3e,f). For example, the droplet diameter increased to 321 ± 48 nm and 248 ± 8 nm on hydrophilic and hydrophobic silicon, respectively. However, after Type III treatment (Flooding), no droplets could be observed on either hydrophilic or hydrophobic silicon substrates at any ambient RH. It appears that flooding re-distributed sulfuric acid over the entire surface of the silicon substrate, and the acid remained on the surface in the form of a thin layer, even after the evaporation of water. However, for lacey grids samples, groups of non-uniform spheres could be still observed after flooding and drying, because of the limited dispersion of sulfuric acid along the fibers.

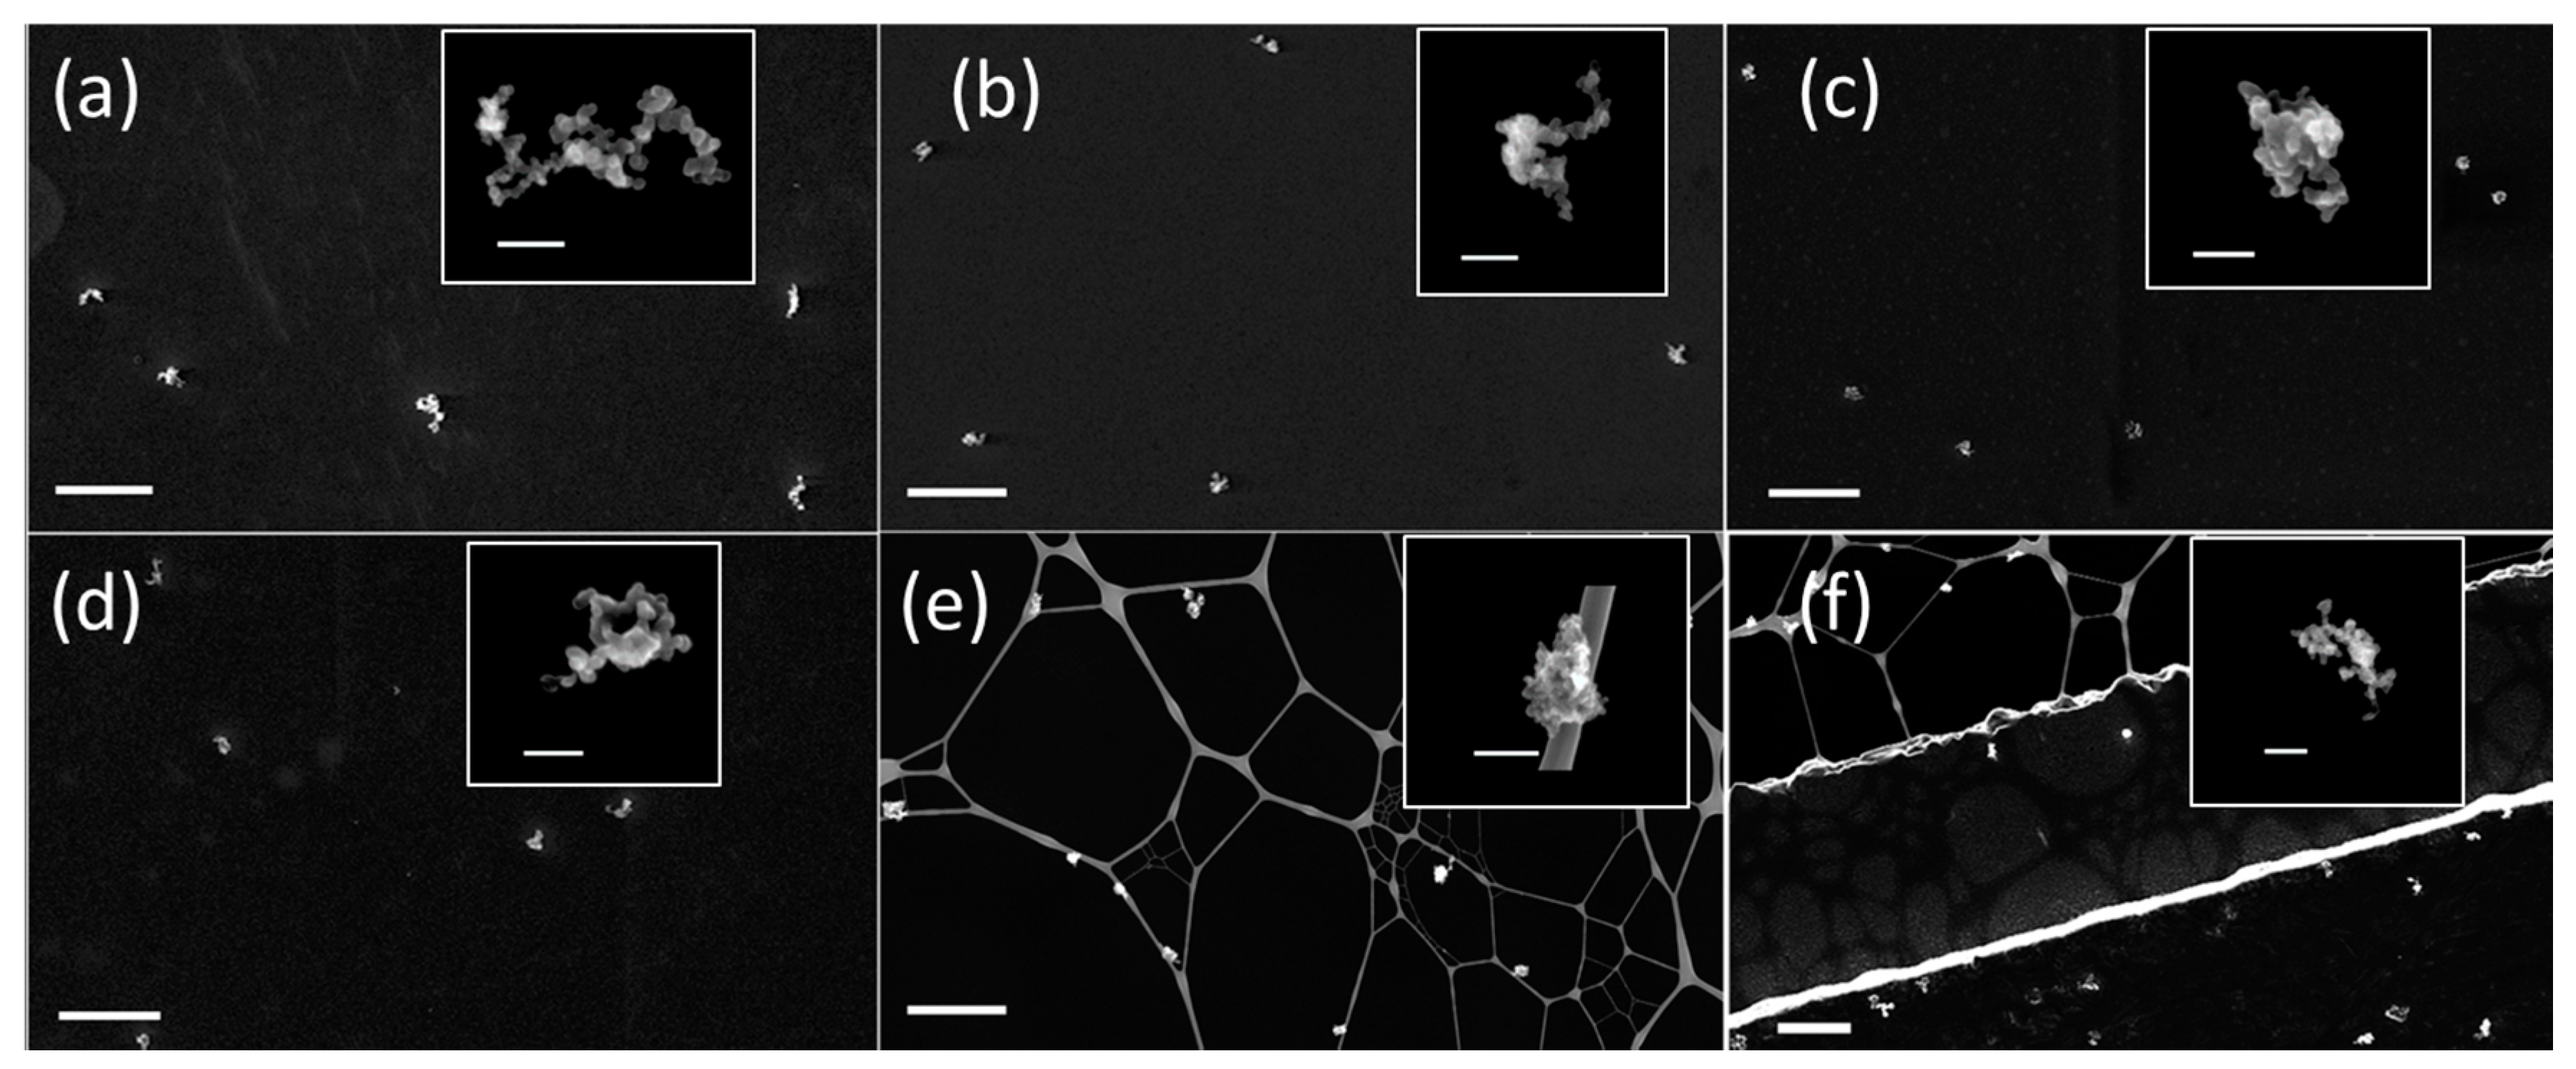
3.3. Soot Aggregates

Soot particles with an initial mobility diameter of 350 nm deposited on various substrates are shown in Figure 4. Uncoated soot particles collected on both types of silicon chips appeared as fractal aggregates of graphitic spherical monomers (Figure 4a). The monomer diameter was 28 ± 7 nm, showing no clear dependence on the overall aggregate size. A small fraction of larger aggregates with multiple charges was present, but no smaller fragments were evident, indicating that no fracturing occurred upon deposition of the aggregates on the collection substrate. For unprocessed soot of 350 nm mobility diameter, chosen in our study for most experiments, the aggregate convexity was 0.56 ± 0.05.
In the atmosphere, fractal soot aggregates age rapidly upon exposure to condensable vapors of sulfuric acid and oxidized organics [37,38,39,40,41,42]. Sufficiently aged soot may undergo significant structural changes, making the aggregates less fractal [16]. The restructuring is promoted in the presence of hygroscopic materials, which absorb water and increase in volume at elevated RH [33]. It is possible that airborne and surface-bound aggregates respond differently to humidification. For instance, the interaction with the surface may anchor the aggregate, limiting the extent of structural changes. To address this knowledge gap, we investigated morphologies of soot aggregates coated by sulfuric acid and exposed to elevated RH, both in an airborne state and after deposition onto different substrates.
Structural changes in the airborne soot were investigated using the Tandem Differential Mobility Analyzer (TDMA) system, similarly as described earlier [33]. Size-classified soot aerosol (350 nm) emerging from DMA1 was coated by sulfuric acid, humidified, thermally denuded, and then scanned by DMA2 to determine the growth factor, Gfd. Since the coating was removed from the particles before they entered DMA2, the reported Gfd reflects the structural change in the soot backbone induced by the coating material and water, but excludes the contribution from the coating material itself. In all the experiments, the mass fraction of sulfuric acid coating was maintained at 0.26, corresponding to a Gfm of 1.35, as measured by the APM. Figure 5 shows the evolution in Gfd with the increase in RH. The first point with a Gfd of 0.92 corresponds to soot aerosol coated by sulfuric acid and stabilized at 5% RH to minimize coating evaporation. Only a small decrease in Gfd occurred when RH was increased from 5 to 50%, in agreement with previous observations [33]. The most significant decrease in Gfd occurred at RH above 50%, reaching a value of 0.74 at 88% RH. The latter Gfd corresponded to the most compact morphology attainable by the 350 nm soot aggregates generated in our burner [19].
To investigate the role of substrate, two sets of experiments were performed, using soot aggregates deposited on hydrophilic silicon chips, hydrophobic silicon chips, and lacey grids. In the first set of experiments, airborne soot aggregates were coated by sulfuric acid, humidified, and only then collected on the substrates. Figure 4b shows an image of the coated soot deposited on a hydrophilic silicon chip at 5% RH. While the presence of sulfuric acid on the aggregates was not apparent, their morphology was clearly more compact than that of unprocessed soot. As shown in Figure 6 (5% RH), convexity was 0.64 ± 0.08, 0.65 ± 0.08, and 0.67 ± 0.07 for coated aggregates on hydrophilic silicon, hydrophobic silicon, and lacey grid fibers, respectively. A somewhat higher convexity observed on hydrophobic silicon chips and grid fibers may reflect a lower interaction of the aggregates with those supports, resulting in a partial restructuring when the samples were exposed to 40–45% ambient RH during transfer to the SEM chamber. Convexity was significantly higher (0.74 ± 0.11) when the coated airborne soot aggregates were humidified to 88% RH before deposition (Figure 4c). An even higher convexity (0.81 ± 0.05) was observed when these coated and humidified aggregates were denuded before deposition, suggesting that the evaporation of water and sulfuric acid off airborne particles could promote their further compaction, as suggested earlier [43,44].
In the second set of experiments, the coated soot aggregates were first deposited on three different substrates and only then humidified, using the protocols described in Table 2. Figure 4d–f shows examples of particles subjected to Type I treatment (94% RH) on hydrophilic silicon and lacey grids (fibers and flat areas separately). The images of particles on hydrophobic silicon are not included because they were essentially the same as on hydrophilic silicon. There was a marked difference in the extent of restructuring experienced by the aggregates located on flat substrates and on fibers (Figure 6). The largest convexity (0.78 ± 0.05) was observed for the aggregates deposited on fibers, close to the convexity of coated aggregates that were exposed to comparable humidity in the airborne state. The convexities of particles located on the flat area of lacey grids, hydrophilic silicon, and hydrophobic silicon were notably lower and of comparable magnitudes, 0.62 ± 0.08, 0.68 ± 0.07, 0.69 ± 0.09, respectively.
As with sodium chloride, Type II treatment (Cold storage) of the coated soot particles made no discernible change in their morphology on any tested substrate. In the case of Type IIIa treatment (Moderately flooded), significant restructuring occurred to soot aggregates attached to the fibers of the lacey grid (0.79 ± 0.04), but the samples prepared on both types of silicon remained practically unchanged (0.62 ± 0.06), as shown in Figure 6.
Experiments with coated soot clearly show that particle-substrate interactions hinder aggregate restructuring. The hindering effect depends on the contact area, being the lowest for aggregates attached to thin fibers and the largest for aggregates sitting on flat surfaces. Two factors may be responsible for this effect, the reduced mobility of the aggregate branches anchored to the surface and the escape of liquid coating material (sulfuric acid) from the coated aggregate to the substrate, due to capillary action. To obtain some insight on the origin of the hindering effect, we investigated the restructuring of coated soot aggregates in situ, using ETEM.

3.4. In Situ Processing of Soot Aggregates

Figure 7a shows an ETEM image of the coated soot aggregate (0.26 mass fraction of sulfuric acid) under a flow of dry helium. The aggregate structure remained unchanged over several minutes of continuous exposure to the electron beam. Next, the electron beam was diverted, and dry helium was replaced with humidified helium. The first image of the humidified sample was taken when the RH at the exit from the sample cell reached 83 ± 2%. Figure 7b shows that several distinct changes occurred in the appearance of the aggregate, and also on the surface of silicon nitride. First, under dry conditions, no coating material could be observed, whereas upon humidification the aggregate, not only did the surface become visibly embedded in an aqueous coating, but it also developed a dark outline on the substrate surface. Second, some branches of the aggregate experienced a minor re-arrangement. Third, a large spot originating at the aggregate and reaching across the entire frame became visible on the substrate. Over the next 55 seconds, the spot contracted in size (Figure 7c–e) and then remained nearly stable for over four minutes (Figure 7f). The outline around the aggregate became lighter and the aggregate appeared as if it lost some of the aqueous coating.
The evolution in the appearance of the aggregate and substrate can be interpreted by considering the joint effect of humidification and exposure to the electron beam. At high humidity and in the absence of imaging, the sulfuric acid coating absorbed water, forming a larger shell around the aggregate. Some of the aqueous sulfuric acid, driven by capillary action, migrated to the silicon nitride surface, forming an outline in close vicinity of the aggregate, and also spreading to a larger surface area. As shown in Table 1, both concentrated and aqueous sulfuric acid could wet the surface of silicon nitride. This behavior closely resembled the behavior of the sodium chloride and sulfuric acid particles upon humidification. The migration of aqueous sulfuric acid to the substrate surface stripped the aggregate of its coating shell, causing it to retain its backbone morphology nearly unchanged even after humidification. When the electron beam was focused on the aggregate, the heat produced by the beam raised the local temperature, reducing RH and leading to water evaporation. We also noted that after switching back to dry helium flow, it was impossible to reset the aggregates precisely to their original state (not shown). The appearance of processed soot pointed to a minor damage in the graphitic monomers, probably due to oxidation by OH radicals generated from water radiolysis.

4. Conclusions

We investigated morphological changes in three types of particles subjected to several types of environments, which may be commonly experienced by particle samples during handling, transport, and imaging. The particles were composed of sodium chloride, a material with a sharp deliquescence transition at a defined RH; sulfuric acid, which adjusts its water content continuously with variation in RH; and soot aggregates coated by sulfuric acid, in which the hygroscopic coating was expected to absorb water and induce structural changes in the soot backbone at elevated RH. The samples were prepared by electrostatic deposition of particles on wafer chips and lacey grids. Overall, four types of particle-substrate combinations were investigated, including two for silicon (original hydrophilic and processed hydrophobic) and two for lacey grids (fibers and flat areas). The environmental conditions included those to which samples are often subjected during normal handling, such as refrigeration or freezing in tightly sealed containers, and also extreme cases, such as the exposure of a cold sample to ambient air.
Based on our findings summarized in Table 3, several major points can be drawn. The most damaging impact was caused by the Type IIIb treatment, when frozen samples were exposed to ambient air with RH in excess of 50%. The substrate became heavily flooded with liquid water, which washed off the particles. However, at an ambient RH below 20% (Type IIIa), differentiation in the extent of sample alteration was observed, depending on the particle composition and the substrate. Whereas sulfuric acid particle samples were all defaced, sodium chloride and coated soot survived with minor structural alterations on selected substrates. Type III treatment is equivalent to a major mishap during sample handling, but even then, certain particle-substrate combinations appear to survive nearly unchanged.
The Type II treatment is equivalent to routine sample handling, when substrates are placed in sealed cases, cooled to low temperature, and then brought up to ambient temperature while still sealed [21]. Comparable temperature swings may arise during refrigerated/frozen storage, or during transportation. In all the cases, with the exception of sulfuric acid on hydrophilic silicon chips, this treatment introduced minor or negligible changes to the particles.
The Type I treatment involved the exposure of samples to a high RH (94%), but below the water saturation level. Such conditions may be experienced by the samples during collection (e.g., during rain, in early morning or late evening) or handling (an inadvertent exposure to the operator’s breath or transfer to a room with a significantly different temperature/humidity). The impact of this treatment varied broadly, depending on the nature of particles and substrate. Coated soot on any type of silicon chips and sodium chloride on hydrophobic silicon were not affected. On the other hand, coated soot on lacey fibers and sulfuric acid on hydrophilic silicon experienced significant changes.
The extent of the particle modification depends on an interplay between several factors, including the actual level of RH experienced by the particles, the physical and chemical properties of the particle material, and the interaction between the particle and substrate (both surface energy and contact area). For any given particle-substrate combination, additional factors such as the rate of sample cooling and relative diffusivity of water vapor versus gas also play a role. Samples must therefore be handled with the utmost care to prevent conditions when morphology changes are induced by increased humidity (from operator’s breath) or humidity swings (flooding). Humidity control is important for ensuring collected particles maintain most of their morphology from source to analysis [24].
Deciding on the best type of substrate for use in aerosol sampling is not only dependent on the factors described previously, but also on the objective of the investigation. In some studies, the environment is changed intentionally in a controlled way to examine the response of the particles. Our results had direct implications for cases where morphological changes in the deposited particles are desired, such as upon exposure to an elevated RH, using ETEM, ESEM, or Atomic Force Microscopy (AFM) [45,46,47,48,49]. Clearly, interaction with substrate may severely hinder or alter the extent of change in the particle morphology. Hence, one must strive to reduce the interaction by minimizing the substrate surface energy and the surface area in direct contact with the particle. Finally, it must be noted that appropriate handling of the sample may still not prevent additional measurement bias introduced via exposure to vacuum, electron beam, or AFM sample tip.

Supplementary Materials

The following are available online at www.mdpi.com/2073-4433/8/9/162/s1, Figure S1: An integrated system for aerosol generation, processing and analysis, Figure S2: Calculation of convexity.

Acknowledgments

This work was supported by the National Science Foundation (AGS 1463702) and the Center for Functional Nanomaterials at Brookhaven National Laboratory (34050). C.C. acknowledges scholarship from the China Scholarship Council. The authors thank Abraham Kupperman from the Bergen County Technical High School for help with wetting angle measurements.

Author Contributions

C.C., A.F.K., and Y.M. conceived and designed the experiments; C.C., O.Y.E., A.F.K., and D.Z. performed the experiments; C.C., A.F.K., and O.Y.E. analyzed the data; C.C., A.F.K., and O.Y.E. wrote the paper.

Conflicts of Interest

The authors declare no conflict of interest. The founding sponsors had no role in the design of the study; in the collection, analyses, or interpretation of data; in the writing of the manuscript, and in the decision to publish the results.

References

  1. Lohmann, U.; Feichter, J. Global indirect aerosol effects: A review. Atmos. Chem. Phys. 2005, 5, 715–737. [Google Scholar] [CrossRef]
  2. Pöschl, U. Atmospheric aerosols: Composition, transformation, climate and health effects. Cheminform 2005, 44, 7520. [Google Scholar] [CrossRef] [PubMed]
  3. Haywood, J.; Boucher, O. Estimates of the direct and indirect radiative forcing due to tropospheric aerosols: A review. Rev. Geophys. 2000, 38, 513–543. [Google Scholar] [CrossRef]
  4. Tao, W.K.; Chen, J.P.; Li, Z.; Wang, C.; Zhang, C. Impact of aerosols on convective clouds and precipitation. Rev. Geophys. 2012, 50, RG2001. [Google Scholar] [CrossRef]
  5. Jayne, J.T.; Leard, D.C.; Zhang, X.F.; Davidovits, P.; Smith, K.A.; Kolb, C.E.; Worsnop, D.R. Development of an aerosol mass spectrometer for size and composition analysis of submicron particles. Aerosol Sci. Technol. 2000, 33, 49–70. [Google Scholar] [CrossRef]
  6. DeCarlo, P.F.; Kimmel, J.R.; Trimborn, A.; Northway, M.J.; Jayne, J.T.; Aiken, A.C.; Gonin, M.; Fuhrer, K.; Horvath, T.; Docherty, K.S.; et al. Field-deployable, high-resolution, time-of-flight aerosol mass spectrometer. Anal. Chem. 2006, 78, 8281–8289. [Google Scholar] [CrossRef] [PubMed]
  7. China, S.; Kulkarni, G.; Scarnato, B.; Sharma, N.; Pekour, M.; Shilling, J.; Wilson, J.; Zelenyuk, A.; Chand, D.; Liu, S.; et al. Morphology of diesel soot residuals from supercooled water droplets and ice crystals: Implications for optical properties. Environ. Res. Lett. 2015, 10, 114010. [Google Scholar] [CrossRef]
  8. Beranek, J.; Imre, D.; Zelenyuk, A. Real-time shape-based particle separation and detailed in situ particle shape characterization. Anal. Chem. 2012, 84, 1459–1465. [Google Scholar] [CrossRef] [PubMed]
  9. McMurry, P.H.; Wang, X.; Park, K.; Ehara, K. The relationship between mass and mobility for atmospheric particles: A new technique for measuring particle density. Aerosol Sci. Technol. 2002, 36, 227–238. [Google Scholar] [CrossRef]
  10. Levy, M.E.; Zhang, R.; Khalizov, A.F.; Zheng, J.; Collins, D.R.; Glen, C.R.; Wang, Y.; Yu, X.Y.; Luke, W.; Jayne, J.T.; et al. Measurements of submicron aerosols in houston, texas during the 2009 sharp field campaign. J. Geophys. Res. Atmos. 2013, 118, 10518–10534. [Google Scholar] [CrossRef]
  11. Posfai, M.; Buseck, P.R. Nature and climate effects of individual tropospheric aerosol particles. In Annual Review of Earth and Planetary Sciences; Jeanloz, R., Freeman, K.H., Eds.; Annual Reviews: Palo Alto, CA, USA, 2010; Volume 38, pp. 17–43. [Google Scholar]
  12. Lee, R.E. The size of suspended particulate matter in air. Science 1972, 178, 567–575. [Google Scholar] [CrossRef] [PubMed]
  13. Rao, A.K.; Whitby, K.T. Non-ideal collection characteristics of inertial impactors—II. Cascade impactors. J. Aerosol Sci. 1978, 9, 87–100. [Google Scholar] [CrossRef]
  14. Cheng, Y.S.; Yeh, H.C. Particle bounce in cascade impactors. Environ. Sci. Technol. 1979, 13, 1392–1396. [Google Scholar] [CrossRef]
  15. Rothenbacher, S.; Messerer, A.; Kasper, G. Fragmentation and bond strength of airborne diesel soot agglomerates. Part. Fibre Toxicol. 2008, 5, 9. [Google Scholar] [CrossRef] [PubMed]
  16. Zhang, R.; Khalizov, A.F.; Pagels, J.; Zhang, D.; Xue, H.; McMurry, P.H. Variability in morphology, hygroscopicity, and optical properties of soot aerosols during atmospheric processing. Proc. Natl. Acad. Sci. USA 2008, 105, 10291–10296. [Google Scholar] [CrossRef] [PubMed]
  17. Huang, P.-F.; Turpin, B. Reduction of sampling and analytical errors for electron microscopic analysis of atmospheric aerosols. Atmos. Environ. 1996, 30, 4137–4148. [Google Scholar] [CrossRef]
  18. Dixkens, J.; Fissan, H. Development of an electrostatic precipitator for off-line particle analysis. Aerosol Sci. Technol. 1999, 30, 438–453. [Google Scholar] [CrossRef]
  19. Chen, C.; Fan, X.; Shaltout, T.; Qiu, C.; Ma, Y.; Goldman, A.; Khalizov, A.F. An unexpected restructuring of combustion soot aggregates by subnanometer coatings of polycyclic aromatic hydrocarbons. Geophys. Res. Lett. 2016, 43, 11080–11088. [Google Scholar] [CrossRef]
  20. Soewono, A.; Rogak, S. Morphology and raman spectra of engine-emitted particulates. Aerosol Sci. Technol. 2011, 45, 1206–1216. [Google Scholar] [CrossRef]
  21. China, S.; Salvadori, N.; Mazzoleni, C. Effect of traffic and driving characteristics on morphology of atmospheric soot particles at freeway on-ramps. Environ. Sci. Technol. 2014, 48, 3128–3135. [Google Scholar] [CrossRef] [PubMed]
  22. Chakrabarty, R.K.; Moosmüller, H.; Garro, M.A.; Arnott, W.P.; Walker, J.; Susott, R.A.; Babbitt, R.E.; Wold, C.E.; Lincoln, E.N.; Hao, W.M. Emissions from the laboratory combustion of wildland fuels: Particle morphology and size. J. Geophys. Res. Atmos. 2006, 111, D07204. [Google Scholar] [CrossRef]
  23. Bambha, R.P.; Dansson, M.A.; Schrader, P.E.; Michelsen, H.A. Effects of volatile coatings and coating removal mechanisms on the morphology of graphitic soot. Carbon 2013, 61, 80–96. [Google Scholar] [CrossRef]
  24. Laskina, O.; Morris, H.S.; Grandquist, J.R.; Estillore, A.D.; Stone, E.A.; Grassian, V.H.; Tivanski, A.V. Substrate-deposited sea spray aerosol particles: Influence of analytical method, substrate, and storage conditions on particle size, phase, and morphology. Environ. Sci. Technol. 2015, 49, 13447–13453. [Google Scholar] [CrossRef] [PubMed]
  25. Eom, H.-J.; Gupta, D.; Li, X.; Jung, H.-J.; Kim, H.; Ro, C.-U. Influence of collecting substrates on the characterization of hygroscopic properties of inorganic aerosol particles. Anal. Chem. 2014, 86, 2648–2656. [Google Scholar] [CrossRef] [PubMed]
  26. Zhou, Q.; Pang, S.-F.; Wang, Y.; Ma, J.-B.; Zhang, Y.-H. Confocal raman studies of the evolution of the physical state of mixed phthalic acid/ammonium sulfate aerosol droplets and the effect of substrates. J. Phys. Chem. B 2014, 118, 6198–6205. [Google Scholar] [CrossRef] [PubMed]
  27. Gao, C.; Bhushan, B. Tribological performance of magnetic thin-film glass disks: Its relation to surface roughness and lubricant structure and its thickness. Wear 1995, 190, 60–75. [Google Scholar] [CrossRef]
  28. Ghazi, R.; Tjong, H.; Soewono, A.; Rogak, S.N.; Olfert, J.S. Mass, mobility, volatility, and morphology of soot particles generated by a mckenna and inverted burner. Aerosol Sci. Technol. 2013, 47, 395–405. [Google Scholar] [CrossRef]
  29. Pyrz, W.D.; Buttrey, D.J. Particle size determination using tem: A discussion of image acquisition and analysis for the novice microscopist. Langmuir 2008, 24, 11350–11360. [Google Scholar] [CrossRef] [PubMed]
  30. Rice, S.B.; Chan, C.; Brown, S.C.; Eschbach, P.; Han, L.; Ensor, D.S.; Stefaniak, A.B.; Bonevich, J.; Vladár, A.E.; Hight Walker, A.R.; et al. Particle size distributions by transmission electron microscopy: An interlaboratory comparison case study. Metrologia 2013, 50, 663–678. [Google Scholar] [CrossRef] [PubMed]
  31. Stipe, C.B.; Higgins, B.S.; Lucas, D.; Koshland, C.P.; Sawyer, R.F. Inverted co-flow diffusion flame for producing soot. Rev. Sci. Instrum. 2005, 76, 023908. [Google Scholar] [CrossRef]
  32. Ghazi, R.; Olfert, J. Coating mass dependence of soot aggregate restructuring due to coatings of oleic acid and dioctyl sebacate. Aerosol Sci. Technol. 2013, 47, 192–200. [Google Scholar] [CrossRef]
  33. Khalizov, A.F.; Zhang, R.; Zhang, D.; Xue, H.; Pagels, J.; McMurry, P.H. Formation of highly hygroscopic soot aerosols upon internal mixing with sulfuric acid vapor. J. Geophys. Res. Atmos. 2009, 114, D05208. [Google Scholar] [CrossRef]
  34. Chakrabarty, R.K.; Moosmüller, H.; Arnott, W.P.; Garro, M.A.; Walker, J. Structural and fractal properties of particles emitted from spark ignition engines. Environ. Sci. Technol. 2006, 40, 6647–6654. [Google Scholar] [CrossRef] [PubMed]
  35. Fischer, M.L.; Littlejohn, D.; Lunden, M.M.; Brown, N.J. Automated measurements of ammonia and nitric acid in indoor and outdoor air. Environ. Sci. Technol. 2003, 37, 2114–2119. [Google Scholar] [CrossRef] [PubMed]
  36. Tidy, G.; Neil Cape, J. Ammonia concentrations in houses and public buildings. Atmos. Environ. A Gen. Top. 1993, 27, 2235–2237. [Google Scholar] [CrossRef]
  37. Peng, J.; Hu, M.; Guo, S.; Du, Z.; Zheng, J.; Shang, D.; Levy Zamora, M.; Zeng, L.; Shao, M.; Wu, Y.-S.; et al. Markedly enhanced absorption and direct radiative forcing of black carbon under polluted urban environments. Proc. Natl. Acad. Sci. USA 2016, 113, 4266–4271. [Google Scholar] [CrossRef] [PubMed]
  38. Adachi, K.; Chung, S.H.; Buseck, P.R. Shapes of soot aerosol particles and implications for their effects on climate. J. Geophys. Res. 2010, 115, D15. [Google Scholar] [CrossRef]
  39. Cappa, C.D.; Onasch, T.B.; Massoli, P.; Worsnop, D.R.; Bates, T.S.; Cross, E.S.; Davidovits, P.; Hakala, J.; Hayden, K.L.; Jobson, B.T.; et al. Radiative absorption enhancements due to the mixing state of atmospheric black carbon. Science 2012, 337, 1078–1081. [Google Scholar] [CrossRef] [PubMed]
  40. Liu, D.; Whitehead, J.; Alfarra, M.R.; Reyes-Villegas, E.; Spracklen, D.V.; Reddington, C.L.; Kong, S.; Williams, P.I.; Ting, Y.-C.; Haslett, S.; et al. Black-carbon absorption enhancement in the atmosphere determined by particle mixing state. Nat. Geosci. 2017, 10, 184–188. [Google Scholar] [CrossRef]
  41. Liu, S.; Aiken, A.C.; Gorkowski, K.; Dubey, M.K.; Cappa, C.D.; Williams, L.R.; Herndon, S.C.; Massoli, P.; Fortner, E.C.; Chhabra, P.S.; et al. Enhanced light absorption by mixed source black and brown carbon particles in UK winter. Nat. Commun. 2015, 6, 8435. [Google Scholar] [CrossRef] [PubMed] [Green Version]
  42. China, S.; Scarnato, B.; Owen, R.C.; Zhang, B.; Ampadu, M.T.; Kumar, S.; Dzepina, K.; Dziobak, M.P.; Fialho, P.; Perlinger, J.A.; et al. Morphology and mixing state of aged soot particles at a remote marine free troposphere site: Implications for optical properties. Geophys. Res. Letts. 2015, 42, 1243–1250. [Google Scholar] [CrossRef]
  43. Mikhailov, E.F.; Vlasenko, S.S.; Kiselev, A.A.; Ryshkevich, T.I. Restructuring factors of soot particles. Izv. Atmos. Ocean Phys. 1998, 34, 307–317. [Google Scholar]
  44. Ma, X.; Zangmeister, C.D.; Gigault, J.; Mulholland, G.W.; Zachariah, M.R. Soot aggregate restructuring during water processing. J. Aerosol Sci. 2013, 66, 209–219. [Google Scholar] [CrossRef]
  45. Huang, P.F.; Turpin, B.J.; Pipho, M.J.; Kittelson, D.B.; McMurry, P.H. Effects of water condensation and evaporation on diesel chain-agglomerate morphology. J. Aerosol Sci. 1994, 25, 447–459. [Google Scholar] [CrossRef]
  46. Semeniuk, T.A.; Wise, M.E.; Martin, S.T.; Russell, L.M.; Buseck, P.R. Hygroscopic behavior of aerosol particles from biomass fires using environmental transmission electron microscopy. J. Atmos. Chem. 2007, 56, 259–273. [Google Scholar] [CrossRef]
  47. Hiranuma, N.; Brooks, S.D.; Auvermann, B.W.; Littleton, R. Using environmental scanning electron microscopy to determine the hygroscopic properties of agricultural aerosols. Atmos. Environ. 2008, 42, 1983–1994. [Google Scholar] [CrossRef]
  48. Köllensperger, G.; Friedbacher, G.; Kotzick, R.; Niessner, R.; Grasserbauer, M. In-situ atomic force microscopy investigation of aerosols exposed to different humidities. Anal. Bioanal. Chem. 1999, 364, 296–304. [Google Scholar] [CrossRef]
  49. Ebert, M.; Inerle-Hof, M.; Weinbruch, S. Environmental scanning electron microscopy as a new technique to determine the hygroscopic behaviour of individual aerosol particles. Atmos. Environ. 2002, 36, 5909–5916. [Google Scholar] [CrossRef]
Figure 1. A droplet of water on the surface of (a) untreated hydrophilic and (b) hydrophobically treated silicon chip. Scale bar for both images is 1 mm.
Atmosphere 08 00162 g001
Figure 2. Scanning electron microscopy (SEM) images of 200 nm initial mobility diameter sodium chloride particles deposited on different substrates: (a) untreated silicon chip, dry conditions; (b) untreated silicon chip, subjected to Type I treatment; (c) hydrophobic silicon chip, subjected to Type I treatment; (d) lacey support film, subjected to Type I treatment; (e) untreated silicon chip, subjected to Type IIIa treatment (16–20% ambient RH); and (f) lacey support film, subjected to Type IIIb treatment (45% ambient RH). Inset in (d) shows recrystallized NaCl within holes of the lacey grid. Inset in (e) shows polydisperse recrystallized particles on untreated silicon chip. Scale bar for images (ad,f), and inset (e) is 1 μm. Scale bar for inset (d) is 200 nm. Scale bar for image (e) is 20 μm.
Atmosphere 08 00162 g002
Figure 3. SEM images of 200 nm initial mobility diameter sulfuric acid particles on different substrates. The scale bar is 1 μm. The particles were (a) deposited onto a untreated hydrophilic silicon chip and kept dry, (b) deposited onto a hydrophilic silicon chip and subjected to Type I treatment, (c) deposited onto a hydrophobic silicon chip and subjected to Type I treatment, (d) deposited on lacey grid fibers and subjected to Type I treatment, (e) deposited onto an untreated silicon chip and subjected to Type II treatment, (f) deposited onto a hydrophobic silicon chip and subjected to Type II treatment.
Atmosphere 08 00162 g003
Figure 4. SEM images of uncoated, coated, and coated/humidified soot particles deposited on different substrates ((ad) correspond to untreated silicon chips and (e,f) to lacey TEM grids). Initial particle mobility diameter is 350 nm and the scale bar is 2 μm. Insets show magnified individual particles with a scale bar of 200 nm. The particles were (a) uncoated, (b) coated by H2SO4, (c) coated by H2SO4 and humidified to 88% prior to deposition, (d) coated by H2SO4, deposited onto a silicon chip, and subjected to Type I treatment, (e) coated by H2SO4, deposited onto a lacey grid (fibers area), and subjected to Type I treatment, (f) coated by H2SO4, deposited onto a lacey grid (flat area), and subjected to Type I treatment.
Atmosphere 08 00162 g004
Figure 5. The decrease in the diameter growth factor (Gfd) of H2SO4-coated soot aggregates with an increase in the relative humidity (RH). The initial mobility diameter of soot is 350 nm and the coating mass fraction is 0.26. Following humidification, the particles were thermally denuded to remove all of the coating material.
Atmosphere 08 00162 g005
Figure 6. Morphology of coated soot aggregates deposited on different substrates and then exposed to different environmental conditions. The initial mobility diameter was 350 nm and the coating mass fraction 0.26 ± 0.1. Convexities of uncoated soot and coated airborne soot exposed to 88% RH were 0.56 and 0.74, respectively.
Atmosphere 08 00162 g006
Figure 7. The evolution in the appearance of a soot aggregate coated by sulfuric acid and of the surface of silicon nitride substrate upon humidification and exposure to the electron beam in environmental transmission electron microscopy (ETEM): (a) dry initial conditions, (b) sample humidification begins, (cf) the sample evolves from the joint impact of humidity and exposure to the electron beam. The sample was not exposed to the electron beam between 0 and 36 min; the exposure was continuous after 36 min. The time stamp is minutes and seconds; the scale bar is 400 nm.
Atmosphere 08 00162 g007
Table 1. Wetting angle of liquids on different surfaces.
ChemicalWetting Angle, Degrees
SiliconSilicon NitrideGraphite
HydrophilicHydrophobic
Water4592 86
Sulfuric acid (20%) 6973
Sulfuric acid (50%) 61
Sulfuric acid (80%)20 192 16
Sulfuric acid (98%) 20 1
1 Because of effective surface wetting the angle cannot be measured precisely.
Table 2. Different types of environments used to process collected particles.
EnvironmentDescription
Type I (Humidified)Exposed to a 92–96% relative humidity (RH)
Type II (Cold storage)Exposed to a 55% RH at room temperature, sealed in a container, chilled in a freezer to −20 °C, removed from the freezer, brought to room temperature, and then exposed to ambient air (RH 16 to 50%)
Type IIIa (Moderately flooded)Exposed to a 55% RH at room temperature, sealed in a container, chilled in a freezer to −20 °C, removed from the freezer and exposed to ambient air while still cold; ambient air RH is 16–20%.
Type IIIb (Severely flooded)Exposed to a 55% RH at room temperature, sealed in a container, chilled in a freezer to −20 °C, removed from the freezer and exposed to ambient air while still cold; ambient air RH is 50%.
Table 3. Magnitude of structural change in aerosol particles on different substrates.
AerosolEnvironment 1Untreated SiliconHydrophobic SiliconLacey Grid
FiberFlat
Coated SootType I (Humidified)MinimalMinimalMajorMinimal
Type II (Cold storage)MinimalMinimalMinimalMinimal
Type IIIa (Moderately flooded)MinimalMinimalMajor-
Type IIIb (Severely flooded)MajorMajorMajor-
Sodium ChlorideType I (Humidified)ModerateMinimalModerate-
Type II (Frozen)MinimalMinimalMinimal-
Type IIIa (Moderately flooded)MajorMinimalModerate-
Type IIIb (Severely flooded)MajorMajorMajor-
Sulfuric AcidUntreatedMinimalMinimalMinimalModerate
Type I (Humidified)MajorModerateModerateMajor
Type II (Frozen)MajorMinimalMinimal-
Type IIIa (Moderately flooded)MajorMajorMajor-
Type IIIb (Severely flooded)MajorMajorMajor-
1 See Table 2 for the description of different types of environments.

