Figure 1.
Illustration of the TC environment (circles) stratified into the different regions analyzed in this study. (a) shows the northeast (NE), southeast (SE), southwest (SW), and northwest (NW) sections; (b) shows the north of center (NoC), east of center (EoC), south of center (SoC), and west of center (WoC) sections; (c) shows the north half (NH) and south half (SH) sections; and (d) shows the west half (WH) and east half (EH) sections. The numerical ranges in degrees that define the sections are provided. All sections are defined relative to north.
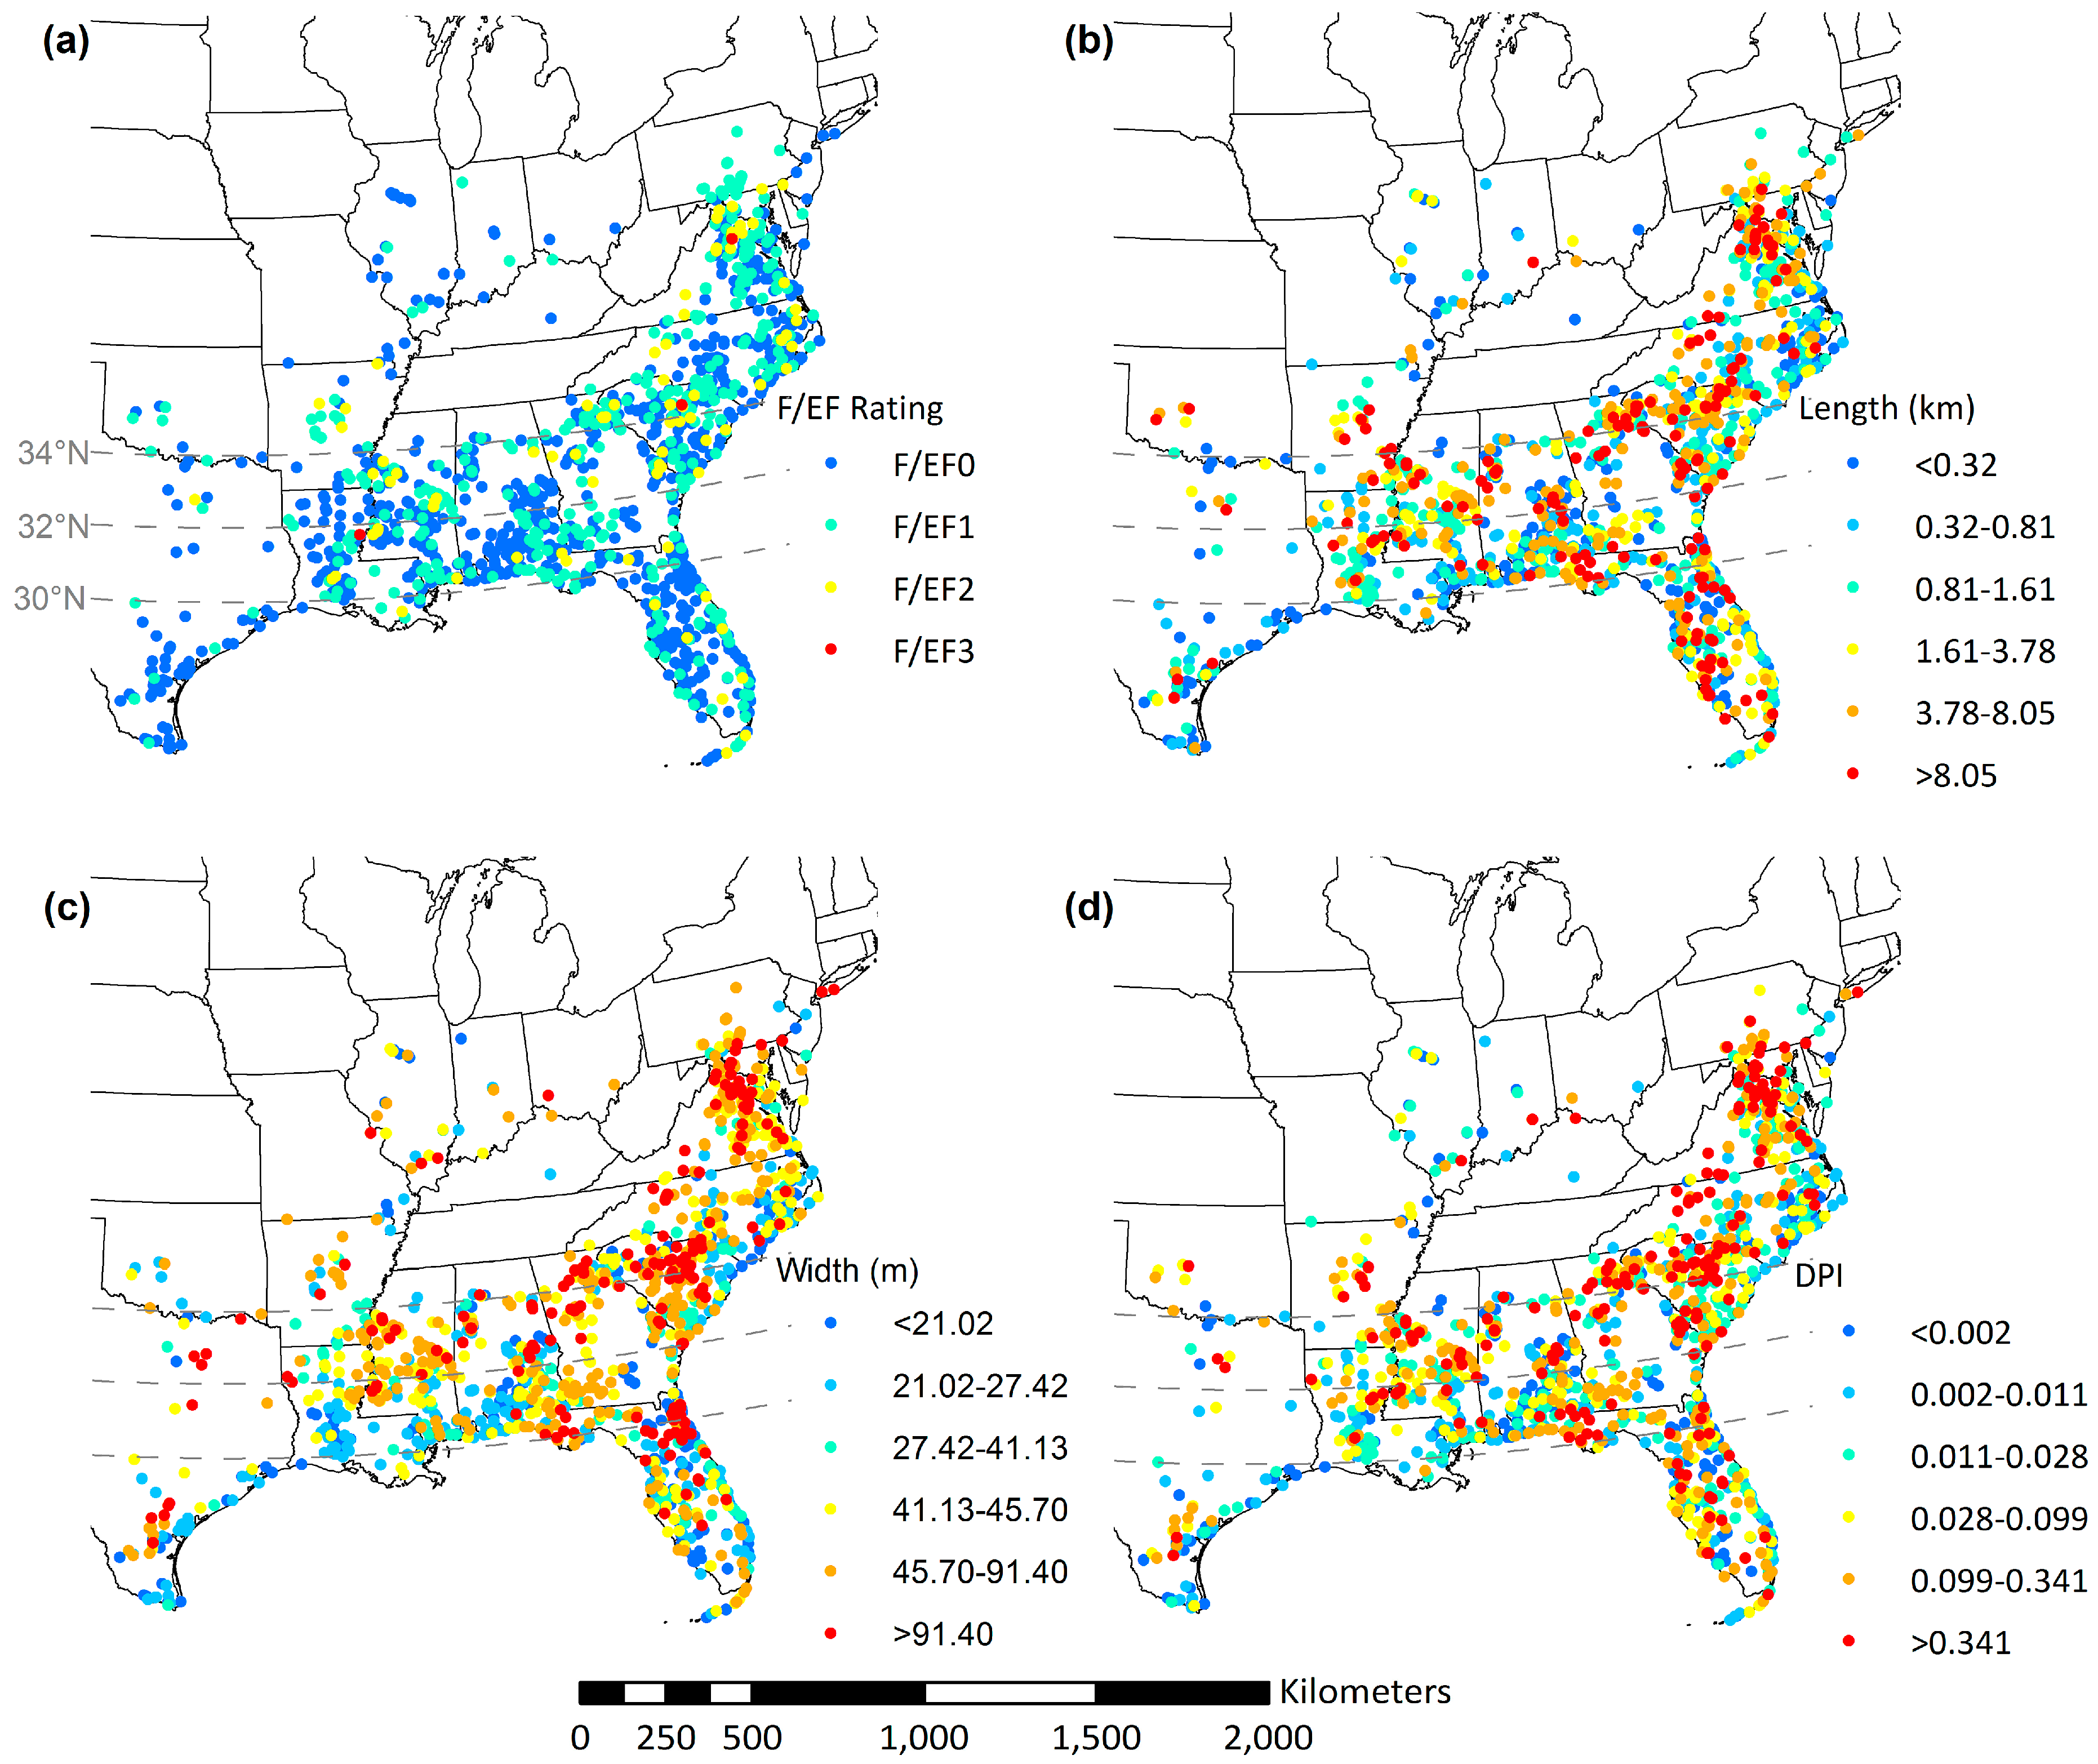
Figure 2.
Spatial distribution of 1285 TC tornadoes, stratified by F/EF scale (a), path length (b), path width (c), and DPI (d). The distributions of length, width, and DPI are divided into quintiles.
Figure 2.
Spatial distribution of 1285 TC tornadoes, stratified by F/EF scale (a), path length (b), path width (c), and DPI (d). The distributions of length, width, and DPI are divided into quintiles.
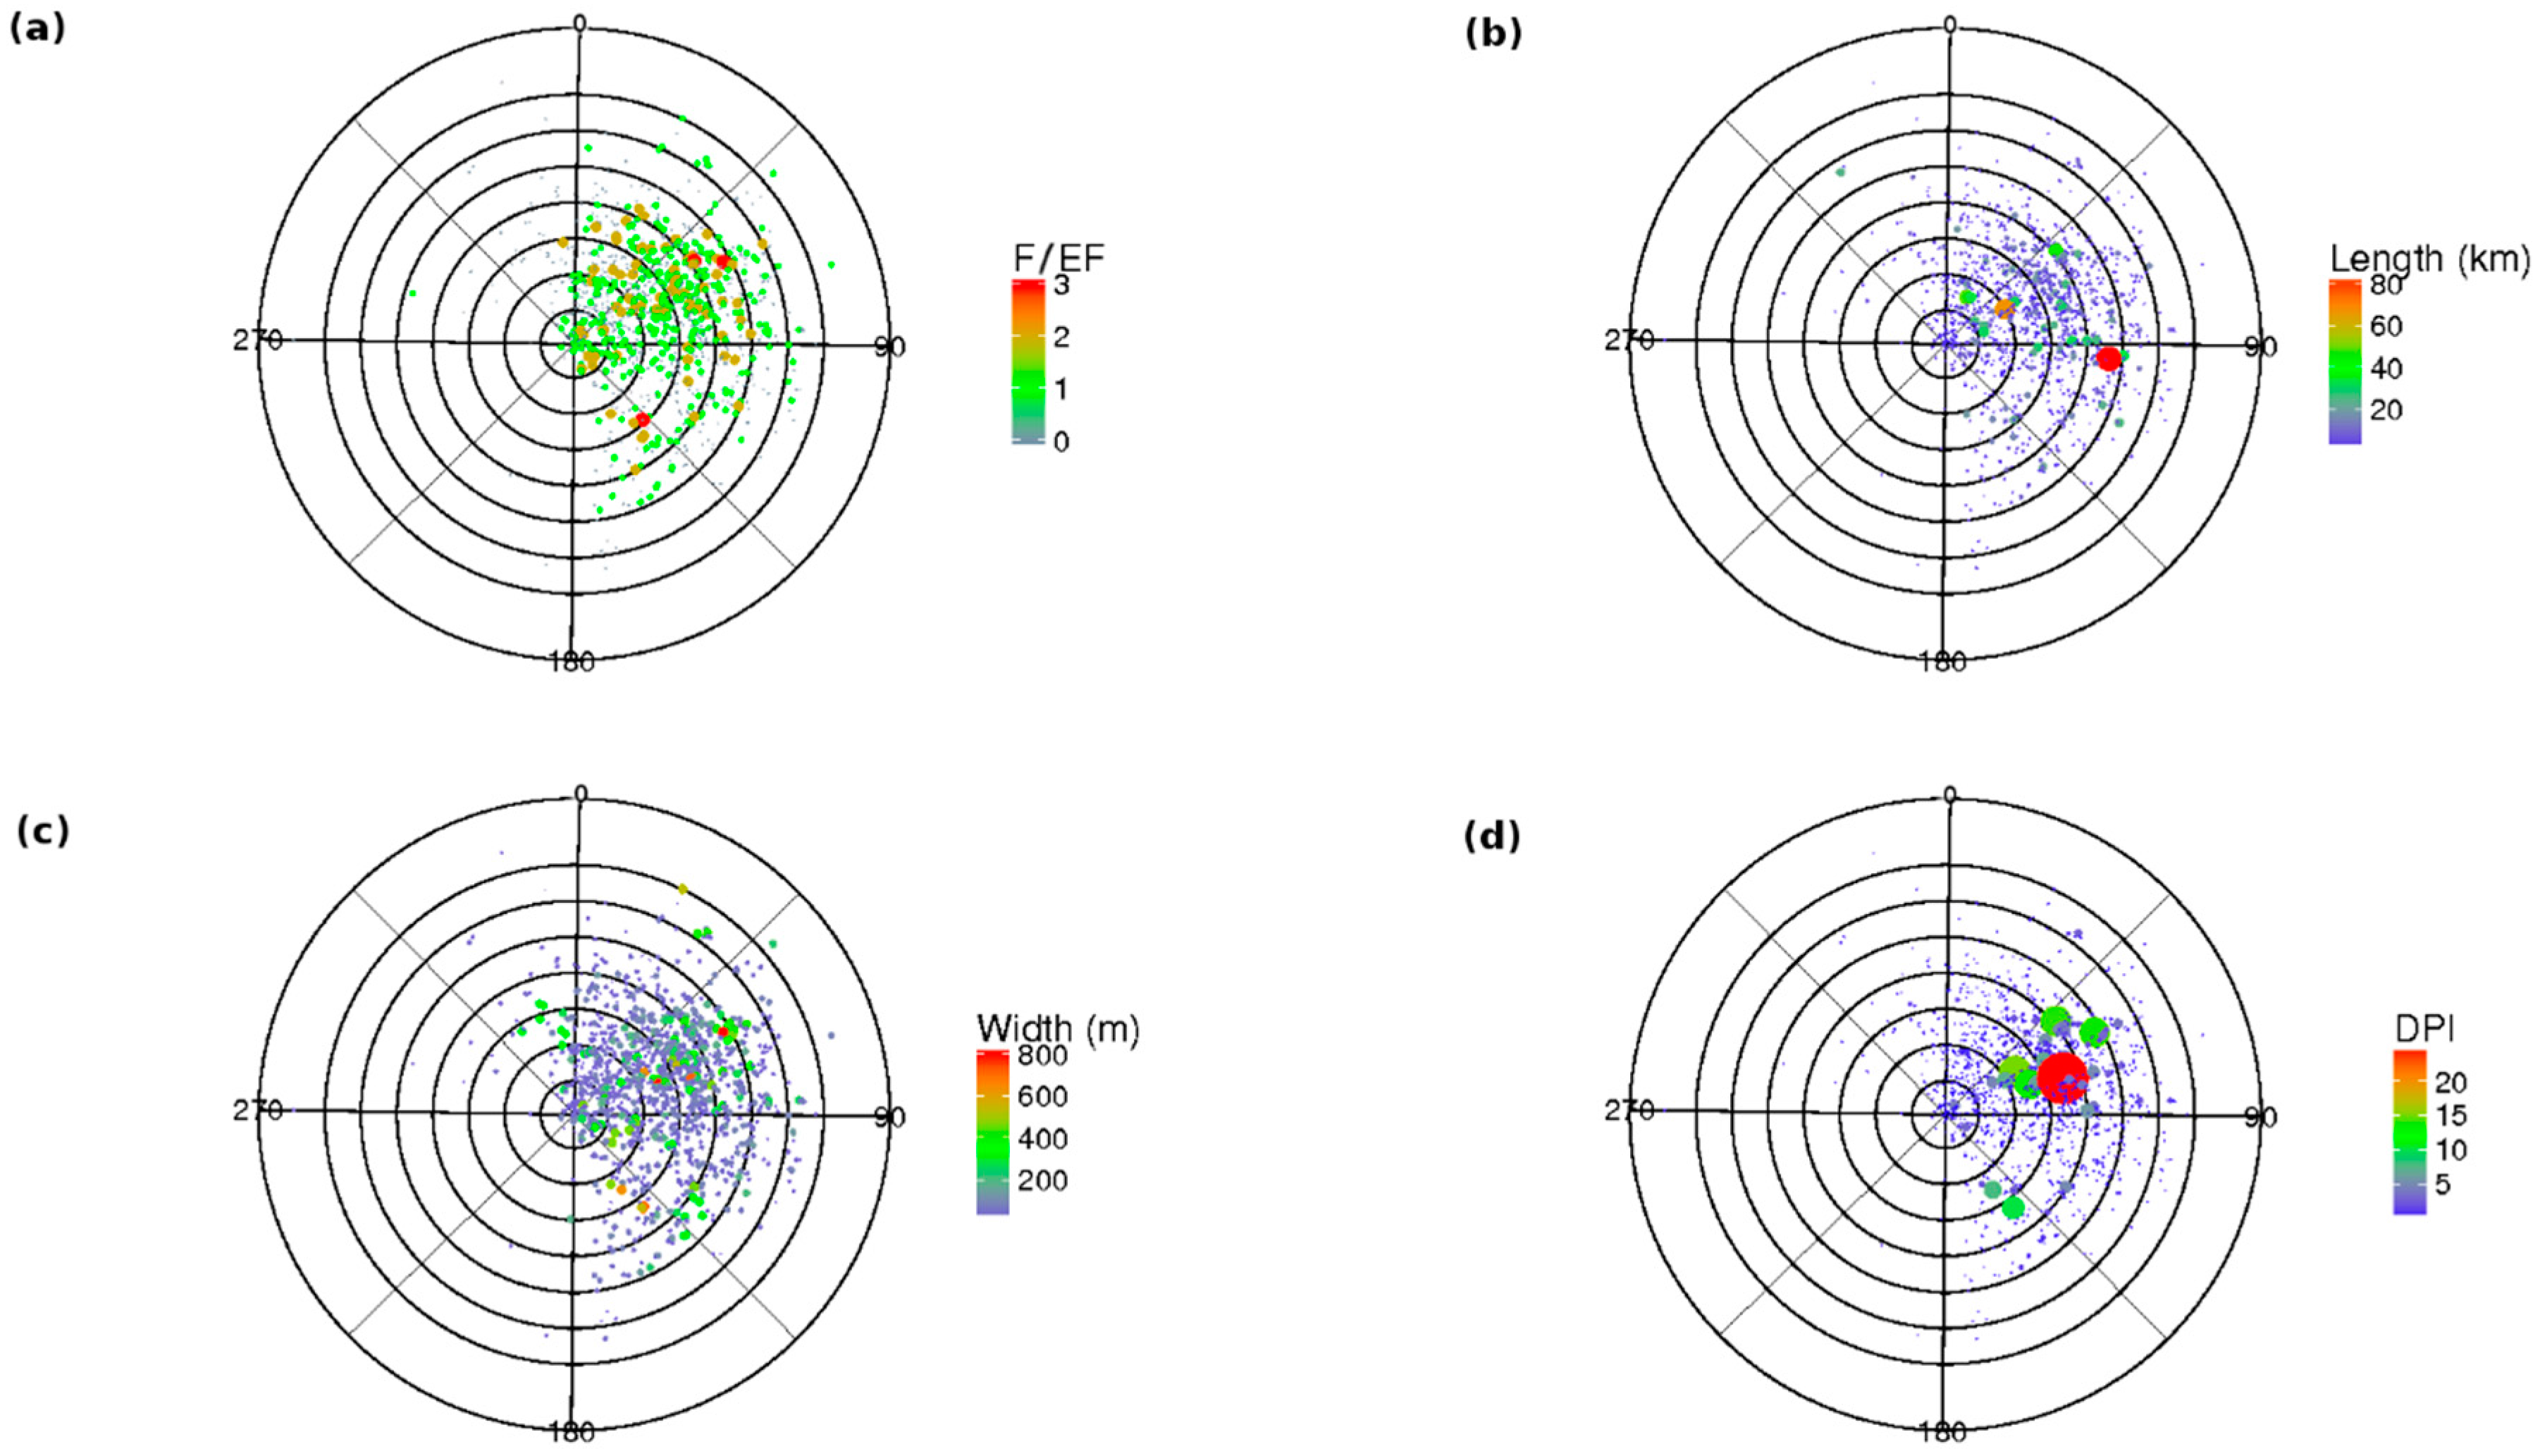
Figure 3.
Spatial distribution of 1280 * tornadoes within the TC environment, stratified by F/EF scale (a), path length (b), path width (c), and DPI (d). Bearing in degrees is defined relative to north. Concentric range rings in km are place at an interval of 100 km. * Five tornadoes are not displayed because their ranges exceed 800 km.
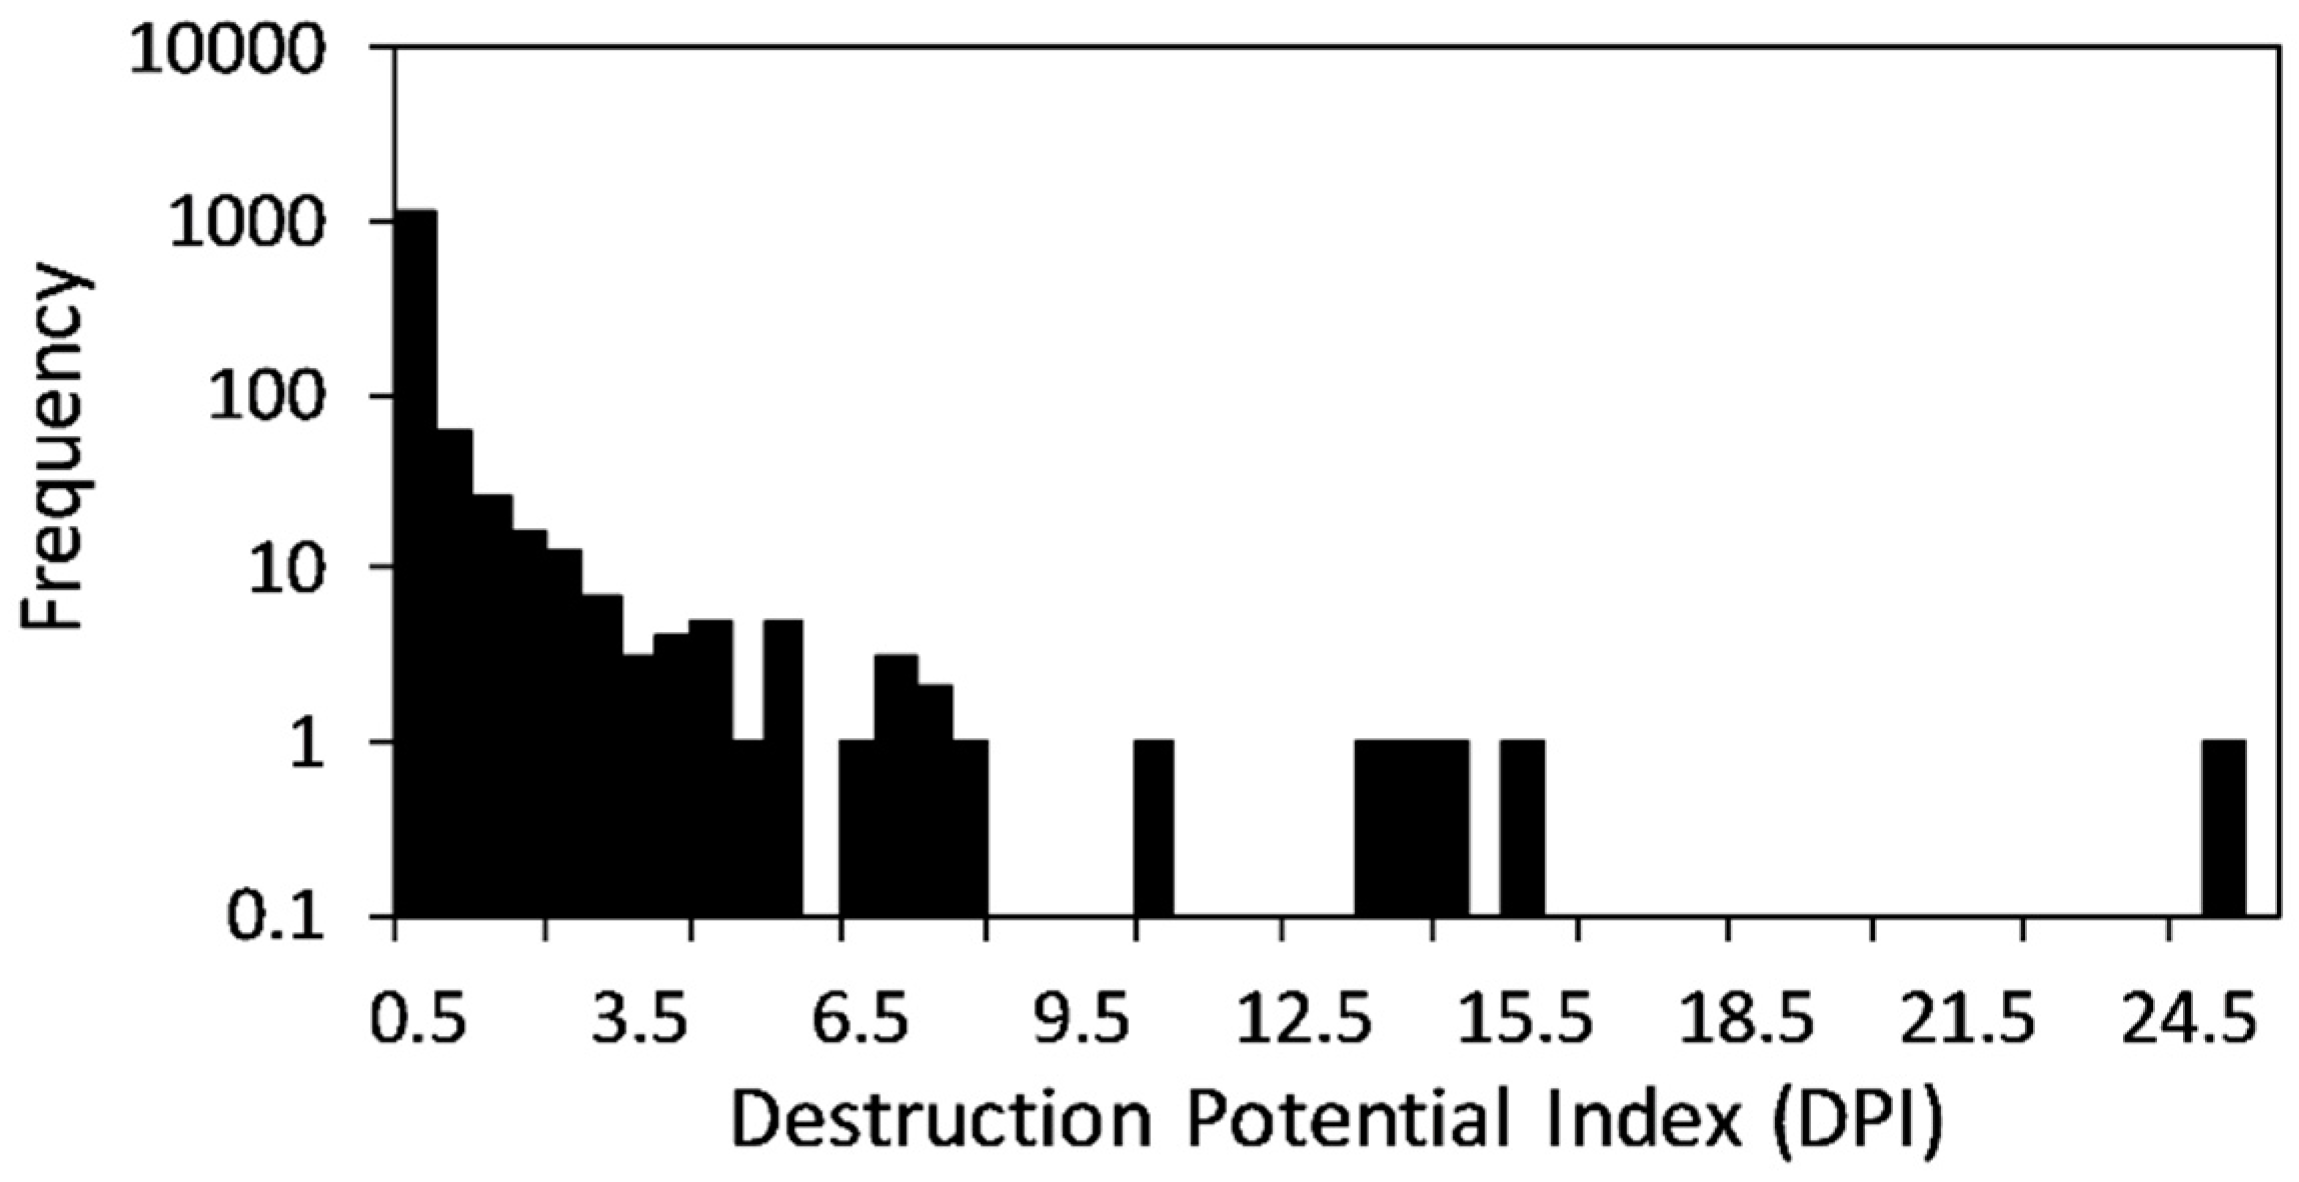
Figure 4.
Frequency distribution of the DPI of 1285 TC tornadoes. The Y-axis is logarithmic.
Figure 4.
Frequency distribution of the DPI of 1285 TC tornadoes. The Y-axis is logarithmic.
Table 1.
Descriptive statistics for the <30° N, 30° N–32° N, 32° N–34° N, and >34° N regions.
Table 1.
Descriptive statistics for the <30° N, 30° N–32° N, 32° N–34° N, and >34° N regions.
| Tornado Characteristic | <30° N (n = 273) | 30° N–32° N (n = 307) | 32° N–34° N (n = 266) | >34° N (n = 439) |
|---|
| F/EF scale | | | | |
| Weak (F/EF 0–1) | 264 (97%) | 295 (96%) | 244 (92%) | 399 (91%) |
| Strong (F/EF 2–3) | 9 (3%) | 12 (4%) | 22 (8%) | 40 (9%) |
| Path length (km) | | | | |
| Mean | 4.1 | 2.7 | 3.7 | 3.7 |
| Median | 0.8 | 1.2 | 1.6 | 1.6 |
| Path width (m) | | | | |
| Mean | 57.6 | 61.9 | 92.4 | 82.8 |
| Median | 27.4 | 27.4 | 45.7 | 45.7 |
| DPI | | | | |
| Mean | 0.15 | 0.27 | 0.52 | 0.42 |
| Median | 0.01 | 0.01 | 0.06 | 0.05 |
Table 2.
Mean ranks used in the Kruskal-Wallis tests for the <30° N, 30° N–32° N, 32° N–34° N, and >34° N regions. Results of the Kruskal-Wallis tests are located below the table. Post-hoc pairwise comparisons indicate that, for all three variables, the mean ranks in the 32° N–34° N and >34° N regions are significantly greater than the mean ranks in the <30° N and 30° N–32° N regions.
| Tornado Characteristic | <30° N | 30° N–32° N | 32° N–34° N | >34° N |
|---|
| Path length (km) a | 570.1 | 583.9 | 712.4 | 687.6 |
| Path width (m) b | 495.3 | 550.1 | 769.5 | 723.2 |
| DPI c | 531.2 | 557.1 | 734.7 | 717.1 |
Table 3.
Descriptive statistics for the 0–100 km, 100–200 km, 200–300 km, and >300 km regions.
Table 3.
Descriptive statistics for the 0–100 km, 100–200 km, 200–300 km, and >300 km regions.
| Tornado Characteristic | 0–100 km (n = 634) | 100–200 km (n = 262) | 200–300 km (n = 203) | >300 km (n = 186) |
|---|
| F/EF scale | | | | |
| Weak (F/EF 0–1) | 604 (95%) | 248 (95%) | 182 (90%) | 168 (90%) |
| Strong (F/EF 2–3) | 30 (5%) | 14 (5%) | 21 (10%) | 18 (10%) |
| Path length (km) | | | | |
| Mean | 3.2 | 3.3 | 4.4 | 4.2 |
| Median | 0.8 | 1.6 | 2.4 | 1.6 |
| Path width (m) | | | | |
| Mean | 57.7 | 85.1 | 96.7 | 92.2 |
| Median | 27.4 | 45.7 | 68.6 | 45.7 |
| DPI | | | | |
| Mean | 0.20 | 0.36 | 0.51 | 0.64 |
| Median | 0.01 | 0.04 | 0.09 | 0.06 |
Table 4.
Mean ranks used in the Kruskal-Wallis tests for the 0–100 km, 100–200 km, 200–300 km, and >300 km regions. Results of the Kruskal-Wallis tests are located below the table. Post-hoc pairwise comparisons indicate that, for all three variables, the mean ranks of the 100–200 km, 200–300 km, and >300 km regions are significantly greater than the mean ranks of the 0–100 km region.
| Tornado Characteristic | 0–100 km | 100–200 km | 200–300 km | >300 km |
|---|
| Path length (km) a | 563.8 | 693.4 | 764.7 | 709.1 |
| Path width (m) b | 519.6 | 735.5 | 800.1 | 761.9 |
| DPI c | 537.9 | 709.1 | 798.0 | 738.9 |
Table 5.
Descriptive statistics for the northeast (NE), southeast (SE), southwest (SW), and northwest (NW) quadrants.
Table 5.
Descriptive statistics for the northeast (NE), southeast (SE), southwest (SW), and northwest (NW) quadrants.
| Tornado Characteristic | NE Quadrant (n = 855) | SE Quadrant (n = 348) | SW Quadrant (n = 10) | NW Quadrant (n = 72) |
|---|
| F/EF scale | | | | |
| Weak (F/EF 0–1) | 794 (93%) | 327 (94%) | 10 (100%) | 71 (99%) |
| Strong (F/EF 2–3) | 61 (7%) | 21 (6%) | 0 (0%) | 1 (1%) |
| Path length (km) | | | | |
| Mean | 3.6 | 3.8 | 2.4 | 2.1 |
| Median | 1.6 | 1.6 | 2.3 | 0.8 |
| Path width (m) | | | | |
| Mean | 73.5 | 77.4 | 56.7 | 73.8 |
| Median | 45.7 | 45.7 | 25.1 | 27.4 |
| DPI | | | | |
| Mean | 0.40 | 0.26 | 0.11 | 0.12 |
| Median | 0.03 | 0.04 | 0.04 | 0.01 |
Table 6.
Mean ranks used in the Kruskal-Wallis tests for the northeast (NE), southeast (SE), southwest (SW), and northwest (NW) quadrants. Results of the Kruskal-Wallis tests are located below the table. Post-hoc pairwise comparisons indicate that, for all three variables, the mean ranks of the NE and SE quadrants are significantly greater than the mean ranks of the NW quadrant.
| Tornado Characterisitc | NE Quadrant | SE Quadrant | SW Quadrant | NW Quadrant |
|---|
| Path length (km) a | 642.8 | 668.9 | 699.2 | 513.0 |
| Path width (m) b | 653.5 | 649.0 | 546.0 | 503.3 |
| DPI c | 646.4 | 665.1 | 634.4 | 497.6 |
Table 7.
Descriptive statistics for the north-of-center (NoC), east-of-center (EoC), south-of-center (SoC), and west-of-center (WoC) quadrants.
Table 7.
Descriptive statistics for the north-of-center (NoC), east-of-center (EoC), south-of-center (SoC), and west-of-center (WoC) quadrants.
| Tornado Characteristic | NoC Quadrant (n = 333) | EoC Quadrant (n = 838) | SoC Quadrant (n = 100) | WoC Quadrant (n = 14) |
|---|
| F/EF scale | | | | |
| Weak (F/EF 0–1) | 313 (94%) | 785 (94%) | 90 (90%) | 14 (100%) |
| Strong (F/EF 2–3) | 20 (6%) | 53 (6%) | 10 (10%) | 0 (0%) |
| Path length (km) | | | | |
| Mean | 2.8 | 3.8 | 3.7 | 2.8 |
| Median | 1.0 | 1.6 | 1.6 | 2.0 |
| Path width (m) | | | | |
| Mean | 56.2 | 80.0 | 89.5 | 69.1 |
| Median | 30.2 | 45.7 | 45.7 | 25.1 |
| DPI | | | | |
| Mean | 0.15 | 0.41 | 0.48 | 0.21 |
| Median | 0.01 | 0.03 | 0.04 | 0.02 |
Table 8.
Mean ranks used in the Kruskal-Wallis tests for the north-of-center (NoC), east-of-center (EoC), south-of-center (SoC), and west-of-center (WoC) quadrants. Results of the Kruskal-Wallis tests are located below the table. Post-hoc pairwise comparisons indicate that, for all three variables, the mean ranks of the EoC and SoC quadrants are significantly greater than the mean rank of the NoC quadrant.
| Tornado Characteristic | NoC Quadrant | EoC Quadrant | SoC Quadrant | WoC Quadrant |
|---|
| Path length (km) a | 580.8 | 662.0 | 688.0 | 661.8 |
| Path width (m) b | 544.4 | 679.4 | 690.6 | 468.9 |
| DPI c | 562.0 | 670.5 | 690.7 | 581.8 |
Table 9.
Descriptive statistics for the north and south halves (NH and SH, respectively).
Table 9.
Descriptive statistics for the north and south halves (NH and SH, respectively).
| Tornado Characterisitc | NH (n = 927) | SH (n = 358) |
|---|
| F/EF scale | | |
| Weak (F/EF 0–1) | 865 (93%) | 337 (94%) |
| Strong (F/EF 2–3) | 62 (7%) | 21 (6%) |
| Path length (km) | | |
| Mean | 3.5 | 3.7 |
| Median | 1.6 | 1.6 |
| Path width (m) | | |
| Mean | 73.5 | 76.8 |
| Median | 45.7 | 45.7 |
| DPI | | |
| Mean | 0.38 | 0.26 |
| Median | 0.03 | 0.04 |
Table 10.
Mean ranks used in the Mann-Whitney tests for the north half (NH) and south half (SH). Results of the Mann-Whitney tests are located below the table.
Table 10.
Mean ranks used in the Mann-Whitney tests for the north half (NH) and south half (SH). Results of the Mann-Whitney tests are located below the table.
| Tornado Characteristic | NH | SH |
|---|
| Path length (km) a | 632.7 | 669.7 |
| Path width (m) b | 641.8 | 646.2 |
| DPI c | 634.8 | 664.2 |
Table 11.
Descriptive statistics for the east and west halves (EH and WH, respectively).
Table 11.
Descriptive statistics for the east and west halves (EH and WH, respectively).
| Tornado Characteristic | EH (n = 1203) | WH (n = 82) |
|---|
| F/EF scale | | |
| Weak (F/EF 0–1) | 1121 (93%) | 81 (>99%) |
| Strong (F/EF 2–3) | 82 (7%) | 1 (<1%) |
| Path length (km) | | |
| Mean | 3.6 | 2.1 |
| Median | 1.6 | 0.8 |
| Path width (m) | | |
| Mean | 74.6 | 71.7 |
| Median | 45.7 | 27.4 |
| DPI | | |
| Mean | 0.36 | 0.11 |
| Median | 0.03 | 0.01 |
Table 12.
Mean ranks used in the Mann-Whitney tests for the east half (EH) and west half (WH). Results of the Mann-Whitney tests are located below the table.
Table 12.
Mean ranks used in the Mann-Whitney tests for the east half (EH) and west half (WH). Results of the Mann-Whitney tests are located below the table.
| Tornado Characteristic | EH | WH |
|---|
| Path length (km) a | 650.3 | 535.7 |
| Path width (m) b | 652.2 | 508.6 |
| DPI c | 651.8 | 514.3 |
Table 13.
Top ten tornadoes (and ties) by DPI.
Table 13.
Top ten tornadoes (and ties) by DPI.
| TC Name | Month | Date | Year | F/EF | Length (km) | Width (m) | DPI | Bearing | Range | Casualties |
|---|
| Rita | 9 | 24 | 2005 | 2 | 29.0 | 731.2 | 24.55 | 73 | 348 | 3 |
| Andrea | 6 | 6 | 2013 | 1 | 30.4 | 643.5 | 15.11 | 59 | 233 | 0 |
| Lee | 9 | 5 | 2011 | 1 | 45.7 | 402.2 | 14.19 | 50 | 409 | 1 |
| Frances | 9 | 7 | 2004 | 3 | 11.3 | 804.3 | 14.00 | 61 | 480 | 1 |
| Cindy | 7 | 6 | 2005 | 2 | 14.5 | 804.3 | 13.50 | 70 | 256 | 0 |
| Rita | 9 | 25 | 2005 | 2 | 16.1 | 548.4 | 10.23 | 144 | 327 | 0 |
| Hermine | 9 | 8 | 2010 | 1 | 15.9 | 643.5 | 7.91 | 147 | 253 | 0 |
| Charley | 8 | 13 | 2004 | 2 | 67.6 | 91.4 | 7.16 | 60 | 198 | 0 |
| Ivan | 9 | 15 | 2004 | 2 | 11.3 | 548.4 | 7.16 | 65 | 323 | 9 |
| Ivan | 9 | 15 | 2004 | 2 | 12.9 | 457.0 | 6.82 | 61 | 318 | 3 |
| Rita | 9 | 25 | 2005 | 2 | 8.1 | 731.2 | 6.82 | 143 | 330 | 1 |


