Article

Comparing the Spatial Patterns of Rainfall and Atmospheric Moisture among Tropical Cyclones Having a Track Similar to Hurricane Irene (2011)

Department of Geography, University of Florida, Gainesville, FL 32611, USA
Atmosphere 2017, 8(9), 165; https://doi.org/10.3390/atmos8090165
Submission received: 26 July 2017 / Revised: 19 August 2017 / Accepted: 1 September 2017 / Published: 6 September 2017
(This article belongs to the Special Issue Tropical Cyclones and Their Impacts)

Abstract

:
Irene was the most destructive tropical cyclone (TC) of the 2011 Atlantic hurricane season due to flooding from rainfall. This study used a Geographic Information System to identify TCs with similar tracks and examine the spatial attributes of their rainfall patterns. Storm-total rainfall was calculated from the Unified Precipitation Dataset for 11 post-1948 storms and statistics corresponding to the top 10% of rainfall values left of track were computed. Irene-type tracks occur every 6.6 years. Floyd (1999) produced the highest rainfall overall and was the closest analog to Irene, yet Irene produced more rainfall in the northeastern U.S. where higher values of precipitable water existed. Areas of high rainfall expanded as five TCs moved north due to synoptic-scale forcing during extratropical transition. However, Irene and three other TCs did not exhibit this pattern. The amount of moisture in the environment surrounding the TC, rather than storm speed or intensity, exhibited the strongest correlations with rainfall totals and their spatial distribution. These results demonstrate the high variability that exists in the production of rainfall among TCs experiencing similar steering flow, and show that advection of moisture from the tropics is key to higher rainfall totals in the mid-latitudes.

1. Introduction

In addition to other hazards, tropical cyclones (TCs) can bring heavy rainfall as they track over land. According to [1], about one quarter of TC-related deaths in the U.S. are due to drowning in rainfall-induced floods, and floods from rainfall cause the most deaths on a per-TC basis in the United States. Hurricane Irene was the most damaging TC of the 2011 Atlantic Basin hurricane season [2]. Although some damage and deaths resulted from high winds, several tornadoes, and storm surge, Irene produced record-breaking rainfall across multiple locations in the mid-Atlantic and northeastern states. In fact, 21 of 41 U.S. deaths were attributed to flooding from rainfall [2], which is much higher than the 27% of deaths attributed to rainfall from all Atlantic TCs 1963–2012 [1]. The National Hurricane Center (NHC) report [3] lists Bayboro, North Carolina as the U.S. location receiving the highest rainfall, and also reports the “catastrophic inland flooding in New Jersey, Massachusetts, and Vermont” that occurred as Irene tracked northward after the North Carolina landfall. Thus, relatively high rainfall totals occurred over a large distance from the point of landfall. Analysis of storm-total rainfall by hydrologists at The Weather Prediction Center (WPC) revealed that locations in eight states received more than 254 mm of rainfall [4]. Analysis of flooding by [5] found that over the past 30 years, some of the largest floods caused by TCs over the U.S. were associated with Irene.
Many TCs tracking over the northeastern U.S. have produced heavy rainfall that caused flooding [5,6,7,8,9]. When passing through this region, TCs can become restructured from a warm-core to a cold-core cyclone through the process of extratropical transition (ET) [8]. Interaction with strong cyclonic vorticity and westerly winds associated with a middle latitude trough causes an increase in vertical wind shear and TC translational speed and vorticity as the TC moves into a baroclinic environment. The relatively cool and dry air encircles the TC from the southwest to southeast which helps to decrease precipitation in this section of the storm. However, isentropic uplift of the moist tropical air mass ahead of the storm center enhances precipitation in the northeast quadrant as the wind and rain fields expand [6,10,11,12,13]. TC interactions with frontal boundaries and troughs can lead to small regions of heavy rainfall at large distances from the storm center [6]. Interaction with topography such as that which occurs near the Appalachian Mountains in the U.S. can also enhance TC precipitation on the windward side of the slope while restricting the spread of rainfall outward from the track on the side of the storm where the wind circulation becomes downslope [14,15]. Despite their relatively fast translational speeds when compared to TCs that are not transitioning into an extratropical cyclone, 200–300 mm of rain can fall from these transitioning systems in a 24-h period [11], which can lead to flooding and associated damage to property and loss of life.
Accurately forecasting the amounts and locations of rainfall from TCs is a difficult task [16]. The track of a TC plays an important role in determining the distribution of rainfall that it produces [17]. Forecasters may use analogs to compare a current TC with past TCs of similar size, motion, and synoptic-scale environmental conditions [18]. A rainfall climatology and persistence model (R-CLIPER) was developed as a benchmark against which rainfall forecasts could be measured [19,20]. The R-CLIPER model incorporated data from rain gauges aggregated into 50 annular rings that were 10 km wide. Only TCs that were hurricanes at landfall were included, and fitting of the mean rain rates by time after landfall and distance from the storm track produced a symmetric rainfall swath with amounts that decreased over time, and with the highest amounts being located at the center of the storm. By accounting for vertical wind shear and topography in conjunction with R-CLIPER, the Parametric Hurricane Rainfall Model [21] improved predictions of the amounts and asymmetrical distribution of TC rainfall. These studies indicate that TCs taking a similar trajectory to Irene, which moved over the northeastern U.S. east of the Appalachian Mountains while undergoing ET, will produce similar spatial patterns of rainfall. The current study examines the spatial patterns of storm-total rainfall to test this assumption.
Many previous studies have demonstrated how vertical wind shear and storm motion contribute to asymmetrical rainfall distributions from TCs [21,22,23,24,25,26,27,28,29]. Fewer studies have incorporated atmospheric moisture to explain variations in storm size or rainfall totals. Through modeling studies, [30,31] showed that increased moisture outside of the TC environment lead to a larger storm size. Observational analyses by Jiang et al. [32] and Matyas and Cartaya. [33], who each examined two TCs taking similar tracks in the same year, showed that increased moisture was related to higher rainfall rates as the TCs moved over land. Moisture is a key predictor of the extent of rainfall on the western sides of hurricanes making landfall in the U.S. [34]. It is well-known that the majority of moisture in a TC’s water budget originates from outside of a TC’s circulation rather than from evaporation directly underneath the storm [35,36,37]. Therefore, this study will explore the amount and spatial patterns of moisture in the environment surrounding each TC and the relationship with the amount and spatial distribution of rainfall totals.
According to census estimates from 2013, nearly 20 million people live in the metropolitan statistical area covering New York-Newark-Jersey City, and another six million live in Philadelphia-Camden-Wilmington [38]. The fact that these and other large populations live in the paths of TCs like Irene justifies an exploration into the conditions that influence the rainfall that they produce. Therefore, this study determines how frequently TCs move in a similar manner over the region, and examines their rainfall patterns to determine whether similarities exist in the amounts and spatial distribution. A Geographic Information System (GIS) is employed to identify such TCs and characterize their spatial patterns of rainfall. The amounts and locations of the top 10% of rainfall totals left of the storm track are examined in terms of their distance from the storm track as well as latitude through the calculation of Spearman’s rank correlation coefficients to determine how frequently higher rainfall amounts occur near to the storm track and closer to the point of landfall as suggested by the R-CLIPER model. Comparisons of these values indicate that Hurricane Floyd (1999) is the closest analog of Irene, producing a similar spatial distribution of rainfall. They also demonstrate the range of rainfall patterns that can occur from these TCs. Correlation analyses demonstrate the importance of atmospheric moisture for the amount of rainfall and its distance from the storm track. Finally, a map is created that indicates the highest rainfall totals and the TC that produced that rainfall. This study identifies areas receiving high rainfall from TCs that are undergoing an ET over the northeastern U.S., which may aid long-term planning for TC-associated risks.

2. Experiments

The first task was to identify TCs that are analogs for the track of Irene over the U.S. Latitude and longitude coordinates from the six-hourly positions of Irene and all TCs spanning 1851–2016 were obtained from HURDAT2 [39]. These coordinates and entered into a GIS and positions located 30–50° N were converted into lines representing each storm’s track. The line representing Irene’s track was buffered by 200 km to select tracks that were (a) near the U.S. coastline and (b) a similar distance from the Appalachian Mountains to control for the effects of topography on rainfall enhancement. The buffered track of Irene (Figure 1) was used to clip the tracks of the other TCs, and new attributes of track length and orientation were calculated for 347 tracks within the buffered region. From these, 24 TCs were identified as having a track segment of at least 1150 km within the buffer with north to northeast orientation. These TCs also make landfall over or pass within 100 km east of North Carolina, and make landfall in New York, Connecticut, Rhode Island, or Massachusetts. These TCs represent the best track analogs for Irene as it affected the U.S. Having a similar track implies that the TCs encountered similar steering currents provided by the Bermuda-Azores High and timing of interactions with middle-latitude troughs. The latitude and longitude of landfall, intensity at the time of landfall, time until the storm dissipated or completed an extratropical transition, and the coordinates needed to calculate storm trajectory through the study region were also taken from HURDAT2.
The next step was to determine storm-total rainfall amounts. Daily rainfall totals were obtained from the National Centers for Environmental Prediction–Climate Prediction Center (NCEP-CPC) Unified Precipitation Dataset (UPD) [40]. These interpolated and gridded data are available at a 0.25° latitude × 0.25° longitude spatial resolution beginning in 1948. Two main advantages of utilizing this dataset are (1) its complete spatial and temporal coverage over U.S. land areas beginning in 1948 and (2) that a uniform interpolation method, quality control checks, and error corrections were applied to the entire dataset. The two main limitations of this dataset are that (1) rainfall totals are averaged over grid cells approximating 770 km2 so that values are underestimated, particularly for regions receiving high rainfall amounts [6] and (2) data are only available over land areas so that rainfall occurring offshore cannot be analyzed. This limits the ability to investigate rainfall produced on the right side of the storm’s track. Previous studies have used this dataset to examine rainfall from TCs [6,41], supporting its use in the current study. The fact that strong winds near the TC’s center causes undercatch in rain gauges leading to lower rainfall totals should also be noted [42,43,44]. Details as to the construction of the dataset are available online (http://www.esrl.noaa.gov/psd/data/gridded/data.unified.html). Ten of the 24 similar TC tracks occurred post-1948, permitting the rainfall analysis of 11 TCs. Visual comparisons of the UPD-derived estimates from this study with storm-total rainfall maps available since 1956 from the WPC revealed that the spatial patterns were in good agreement with those derived in the current study.
The region for rainfall analysis was defined by the U.S. border to the north and coastline to the east, and extended south to 33.75° N and west to 82.1° W (Figure 1). There are 1477 grid cells in this region within the UPD. Storm-total rainfall for the 11 TCs was calculated utilizing the cell statistics tool in ArcGIS. When considering the top 10% of rainfall totals produced by each TC, the outermost regions of rainfall belonging to each TC were defined using the method outlined in [45] where 12.5 mm values of daily rainfall were contoured and converted to polygons. Polygons whose centroids were located within 550 km of the storm track were retained and used to define the grid cells containing rainfall that was produced by a TC. Daily rainfall totals were summed for these grid cells beginning on the day that was at least 24 h prior to the storm’s first landfall or point of closest approach to the North Carolina coastline and ending at least 24 h after the circulation center exited the U.S. This means that some of the precipitation received could be from the extratropical cyclone after the TC has transitioned. The storm-total rainfall raster was then converted into a point feature class and transformed into an equidistant cylindrical projection to preserve distance. The latitude and longitude of each grid point was added to the attribute table for each storm. The distance and angle of each grid cell from the closest location along the storm track was calculated utilizing the near function. The highest 10% of rainfall totals for each storm that were left of the storm track and south of 45° N were analyzed further to facilitate comparisons of the regions where the highest rainfall occurred. Measures of central tendency and dispersion were calculated and Spearman’s rank correlation coefficients were computed to explore associations between the locations and amounts of high rainfall totals and distance to track. Additionally, the highest rainfall accumulating at each cell in the study region, and the storm producing it, were also determined to complete the climatological investigation of rainfall associated with this type of storm track. To create these maps, all rainfall was considered regardless of its distance from the storm track.
As storm translational speed influences the total amount of rainfall that a location can receive, speed is calculated at the time the TC enters and exits the study region. Spearman’s correlation coefficients are calculated between the spatial pattern and amount of rainfall produced by each TC and the translational speed of the storm as it entered and exited the study region. An examination of the synoptic-scale environment around the storm helps determine the features responsible for storm motion. For all TCs forming after 1948, the average daily anomalies of the geopotential height of 500 hPa pressure for each TC on the day of landfall were obtained from the NCEP/NCAR reanalysis project [46], and the values for all 11 TCs were averaged together. The distance between the TC and middle-latitude circulation features as well as the strength of the middle-latitude features influence TC structure and hence its rainfall production [47].
The amount of moisture available in the environment surrounding a TC has important implications for rainfall production. Daily average total precipitable water (TPW) values were obtained from the NCEP/NCAR reanalysis project for the day of and prior to landfall. A GIS was utilized to determine the highest value in each 2.5° latitude × 2.5° longitude grid cell over the 2-day period. These values were then contoured every 5 mm. First, the highest TPW value with a closed polygon in the study region was recorded. Then, as all TCs had closed TPW values of 45 mm, this contour line was evaluated further. The width of the 45 mm contour of TPW was measured zonally across the latitude of the landfall point. The height of the 45 mm contour was measured meridionally from its northernmost to southernmost point. Spearman’s rank correlation coefficients were also calculated to reveal relationships between rainfall amounts and their distance from the storm track, TPW measurements, storm intensity, and translational velocity. It is important to note that Spearman’s correlations examine the monotonic relationship between two variables and that this relationship does not have to be linear to yield a statistically significant result. Given the relatively small sample size of 11 storms in these calculations, coefficient values had to be highly positive or negative to reach a 95% confidence level.

3. Results and Discussion

3.1. Characteristics of Track Trajectories

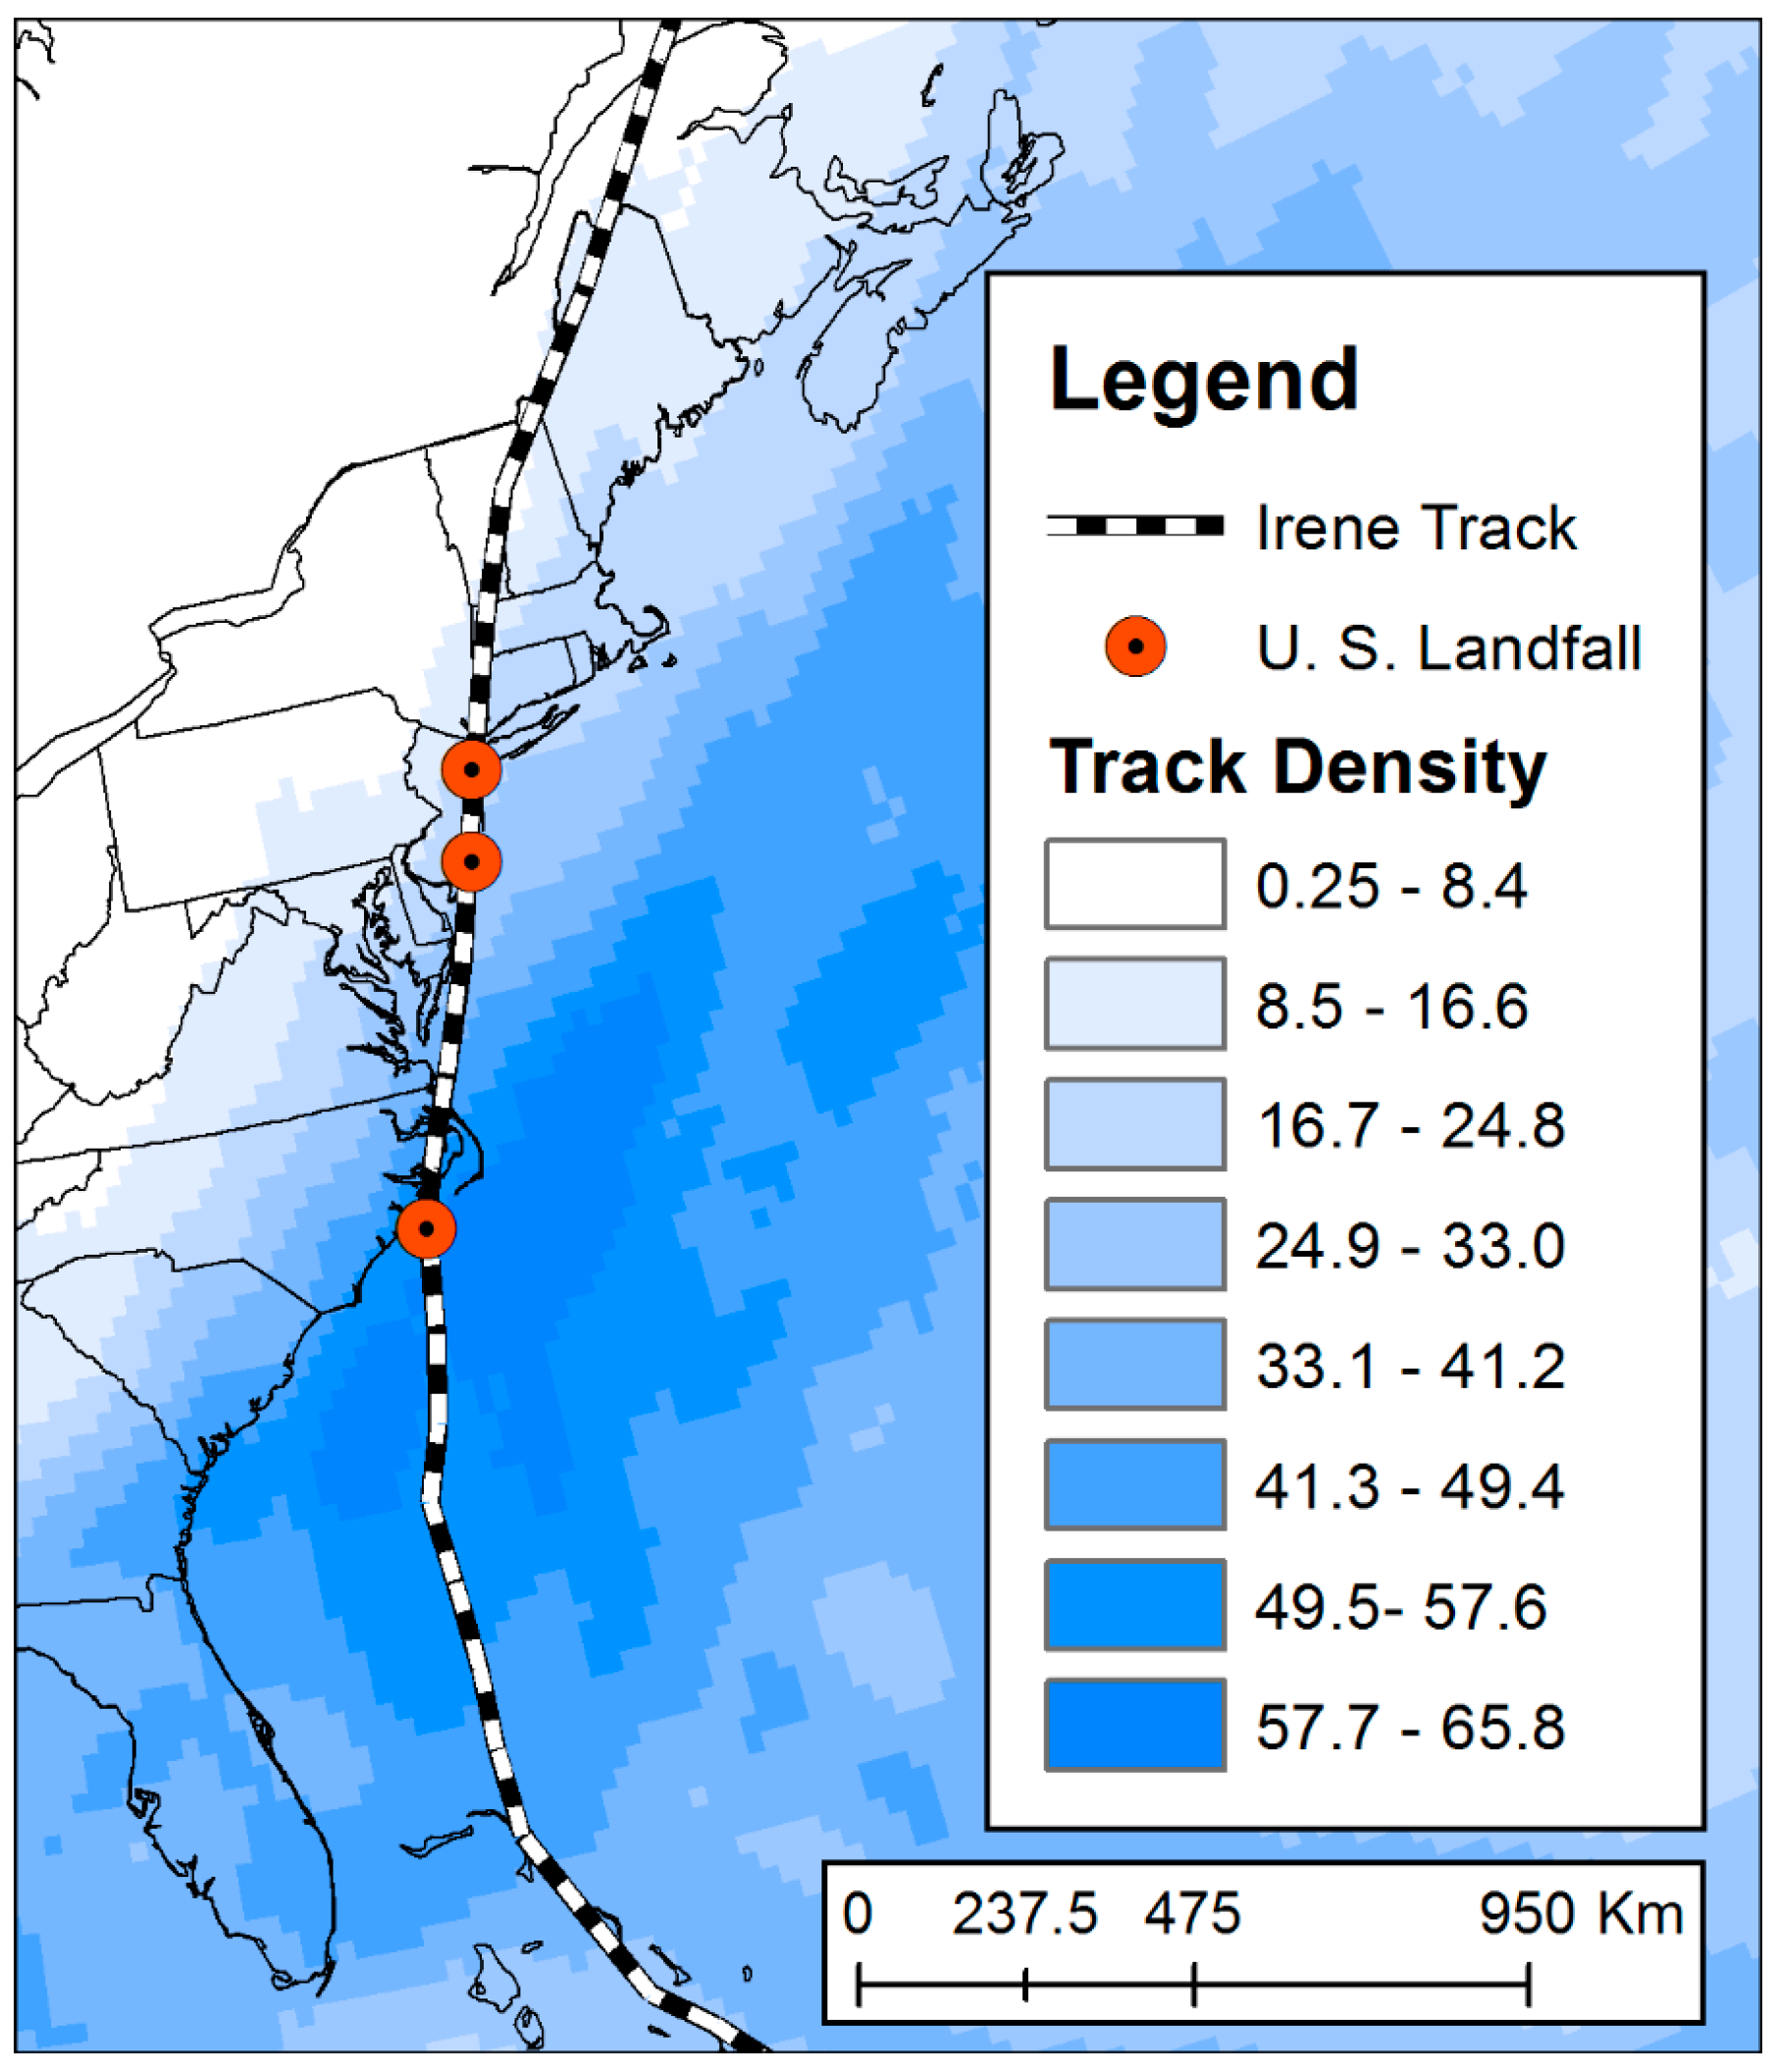
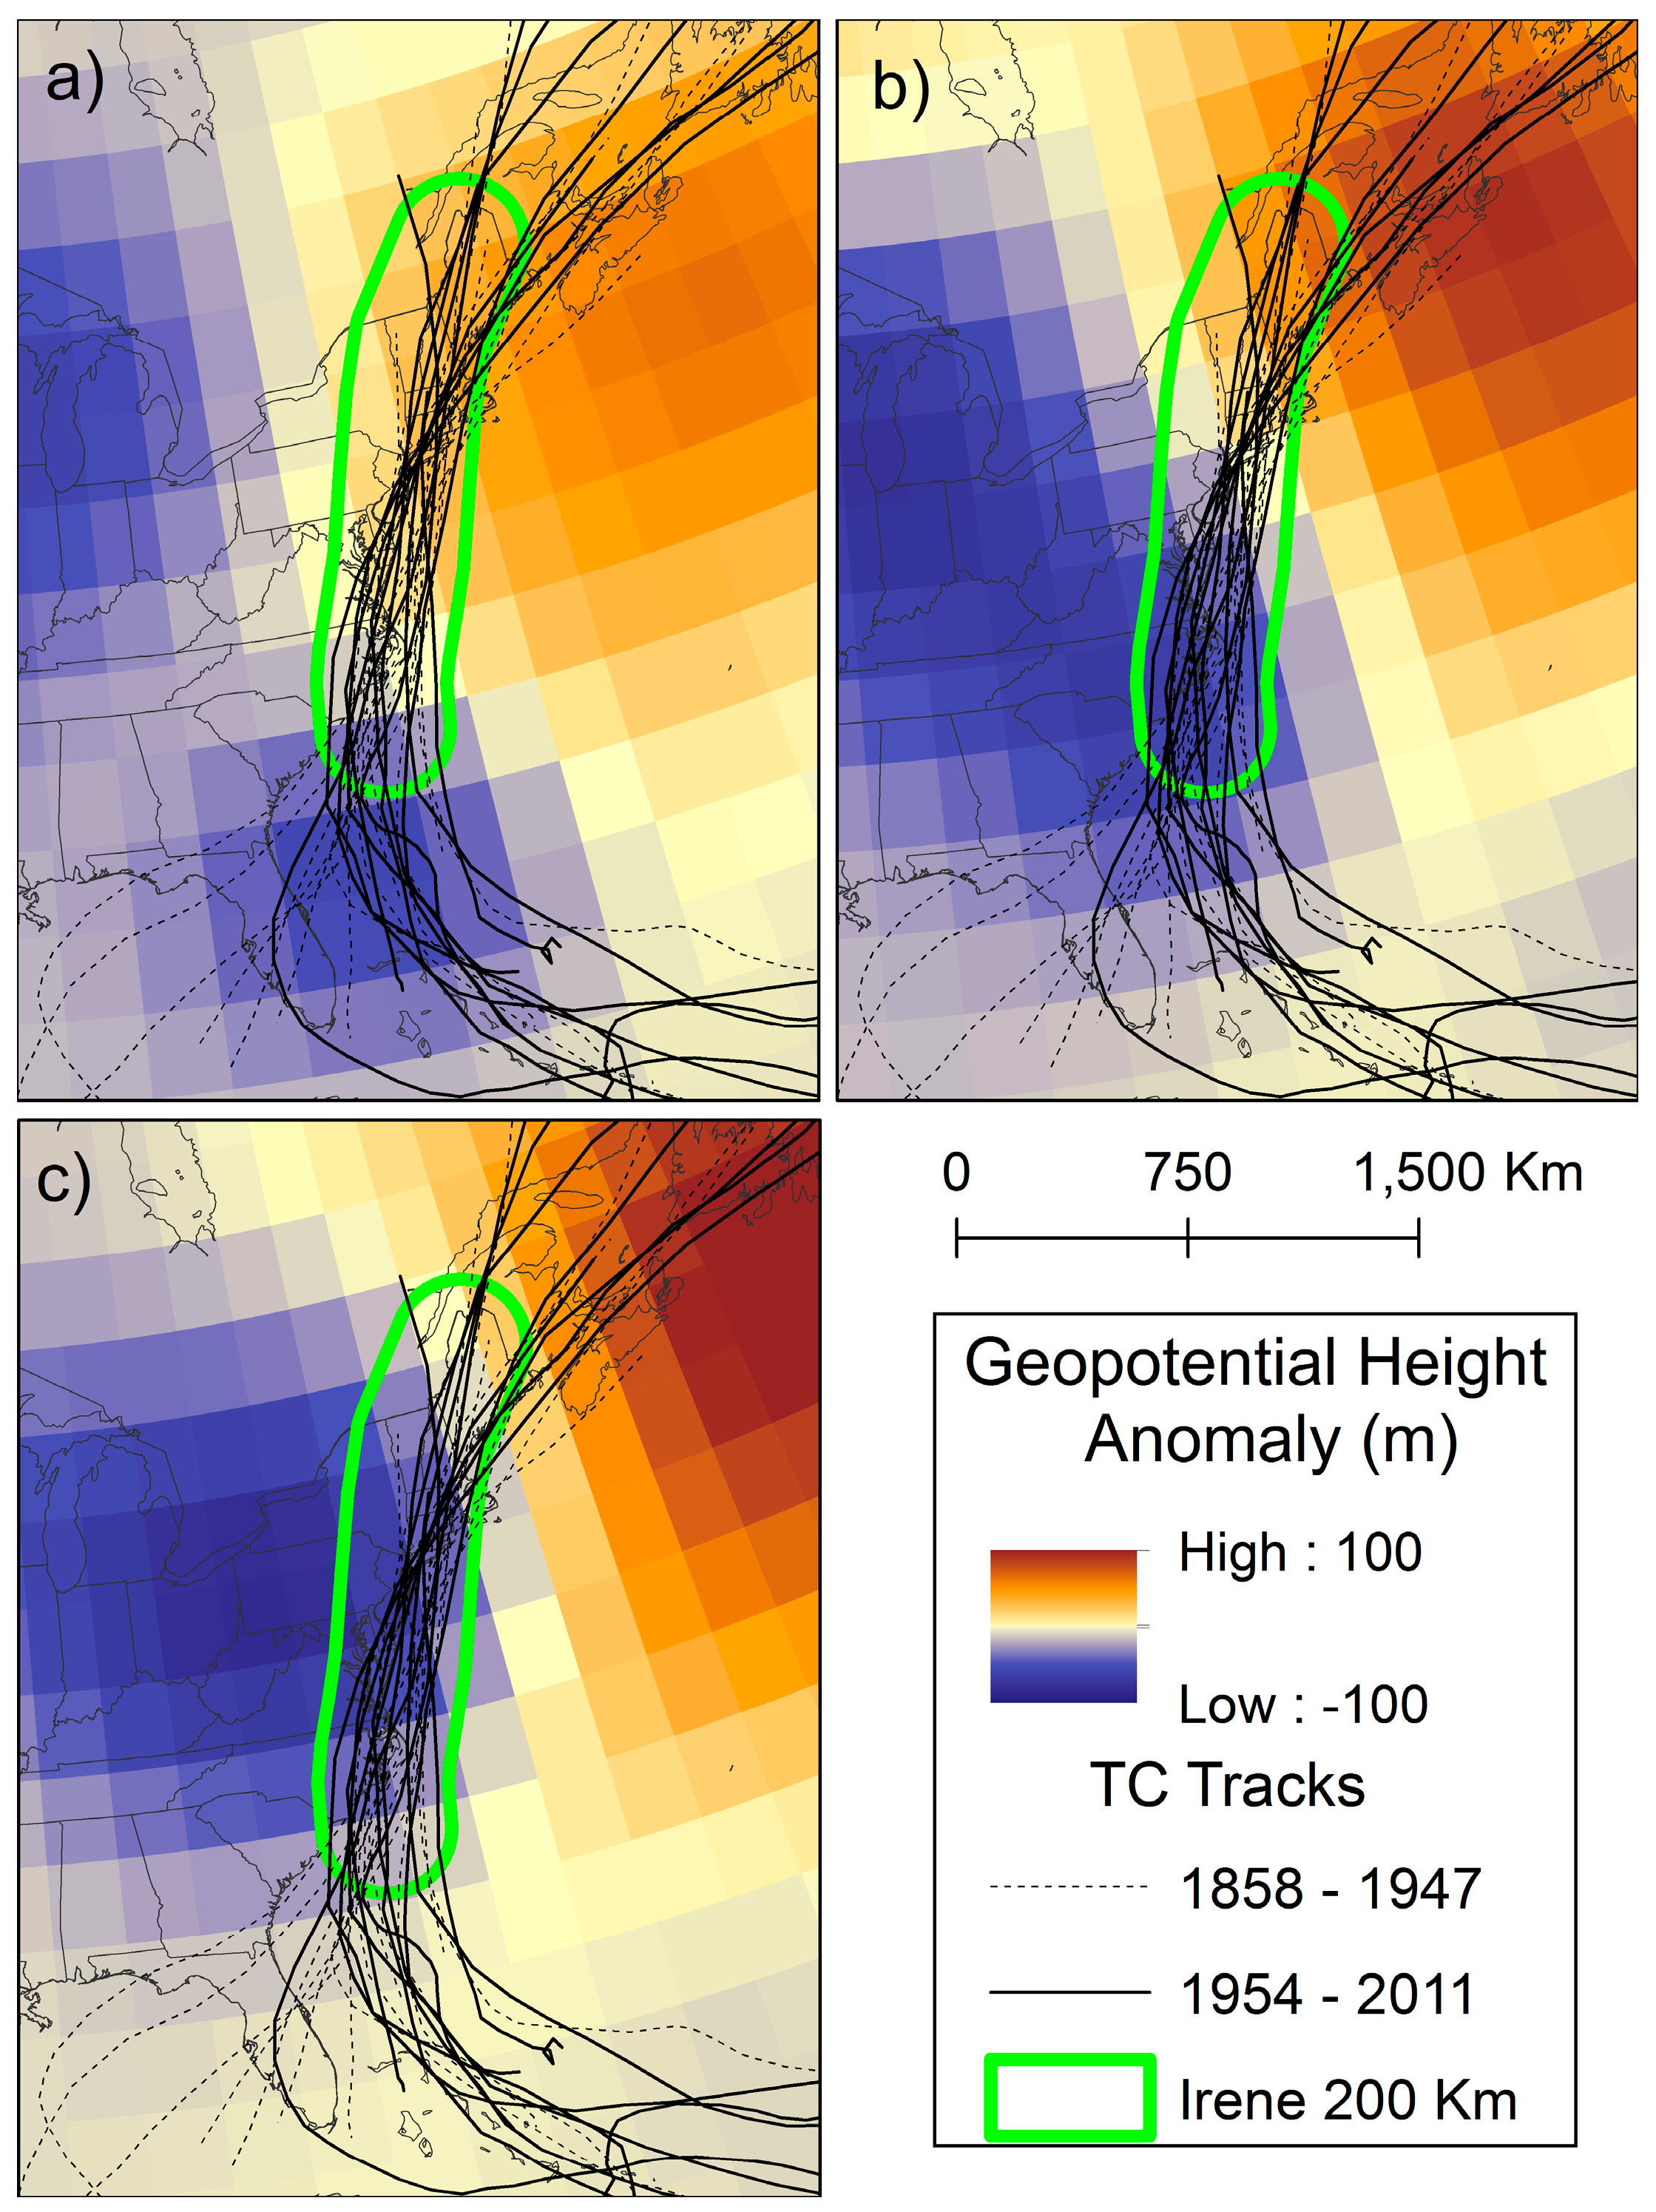
During 1851–2016, 24 TCs had tracks through the study region with a trajectory similar to Irene (Figure 1), meaning that this type of track has a recurrence interval of approximately 6.6 years. Four (three) such TCs occurred in the 1860s (1900s and 1990s). The most common month of occurrence is September, although one case occurred in May and another in November. A track density map reveals that these storms took tracks different from the majority of TCs located just offshore of North Carolina. From this region, TCs tend to move northeast and stay offshore rather than moving north-northeast and making additional U.S. landfalls as occurred during Irene (Figure 2). An examination of the 500 hPa geopotential height anomalies reveals the positions of the features responsible for steering Irene and other similar TCs since 1948 (Figure 3). The presence of positive anomalies east of the storm track indicates the position of a blocking ridge, while negative anomalies northwest of the storm track indicate and upper-level trough positioned to interact with the TC and aid in extratropical transition. On the day prior to entering the study region, anomalously low geopotential heights associated with a trough are located over the Midwestern U.S. while a ridge, indicated by higher than normal heights, is positioned off the coast of Nova Scotia, Canada (Figure 3a). The anomalously low heights near Florida are associated with the TCs. The axis of the trough at 200 hPa is located approximately 10° west of the TC centers. On the day of landfall (Figure 3b), the trough and TC are no longer distinct features and the increasingly negative values indicate a deeper area of low pressure. The deepening of the trough and northward heat and momentum transfer to the right of the TC center strengthen the warm advection in the ridge, which also deepens. The phasing of the trough and TC are complete by the day after landfall (Figure 3c). The baroclinic conditions associated with the trough restructure most of the TCs into extratropical cyclones while accelerating motion [8,11]. However, the strengthening ridge located in an anomalous position farther north and east (Figure 3b,c) forces the systems to move north-northeast along the coastline of the U.S. rather than northeast and out to sea.
TCs in the current study have translational speeds that exceed the averages of 5.2 and 6 ms−1 for Atlantic Basin TCs as reported by [24,48]. The average translational speed of the 25 TCs (including Irene) as they entered the study region was 10 ms−1, while it was 16 ms−1 upon exit (Table 1). These values exceed the thresholds of 7.7, 8, and 10 ms−1 designated for fast-moving TCs from observational studies in the Atlantic Basin by [49,50,51], respectively. Only three TCs had lower translational speeds while exiting than upon entrance. A paired samples t-test showed that translational speed was significantly different from the time the storms entered the study area until the time they exited (t (25) = −4.581, p = 0.000). As previously mentioned, translational speed increases as TCs undergo ET [8,11]. Sixteen of the TCs in the study became extratropical, with fourteen of these occurring after 1899. Although the 1900 storm was extratropical as it entered the study region, the average storm was 26 h from extratropical designation upon entering the study region, which is about mid-way through the process according to the timeline established by [52]. As expected, the entrance speed was slower for storms that were further from completing their ET as confirmed by a Spearman’s rank correlation analysis (r = −0.651, n = 15, p = 0.009). Even though the TCs moved relatively quickly through the study region on average, they did so at a range of speeds (Table 2). When TCs move quickly through a region, rainfall totals should be lower than if a storm moves at a slower speed. The results of the correlation analysis between storm speed and rainfall amounts will be discussed in Section 3.3.
Before entering the study region, the 25 TCs came from points of origin spanning 70° of longitude. Hurricane Donna (1960) formed in the central Atlantic and made landfall over both The Bahamas and Florida before entering the study region (Figure 3). Five other TCs made landfall over The Bahamas, including Irene. Research by [53] suggests this is the most common track for TCs eventually making landfall over North Carolina. Six additional TCs in the current study formed west of and made landfall over Florida. Of the remaining 13 TCs, nine formed east of 60° west longitude in the main development region for the Atlantic Basin [54]. When examining year of formation, six of seven Florida landfalls occurred during 1858–1907, while five of six landfalls over The Bahamas occurred during 1960–2011. This difference over time in storm trajectory prior to entering the study region is statistically significant at the 95% confidence level as confirmed by a Mann−Whitney U test (p = 0.030). For all 25 TCs, significant correlations exist between year of formation and starting latitude and longitude with more recent storms forming farther east (r = 0.702, p = 0.000) and at lower latitudes (r = −0.541, p = 0.005). One explanation for this result is that since the mid-1960s, satellite images have helped in the identification of the origins of TCs in the central and eastern Atlantic [55,56]. However, previous research suggests that Atlantic Basin TC tracks do tend to cluster and shift over time [54,57,58,59,60] and evidence exists for TC activity shifting more towards the eastern Atlantic overall [56,61]. The finding that the point of origin for Irene-type TCs has shifted eastward and to lower latitude over time supports this previous research.

3.2. The Rainfall of Irene (2011)

When Irene entered the study region, it was 36 h from being declared a post-tropical cyclone and was moving slower than most of the other TCs in the study (Table 1). Irene began to experience changes to its structure due to ET as early as August 26, when the NHC reported that its wind field had broadened. Forecast discussions over the next two days [62] detailed an increase in translational speed, southwesterly vertical wind shear, and dry air entrainment. Irene made landfall as a Category 1 hurricane at Cape Lookout, North Carolina on August 27 at 1200 UTC. Landfalls at 0935 UTC near Atlantic City, NJ and at 1300 UTC near Coney Island, NY occurred on August 28 while Irene was a tropical storm. In the current study, daily rainfall was summed over 26–30 August.
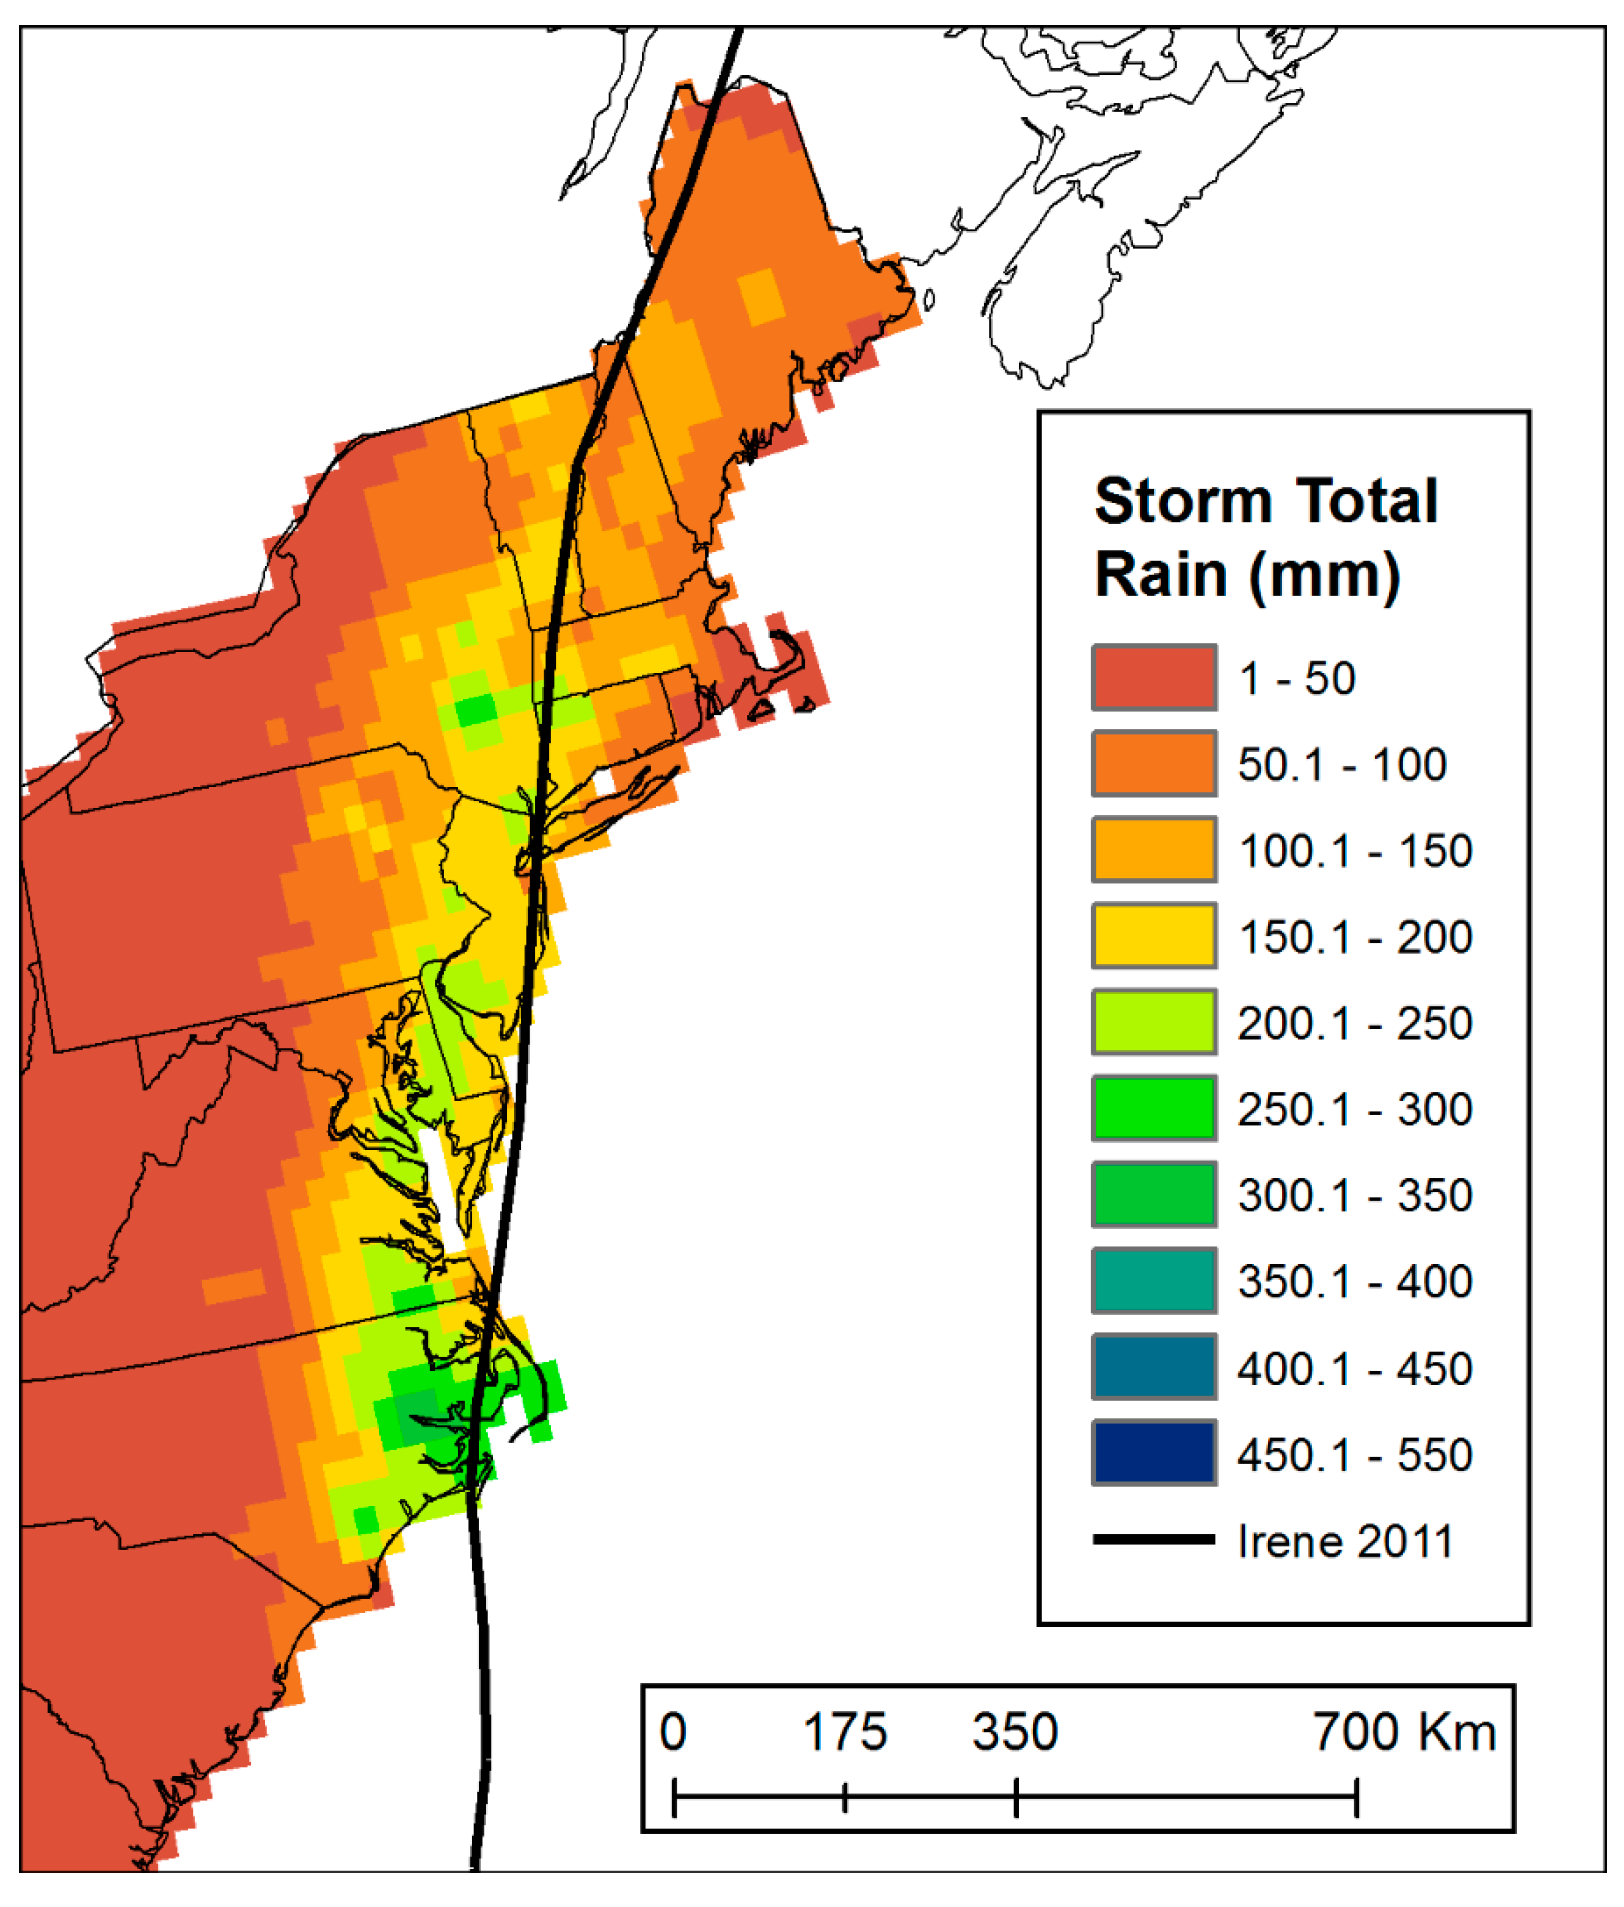
According to the UPD analysis (Figure 4), the maximum value for storm total rainfall was 325 mm (12.8 in.) located near Washington NC, approximately 35 km (one UPD grid cell) from Bayboro where the maximum rainfall amount of 393 mm (15.74 in.) occurred according to the NHC. A comparison with totals greater than 150 mm contained in the NHC report [3] showed that the UPD tended to underestimate storm total rainfall by 50–75 mm, but the locations of the higher amounts were consistent. Underestimation of rainfall by this interpolated and gridded dataset is expected and has been documented for TCs by Atallah et al. [6], yet these results suggest that the locations of the highest rainfall totals should be comparable across storms.
Rainfall totals exceeding 254 (125) mm in the UPD analysis occurred over approximately 2% (18%) of the study region. The top 10% of rainfall totals had a median value of 210 mm with a range of 139 mm (Table 2). The highest rainfall amounts occurred near the location of the North Carolina landfall (Figure 4), leading to a statistically significant negative correlation between latitude and rainfall totals (Table 3). However, nine states including Vermont and Massachusetts had at least one location receiving rainfall in the top 10% of highest values. Thus, high rainfall totals were not strictly confined to the region around the storm center at the time of landfall.
The next step was to measure the distance between the storm track and location of the center of each grid cell to better gauge the extent of areas that were affected by this storm. According to [45] the average TC making landfall along the East Coast produces rainfall totaling 12.5 mm or more out to 222 km on the left side of the storm track. The current study finds that Irene produced 12.5 mm or more of rainfall over regions 250 km left of the storm track near the point of landfall, expanding up to 330 km as the storm tracked north. For high rainfall totals in Irene, the median (maximum) distance between high rainfall location and the nearest point along the storm track was 79 (163) km (Table 2). The Spearman’s rank correlation coefficient calculated between the amount of rainfall and distance from the storm track indicates that the higher of the top 10% of rainfall totals occurred closer to the track than the lower of the top 10% values (Table 2). The correlation coefficient value that is close to zero for the analysis between distance of high rainfall from track and latitude (Table 3) indicates that the regions within Irene’s rain field producing high rain rates were neither expanding nor contracting as Irene tracked northward, which is contrary to the expanding trend of the edge of the rainfall swath. To further explore the orientation of the high rainfall points, an ellipse was constructed in the GIS that encompassed the top 10% values. The direction of its main axis was parallel to the storm track, confirming that high rain rates were neither expanding nor contracting.

3.3. Rainfall Distribution of Modern Storms

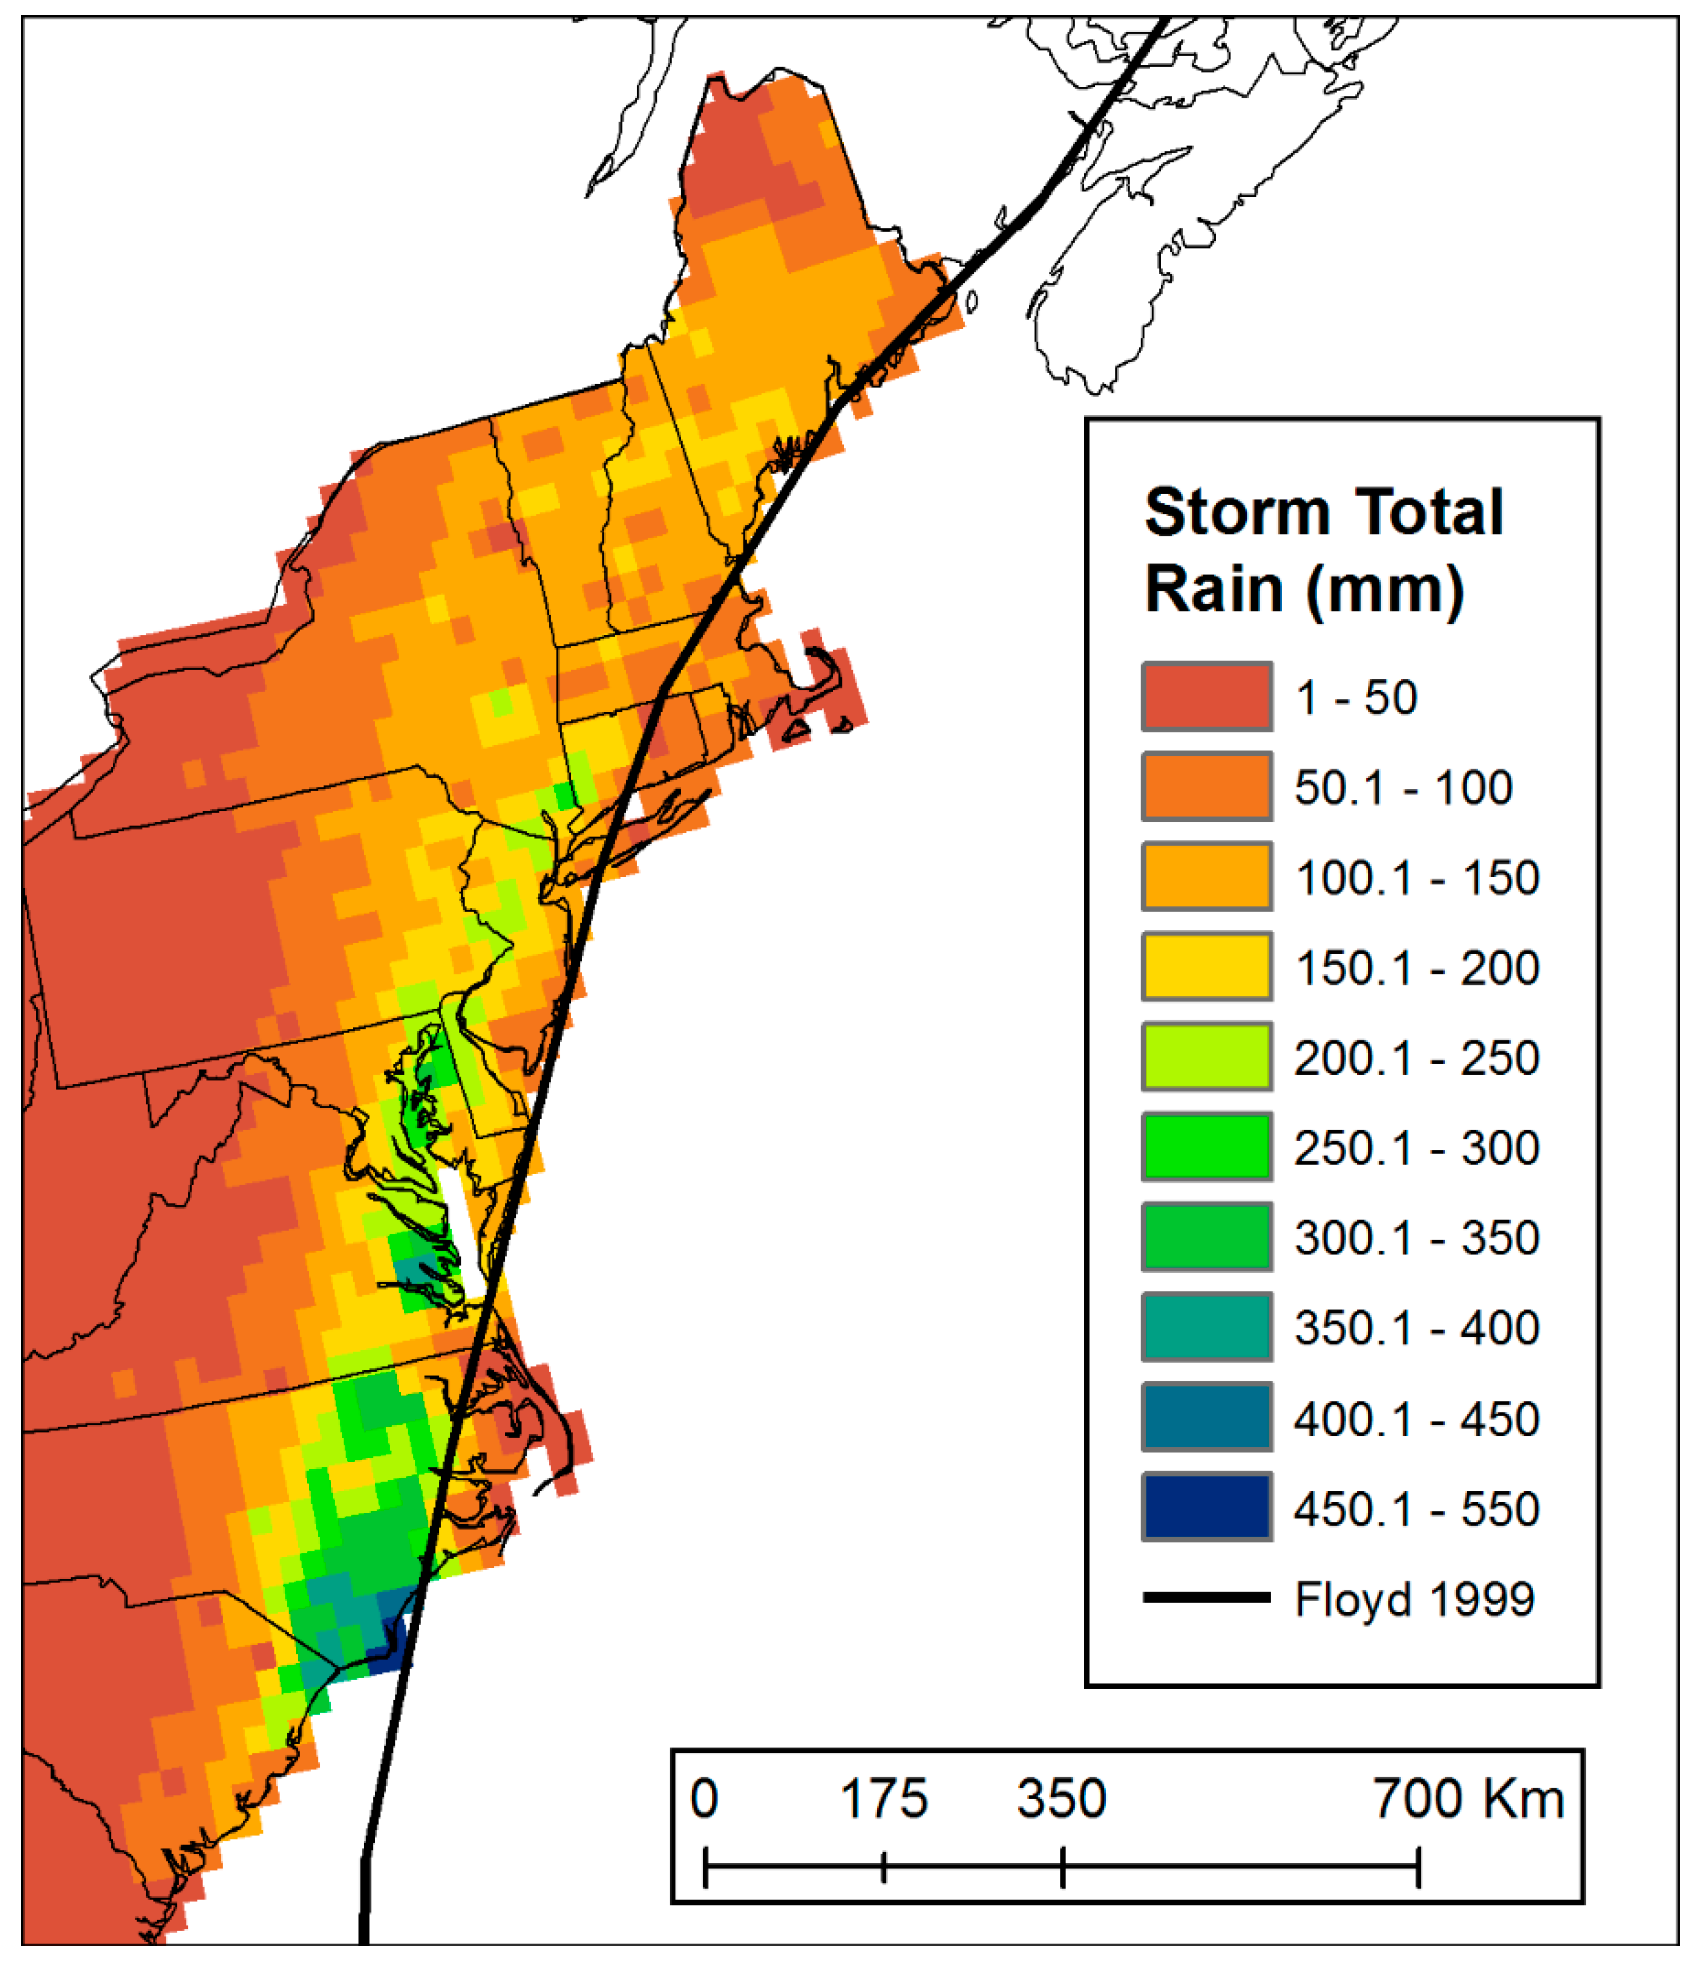
Hurricane Floyd (Figure 5) produced the highest rainfall amount when the entire volume in the domain is considered, as well as the highest mean and maximum values when only the top 10% of rainfall values left of track are considered (Table 2). Floyd also had the rainfall distribution most similar to that of Irene. When comparing the amount of the top 10% of rainfall totals over the study area for all storms, Floyd ranks first in terms of the median, maximum, and range of these high rainfall values, while Irene ranks second (Table 2). Despite having a relatively fast translational speed averaging 10 ms−1 as it tracked over the study region, Floyd produced more than 300 mm of rainfall over an area measuring approximately 26,082 km2. By comparison, the translational speed of Irene ranged from 6.7–16.5 ms−1 as it tracked over land and it produced >300 mm of rainfall over only approximately 3726 km2 of the study area. As with Irene, Floyd’s highest rainfall occurred near the location of its North Carolina landfall. Floyd and Irene were similar when comparing the median and maximum distance between the storm track and locations of the top 10% of rainfall totals on the left side of the storm track; 10 km or less separated their values in these categories (Table 2).
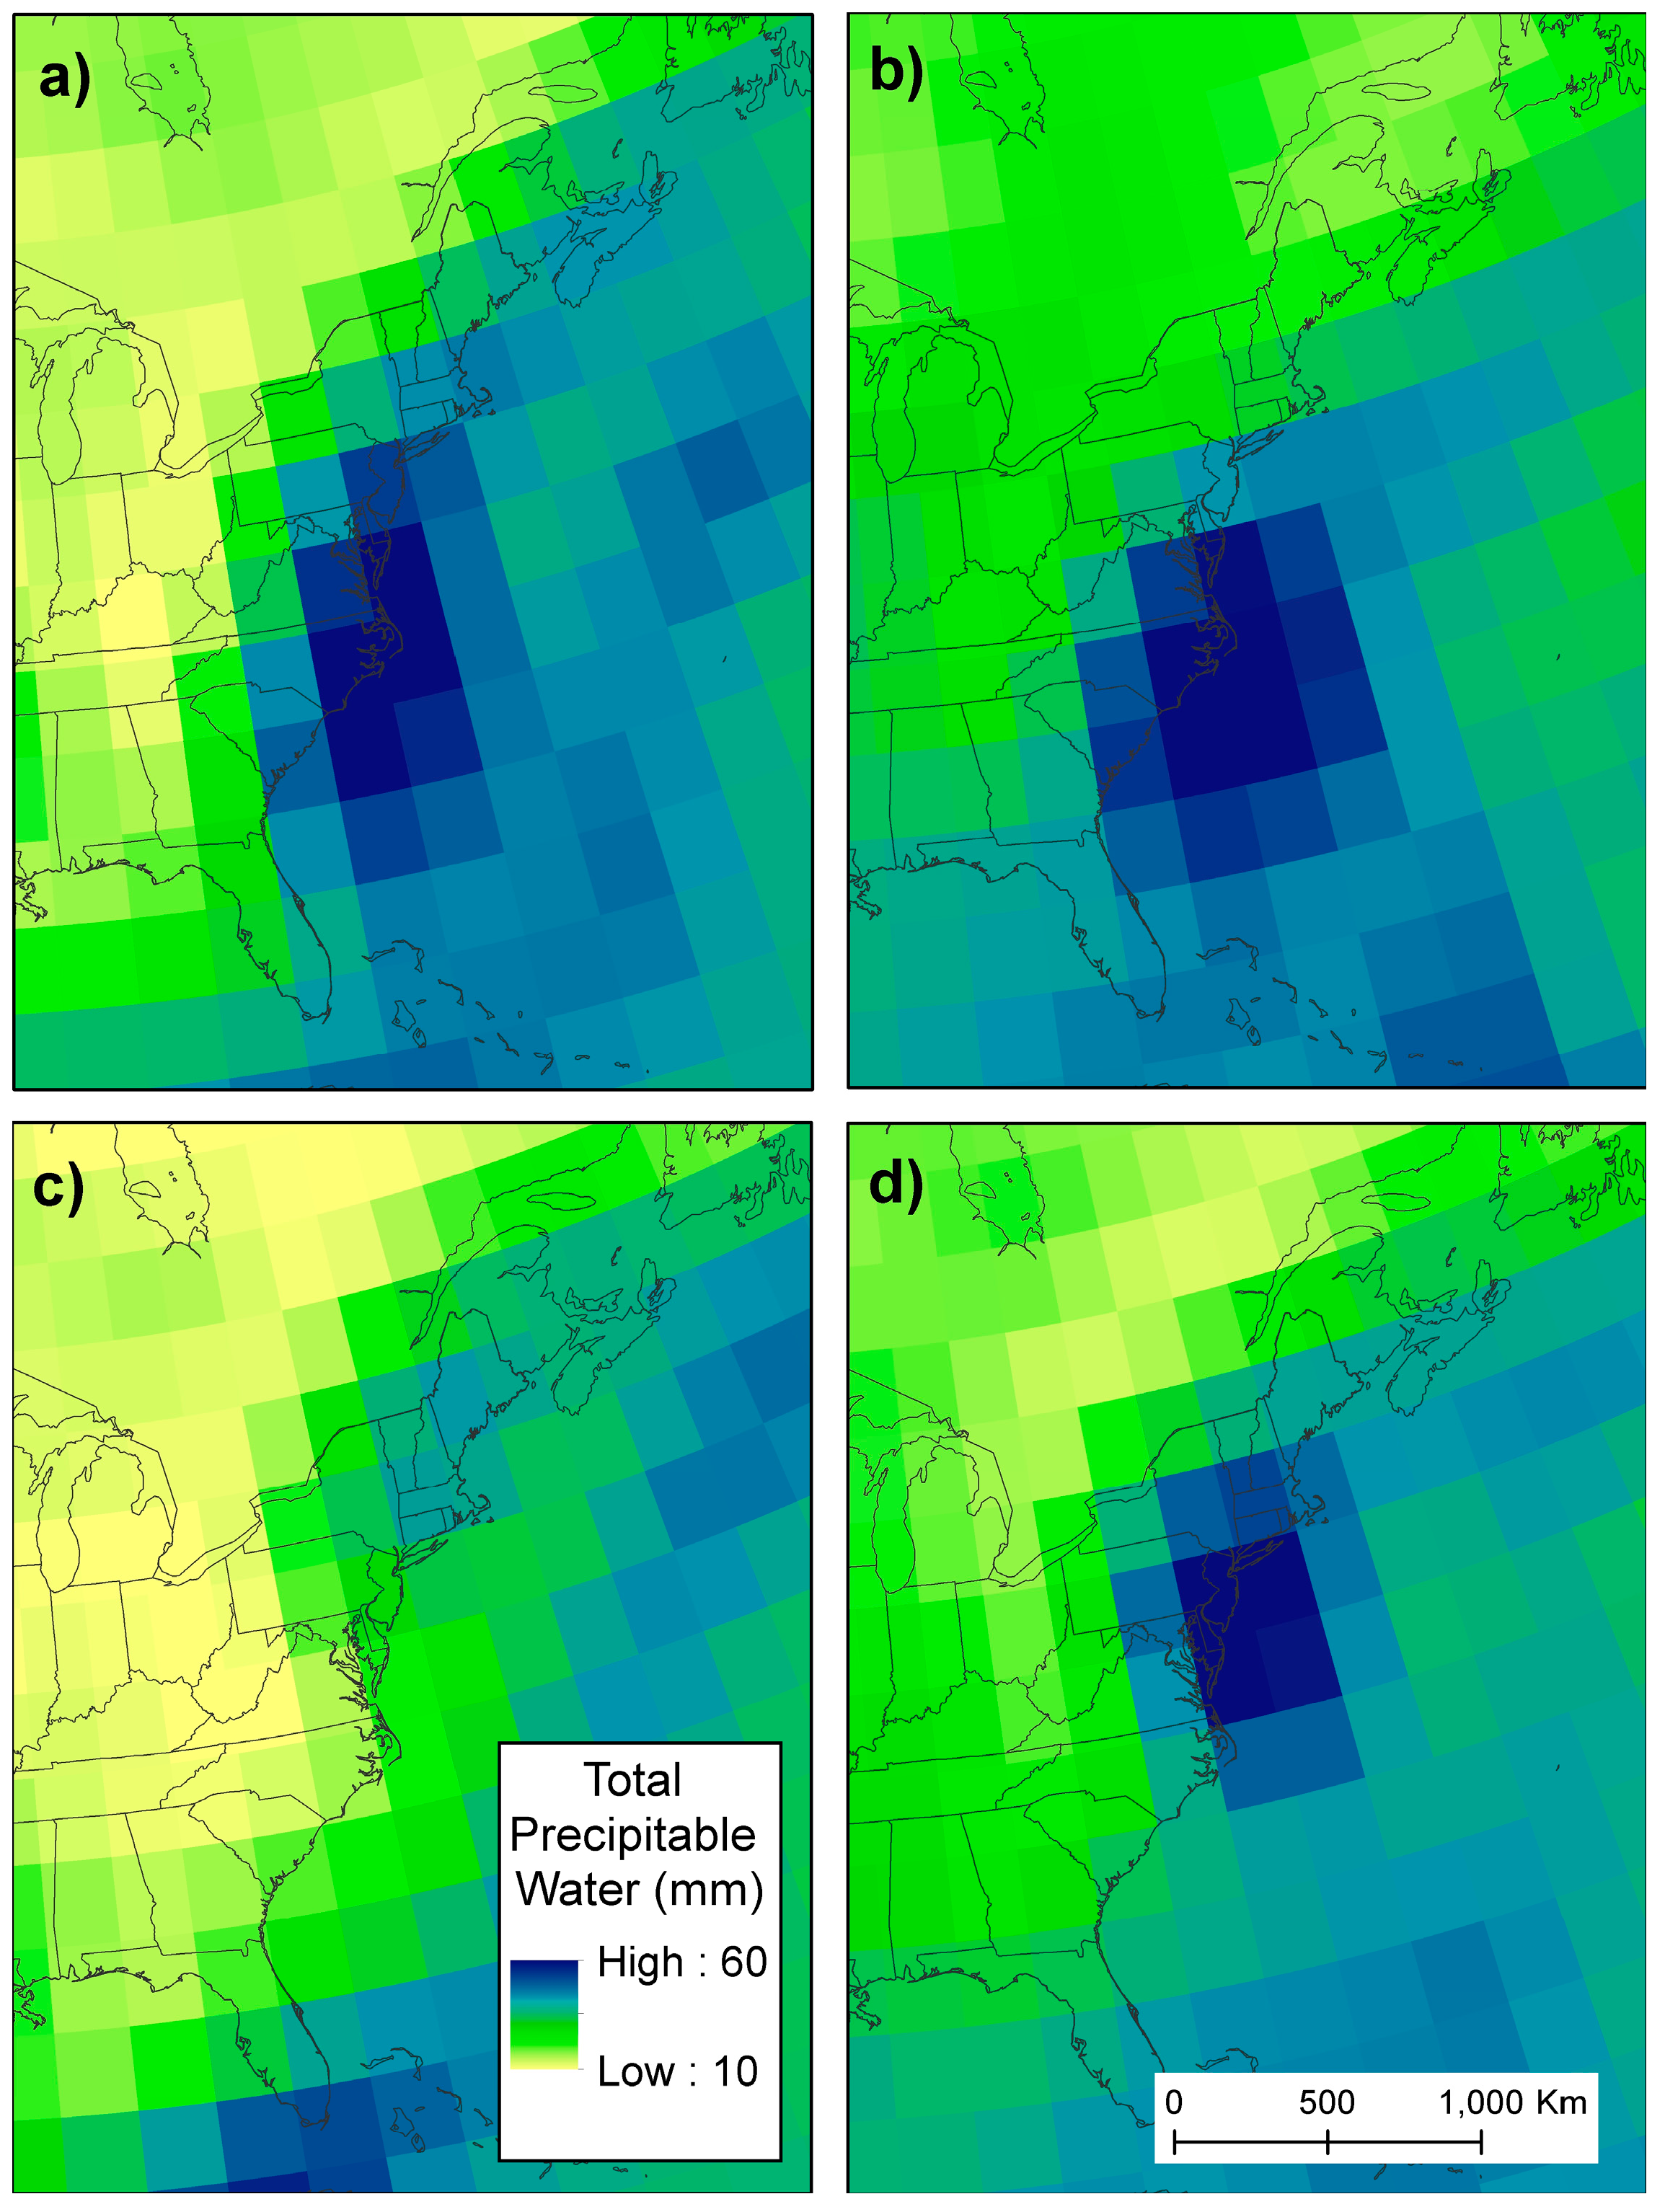
The synoptic-scale influences on the precipitation produced by Floyd have been well-documented in the literature, including the position of the frontal boundary and location of highest rain rates just west of this boundary [6,7,63,64,65]. When comparing precipitable water values obtained from the NCEP/NCAR Reanalysis [46] on the day of landfall for Irene and Floyd, a gradient in values ranging from 63 through 44 to 21 mm left of track over North Carolina existed for Floyd (Figure 6a). In the same locations, values for Irene only decreased from 67 through 51 to 33 mm (Figure 6b). The steeper gradient for Floyd likely promoted stronger isentropic ascent of tropical moisture leading to the higher rainfall totals produced by Floyd over North Carolina as compared to Irene. When inspecting the rainfall totals near southeastern New York, southern Vermont, and western Massachusetts, it can be seen that Irene produced higher amounts relative to Floyd by more than 50 mm. These are the areas where extensive flooding occurred after Irene. Recent work by [5] shows that the flooding caused by Irene in this region was 2–3 times larger than the 10-year peak flood. A comparison of precipitable water values when both TCs were located near this area (Figure 6c,d) shows that values for Irene exceeded 50 mm (Figure 6d) while those for Floyd approximated 40 mm. This finding supports previous research showing that higher amounts of moisture in the environment surrounding a TC can lead to a larger storm with more wide-spread rainfall [30,31,32,33,34,66].
The spatial distribution of the top 10% of rainfall totals varied among the eleven TCs. With a median (maximum) distance to track of 77 (152) km, Hanna was similar to Irene for these metrics, but Hanna produced only half of the rainfall of Irene (Table 2). Gloria had the largest median distance between high rainfall and track, while Bertha produced its highest rainfall totals much closer to the track than the rest of the TCs. Carol and the unnamed storm of 1961 had large distances between the storm track and high rainfall amounts, but these rainfall amounts were fairly low when compared to those of other TCs. Thus, the notion that TCs following similar trajectories may produce similar rainfall patterns is not supported by these observations.
Not all TCs undergoing ET produce the same spatial patterns of rainfall, as indicated by the difference in correlation coefficient values between rainfall totals, distance to track, and latitude (Table 2). As discussed previously, Irene had a high negative correlation with latitude meaning that the highest rainfall totals occurred in the southern part of the study region, and this relationship occurred for Floyd, Bertha, Gloria, and Carol (Table 3). These higher rainfall totals in the southern part of the study region could be due to a combination of increased available moisture in the more equatorward portion of the study region and a slower trajectory so that rainfall occurred for a longer duration. These cases support the inland decay component of the R-CLIPER model, which was developed using only TCs of hurricane intensity. However, three of eight hurricanes did not follow the assumption of a decay of highest rain rates after landfall, further demonstrating that even though these TCs were experiencing similar dynamical conditions, they did not produce similar rainfall patterns on the left side of the storm track. Therefore, this study rejects the hypothesis that all TCs following a track similar to that of Irene will produce similar spatial patterns of rainfall.
Correlations between the distance from the track of the high rainfall totals, rather than the actual amounts, and latitude provide a measure of rain field expansion or contraction as the TCs move with a dominant northward component to their track. TCs that are transitioning into extratropical cyclones are expected to exhibit an expansion in or dispersion of their rain fields [6,13,45], although the increase in translational speed during the process may lower the rainfall totals received as the storm moves inland. Significant positive coefficients indicate expansion for Floyd, Bertha, Gloria, Unnamed, and Carol. Contraction is indicated for Belle, a TC that did not become extratropical. However, Irene did not produce high rainfall totals that expanded or contracted relative to the track’s location even though it was at a similar stage in the ET process as Bertha and exhibited a similar increase in speed as it tracked across the study region.
The amount and spatial distribution of moisture differs among the TCs and exhibits strong relationships with rainfall production. Five TCs had closed regions of 55 mm of TPW, while four had closed regions of only 45 mm of TPW (Table 4). The value of the highest closed region of TPW has statistically significant relationships with the median and minimum rainfall values as a larger moisture supply facilitates higher rain rates (Table 5). Higher regions of TPW also correspond to the top 10% of rainfall values being located closer to the storm track. This occurs because the regions of highest TPW are located mainly to the right of the storm track over water where rainfall totals are not available in the UPD. Thus, the regions of highest TPW left of the track occur close to the storm track and do not spread far westward. This explanation is supported by the finding that the zonal extent of the 45 mm TPW contour was also positively correlated with rainfall amounts, and negatively with the distance of the maximum rainfall amount from the storm track. Thus, a larger zonal extent of 45 mm TPW equated to higher rainfall amounts overall, with the highest rainfall values being located closer to the storm track. In the case of Irene, the edge of the 55 mm TPW contour averaged 130 km from the storm track on the left side, and 320 km on the right side. This ratio of approximately 25% of the highest TPW region being left of the storm track occurred in all but three cases and is likely due to the positioning of the TC relative to the middle latitude circulation features that are influencing storm structure. Although it only displays the edge of the 45 mm contour, the general pattern of higher TPW values extending farther over water than inland is visible in Figure 7.
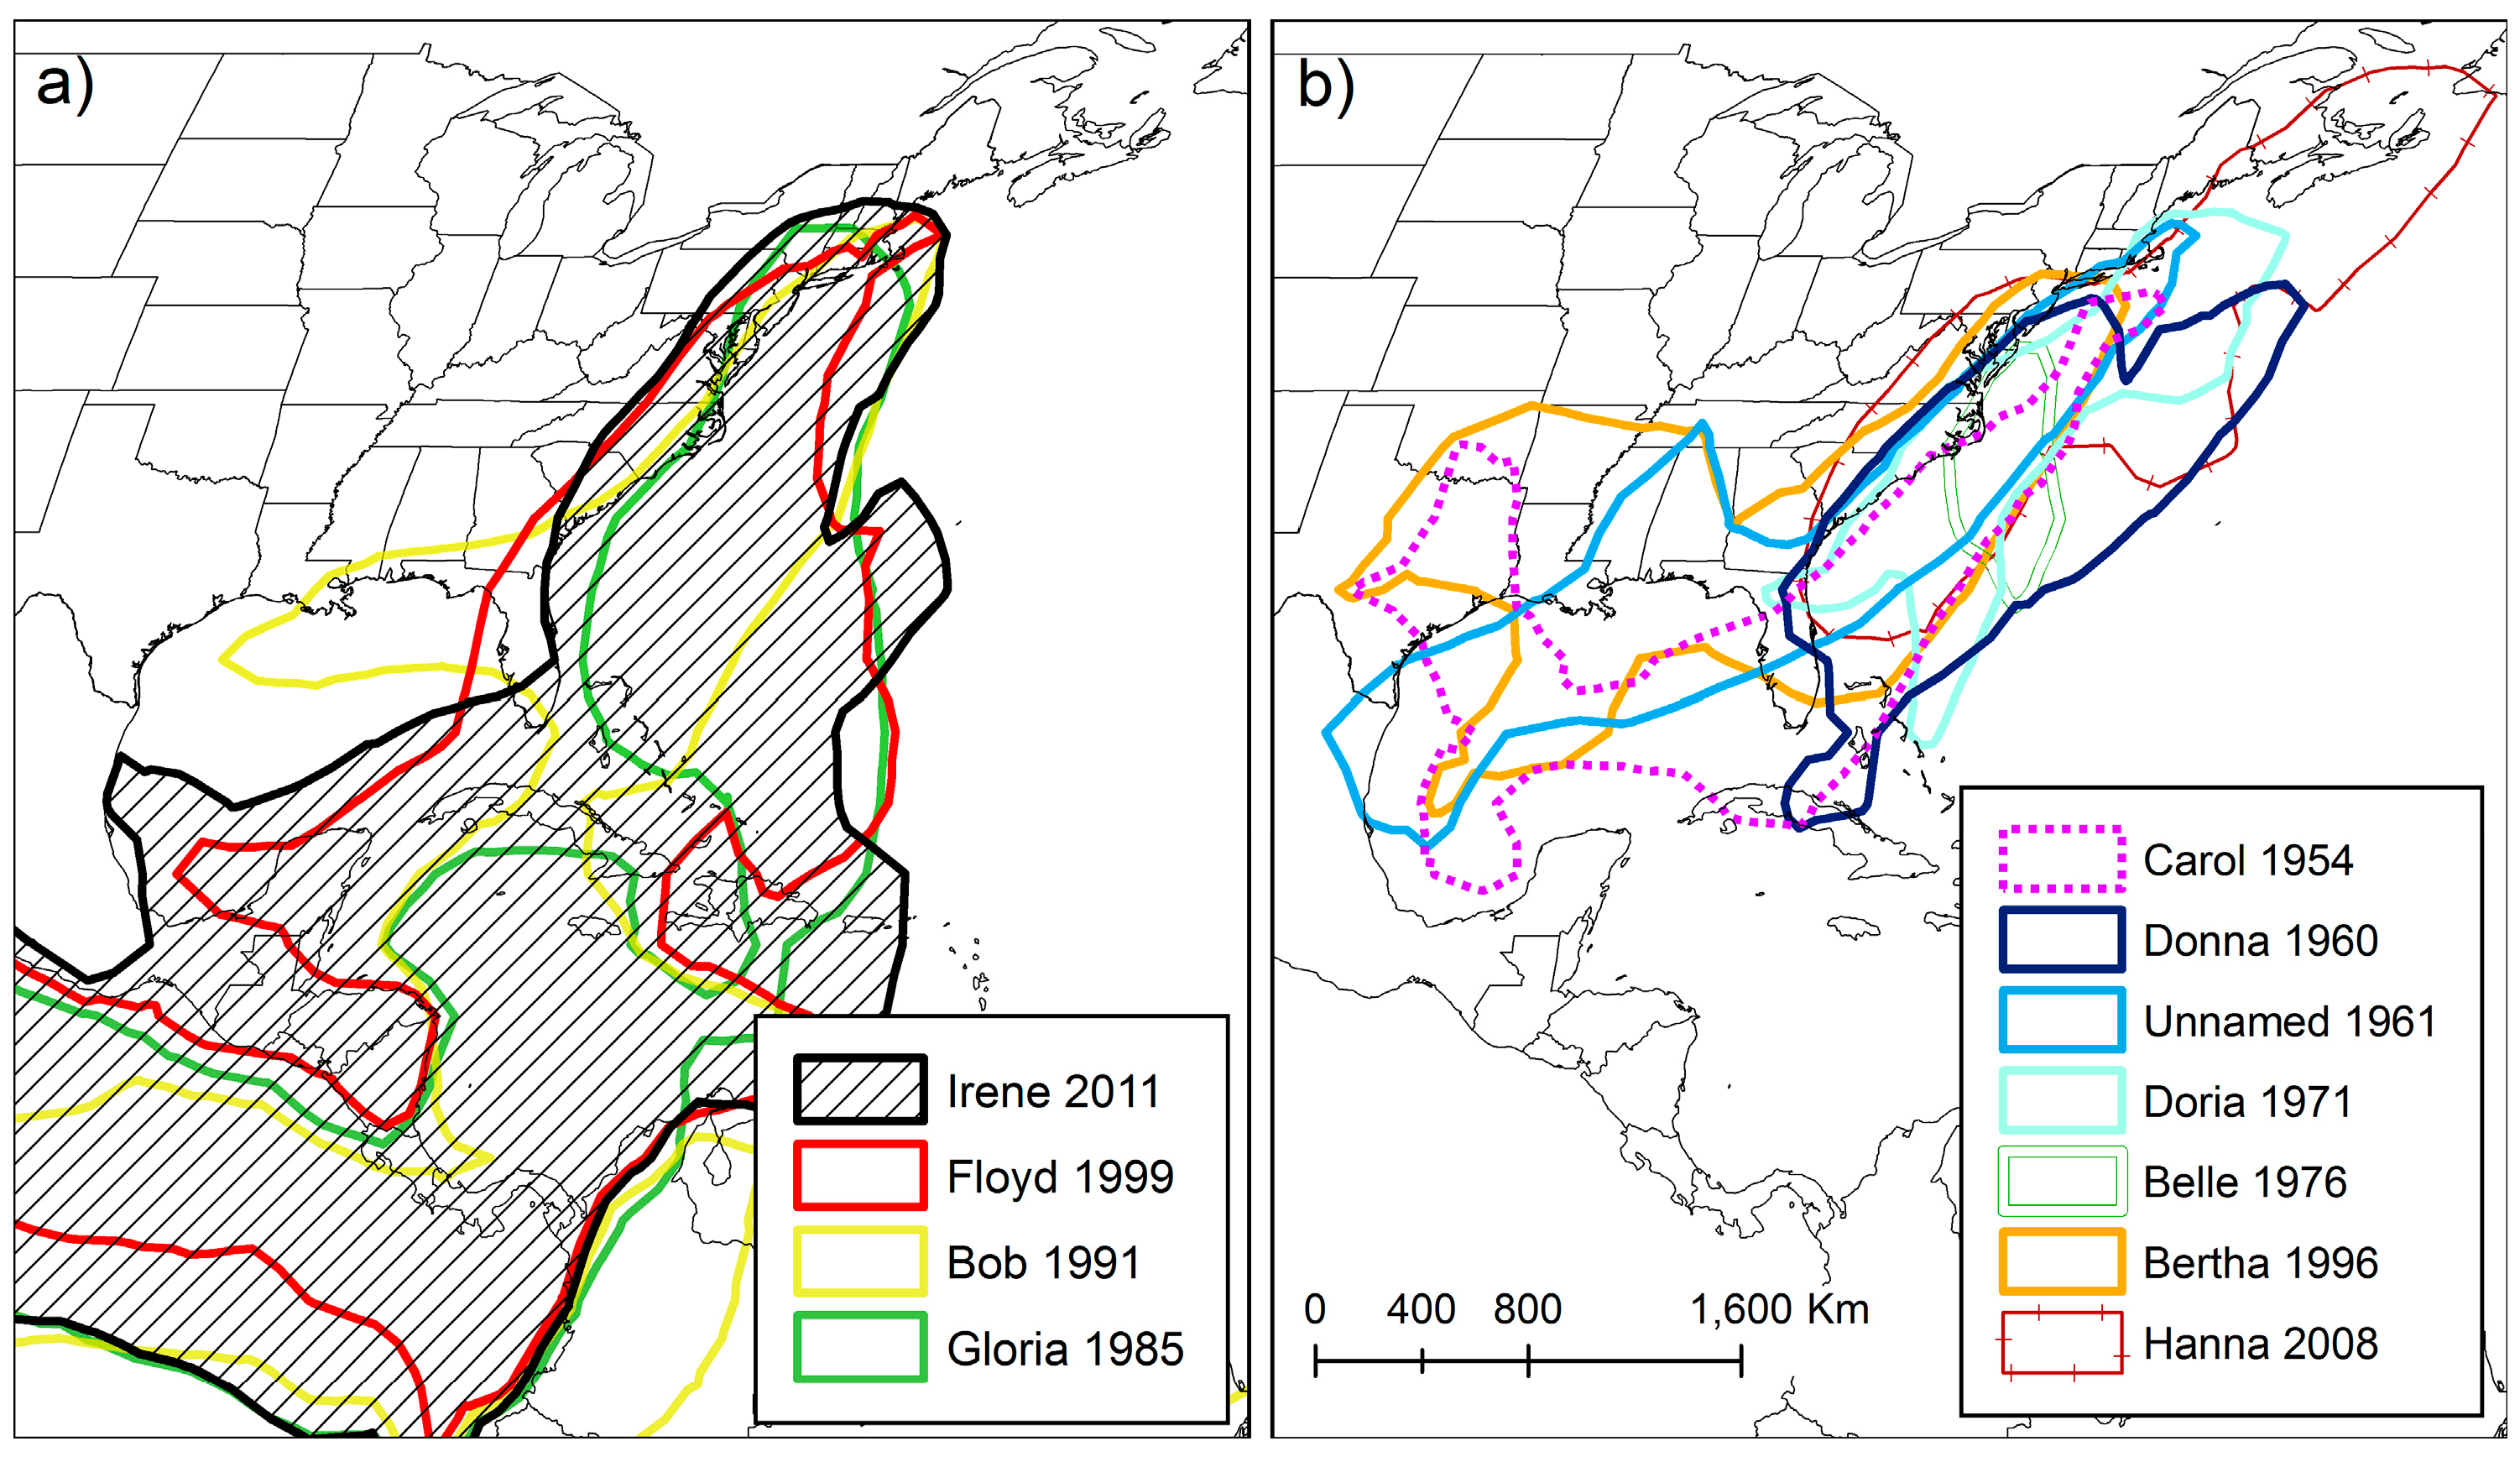
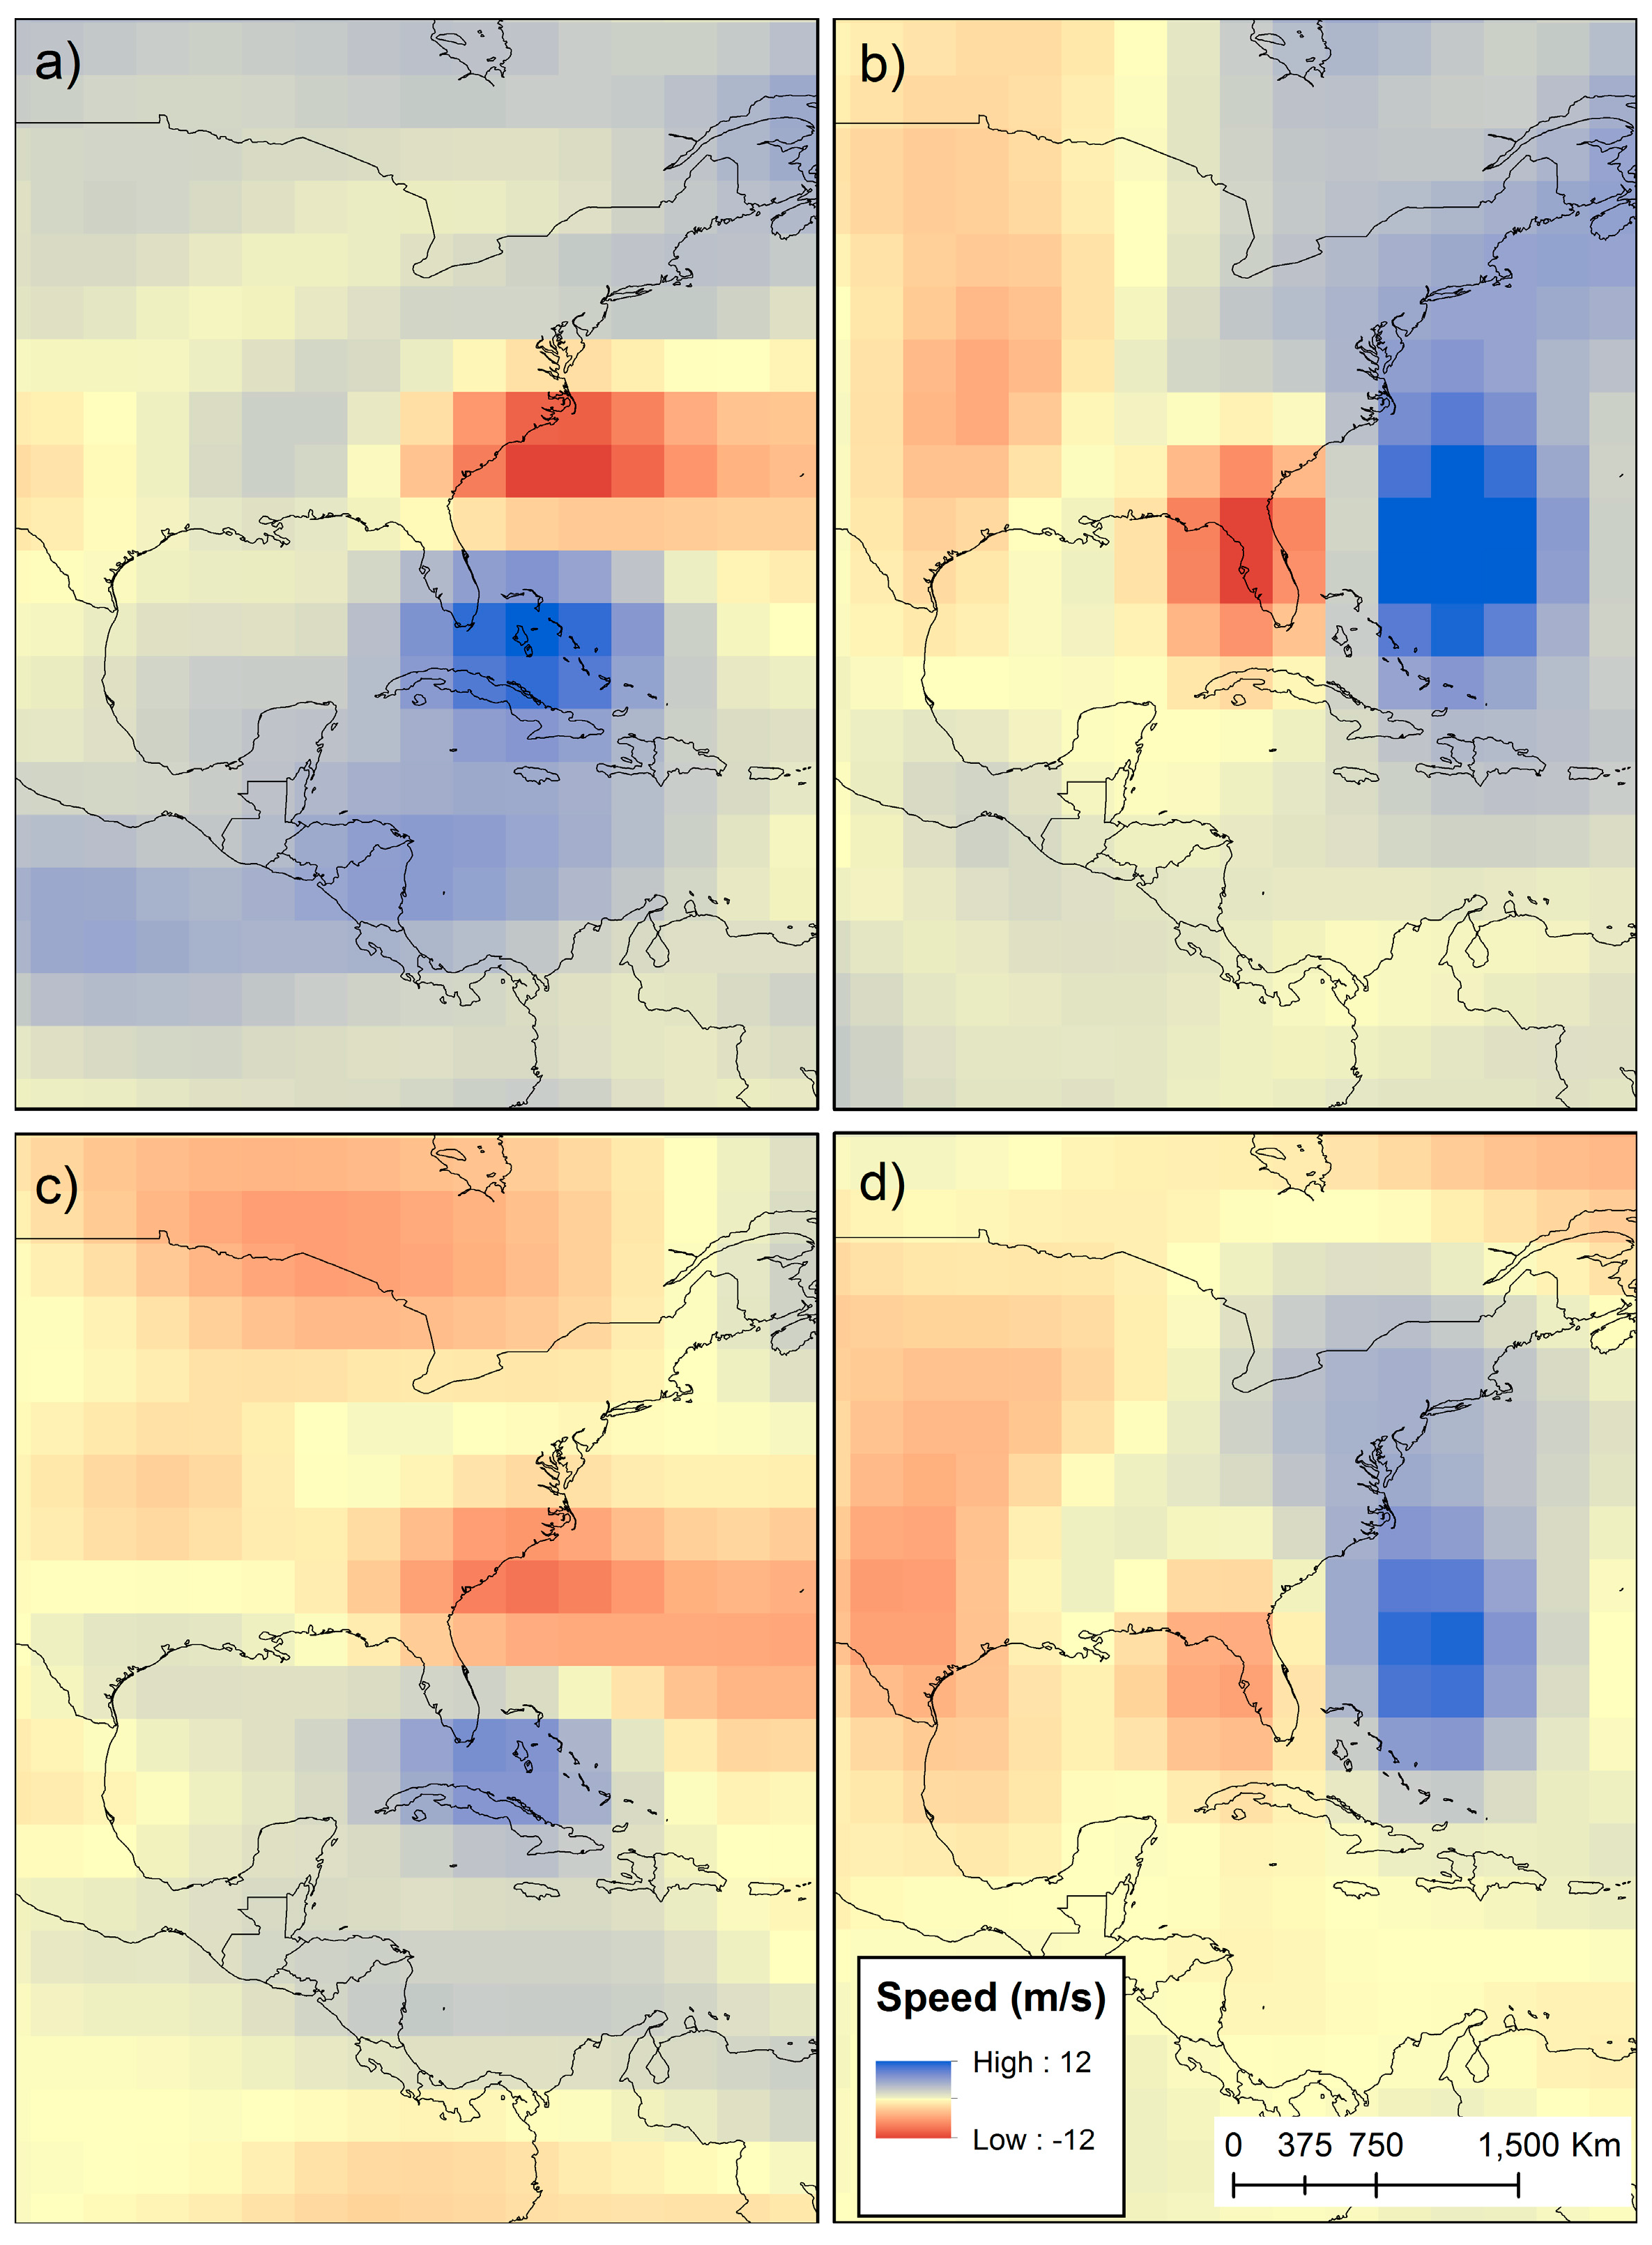
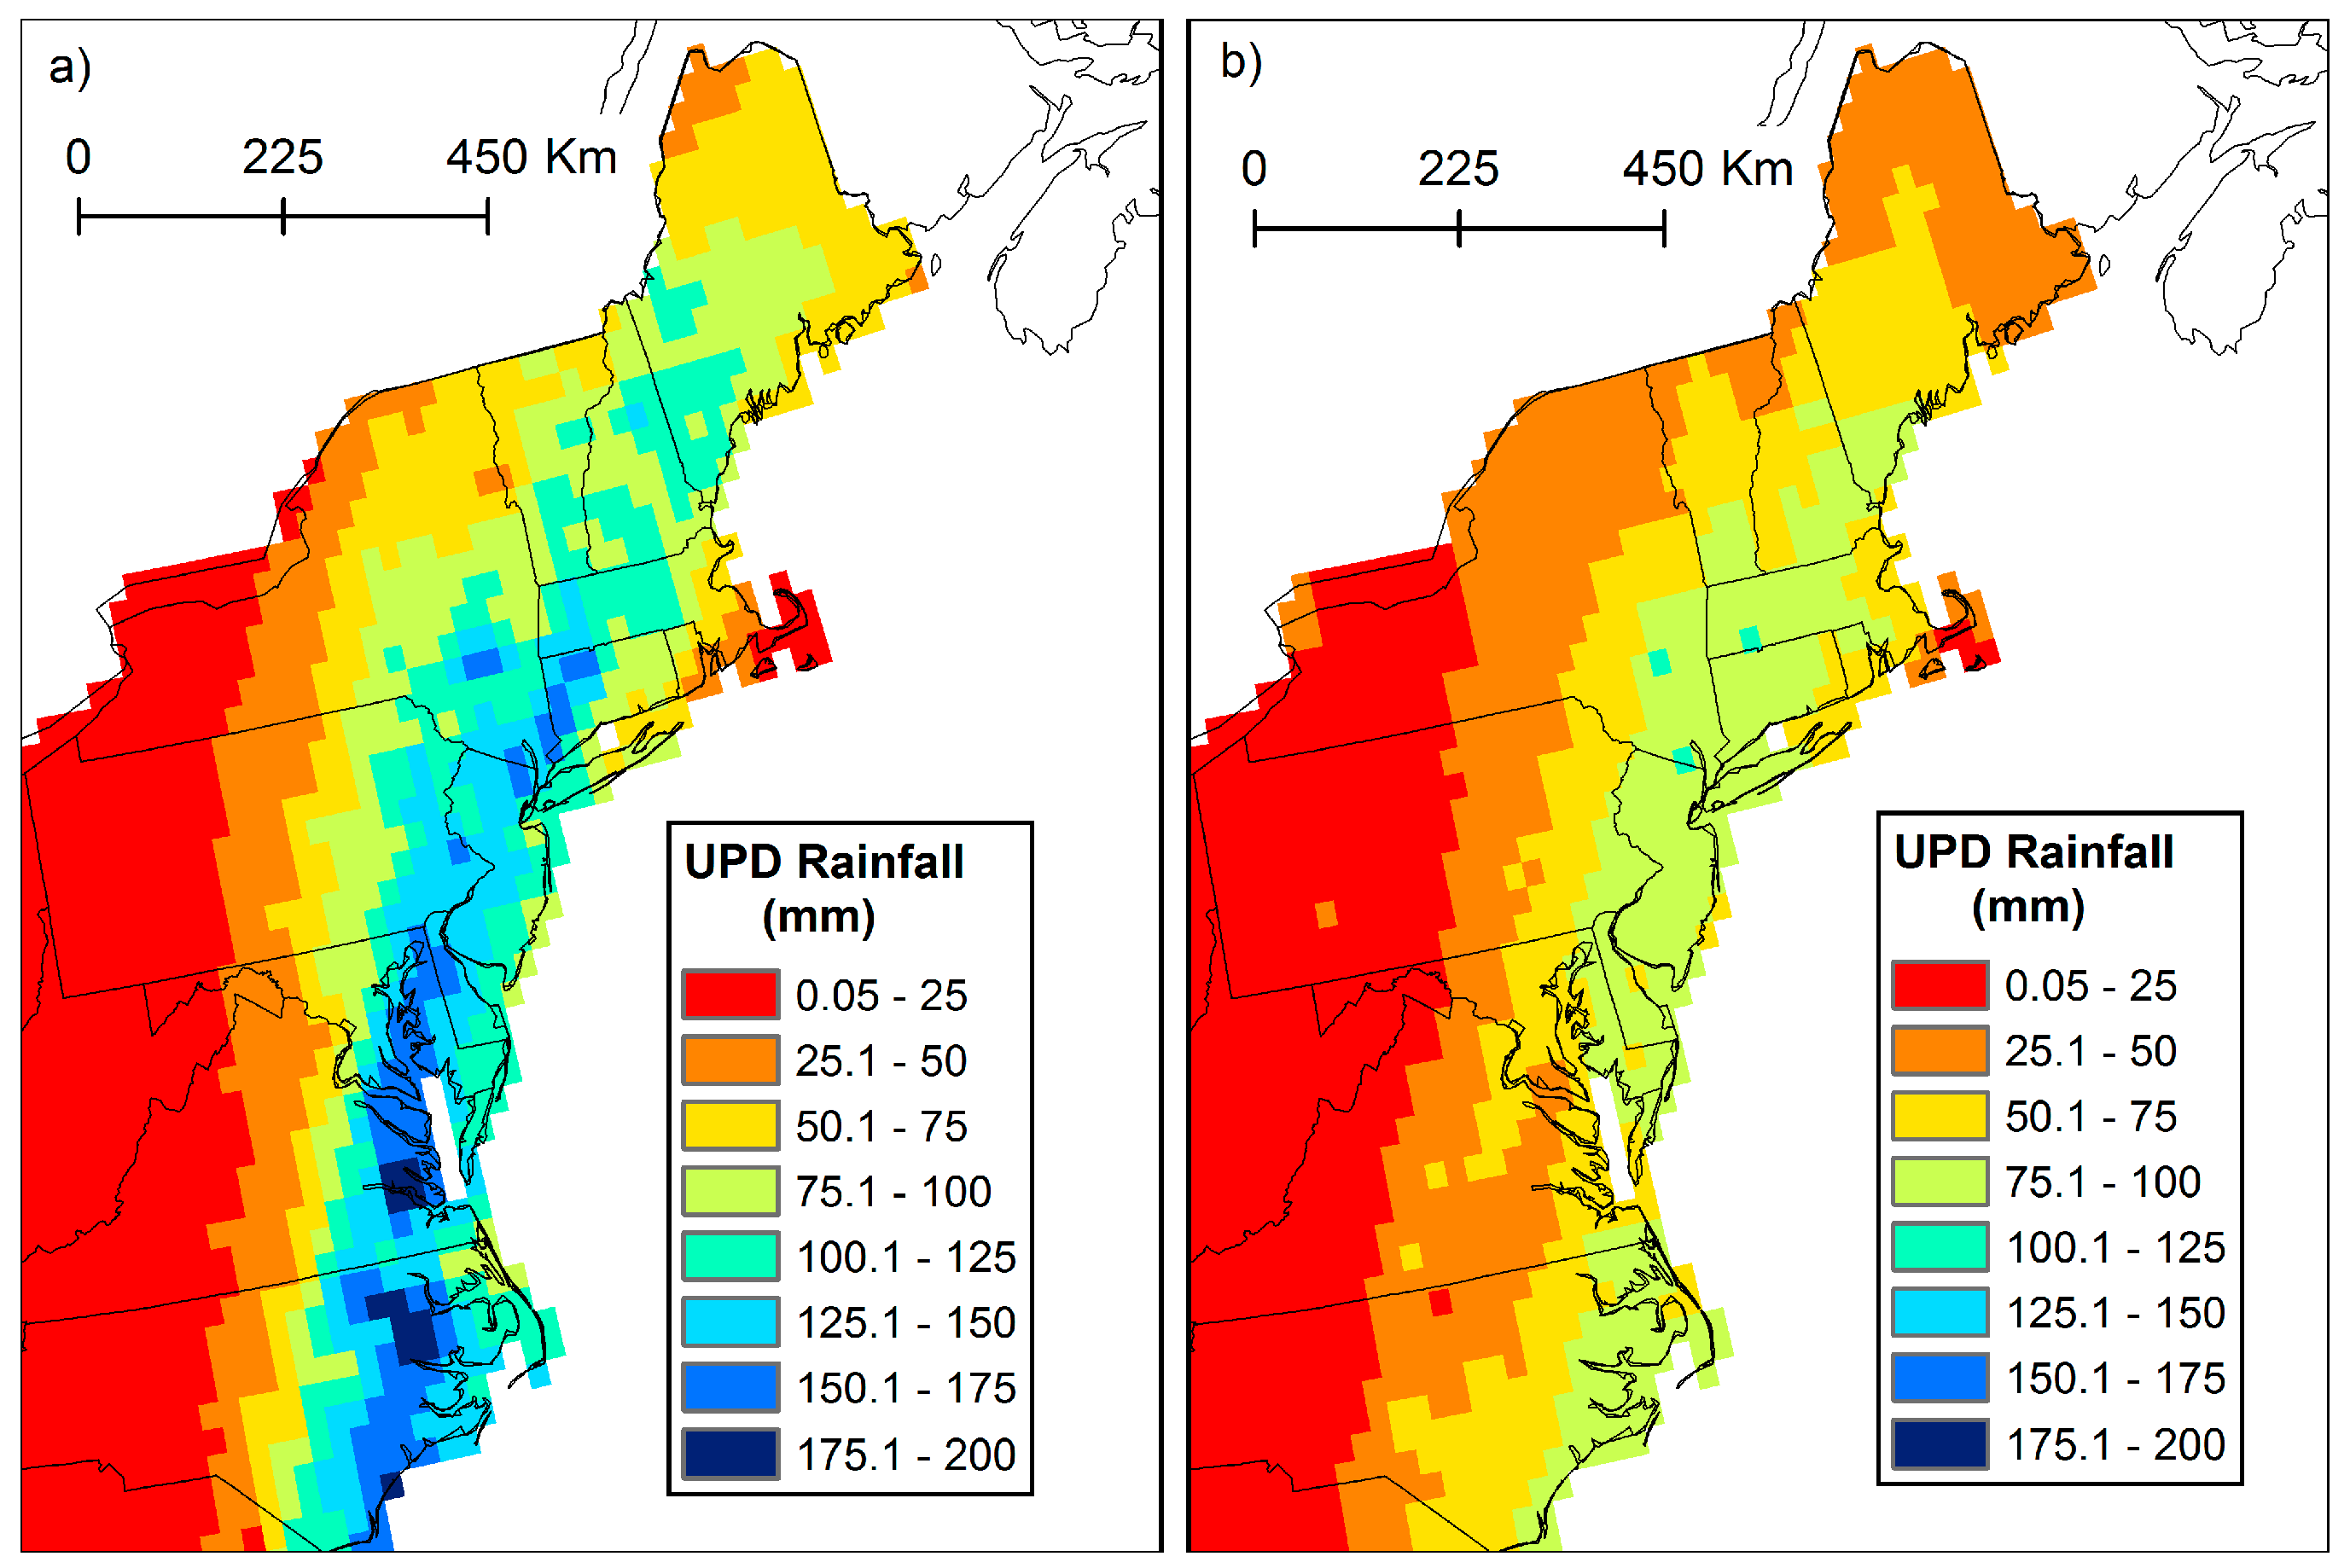
A large difference between TCs that produced higher and lower rainfall values was the meridional extent of the 45 mm TPW contour (Table 4). Irene, Floyd, Bob, and Gloria had 45 mm TPW values that were connected to the deep tropics, extending across Central America and into the Pacific Ocean south of 5° N (Figure 7a). Thus, the meridional extent of 45 mm of TPW for these TCs exceeded 4600 km. In contrast, the remaining TCs had measurements less than 2900 km extending to a maximum southern latitude of approximately 20° N. When examining zonal and meridional winds at 850 hPa, stronger westerly flow is observed across Central America when the four TCs in Figure 7a are averaged together on the day before entering the study region. Westerly winds exceed 5 ms−1 for these TCs (Figure 8a), while the average in this region for the seven TCs in Figure 7b is only 1.5 ms−1 (Figure 8c). Stronger southerly winds occur over Hispaniola in Figure 8b (3.6 ms−1) as opposed to Figure 8d (1.2 ms−1). This strong westerly then southwesterly flow supports the advection of moisture from the deep tropics into the TCs in Figure 7a. When TCs produce high amounts of precipitation, the moisture lost must be replenished for high rates of rainfall production to continue. As air masses in the middle latitudes tend to be less moist in general than those in the deep tropics, the connection to a source of tropical moisture is important to maintain rainfall production as TCs move through the middle latitudes. This observational study supports the modeling work of Takakura et al. [67] who showed water vapor and latent heat fluxes into Typhoon Man-yi via a moisture conveyor belt originating from a latitude of 10° N as the storm center crossed 30° N. As expected, the four TCs with a connection to moisture from the deep tropics produced higher rainfall totals on average (Figure 9a) when compared to the 7 TCs that had a lesser meridional extent of 45 mm of TPW (Figure 9b). East of 78° W, the only locations receiving more rainfall from storms in Figure 7b than those in Figure 7a are in Rhode Island and southeastern Massachusetts.
These results collectively show that the role of moisture is an important consideration in the amount of rainfall that a TC can produce. Trenberth and Fasullo [37] reported that TCs can import environmental moisture into their circulations out to a radius four times their wind circulation. In studies of TCs around the globe, previous researchers have found that TCs tend to be embedded within TPW values greater than 40 mm [68,69,70,71]. When investigating the connection between TPW and storm-total rainfall for Atlantic basin TCs, Hernández-Ayala and Matyas [72] found that the highest amounts of storm-total rainfall occurred over Puerto Rico when TPW values exceeded 46 mm, and Konrad and Perry [9] identified 51 mm as a key threshold for high TC rainfall totals over the Carolinas. The results of the current study support this previous work while also highlighting the importance of considering the spatial distribution of the moisture, particularly its meridional extent, as TCs track through the middle latitudes.
It is important to note that only the amount and meridional and zonal measures of moisture produced statistically significant correlations with rainfall amounts and distance from the storm track at the 95% confidence level (Table 5). A faster-moving TC is likely to produce less rainfall over a given point, and this negative relationship is evident in this study’s results, but the correlations are not strong enough to be statistically significant. Correlation coefficients are higher between entrance speed and rainfall amounts and distance to track than with exit speed, likely due to TCs producing higher rain rates upon entering the study region. Intensity at landfall and the number of hours between the time of landfall and time that a TC was declared extratropical exhibited weak correlations with rainfall. These results again point to the importance of including moisture when predicting TC rainfall spatial distribution and totals, as suggested by previous researchers.
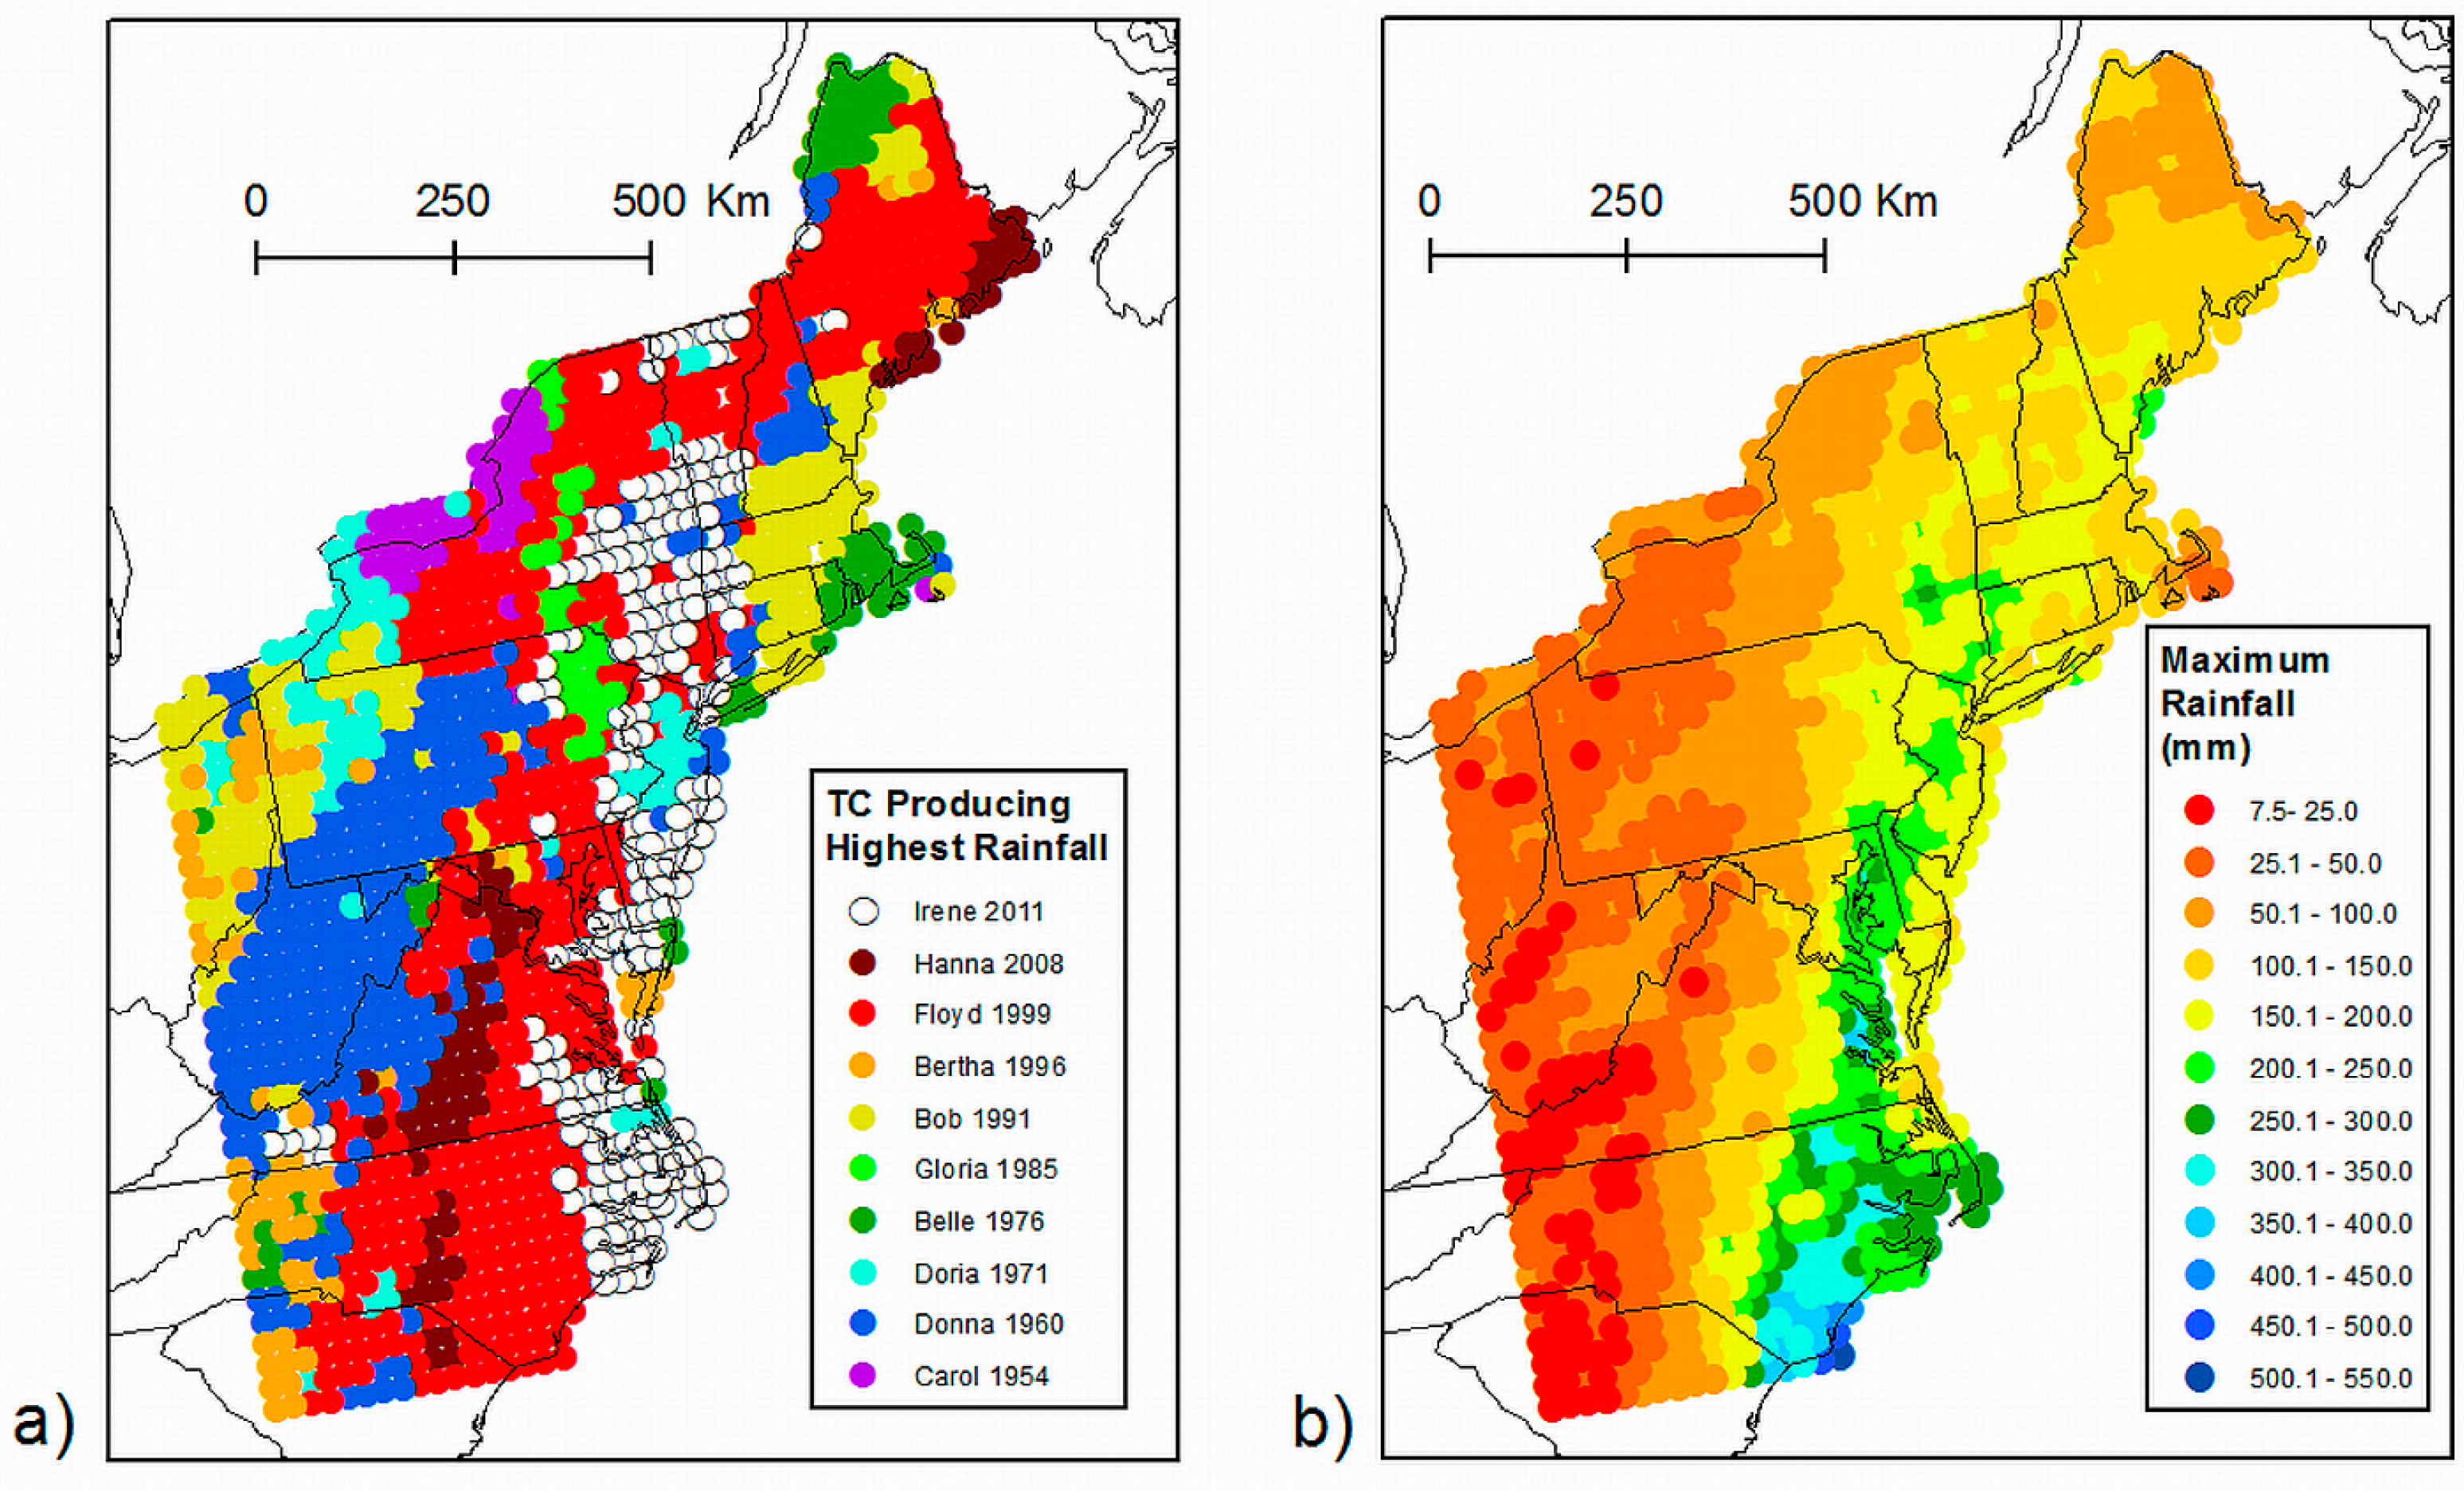
Given the high rainfall totals that produced flooding across North Carolina [5,73] and relatively wide swath of >100 mm totals in Virginia, Pennsylvania, and New York (Figure 5), it is not surprising that Floyd produced the highest rainfall at one third of the 1477 grid cells (Figure 10a). Although Donna produced the highest rainfall over 17% of the study region, these were mainly lower rainfall totals under 100 mm located in West Virginia and central Pennsylvania (Figure 10b). Irene produced the highest rainfall over 12% of the study region, including in many coastal locations where rainfall totals exceeded 200 mm as well as eastern New York and Vermont. If the study region is reduced to the 765 grid cells receiving 100 mm or more of rainfall, then Floyd and Irene contribute 41% and 27%, respectively. Overall, 14% of the study region has received at least 200 mm of rainfall from a TC with an Irene-like track since 1948 (Figure 10b), and parts of eleven states are included in this area.
These results should be taken into consideration when planning for TC-associated rainfall events in the northeastern United States. Tropical cyclones have produced floods that exceed the 10-year flood peak along much of the U.S. east of the Appalachian Mountains [5]. The current study found that the highest rainfall totals tend to occur on average 75–125 km away from the storm track on the left side, with the farthest distances ranging 150–230 km from the track. Therefore, communities located within 250 km west of the projected storm track should be prepared to receive high rainfall totals. The amount of moisture available plays a large role in determining the maximum potential for rainfall [66], and models predicting future climate conditions suggest that increased moisture will be available to be converged into a TC to increase rain rates both near to and more than 200 km from the storm center [74,75]. Thus, higher rainfall totals than produced by Irene or Floyd could be experienced in the study region, prompting flooding and associated destruction to occur over a larger area.

4. Conclusions and Future Research

This study identified tropical cyclones that took similar tracks to that of Hurricane Irene (2011) over the eastern U.S. and explored the spatial variability in their rainfall patterns. Storm motion and point of formation were explored for 25 TCs from 1858–2016. The National Centers for Environmental Prediction–Climate Prediction Center Unified Precipitation Dataset was analyzed within a GIS to calculate storm-total rainfall for 11 TCs occurring post-1948. For all 11 TCs, the spatial attributes of the top 10% of rainfall totals on the left side of the storm track were compared and the storm producing the highest rainfall total at each of 1477 grid points over the study region was identified. Relationships between rainfall amounts and their spatial distributions and moisture, storm speed, intensity, and time until the completion of an ET were explored using Spearman’s Rank correlation coefficients.
TCs with tracks similar to Irene tend to occur every 6.6 years and move through the study area at speeds that are higher than the average for Atlantic Basin TCs, with the majority of storms transitioning into extratropical cyclones. Although their points of origin range from the Gulf of Mexico to the far eastern Atlantic, a shift in location towards the east was detected over time. Irene produced at least 300 mm of rainfall in North Carolina and relatively high rainfall amounts in several other states as it tracked over the mid-Atlantic and northeastern U.S. Hurricane Floyd (1999) produced the highest rainfall amounts overall and had the most similar spatial distribution of the top 10% of rainfall totals to Irene. Floyd was identified as the best analog for Irene, yet the higher rainfall totals produced farther north by Irene as compared to Floyd were likely due to higher values of precipitable water. Overall, the amount of moisture available in the environment surrounding the TC, rather than storm speed or intensity, exhibited the strongest relationships with rainfall totals and their spatial distribution. This suggests that predictive models such as the Parametric Hurricane Rainfall Model could be improved through the addition of a variable related to the amount and spatial distribution of atmospheric moisture.
Although the eleven TCs took similar tracks as they experienced similar dynamic conditions, large variability existed in the amounts of rainfall they produced and the spatial patterns of the highest rainfall totals. Six TCs including Irene and Floyd had the highest rainfall totals located closer to the track, and five TCs including Irene and Floyd had the highest rainfall near their point of landfall. Five TCs including Floyd had high rain areas that expanded as the storm moved north, and this pattern is expected for storms that transition into extratropical cyclones as shown by previous research. Although the outer edge of Irene’s rainfall expanded, the highest rainfall amounts remained close to the storm track. These results show that the inland decay function in the R-CLIPER model appropriately predicts the spatial distribution of rainfall for some but not all of the hurricanes.
It is important to note that a main limitation of this study is the small sample size, which is problematic for statistical analysis. However, the physical mechanisms that explain the differences in rainfall patterns are supported by previous research so that they are unlikely to be occurring due to random chance. In addition to increasing the sample size, future research should continue to explore the mechanisms for the transport of moisture from remote locations into a TC’s circulation as this has important implications for rainfall production. Reanalysis data with higher spatial resolution, such as the North American Regional Reanalysis and Japanese 25 Year Reanalysis are available for a shorter period of record but would allow a more in-depth study of the spatial dimensions of moisture advection into TC circulations. Research has shown that TCs are well-represented in these datasets, particularly near and over land [76,77,78]. Additionally, radar-derived rain rates, which have a higher spatial and temporal resolution, should be utilized to better identify rainfall events associated with flooding as TCs move over the U.S.

Acknowledgments

This work was funded by the National Science Foundation BCS 1053864. CPC U.S. Unified Precipitation Data and NCEP Reanalysis data were provided by the NOAA/OAR/ESRL PSD, Boulder, Colorado, USA, from their website at http://www.esrl.noaa.gov/psd/. Four anonymous reviewers provided recommendations that improved the figures and text of this manuscript.

Conflicts of Interest

The author declares no conflict of interest. The founding sponsors had no role in the design of the study; in the collection, analyses, or interpretation of data; in the writing of the manuscript, and in the decision to publish the results.

References

  1. Rappaport, E.N. Fatalities in the United States from Atlantic tropical cyclones: New data and interpretation. Am. Meteorol. Soc. 2014, 95, 341–346. [Google Scholar] [CrossRef]
  2. Avila, L.A.; Stewart, S.R. Atlantic hurricane season of 2011. Mon. Weather Rev. 2013, 141, 2577–2596. [Google Scholar] [CrossRef]
  3. Avila, L.; Cangialosi, J. Tropical Cyclone Report Hurricane Irene (al092011); National Hurricane Center: Miami, FL, USA, 2011. Available online: http://www.nhc.noaa.gov/data/tcr/AL092011_Irene.pdf (accessed on 14 December 2011).
  4. Weather Prediction Center. Tropical Cyclone Rainfall Data. Available online: http://www.wpc.ncep.noaa.gov/tropical/rain/irene2011.html (accessed on 15 May 2014).
  5. Villarini, G.; Goska, R.; Smith, J.A.; Vecchi, G.A. North Atlantic tropical cyclones and U.S. flooding. Bull. Am. Meteorol. Soc. 2014, 95, 1381–1388. [Google Scholar] [CrossRef]
  6. Atallah, E.H.; Bosart, L.F.; Aiyyer, A.R. Precipitation distribution associated with landfalling tropical cyclones over the eastern United States. Mon. Weather Rev. 2007, 135, 2185–2206. [Google Scholar] [CrossRef]
  7. Atallah, E.H.; Bosart, L.R. The extratropical transition and precipitation distribution of Hurricane Floyd (1999). Mon. Weather Rev. 2003, 131, 1063–1081. [Google Scholar] [CrossRef]
  8. Hart, R.E.; Evans, J.L. A climatology of the extratropical transition of Atlantic tropical cyclones. J. Clim. 2001, 14, 546–564. [Google Scholar] [CrossRef]
  9. Konrad, C.E.; Perry, L.B. Relationships between tropical cyclones and heavy rainfall in the Carolina region of the USA. Int. J. Climatol. 2010, 30, 522–534. [Google Scholar] [CrossRef]
  10. Sinclair, M.R. Extratropical transition of Southwest Pacific tropical cyclones. Part II: Midlatitude circulation characteristics. Mon. Weather Rev. 2004, 132, 2145–2168. [Google Scholar] [CrossRef]
  11. Jones, S.C.; Harr, P.A.; Abraham, J.; Bosart, L.F.; Bowyer, P.J.; Evans, J.L.; Hanley, D.E.; Hanstrum, B.N.; Hart, R.E.; Lalaurette, F.; et al. The extratropical transition of tropical cyclones: Forecast challenges, current understanding, and future directions. Weather Forecast. 2003, 18, 1052–1092. [Google Scholar] [CrossRef]
  12. Harr, P.A.; Elsberry, R.L. Extratropical transition of tropical cyclones over the western North Pacific. Part I: Evolution of structural characteristics during the transition process. Mon. Weather Rev. 2000, 128, 2613–2633. [Google Scholar] [CrossRef]
  13. Zick, S.E.; Matyas, C.J. A shape metric methodology for studying the evolving geometries of synoptic-scale precipitation patterns in tropical cyclones. Ann. Assoc. Am. Geogr. 2016, 106, 1217–1235. [Google Scholar] [CrossRef]
  14. Sturdevant-Rees, P.; Smith, J.A.; Morrison, J.; Baeck, M.L. Tropical storms and the flood hydrology of the central Appalachians. Water Resour. Res. 2001, 37, 2143–2168. [Google Scholar] [CrossRef]
  15. Haggard, W.H.; Bilton, T.H.; Crutcher, H.L. Maximum rainfall from tropical cyclone systems which cross the Appalachians. J. Appl. Meteorol. 1973, 12, 50–61. [Google Scholar] [CrossRef]
  16. Elsberry, R.L. Predicting hurricane landfall precipitation: Optimistic and pessimistic views from the symposium on precipitation extremes. Bull. Am. Meteorol. Soc. 2002, 83, 1333–1339. [Google Scholar]
  17. Marchok, T.; Rogers, R.; Tuleya, R. Validation schemes for tropical cyclone quantitative precipitation forecasts: Evaluation of operational models for US landfalling cases. Weather Forecast. 2007, 22, 726–746. [Google Scholar] [CrossRef]
  18. Roth, D. Cliqr database development. In Proceedings of the 67th Interdepartmental Hurricane Conference, Office of the Federal Coordinator for Meteorological Services and Supporting Research, College Park, MD, USA, 5–7 March 2013. [Google Scholar]
  19. Tuleya, R.E.; DeMaria, M.; Kuligowski, R.J. Evaluation of GFDL and simple statistical model rainfall forecasts for US landfalling tropical storms. Weather Forecast. 2007, 22, 56–70. [Google Scholar] [CrossRef]
  20. Marks, F.D.; Kappler, G.; DeMaria, M. Development of a tropical cyclone rainfall climatology and persistence (R-CLIPER) model. In Proceedings of the 25th Conference on Hurricanes and Tropical Meteorology, American Meteorological Society, San Diego, CA, USA, 28 April–3 May 2002. [Google Scholar]
  21. Lonfat, M.; Rogers, R.; Marchok, T.; Marks, F.D. A parametric model for predicting hurricane rainfall. Mon. Weather Rev. 2007, 135, 3086–3097. [Google Scholar] [CrossRef]
  22. Chen, S.Y.S.; Knaff, J.A.; Marks, F.D. Effects of vertical wind shear and storm motion on tropical cyclone rainfall asymmetries deduced from TRMM. Mon. Weather Rev. 2006, 134, 3190–3208. [Google Scholar] [CrossRef]
  23. Corbosiero, K.L.; Molinari, J. The effects of vertical wind shear on the distribution of convection in tropical cyclones. Mon. Weather Rev. 2002, 130, 2110–2123. [Google Scholar] [CrossRef]
  24. Corbosiero, K.L.; Molinari, J. The relationship between storm motion, vertical wind shear, and convective asymmetries in tropical cyclones. J. Atmos. Sci. 2003, 60, 366–376. [Google Scholar] [CrossRef]
  25. Lonfat, M.; Marks, F.D.; Chen, S.Y.S. Precipitation distribution in tropical cyclones using the Tropical Rainfall Measuring Mission (TRMM) microwave imager: A global perspective. Mon. Weather Rev. 2004, 132, 1645–1660. [Google Scholar] [CrossRef]
  26. Matyas, C.J. A geospatial analysis of convective rainfall regions within tropical cyclones after landfall. Int. J. Appl. Geospat. Res. 2010, 1, 69–89. [Google Scholar] [CrossRef]
  27. Cecil, D.J. Satellite-derived rain rates in vertically sheared tropical cyclones. Geophys. Res. Lett. 2007, 34, L02811. [Google Scholar] [CrossRef]
  28. Rogers, R.F.; Chen, S.S.; Tenerelli, J.; Willoughby, H.E. A numerical study of the impact of vertical shear on the distribution of rainfall in Hurricane Bonnie (1998). Mon. Weather Rev. 2003, 131, 1577–1599. [Google Scholar] [CrossRef]
  29. Li, Y.; Cheung, K.K.W.; Chan, J.C.L. Numerical study on the development of asymmetric convection and vertical wind shear during tropical cyclone landfall. Q. J. R. Meteorol. Soc. 2014, 140, 1866–1877. [Google Scholar] [CrossRef]
  30. Hill, K.; Lackmann, G.M. Influence of environmental humidity on tropical cyclone size. Mon. Weather Rev. 2009, 137, 3294–3315. [Google Scholar] [CrossRef]
  31. Ying, Y.; Xhang, Q. A modeling study on tropical cyclone structural changes in response to ambient moisture variations. J. Meteorol. Soc. Jpn. 2012, 90, 755–770. [Google Scholar] [CrossRef]
  32. Jiang, H.; Halverson, J.B.; Simpson, J.; Zipser, E.J. On the differences in storm rainfall from Hurricanes Isidore and Lili. Part II: Water budget. Weather Forecast. 2008, 23, 44–61. [Google Scholar] [CrossRef]
  33. Matyas, C.J.; Cartaya, M. Comparing the rainfall patterns produced by Hurricanes Frances (2004) and Jeanne (2004) over Florida. Southeast Geogr. 2009, 49, 132–156. [Google Scholar] [CrossRef]
  34. Matyas, C.J. Associations between the size of hurricane rain fields at landfall and their surrounding environments. Meteorol. Atmos. Phys. 2010, 106, 135–148. [Google Scholar] [CrossRef]
  35. Malkus, J.S.; Rhiel, H. On the dynamics and energy transformations in steady-state hurricanes. Tellus 1960, 12, 1–20. [Google Scholar] [CrossRef]
  36. Kurihara, Y. Budget analysis of a tropical cyclone simulated in an axisymmetric numerical model. J. Atmos. Sci. 1975, 32, 25–59. [Google Scholar] [CrossRef]
  37. Trenberth, K.E.; Fasullo, J. Water and energy budgets of hurricanes and implications for climate change. J. Geophys. Res. Atmos. 2007, 112. [Google Scholar] [CrossRef]
  38. U.S. Census Bureau, P.D. Annual Estimates of the Resident Population: April 1, 2010 to July 1, 2013. Available online: http://factfinder2.census.gov/bkmk/table/1.0/en/PEP/2013/PEPANNGCT.US24PR (accessed on 15 May 2017).
  39. Landsea, C.W.; Franklin, J.L. Atlantic hurricane database uncertainty and presentation of a new database format. Mon. Weather Rev. 2013, 141, 3576–3592. [Google Scholar] [CrossRef]
  40. Higgins, R.W.; Janowiak, J.E.; Yao, Y.P. A Gridded Hourly Precipitation Data Base for The United States (1963–1993); National Centers for Environmental Prediction: Camp Springs, MD, USA, 1996; p. 46.
  41. Corbosiero, K.L.; Dickinson, M.J.; Bosart, L.F. The contribution of eastern North Pacific tropical cyclones to the rainfall climatology of the Southwest United States. Mon. Weather Rev. 2009, 137, 2415–2435. [Google Scholar] [CrossRef]
  42. Zhu, L.; Quiring, S.M. An extraction method for long-term tropical cyclone precipitation from daily rain gauges. J. Hydrometeorol. 2017. [Google Scholar] [CrossRef]
  43. Medlin, J.M.; Kimball, S.K.; Blackwell, K.G. Radar and rain gauge analysis of the extreme rainfall during Hurricane Danny’s (1997) landfall. Mon. Weather Rev. 2007, 135, 1869–1888. [Google Scholar] [CrossRef]
  44. Larson, L.W.; Peck, E.L. Accuracy of precipitation measurements for hydrologic modeling. Water Resour. Res. 1974, 10, 857–863. [Google Scholar] [CrossRef]
  45. Zhou, Y.; Matyas, C.J. Spatial characteristics of storm-total rainfall swaths associated with tropical cyclones over the eastern United States. Int. J. Climatol. 2017, 37, 557–569. [Google Scholar] [CrossRef]
  46. Kalnay, E.; Kanamitsu, M.; Kistler, R.; Collins, W.; Deaven, D.; Gandin, L.; Iredell, M.; Saha, S.; White, G.; Woollen, J.; et al. The NCEP/NCAR 40-year reanalysis project. Bull. Am. Meteorol. Soc. 1996, 77, 437–471. [Google Scholar] [CrossRef]
  47. Ritchie, E.A.; Elsberry, R.L. Simulations of the extratropical transition of tropical cyclones: Phasing between the upper-level trough and tropical cyclones. Mon. Weather Rev. 2007, 135, 862–876. [Google Scholar] [CrossRef]
  48. Franklin, J.L.; Feuer, S.E.; Kaplan, J.; Aberson, S.D. Tropical cyclone motion and surrounding flow relationships: Searching for beta gyres in omega dropwindsonde datasets. Mon. Weather Rev. 1996, 124, 64–84. [Google Scholar] [CrossRef]
  49. Rodgers, E.B.; Chang, S.W.; Pierce, H.F. A satellite observational and numerical study of precipitation characteristics in western North Atlantic tropical cyclones. J. Appl. Meteorol. 1994, 33, 129–139. [Google Scholar] [CrossRef]
  50. Matyas, C.J. Conditions associated with large rain-field areas for tropical cyclones landfalling over Florida. Phys. Geogr. 2014, 35, 93–106. [Google Scholar] [CrossRef]
  51. Jorgensen, D.; Zipser, E.; LeMone, M. Vertical motions in intense hurricanes. J. Atmos. Sci. 1985, 42, 839–856. [Google Scholar] [CrossRef]
  52. Hart, R.E.; Evans, J.L.; Evans, C. Synoptic composites of the extratropical transition life cycle of North Atlantic tropical cyclones: Factors determining posttransition evolution. Mon. Weather Rev. 2006, 134, 553–578. [Google Scholar] [CrossRef]
  53. Brettschneider, B. Climatological hurricane landfall probability for the United States. J. Appl. Meteorol. Climatol. 2008, 47, 704–716. [Google Scholar] [CrossRef]
  54. Xie, L.; Yan, T.Z.; Pietrafesa, L.J.; Morrison, J.M.; Karl, T. Climatology and interannual variability of North Atlantic hurricane tracks. J. Clim. 2005, 18, 5370–5381. [Google Scholar] [CrossRef]
  55. Sheets, R.C. The National Hurricane Center-past, present, and future. Weather Forecast. 1990, 5, 185–232. [Google Scholar] [CrossRef]
  56. Vecchi, G.A.; Knutson, T.R. On estimates of historical North Atlantic tropical cyclone activity. J. Clim. 2008, 21, 3580–3600. [Google Scholar] [CrossRef]
  57. Kossin, J.P.; Camargo, S.J.; Sitkowski, M. Climate modulation of North Atlantic hurricane tracks. J. Clim. 2010, 23, 3057–3076. [Google Scholar] [CrossRef]
  58. Hall, T.M.; Jewson, S. Statistical modelling of North Atlantic tropical cyclone tracks. Tellus A 2007, 59, 486–498. [Google Scholar] [CrossRef]
  59. Keim, B.D.; Muller, R.A. Spatiotemporal patterns and return periods of tropical storm and hurricane strikes from Texas to Maine. J. Clim. 2007, 20, 3498–3509. [Google Scholar] [CrossRef]
  60. Elsner, J.B.; Liu, K.B.; Kocher, B. Spatial variations in major US hurricane activity: Statistics and a physical mechanism. J. Clim. 2000, 13, 2293–2305. [Google Scholar] [CrossRef]
  61. Murakami, H.; Bin, W. Future change of North Atlantic tropical cyclone tracks: Projection by a 20-km-mesh global atmospheric model. J. Clim. 2010, 23, 2699–2721. [Google Scholar] [CrossRef]
  62. National Hurricane Center: Hurricane Irene Advisory Archive. Available online: http://www.nhc.noaa.gov/archive/2011/IRENE.shtml (accessed on 20 July 2017).
  63. Colby, J.D.; Mulcahy, K.A.; Wang, Y. Modeling flooding extent from Hurricane Floyd in the coastal plains of North Carolina. Glob. Environ. Chang. Part B Environ. Hazard. 2000, 2, 157–168. [Google Scholar] [CrossRef]
  64. Villarini, G.; Smith, J.A.; Baeck, M.L.; Marchok, T.; Vecchi, G.A. Characterization of rainfall distribution and flooding associated with US landfalling tropical cyclones: Analyses of hurricanes Frances, Ivan, and Jeanne (2004). J. Geophys. Res. 2011, 116, D23116. [Google Scholar] [CrossRef]
  65. Tang, Q.; Xie, L.; Lackmann, G.M.; Liu, B. Modeling the impacts of the large-scale atmospheric environment on inland flooding during the landfall of Hurricane Floyd (1999). Adv. Meteorol. 2013, 2013, 16. [Google Scholar] [CrossRef]
  66. Trenberth, K.E.; Davis, C.A.; Fasullo, J. Water and energy budgets of hurricanes: Case studies of Ivan and Katrina. J. Geophys. Res. Atmos. 2007, 112, 11. [Google Scholar] [CrossRef]
  67. Takakura, T.; Kawamura, R.; Kawano, T.; Ichiyanagi, K.; Tanoue, M.; Yoshimura, K. An estimation of water origins in the vicinity of a tropical cyclone’s center and associated dynamic processes. Clim. Dyn. 2017, 1–15. [Google Scholar] [CrossRef]
  68. Matyas, C.J. Tropical cyclone formation and motion in the Mozambique Channel. Int. J. Climatol. 2015, 35, 375–390. [Google Scholar] [CrossRef]
  69. Farfán, L.M.; Fogel, I. Influence of tropical cyclones on humidity patterns over southern Baja California, Mexico. Mon. Weather Rev. 2007, 135. [Google Scholar] [CrossRef]
  70. Chu, P.-S. Large-scale circulation features associated with decadal variations of tropical cyclone activity over the central North Pacific. J. Clim. 2002, 15, 2678–2689. [Google Scholar] [CrossRef]
  71. Inoue, M.; Handoh, I.C.; Bigg, G.R. Bimodal distribution of tropical cyclogenesis in the Caribbean: Characteristics and environmental factors. J. Clim. 2002, 15, 2897–2905. [Google Scholar] [CrossRef]
  72. Hernández-Ayala, J.J.; Matyas, C.J. Tropical cyclone rainfall over Puerto Rico and its relations to environmental and storm specific factors. Int. J. Climatol. 2016, 36, 2223–2237. [Google Scholar] [CrossRef]
  73. Lawrence, M.B.; Avila, L.A.; Beven, J.L.; Franklin, J.L.; Guiney, J.L.; Pasch, R.J. Atlantic hurricane season of 1999. Mon. Weather Rev. 2001, 129, 3057–3084. [Google Scholar] [CrossRef]
  74. Knutson, T.R.; Sirutis, J.J.; Vecchi, G.A.; Garner, S.; Zhao, M.; Kim, H.-S.; Bender, M.; Tuleya, R.E.; Held, I.M.; Villarini, G. Dynamical downscaling projections of twenty-first-century Atlantic hurricane activity: CMIP3 and CMIP5 model-based scenarios. J. Clim. 2013, 26, 6591–6617. [Google Scholar] [CrossRef]
  75. Wright, D.B.; Knutson, T.R.; Smith, J.A. Regional climate model projections of rainfall from US landfalling tropical cyclones. Clim. Dyn. 2015, 1–15. [Google Scholar] [CrossRef]
  76. Zick, S.E.; Matyas, C.J. Tropical cyclones in the North American Regional Reanalysis: An assessment of spatial biases in location, intensity, and structure. J. Geophys. Res. Atmos. 2015, 120. [Google Scholar] [CrossRef]
  77. Hatsushika, H.; Tsutsui, J.; Fiorino, M.; Onogi, K. Impact of wind profile retrievals on the analysis of tropical cyclones in the JRA-25 reanalysis. J. Meteorol. Soc. Jpn. 2006, 84, 891–905. [Google Scholar] [CrossRef]
  78. Schenkel, B.A.; Hart, R.E. An examination of tropical cyclone position, intensity, and intensity life cycle within atmospheric reanalysis datasets. J. Clim. 2012, 25, 3453–3475. [Google Scholar] [CrossRef]
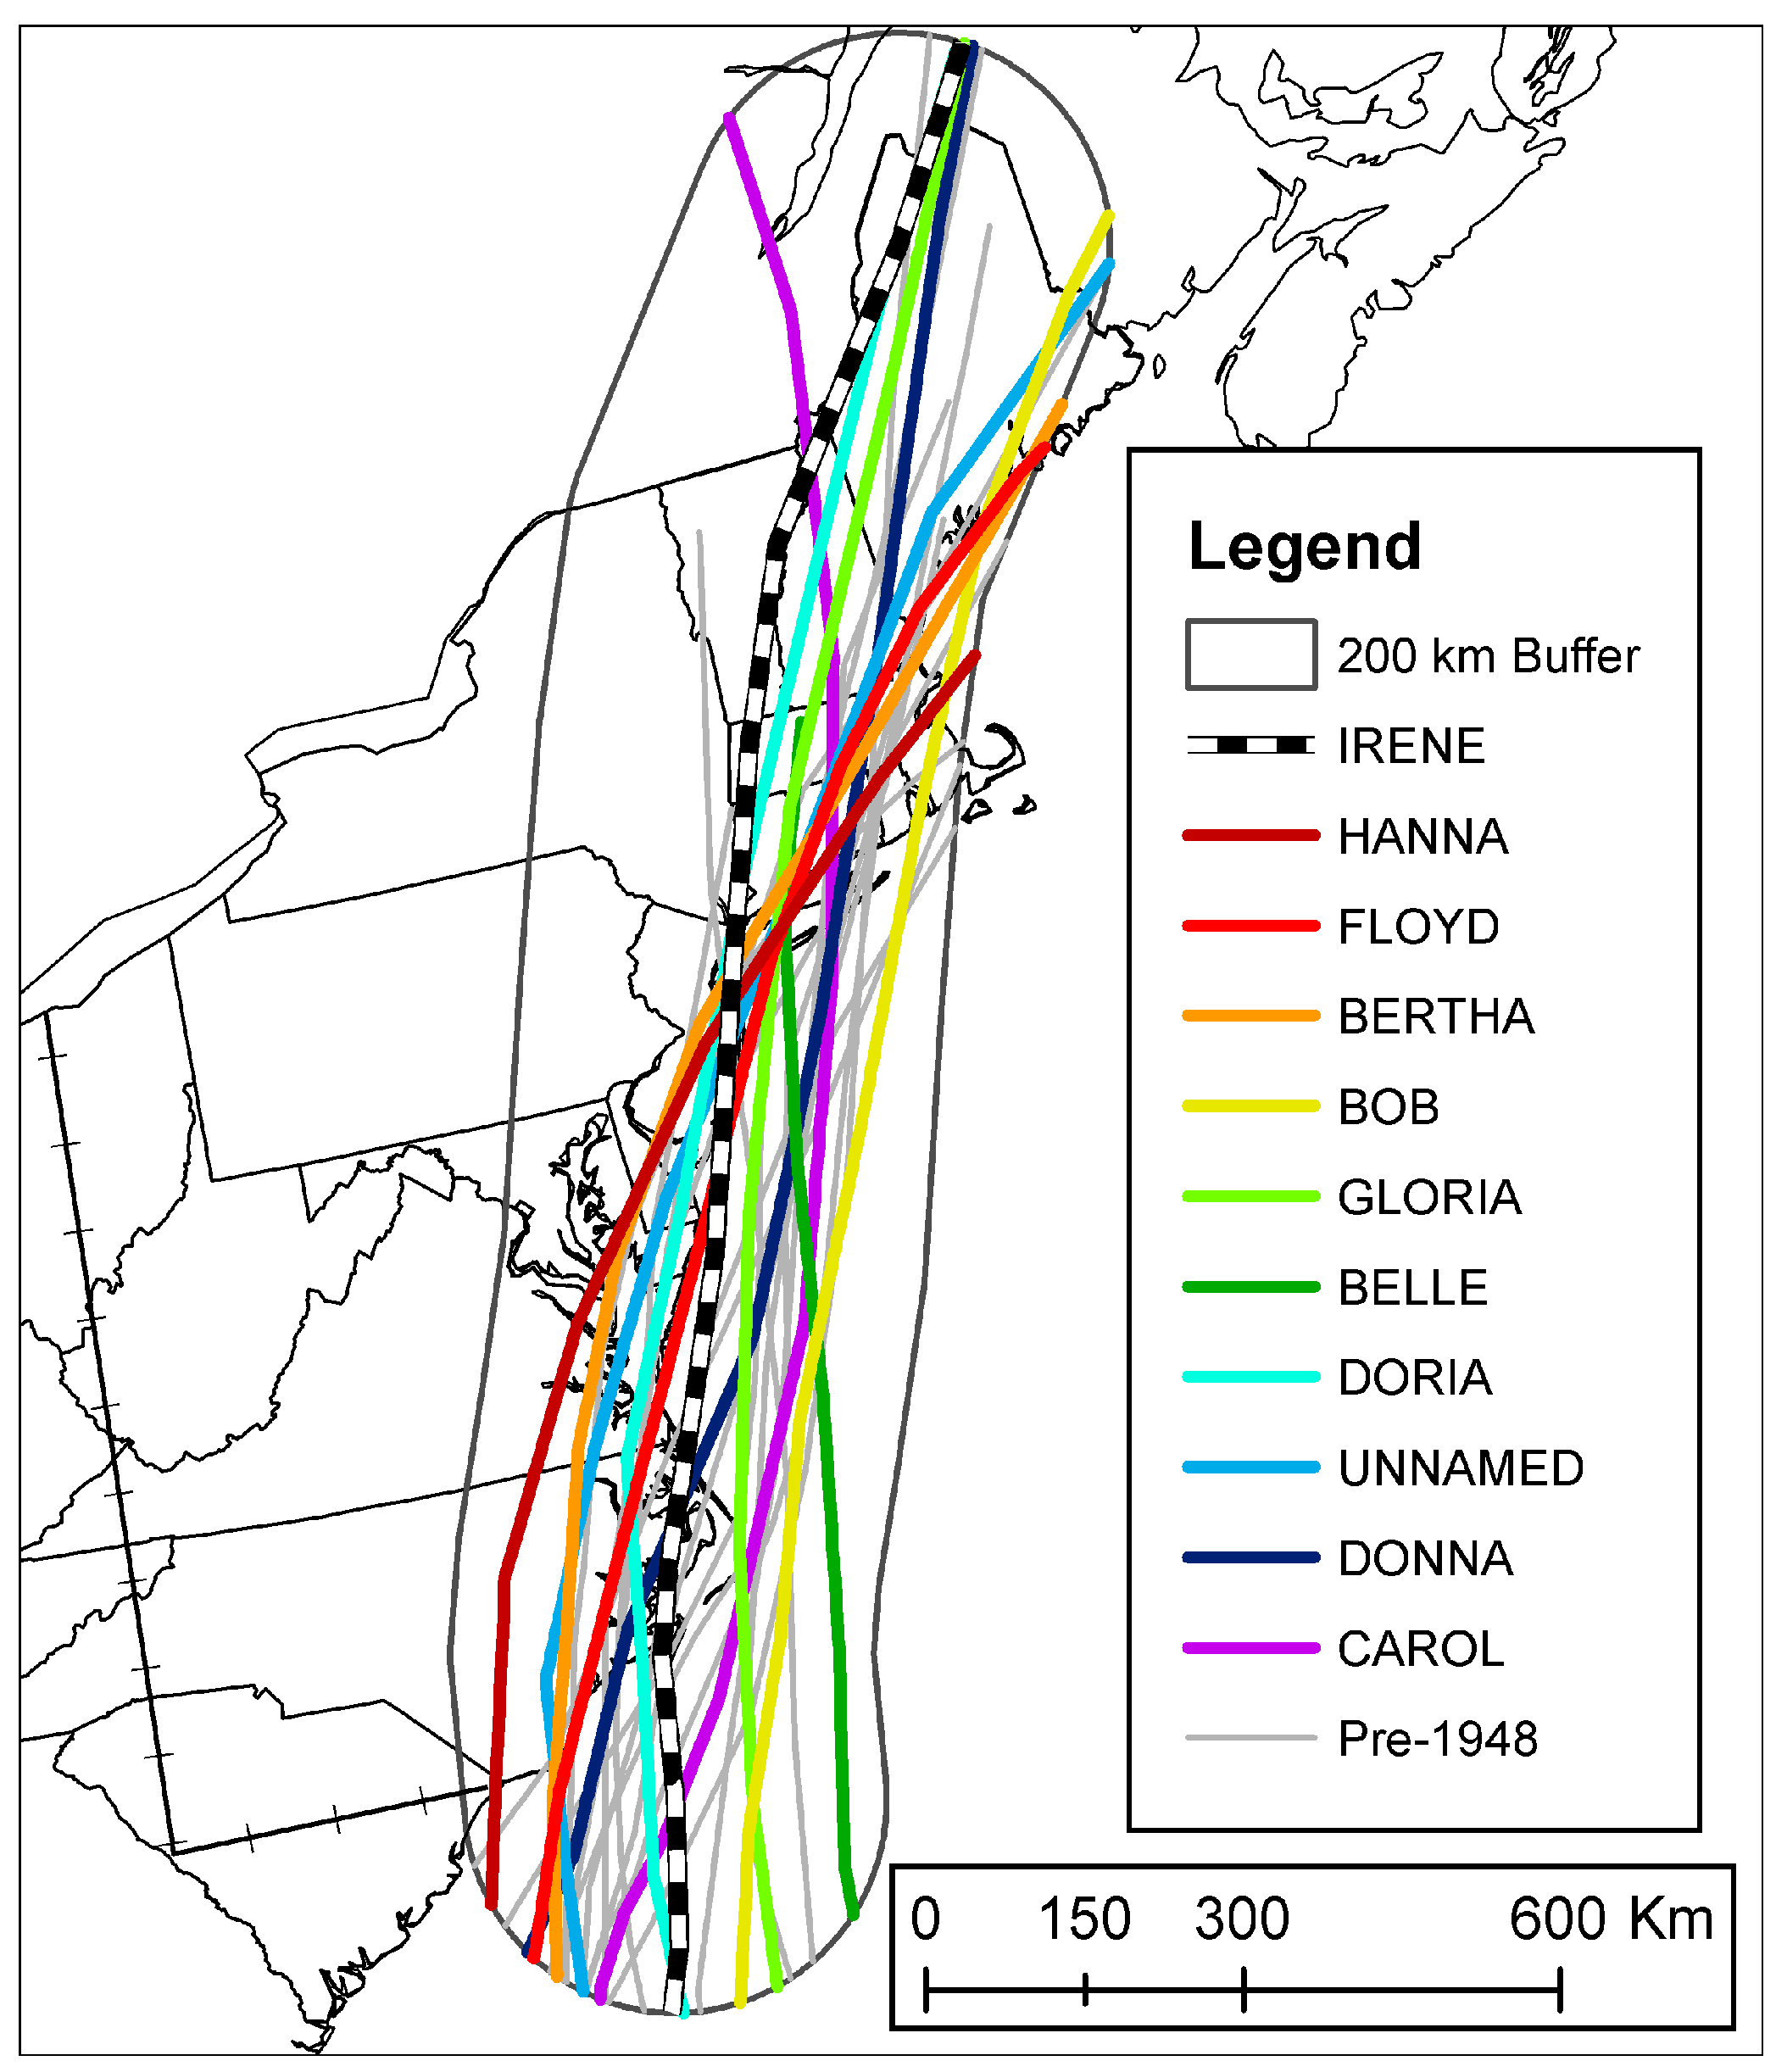
Figure 1. Tracks of tropical cyclones included in the study with 200 km buffer for the track of Irene. The western and southern extent of the rainfall study region is denoted with a hatched line. Years associated with each name are included in Table 1.
Atmosphere 08 00165 g001
Figure 2. Track density map for all HURDAT2 track segments 1851–2016. Values correspond to the area occupied by track segment lengths (km) with a 1° search radius for each 25 km × 25 km grid cell. Units are kilometers by square kilometer.
Atmosphere 08 00165 g002
Figure 3. Mean daily anomalies of 500 hPa geopotential heights (mm) averaged across all 11 TCs (tropical cyclones) on (a) the day prior to entering the study region; (b) the day entering the study region; (c) the day after entering the study region for 11 TCs occurring post-1948. Tracks for pre-1948 TCs are included for discussion of formation points.
Atmosphere 08 00165 g003
Figure 4. Storm total rainfall (mm) for Irene (2011).
Atmosphere 08 00165 g004
Figure 5. Storm total rainfall (mm) for Floyd (1999).
Atmosphere 08 00165 g005
Figure 6. Precipitable water (mm) averaged over the day of landfall over North Carolina for (a) Floyd, and (b) Irene, and the day after landfall for (c) Floyd and (d) Irene.
Atmosphere 08 00165 g006
Figure 7. Contours of 45 mm precipitable water for (a) four TCs with linkages to deep tropical moisture, and (b) seven TCs that do not source their moisture from the deep tropics. Colors correspond to storm tracks in Figure 1.
Atmosphere 08 00165 g007
Figure 8. Anomalies of zonal and meridional winds at 850 hPa on the day before TCs entered the study region. (a) zonal winds averaged for TCs in Figure 7a, (b) meridional winds averaged for TCs in Figure 7a, (c) zonal winds averaged for TCs in Figure 7b, and (d) meridional winds averaged for TCs in Figure 7b.
Atmosphere 08 00165 g008
Figure 9. Mean rainfall produced by (a) four TCs with linkages to deep tropical moisture, and (b) seven TCs that do not source their moisture from the deep tropics.
Atmosphere 08 00165 g009
Figure 10. (a) Tropical cyclone producing the highest storm-total rainfall for each grid point; (b) storm total rainfall (mm) for each grid point produced by corresponding tropical cyclone in (a).
Atmosphere 08 00165 g010
Table 1. Maximum sustained wind speed when TC made landfall, storm translational speed upon entering and exiting the study region, number of hours from entrance until completing an extratropical transition, and the number of hours from entrance until dissipating for TCs that did not complete an ET.
Tropical CycloneMax.Winds Landfall (ms1)Entrance Speed (ms1)Exit Speed (ms1)Time Enter Until ET (h)Time Enter Until Dis. (h)
Irene 2011396.716.536-
Hanna 20083112.218.523-
Floyd 1999468.810.930-
Bertha 1996467.514.640-
Bob 1991519.810.438-
Gloria 19854612.015.518-
Belle 19764911.58.8-23
Doria 19712810.412.530-
Unnamed 1961188.831.1-31
Donna 1960466.220.125-
Carol 19544417.813.925-
Table 2. Minimum, median, and maximum, values for storm total rainfall and distance to track for top 10% of rainfall totals left of track.
Tropical CycloneMinimum Rainfall (mm)Median Rainfall (mm)Maximum Rainfall (mm)Median Dist.Trk. (km)Max. Dist. Track (km)
Irene 201118621032582163
Hanna 200810412018777152
Floyd 199918524148988173
Bertha 19969110419055180
Bob 199110614121191215
Gloria 1985126151223146228
Belle 1976689317999228
Doria 197110013422571215
Unnamed 196125295798503
Donna 1960141153198103214
Carol 19547685176119366
Table 3. Spearman’s rank correlation coefficients for the top 10% of rainfall totals left of track for each storm between rainfall total, distance from the storm track, and latitude.
Tropical CycloneRain vs. DistanceRain vs. LatitudeDistance vs. Latitude
Irene 2011−0.21 *−0.43 **−0.15
Hanna 20080.120.030.05
Floyd 1999−0.46 **−0.62 **0.26 **
Bertha 1996−0.08−0.24 **0.25 **
Bob 1991−0.39 **0.17 *−0.04
Gloria 19850.11−0.23 **0.38 **
Belle 1976−0.49 **−0.12−0.27 **
Doria 1971−0.37 **−0.12−0.03
Unnamed 1961−0.100.150.35 **
Donna 1960−0.03−0.000.08
Carol 1954−0.25 **−0.55 **0.40 **
** significant at α = 0.01; * significant at α = 0.05.
Table 4. Data pertaining to moisture for each TC.
Tropical CycloneMaximum Closed Region TPW (mm)Zonal Extent 45 mm Contour (km)Meridional Extent 45 mm Contour (km)
Irene 2011557655048
Hanna 2008557332890
Floyd 1999556684636
Bertha 1996555721757
Bob 1991505794855
Gloria 1985505954797
Belle 1976452901107
Doria 1971455112282
Unnamed 1961454371972
Donna 1960554822619
Carol 1954454422363
Table 5. Spearman’s rank correlation coefficients for rainfall variables calculated for the top 10% of rainfall totals left of track and variables related to the largest value of total precipitable water with a closed contour, the zonal extent of the 45 mm closed polygon, the meridional extent of the 45 mm closed polygon, entrance and exit speeds, landfall intensity, and the time between landfall and completing extratropical transition.
ConditionMaximum RainfallMedian RainfallMinimum RainfallMaximum Distance to Track
Closed TPW0.470.66 *0.72 *−0.87 **
Zonal 45mm0.69 *0.70 *0.79 **−0.79 **
Meridional 45mm0.64 *0.74 **0.83 **−0.42
Entrance Speed−0.35−0.45−0.410.34
Exit Speed−0.25−0.06−0.07−0.09
Landfall Intensity0.110.240.18−0.08
Hours between Landfall and ET0.170.040.04−0.18
** significant at α = 0.01; * significant at α = 0.05.