Article

Improving PM2.5 Air Quality Model Forecasts in China Using a Bias-Correction Framework

1
Department for Earth System Science, Tsinghua University, Beijing 100084, China
2
School of Earth and Atmospheric Sciences, Georgia Institute of Technology, Atlanta, GA 30332, USA
3
School of Civil and Environmental Engineering, Georgia Institute of Technology, Atlanta, GA 30332, USA
*
Author to whom correspondence should be addressed.
Current address: Huayun Sounding Meteorological Technology Corporation, Beijing 102299, China.
Current address: School of Engineering and Applied Sciences, Harvard University, Cambridge, MA 02138, USA.
Atmosphere 2017, 8(8), 147; https://doi.org/10.3390/atmos8080147
Submission received: 11 July 2017 / Revised: 5 August 2017 / Accepted: 9 August 2017 / Published: 13 August 2017
(This article belongs to the Special Issue Air Quality Monitoring and Forecasting)

Abstract

:
Chinese cities are experiencing severe air pollution in particular, with extremely high PM2.5 levels observed in cold seasons. Accurate forecasting of occurrence of such air pollution events in advance can help the community to take action to abate emissions and would ultimately benefit the citizens. To improve the PM2.5 air quality model forecasts in China, we proposed a bias-correction framework that utilized the historic relationship between the model biases and forecasted and observational variables to post-process the current forecasts. The framework consists of four components: (1) a feature selector that chooses the variables that are informative to model forecast bias based on historic data; (2) a classifier trained to efficiently determine the forecast analogs (clusters) based on clustering analysis, such as the distance-based method and the classification tree, etc.; (3) an error estimator, such as the Kalman filter, to predict model forecast errors at monitoring sites based on forecast analogs; and (4) a spatial interpolator to estimate the bias correction over the entire modeling domain. One or more methods were tested for each step. We applied five combinations of these methods to PM2.5 forecasts in 2014–2016 over China from the operational AiMa air quality forecasting system using the Community Multiscale Air Quality (CMAQ) model. All five methods were able to improve forecast performance in terms of normalized mean error (NME) and root mean square error (RMSE), though to a relatively limited degree due to the rapid changing of emission rates in China. Among the five methods, the CART-LM-KF-AN (a Classification And Regression Trees-Linear Model-Kalman Filter-Analog combination) method appears to have the best overall performance for varied lead times. While the details of our study are specific to the forecast system, the bias-correction framework is likely applicable to the other air quality model forecast as well.

1. Introduction

The fine particulate matter with an aerodynamic diameter of less than 2.5 μm (PM2.5) is the dominant air pollutant in most Chinese cities in recent years. In 2016, the nationwide annual mean-observed PM2.5 concentration was 47 μg/m3, which exceeded 35 μg/m3, the level II national ambient air quality standards (NAQQS) of China (GB3095-2012), by more than 34%. The pollution levels are much higher in densely populated regions [1]. For example, in the Beijing-Tianjin-Hebei (BTH) area the average annual mean of PM2.5 concentration was 71 μg/m3 in 2016, twice of the standard, which would cause severe adverse health effects [2,3]. It is critical to provide the public and administrative agencies air pollution alerts in advance, to help citizens take timely protective actions (e.g., wearing masks, staying indoors), and to help governments control emissions through dynamic management actions [4,5].
Empirical models and deterministic models are the two major approaches to forecast air quality in the near future. The empirical approaches usually employ statistical models that relate predictor and explanatory variables [6,7]. These methods can be easily implemented as long as there are sufficient observations available for training the statistical model. However, they have difficulty in forecasting air pollution in longer-term and larger-scales, and have no means to predict pollutant compositions or to provide emission controlling implications [8,9]. The deterministic approaches overcome the above inabilities of statistical models by adopting chemical transport models (CTMs), e.g., the Community Multi-scale Air Quality- model (CMAQ) [10], and especially, can produce forecasts in a much longer lead time, with comparable accuracy, to meet the requirements of the dynamic management practice. CTMs start with a detailed emissions inventory and forecasted meteorological fields, and solve a series of mathematical equations in space and time to simulate air pollutants’ fates with the evolution of physical and chemical processes in the atmosphere. Regional air quality forecasting systems that are based upon CTMs have been widely established in the world to provide operational air quality forecasts in real-time [11,12,13,14]. However, there could be significant prediction errors in these forecasts due to emission inventory uncertainties, meteorology forecast uncertainties, and the missing physical and chemical mechanisms in the CTMs [15].
One way to improve the deterministic model forecasting performance is to utilize the statistical methods-based, post-processing techniques to adjust the current forecasts. Fundamentally, these post-processing techniques are bias correction techniques that utilize the deterministic model’s historic errors to correct the current model forecasts (from now on, the word “model” exclusively refers to the deterministic model). The simplest bias correction technique is the moving mean method, which directly applies the averaged forecast bias of the previous time period to the current model forecast [16]. The Kalman filter has also been used to derive future bias from model’s historical performance [17,18,19,20]. A more advanced bias correction technique is the analog method which first clusters the historic forecasts into resembling analogs, and then derives future bias from the historic analog members [16,21,22]. The analog method considers the distinction of performance levels between different analogs, which might be related to the variations of pollution levels (which are due to various air masses and emission events). The analog method can be further combined with the Kalman filter and other methods to determine the ensemble bias within the same group of analog members [16]. These bias correction techniques have been demonstrated to decrease model forecast errors in weather forecasts [23,24], and O3 [11,25,26,27] and PM2.5 forecasts [28,29]. It is noteworthy that the previous bias correction studies on PM2.5 forecasts were all conducted for areas with much cleaner air than in China (e.g., US, UK, Italy, and Portugal) [22,30,31], with their annual mean PM2.5 concentrations around 10 μg/m3 or below, and with relatively small day-to-day variations. Also, most of these bias correction studies were conducted for 1–2 day lead time model forecasts.
In this study, we propose a bias-correction framework that explores and utilizes the relationships between model biases and predictor variables to improve nationwide PM2.5 model forecasts in China. Within the same framework, we tested and compared five bias-correction techniques to post-process the 1-day, 3-day, and 5-day lead-time model forecasts from a nationwide air quality forecasting system in China that has been in operation for over three years. The purpose of the study is to test the existing bias-correction techniques in China, which includes very heavily polluted areas with very large variations in PM2.5 concentration. For example, the PM2.5 concentration in Beijing can vary from over 250 μg/m3 to below 20 μg/m3 within a couple of days. We utilized the framework to test the Classification and Regression Trees (CART) method to determine analogs with better distinctions. The study was also aimed to test the effectiveness of the bias-correction techniques for longer lead-time forecasts, such as the 3-day and 5-day in advance, which can better support the dynamic air quality management practice.

2. Experiments

2.1. PM2.5 Model Forecasts

The daily PM2.5 model forecasts from 2014 to 2016 were obtained from an operational air quality forecasting system (Available online: www.aimayubao.com) built upon the CMAQ model (version 5.0.2), along with the Weather Research and Forecasting Model (WRF, version 3.4.1) [32] and an emissions processing component. The emissions inventory used (called AiMa inventory) was compiled and projected from various inventories and information sources and was further adjusted by utilizing inverse modeling techniques. The CMAQ modeling is configured with the saprc07tc gas chemistry mechanism and the aero6 aerosol module. The WRF simulation is driven by NCEP’s GFS 0.5-degree global weather forecast products. The forecasting system produces 144 h forecasts (called AiMa forecasts) at each cycle that covers 5 days local time. The operation of the forecasting system started on 4 February 2014. The model grids have a spatial resolution of 12 km covering the entirety of China. The configurations of the forecasting system have not been changed since operation, ensuring the consistency of the forecasting error distribution. The daily forecasts for the lead times of 1, 3, and 5 days were used in this study. The relative longer forecasting lead time (compared to 1–2 days lead time in previous studies [16,22]) would enable us to evaluate whether the post-correction method is useful for dynamic management practices [33], which usually requires about a 3–5 day lead time to take actions.

2.2. PM2.5 Observations

The air quality observational data from the Chinese air quality monitoring network was obtained from the official real-time air quality monitoring publishing platform [34]. The monitoring network had 945 monitors in operation in 2014 and expanded to 1496 monitors in 2015. The network measured PM2.5 concentrations with the widely used TEOM (Tapered Element Oscillating Microbalance) instruments. The 24 hourly observations within a day from 0:00 through 24:00 (Beijing local time) were averaged to calculate daily mean PM2.5 concentrations. In case that two or more monitors are within the same grid cell, the averages of the observations from these monitors are used. To distinguish from the original observational data from monitors, we refer to this dataset as observations at “avg-monitors”. As a result, the 945 monitors operational since 2014 were assigned to 545 different grid cells and all the 1496 monitors operational since 2015 were assigned to 840 grid cells (Figure 1a). Figure 1b illustrates the spatial patterns of the observed PM2.5 pollution levels in China in year 2016.

2.3. Bias-Correction Framework

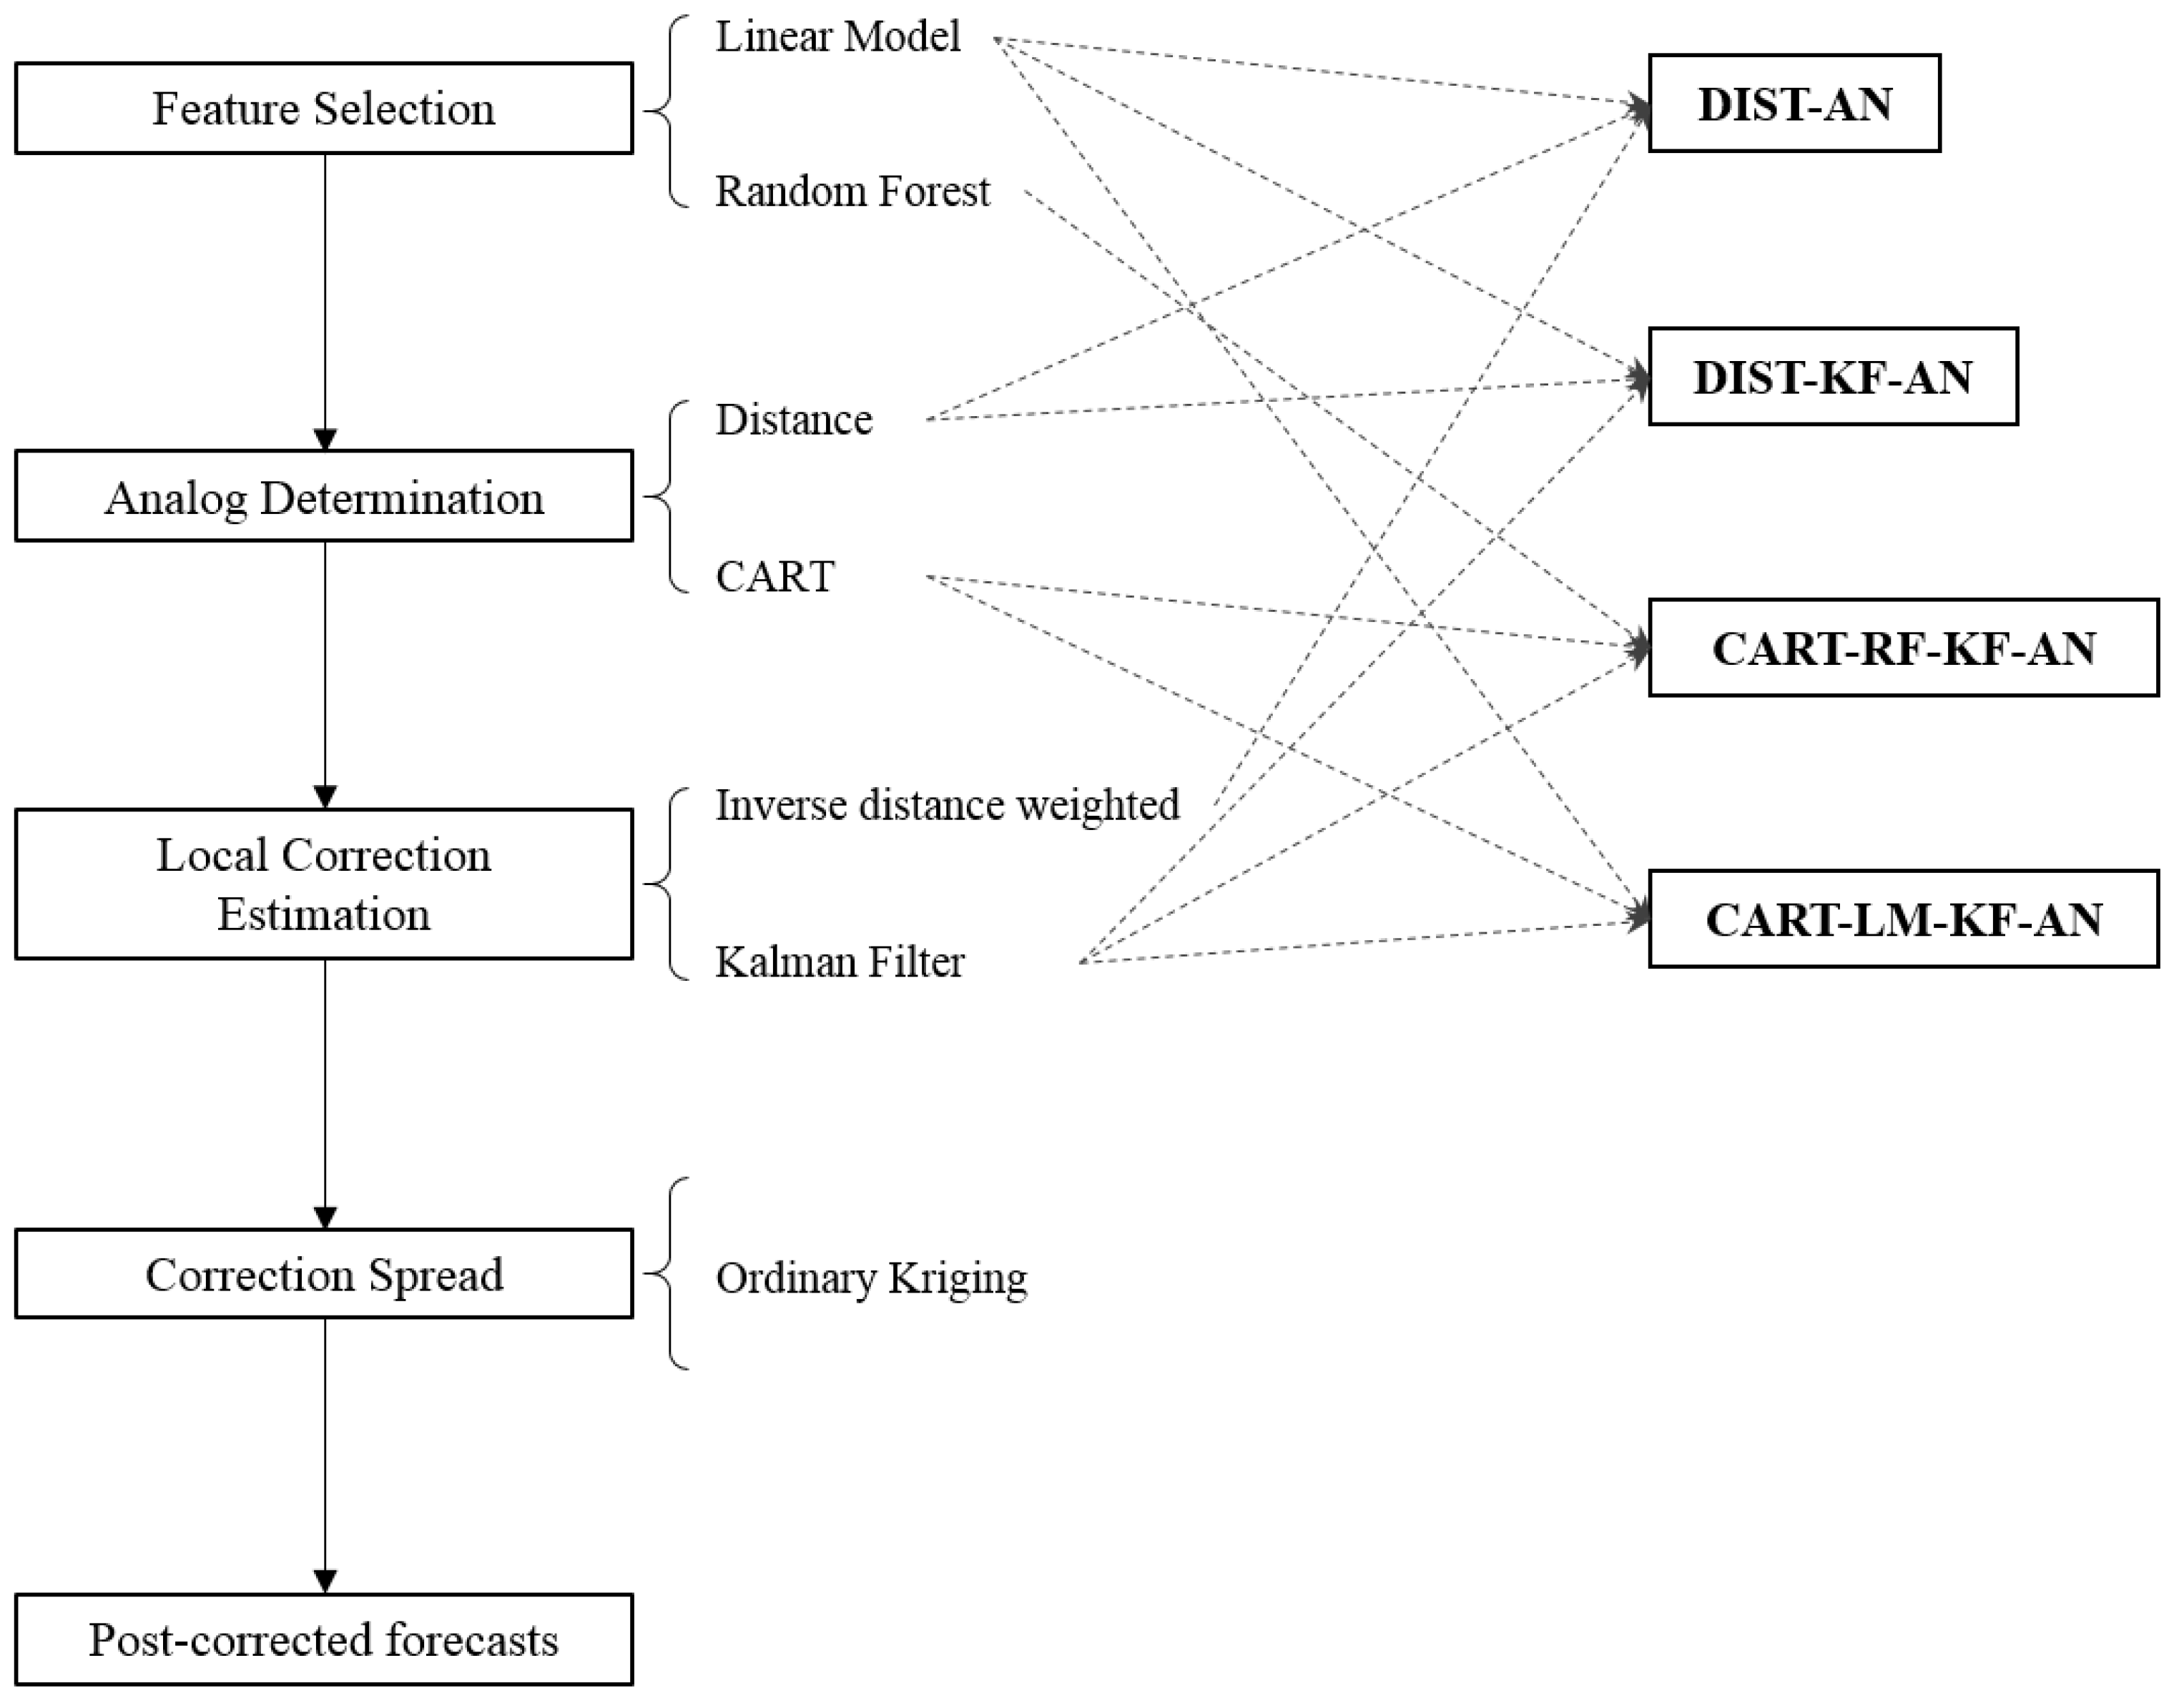
To improve forecast performance, we propose a bias-correction framework as a post-processing procedure for model forecasts. The framework utilizes historic data to establish relationships between the model forecast biases and a variety of model-simulated or observed variables, and then uses these relationships to correct the current forecast. The framework is conducted in four steps: (1) feature selection; (2) forecast analog determination; (3) local correction estimation; and (4) correction spread. Figure 2 illustrates the framework and the methods we tested in each step.

2.3.1. Feature Selection

In the “feature selection” step, we choose a group of variables containing information about model biases from a pool of modeled or observed variables. By eliminating non-informative variables, we can improve the predictability of model biases by analogs. In this study, data from 545 avg-monitors (blue dots in Figure 1) in 2014 and 2015 are used as historic data for selecting informative variables, or features, at each of these avg-monitors. Only the variables that are selected in this step will be used in the following “analog determination” step.
Here, we consider in total 19 candidate variables. Five of them are observation variables (i.e., the mean observed concentrations of the five criteria air pollutants, CO, NO2, O3, PM2.5, and SO2) on the day prior to the forecasting cycle, and the rest of the candidate variables are model output, including model forecasted concentrations of the five criteria air pollutants, forecasted daily mean PM2.5 composition concentrations (SO4, NO3, NH4, EC and OC), and four meteorological variables (i.e., wind speed, temperature, planetary boundary layer heights, and relative humidity). We tested two methods for feature selection: (1) a linear regression model (denoted as LM); and (2) the random forest algorithm (denoted as RF). The LM method constructed a linear regression model with the PM2.5 forecast biases being the explained variable and the candidate variables being the explanatory variables. Those explanatory variables with p-value < 0.05 [35,36] were retained as informative variables for analog determination. With the RF method [37], the variables with large importance indicators are selected as informative variables. We implemented these feature selection algorithm with the R software (the lm function for LM and the Boruta function for RF) [38].
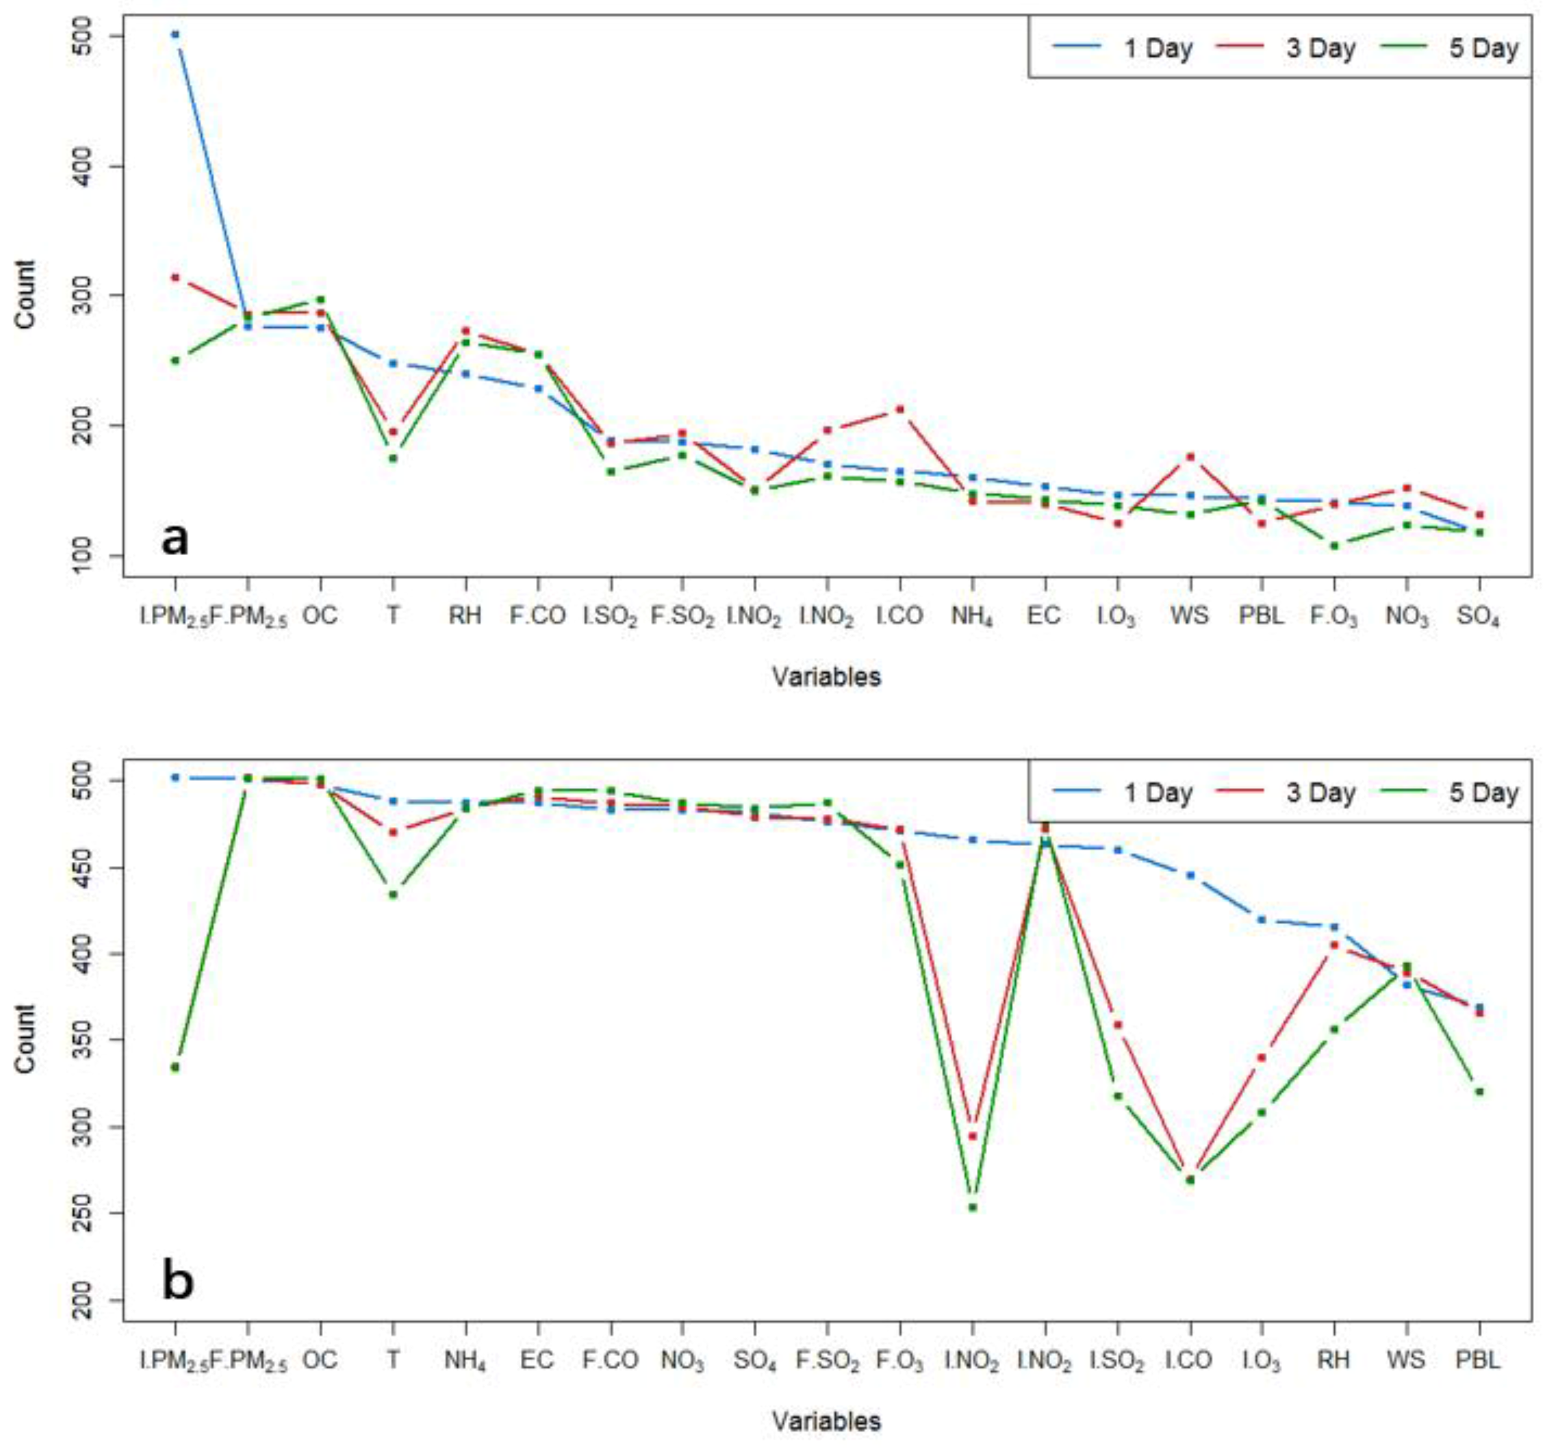
Figure 3 shows the number counts of the avg-monitors that selected each candidate variable by the LM and RF algorithms. On average, the LM algorithm selected about six informative variables for each avg-monitors. In contrast, the RF algorithm selected about 15 on average. This difference is likely an indication that RF is less effective than LM at distinguishing the information content among variables. As we will find out later in our analysis (Table 1), a method involving LM (e.g., the CART-LM-KF-AN method, see definition in Figure 2) often outperformed a method involving RF (e.g., CART-RF-KF-AN). This comparison highlights the importance of a proper feature selection procedure.
Among the 19 variables, PM2.5 observations on the initial day of the forecast cycle (I.PM2.5) and CMAQ PM2.5 forecast (F.PM2.5) were the top two most selected variables for the 1-day lead time, indicating that they contain the most information about the short-term model forecast errors. As expected, the I.PM2.5 is less informative for longer lead times, resulting in a decrease in selection counts by the LM algorithm for the 3 and 5 day lead times (Figure 3). For all lead times in question, model-forecast air pollutant variables, such as F.PM2.5, OC, and F.CO, and meteorological variables, such as RH, were also frequently selected by the LM algorithm at many avg-monitors. The forecasted OC and F.CO were frequently selected, likely because they are indicative of model biases in emissions and transport.

2.3.2. Analog Determination

In the “analog determination” step, we search for a “forecast analog”, an ensemble of previous model forecasts that are similar to the current forecast to be corrected [16,21]. The bias information in the forecast analog is then used to estimate the correction to be applied in the current forecast in the following “local correction estimation” step. The similarity between current and historic forecasts is measured in terms of the informative variables we selected in the “feature selection” step, using two different methods: (1) Euclidean distance between two forecasts in the feature space (denoted as DIST) and (2) classification predicted by the CART algorithm [39] (denoted as CART). The CART algorithm generates a decision tree which minimizes the total deviations within the branches of the tree. The algorithm is widely used in remote sensing image processing for land cover classification [40,41], ecology modeling [42,43] and pattern recognition studies [44]. We implemented the CART calculation with the rpart() function in the R software [38].

2.3.3. Local Correction Estimation

In the “local correction estimation” step, we estimated the forecast bias at individual avg-monitors based on the “forecast analog” determined in the previous “analog determination” step.
A straightforward way to estimate the bias is the Distance-based Analog (DIST-AN) method, which takes an inverse distance weighted average of the biases in the forecast analog.
P M c p , T + k = P M p , T + k δ T + k = P M p , T + k m = 1 M P M p , t m P M o , t m d t m , T + k m = 1 M 1 d t m , T + k
where the P M c p , T + k and P M p , T + k , respectively, refer to the corrected and raw model forecasts of the PM2.5 concentrations. δ T + k refers to the correction, which is calculated by the inverse distance weighted mean forecast biases of the M analogs.
In addition to the inverse distance weighted average, the Kalman filter (KF), known for its easy implementation, fast convergence speed, and effectiveness at eliminating data noises, is also tested in this study to estimate forecast errors. The Kalman filter works on an ordered set of inputs. Previous studies have used the input dataset ordered by time [26,45]. In this study, we implemented the Kalman filter on a set of analogs ordered by distances. The Kalman filter used a dynamic weighting method to fuse the observations and estimations at time t, as shown in the equation below:
x ^ t + 1 | t = x ^ t | t 1 + K t ( y t x ^ t | t 1 )
where the x ^ t + 1 | t refers to the estimation of forecast error at the time t+1 using the information at time t. The x ^ t | t 1 denotes the forecast error estimation at the time t. The y t refers to the observed forecast error at time t. The weighting factor Kt was called Kalman gain, which was calculated through the optimization of estimation and observation noises. The detailed approach for Kt estimation can be found in Delle Monache, Nipen, Liu, Roux, and Stull [23]. Depending on the methods used in the “analog determination” step, the Kalman filter is applied in the Distance-based Kalman Filtering Analog (DIST-KF-AN) method, the CART linear model Kalman Filtering Analog (CART-LM-KF-AN) method, and the CART random forest Kalman Filtering Analog (CART-RF-KF-AN) method.
Additionally, we also tested the 7-day Moving Average (7-Day-MA). With this method, the correction is computed as the average of the forecast biases in a 7-day window prior to the forecasting cycle. This method is chosen for its fast computation and easy implementation. The 7-day window length has also been used in previous studies on model post-correction [16,23]. The 7-Day-MA method can be regarded as a special case of the analog method, in which the 7 days prior to the forecasting cycle are the forecast analog and each day is weighted equally.

2.3.4. Correction Spread

After the “local correction estimation” is done, we further spread the estimated corrections at avg-monitors to the entire domain including model grids containing no monitors. The corrections were then applied to the original gridded model forecast to obtain bias-corrected forecasts over the whole China domain. In this study, we used ordinary Kriging [46] to spatially interpolate the biases from monitors to the entire domain.

2.4. Evaluation

Following the post-process framework, we tested five combinations of methods (Figure 2). For example, the CART-LM-KF-AN method uses the LM method for “feature selection”, the CART method for “analog determination”, and the KF method for “local correction estimation”. Readers can refer to Figure 2 for an illustration of how varied methods for each step are combined. To evaluate the performance in varied steps of the procedure, we reported separately the performance statistics for the “local correction estimation” and “correction spread” steps. The reported performance statistics include the coefficient of determination (R2), the normalized mean error (NME), and the root mean square error (RMSE) [16].
The observation and model outputs from 4 February 2014 to 31 December 2015 are used as historic data, with which we selected informative variables and searched for forecast analogs. In the “local correction estimation” step, we used the model output for 2016 to estimate the bias-corrected forecasts at the 545 individual avg-monitors. We then used the corresponding 2016 observations to evaluate the performance after the “local correction estimation” step. Note that not all avg-monitors were used in the “local correction estimation”. After the “correction spread” step, we then used the data from the remaining 211 avg-monitors to evaluate the performance of the “final product” at locations without observations. The 211 avg-monitors were so selected that they were adequately apart from each other and from the 545 avg-monitors that were used in the “local correction estimation”. These 211 avg-monitors are marked as red dots in Figure 1. The performance evaluation was conducted separately for 1-day, 3-day, and 5-day lead forecasts.

3. Results

3.1. Performance in Estimating Local Corrections

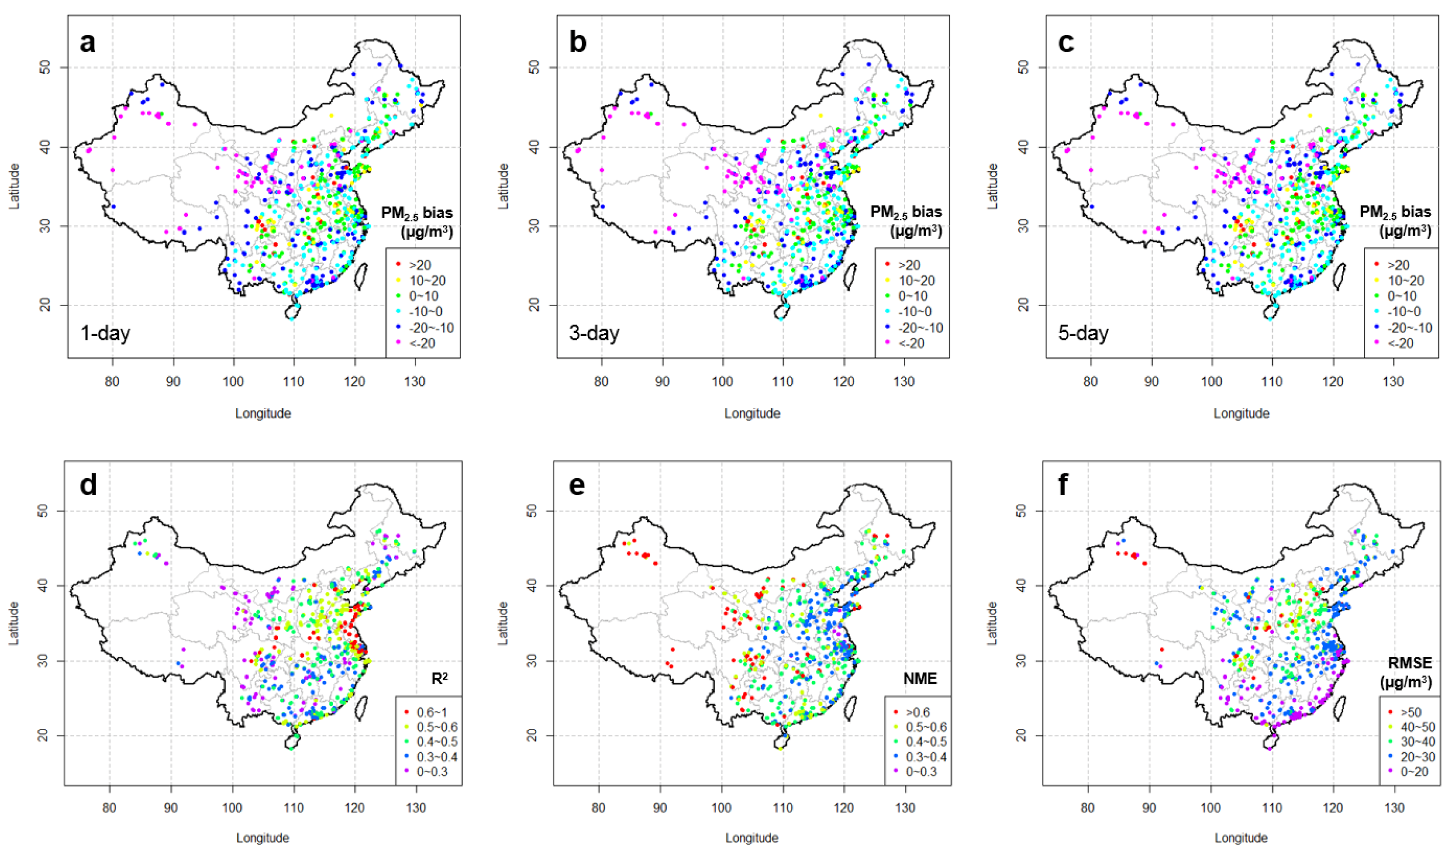
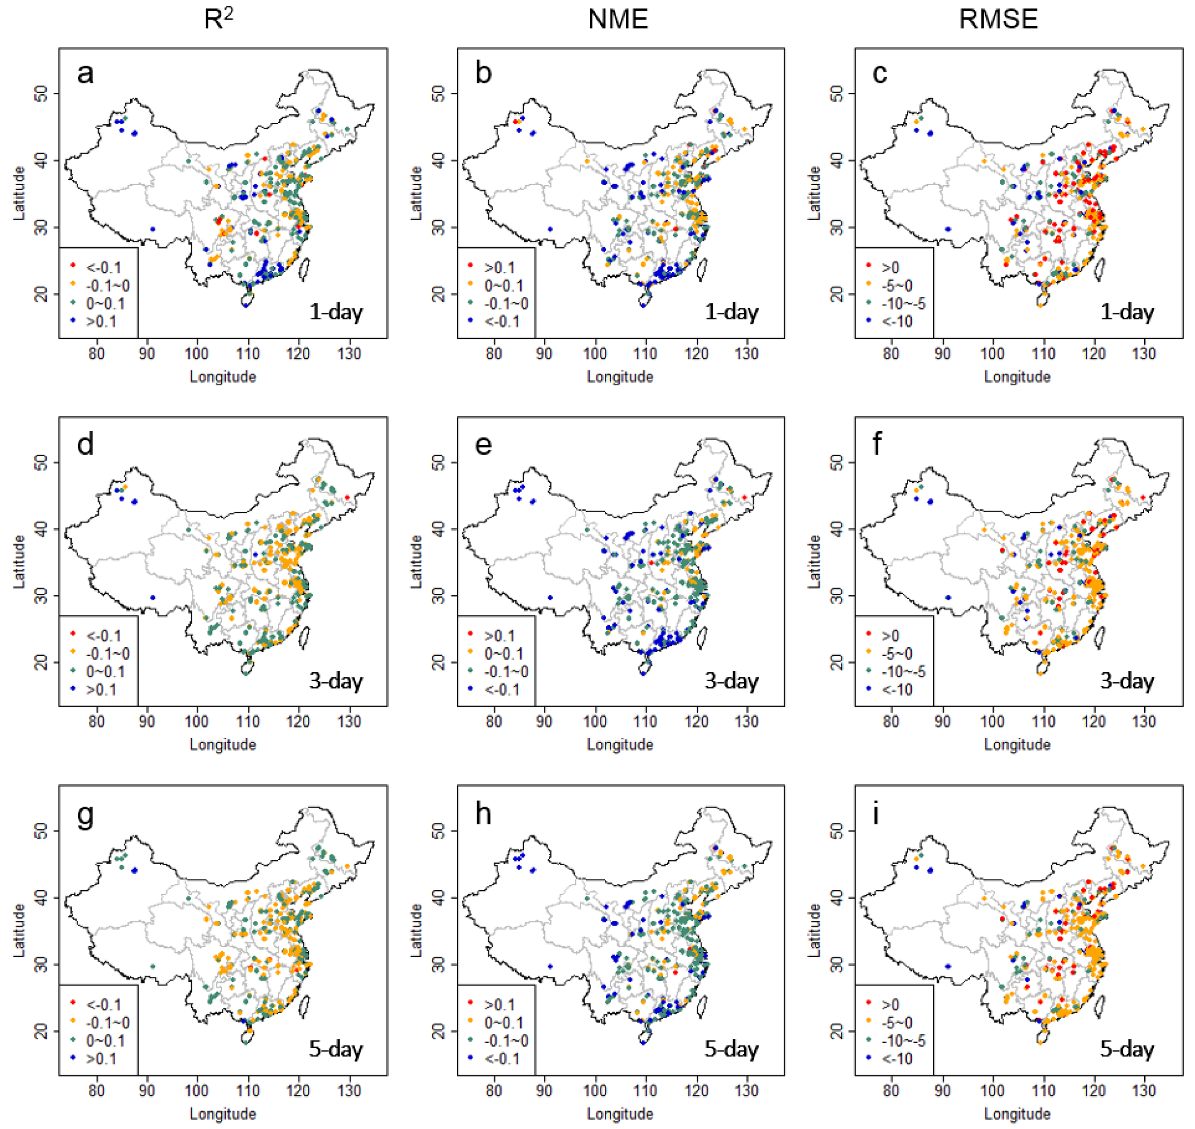
Although up to the “local correction estimation” step we only computed the local corrections at locations with observations, these local corrections were crucial for the performance of the final product. Therefore, in this study, we applied five different methods (Figure 2) and evaluated them at avg-monitors. Figure 4 presents the performance of the raw PM2.5 model forecasts in predicting observations at avg-monitors in 2016. The annual mean biases of model forecasts in 2016 were generally negative in the southern and northwestern part of China, while they were positive (mostly 0–10 µg/m3) in the middle part of China, regardless of the forecast lead-times. According to the distributions of statistical metrics of R2 and NME, the raw model forecast performed much better in North China and East China than in other regions, while it performed much worse in West China. Spatial patterns with geographical divisions in biases and other performance statistical metrics, i.e., R2, NME, and RMSE here, indicate potential non-uniform uncertainties in the emission rates estimation among regions and varied prediction errors in meteorological forecast fields over different terrains. We do observe a significant degradation in the performance of predicting meteorological variables at the surface in regions with complex terrains (results not shown). However, as the lead-time increases, the performance of the raw PM2.5 model forecasts only degrade slightly (Figure 4 and Table 1), implying that the error does not grow much in predicting meteorology during the forecasting period of 144 h.
Table 1 summarizes the performance statistics of each method for different lead times and Table 2 summarizes the percentage changes of the performance statistics with respect to the raw model forecasts. Compared with the raw model forecasts, all the bias-correction methods are able to decrease the NME and the RMSE at all the three lead times. The reductions in the NME are 7.4–19.3%, 7.3–14.4%, and 4.5–12.2%, and the reductions in RMSE are 7.8–16.1%, 7.5–12.5%, and 6.3–11.3% for 1-day, 3-day, and 5-day lead times, respectively, showing that these post-processing techniques are effective to improve the PM2.5 forecast at locations with observations. Figure 5 shows that all methods can improve NME and RMSE at the majority of avg-monitors. For example, the CART-LM-KF-AN method decreases NME and RMSE at about 70% to 80% avg-monitors for all three lead times.
For most of these methods, however, R2 only increases marginally for the 1-day lead time and even decreases slightly in the 3-day and 5-day lead times. For example, DIST-AN decreases the R2 by 17.7% for the 3-day lead time. The ineffectiveness in increasing R2 may reflect that these analog-based methods, although good at reducing biases, do not improve the ability to capture the variability in the data, especially for longer lead times. Among the five methods in question, the CART-LM-KF-AN method has the largest R2 for all the three lead times, with a 6% increase in R2 for the 1-day lead and essentially no change for the 3-day and 5-day leads from the raw model forecast.
The results also show the impact of forecasting lead times on the performance of bias-correction techniques (Table 1 and Table 2, Figure 5). In general, the enhancement in the forecast performance decreases with the longer lead time. The decreasing effectiveness of the post-processing procedure with lead times may partly result from the fact that the increasing uncertainties in the model forecasted meteorology and pollutant concentrations lead to larger uncertainties in the analog determination for the longer lead times. Among the five methods in this study, the performance of the CART-LM-KF-AN method is most insensitive to varied lead times (NME 0.41, 0.43, 0.45, and RMSE 27.5, 27.5, 28.7 ug/m3 for 1-day, 3-day, and 5-day lead times, respectively), showing that the combination of the CART and LM methods constitutes a more robust analog determination algorithm for the PM2.5 model forecast in China. In contrast, the performance of the DIST-AN method (NME 0.40, 0.46, 0.49, and RMSE 27.0, 29.0, 30.3 ug/m3 for 1-day, 3-day, and 5-day lead times, respectively) and the 7-Day-MA method (NME 0.39, 0.43, 0.46 and RMSE 27.0, 27.8, 29.1 ug/m3 for 1-day, 3-day, and 5-day lead time, respectively) degrade significantly with longer lead times. Although the performance of the CART-LM-KF-AN method is similar to or a little worse than the 7-Day-MA and DIST-AN for the 1-day lead time, CART-LM-KF-AN outperforms other methods for a longer lead time, which is a good property for the purpose of dynamic air quality management.

3.2. Performance of the Final Product

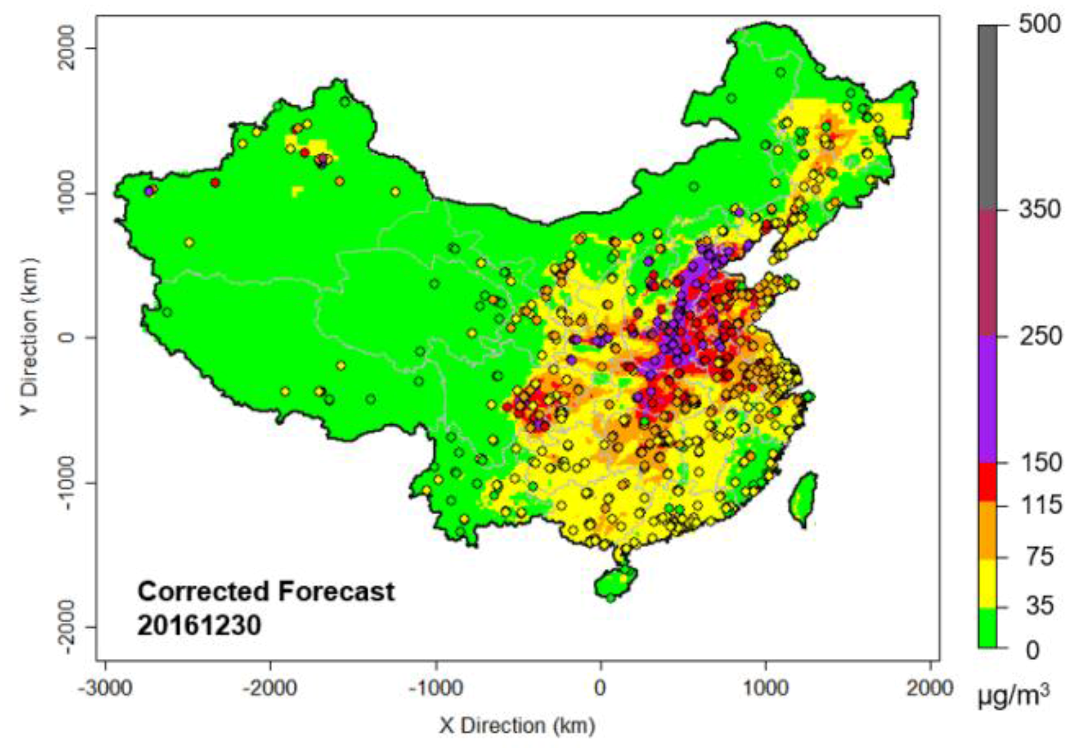
After we estimated the correction for the model forecasts at each of the individual avg-monitors, we spread the local corrections across the entire Chinese domain by spatially interpolating the local corrections with ordinary Kriging. Figure 6 shows an example of the “final product” of a 5-day lead forecast for 30 December 2016, using the CART-LM-KF-AN method.
By comparing the “final product” with observations at 211 avg-monitors (whose data were not used in the “local correction estimation” step), we can evaluate the performance of the “final product” at locations without avg-monitors. Table 3 shows that the correction estimated through the spatial interpolation can also effectively reduce forecast errors, even at locations without PM2.5 monitors. Depending on the methods and lead times, the fraction of avg-monitors that finds improvements in NME and RMSE varies from 50 to 80% (Figure 7). The improvements, for most methods, are slightly less but still comparable to those at locations with observations (Table 1 and Table 3), indicating that, compared to the forecast errors at locations with observations, the uncertainties induced by spatial interpolation are likely insignificant. In other words, the “local correction estimation” (including feature selection and analog determination) rather than “correction spread” is the “bottle-neck” in the post-correction framework. Efforts to further improve the performance should be directed to improve the estimation of local corrections.

3.3. Discussion

In comparison with previous studies conducted in the U.S., our results generally show less improvements (in terms of percentage) from the raw model forecasts. For example, Djalalova, Delle, Monache, and Wilczak [16] used KF-AN (similar to DIST-KF-AN in this study) to post-correct hourly CMAQ PM2.5 forecasts for the 1-day lead time and reduced the MAE values by 65% from 8.5 μg/m3 to 3 μg/m3. Kang, et al. [47] also applied the KF-AN method to daily PM2.5 forecasts and reduced RMSE by 33% from 7.5 μg/m3 to 5 μg/m3. Previous studies have found that the KF- and AN-based methods better perform in lower pollution level regions [28]. The differences in the performance between this and previous studies may result from the fact that PM2.5 levels in China are much higher than in the U.S. Consistent with previous studies, our analysis also shows that the percentage improvements by the CART-LM-KF-AN method are generally larger in relatively cleaner regions (e.g., the Pearl River Delta in South china, Northeast China, and other remote regions) than in heavily polluted regions (e.g., the North China Plain and the Yangtze River Delta in East China) (Figure 8), suggesting that there might be important factors missing in the trained relationship between model biases and predictor variables over polluted regions. One such factor is the fast-changing emissions in both magnitude and distribution in regions such as the North China Plain and the Yangtze River Delta during the modeled three years [48,49,50], a result of increasingly more strict emission control enforcements and/or economic fluctuations. The significant change of emission rates in these regions between the training years (2014–2015) and the prediction year (2016) could confound the trained bias correction relationships. In contrast, the actual emission rates were likely to vary insignificantly in the cleaner regions over the same time period.

4. Conclusions

To improve the PM2.5 forecast, we proposed a bias-correction framework that utilized the relationships between biases and select forecasted and observational variables. The framework consists of four steps: feature selection, analog determination, local correction estimation, and correction spread. We applied this bias-correction framework to PM2.5 forecasts in 2014–2016 over China from the operational AiMa air quality forecasting system using the CMAQ model. Five methods, differing in how to perform feature selection, analog determination, and local correction estimation, were tested in this study, and we found all the five methods were able to improve the overall forecast performance in terms of RMSE and NME, though to a relatively limited degree.
Based on our results, we recommend the CART-LM-KF-AN method. In most cases, the performance of this method is better or comparable to other methods. Particularly, the method shows consistent improvement for longer lead times (3–5 day) when other methods degrade in their performance. This is important for dynamic air quality management, as this type of practice often requires longer lead time.
In comparison with previous studies that were all conducted in areas outside of China, our results generally show fewer improvements (in terms of percentage) from the raw model forecast, especially in regions with much higher pollution levels. A major reason for this is that the fast-changing emissions in high pollution regions of China can confound the relationship between model biases and predictor variables. On the other side, the correction spread is not found to be a significant source of errors at locations without monitors. Future efforts should be directed to improve the performance in the local correction estimation, especially to explore methods that can build relationships that better represent the missing factors of changing emissions.

Acknowledgments

The authors thank the Hangzhou AiMa Technologies, Inc. for providing the archived AiMa 5-day air quality forecasting products for years 2014–2016.

Author Contributions

Baolei Lyu, Yuzhong Zhang, and Yongtao Hu conceived and designed the study; Baolei Lyu gathered data and implemented the algorithm; Baolei Lyu and Yuzhong Zhang performed the analysis; Baolei Lyu, Yuzhong Zhang, and Yongtao Hu wrote the paper.

Conflicts of Interest

The authors declare no conflict of interest.

References

  1. Zhang, Y.L.; Cao, F. Fine particulate matter (PM2.5) in China at a city level. Sci. Rep. 2015, 5, 14884. [Google Scholar] [CrossRef] [PubMed]
  2. Fang, D.; Wang, Q.g.; Li, H.; Yu, Y.; Lu, Y.; Qian, X. Mortality effects assessment of ambient PM2.5 pollution in the 74 leading cities of China. Sci. Total Environ. 2016, 569–570, 1545–1552. [Google Scholar] [CrossRef] [PubMed]
  3. Gao, M.; Saide, P.E.; Xin, J.; Wang, Y.; Liu, Z.; Wang, Y.; Wang, Z.; Pagowski, M.; Guttikunda, S.K.; Carmichael, G.R. Estimates of health impacts and radiative forcing in winter haze in eastern China through constraints of surface PM2.5 predictions. Environ. Sci. Technol. 2017, 51, 2178–2185. [Google Scholar] [CrossRef] [PubMed]
  4. Hu, Y.; Odman, M.T.; Chang, M.E.; Russell, A.G. Operational forecasting of source impacts for dynamic air quality management. Atmos. Environ. 2015, 116, 320–322. [Google Scholar] [CrossRef]
  5. Zhang, Y.; Bocquet, M.; Mallet, V.; Seigneur, C.; Baklanov, A. Real-time air quality forecasting, part I: History, techniques, and current status. Atmos. Environ. 2012, 60, 632–655. [Google Scholar] [CrossRef]
  6. Lv, B.; Cobourn, W.G.; Bai, Y. Development of nonlinear empirical models to forecast daily PM2.5 and ozone levels in three large Chinese cities. Atmos. Environ. 2016, 147, 209–223. [Google Scholar] [CrossRef]
  7. Perez, P.; Salini, G. PM2.5 forecasting in a large city: Comparison of three methods. Atmos. Environ. 2008, 42, 8219–8224. [Google Scholar] [CrossRef]
  8. Eder, B.; Kang, D.; Mathur, R.; Yu, S.; Schere, K. An operational evaluation of the Eta–CMAQ air quality forecast model. Atmos. Environ. 2006, 40, 4894–4905. [Google Scholar] [CrossRef]
  9. Zhang, Y.; Bocquet, M.; Mallet, V.; Seigneur, C.; Baklanov, A. Real-time air quality forecasting, part II: State of the science, current research needs, and future prospects. Atmos. Environ. 2012, 60, 656–676. [Google Scholar] [CrossRef]
  10. Byun, D.; Schere, K.L. Review of the governing equations, computational algorithms, and other components of the models-3 community multiscale air quality (CMAQ) modeling system. Appl. Mech. Rev. 2006, 59, 51–77. [Google Scholar] [CrossRef]
  11. Mckeen, S.; Grell, G.; Peckham, S.; Wilczak, J.; Djalalova, I.; Hsie, E.Y.; Frost, G.; Peischl, J.; Schwarz, J.; Spackman, R. An evaluation of real-time air quality forecasts and their urban emissions over eastern texas during the summer of 2006 second texas air quality study field study. J. Geophys. Res. Atmos. 2009, 114, D7. [Google Scholar] [CrossRef]
  12. Vaughan, J.; Lamb, B.; Frei, C.; Wilson, R.; Bowman, C.; Figueroa-Kaminsky, C.; Otterson, S.; Boyer, M.; Mass, C.; Albright, M.; et al. A numerical daily air quality forecast system for the Pacific Northwest. Bull. Am. Meteorol. Soc. 2004, 85, 549–561. [Google Scholar] [CrossRef]
  13. Otte, T.L.; Pouliot, G.; Pleim, J.E.; Young, J.O.; Schere, K.L.; Wong, D.C.; Lee, P.C.S.; Tsidulko, M.; McQueen, J.T.; Davidson, P.; et al. Linking the Eta model with the community multiscale air quality (CMAQ) modeling system to build a national air quality forecasting system. Weather Forecast. 2005, 20, 367–384. [Google Scholar] [CrossRef]
  14. Zhou, G.Q.; Xu, J.M.; Xie, Y.; Chang, L.Y.; Gao, W.; Gu, Y.X.; Zhou, J. Numerical air quality forecasting over eastern China: An operational application of WRF-Chem. Atmos. Environ. 2017, 153, 94–108. [Google Scholar] [CrossRef]
  15. Binkowski, F.S.; Roselle, S.J. Models-3 community multiscale air quality (CMAQ) model aerosol component 1. Model description. J. Geophys. Res. Atmos. 2003, 108, 335–346. [Google Scholar] [CrossRef]
  16. Djalalova, I.; Delle Monache, L.; Wilczak, J. PM2.5 analog forecast and kalman filter post-processing for the community multiscale air quality (CMAQ) model. Atmos. Environ. 2015, 108, 76–87. [Google Scholar] [CrossRef]
  17. Delle Monache, L.; Nipen, T.; Deng, X.X.; Zhou, Y.M.; Stull, R. Ozone ensemble forecasts: 2. A kalman filter predictor bias correction. J. Geophys. Res. Atmos. 2006, 111, D05308. [Google Scholar] [CrossRef]
  18. Kang, D.W.; Mathur, R.; Rao, S.T. Implementation of real-time bias-corrected o-3 and PM2.5 air quality forecast and their performance evaluations during 2008 over the continental united states. In Air Pollution Modeling and its Application XX; Steyn, D.G., Rao, S.T., Eds.; Springer: Berlin/Heidelberg, Germany, 2010; p. 283. [Google Scholar]
  19. Djalalova, I.; Wilczak, J.; McKeen, S.; Grell, G.; Peckham, S.; Pagowski, M.; DelleMonache, L.; McQueen, J.; Tang, Y.; Lee, P.; et al. Ensemble and bias-correction techniques for air quality model forecasts of surface o-3 and PM2.5 during the texaqs-ii experiment of 2006. Atmos. Environ. 2010, 44, 455–467. [Google Scholar] [CrossRef]
  20. De Ridder, K.; Kumar, U.; Lauwaet, D.; Blyth, L.; Lefebvre, W. Kalman filter-based air quality forecast adjustment. Atmos. Environ. 2012, 50, 381–384. [Google Scholar] [CrossRef]
  21. Delle Monache, L.; Djalalova, I.; Wilczak, J. Analog-based postprocessing methods for air quality forecasting. In Air Pollution Modeling and its Application XXIII; Steyn, D.G., Rao, S.T., Eds.; Springer: Berlin/Heidelberg, Germany, 2014; pp. 237–239. [Google Scholar]
  22. Huang, J.P.; McQueen, J.; Wilczak, J.; Djalalova, I.; Stajner, I.; Shafran, P.; Allured, D.; Lee, P.; Pan, L.; Tong, D.; et al. Improving NOAA NAQFC PM2.5 predictions with a bias correction approach. Weather Forecast. 2017, 32, 407–421. [Google Scholar] [CrossRef]
  23. Delle Monache, L.; Nipen, T.; Liu, Y.; Roux, G.; Stull, R. Kalman filter and analog schemes to postprocess numerical weather predictions. Mon. Weather Rev. 2011, 139, 3554–3570. [Google Scholar] [CrossRef]
  24. Dolman, B.K.; Reid, I.M. Bias correction and overall performance of a VHF spaced antenna boundary layer profiler for operational weather forecasting. J. Atmos. Sol. Terr. Phys. 2014, 118, 16–24. [Google Scholar] [CrossRef]
  25. Mckeen, S.; Wilczak, J.; Grell, G.; Djalalova, I.; Peckham, S.; Hsie, E.Y.; Gong, W.; Bouchet, V.; Menard, S.; Moffet, R. Assessment of an ensemble of seven real-time ozone forecasts over eastern north america during the summer of 2004. J. Geophys. Res. Atmos. 2005, 110, 3003–3013. [Google Scholar] [CrossRef]
  26. Monache, L.D.; Grell, G.A.; Mckeen, S.; Wilczak, J.; Pagowski, M.O.; Peckham, S.; Stull, R.; Mchenry, J.; Mcqueen, J. A kalman-filter bias correction of ozone deterministic, ensemble-averaged, and probabilistic forecasts. Tellus 2006, 60b. [Google Scholar]
  27. Wilczak, J.; Mckeen, S.; Djalalova, I.; Grell, G.; Peckham, S.; Gong, W.; Bouchet, V.; Moffet, R.; Mchenry, J.; Mcqueen, J. Bias-corrected ensemble and probabilistic forecasts of surface ozone over eastern North America during the summer of 2004. J. Geophys. Res. Atmos. 2012, 111, 6443–6445. [Google Scholar] [CrossRef]
  28. Kang, D.; Mathur, R.; Rao, S.T. Real-time bias-adjusted O3 and PM2.5 air quality index forecasts and their performance evaluations over the continental united states. Atmos. Environ. 2010, 44, 2203–2212. [Google Scholar] [CrossRef]
  29. Crooks, J.L.; Özkaynak, H. Simultaneous statistical bias correction of multiple PM2.5 species from a regional photochemical grid model. Atmos. Environ. 2014, 95, 126–141. [Google Scholar] [CrossRef]
  30. Neal, L.S.; Agnew, P.; Moseley, S.; Ordonez, C.; Savage, N.H.; Tilbee, M. Application of a statistical post-processing technique to a gridded, operational, air quality forecast. Atmos. Environ. 2014, 98, 385–393. [Google Scholar] [CrossRef]
  31. Silibello, C.; Bolignano, A.; Sozzi, R.; Gariazzo, C. Application of a chemical transport model and optimized data assimilation methods to improve air quality assessment. Air. Qual. Atmos. Health 2014, 7, 283–296. [Google Scholar] [CrossRef]
  32. Skamarock, W.C.; Klemp, J.B.; Dudhia, J.; Gill, D.O.; Barker, D.M.; Wang, W.; Powers, J.G. A Description of the Advanced Research WRF Version 2; No. NCAR/TN-468+ STR; Mesoscale and Microscale Meteorology Division, National Center For Atmospheric Research: Boulder, CO, USA, 2005.
  33. Zhou, Y.; Wu, Y.; Yang, L.; Fu, L.X.; He, K.B.; Wang, S.X.; Hao, J.M.; Chen, J.C.; Li, C.Y. The impact of transportation control measures on emission reductions during the 2008 olympic games in Beijing, China. Atmos. Environ. 2010, 44, 285–293. [Google Scholar] [CrossRef]
  34. China National Urban Air Quality Real-Time Publishing Platform. Available online: http://106.37.208.233:20035 (accessed on 14 January 2017).
  35. Malik, M.B. Applied linear regression. Technometrics 2005, 47, 371–372. [Google Scholar] [CrossRef]
  36. Jones, P.W.; Quirk, F.H.; Baveystock, C.M.; Littlejohns, P. A self-complete measure of health status for chronic airflow limitation. The st. George’s respiratory questionnaire. Am. Rev. Respir. Dis. 1992, 145, 1321–1327. [Google Scholar] [CrossRef] [PubMed]
  37. Chen, Y.W.; Lin, C.J. Combining svms with various feature selection strategies. In Feature Extraction; Guyon, I., Nikravesh, M., Gunn, S., Zadeh, L.A., Eds.; Springer: Berlin/Heidelberg, Germany, 2006; Volume 3, pp. 315–324. [Google Scholar]
  38. Team, R.C. R: A Language and Environment for Statistical Computing; The R Team: Vienna, Austria, 2016. [Google Scholar]
  39. Breiman, L.; Friedman, J.H.; Olshen, R.; Stone, C.J. Classification and regression trees. Biometrics 1984, 40, 358. [Google Scholar]
  40. Liu, J.; Sun, D.; He, F.; Zhang, W.; Guan, X. Land use/cover classification with classification and regression tree applied to MODIS imagery. J. Appl. Sci. 2013, 13, 3070–3773. [Google Scholar]
  41. Youssef, A.M.; Pourghasemi, H.R.; Pourtaghi, Z.S.; Al-Katheeri, M.M. Landslide susceptibility mapping using random forest, boosted regression tree, classification and regression tree, and general linear models and comparison of their performance at Wadi Tayyah Basin, asir region, Saudi Arabia. Landslides 2016, 13, 839–856. [Google Scholar] [CrossRef]
  42. Mertens, M.; Nestler, I.; Huwe, B. Gis-based regionalization of soil profiles with classification and regression trees (CART). J. Plant. Nutr. Soil Sci. 2002, 165, 39–43. [Google Scholar] [CrossRef]
  43. De’Ath, G.; Fabricius, K.E. Classification and regression trees: A powerful yet simple technique for the analysis of complex ecological data. Ecology 2000, 81, 3178–3192. [Google Scholar] [CrossRef]
  44. Jain, A.K.; Duin, R.P.W.; Mao, J. Statistical pattern recognition: A review. IEEE Trans. Pattern Anal. 2000, 22, 4–37. [Google Scholar] [CrossRef]
  45. Kang, D.; Mathur, R.; Rao, S.T.; Yu, S. Bias adjustment techniques for improving ozone air quality forecasts. J. Geophys. Res. Atmos. 2007, 113, 2036–2044. [Google Scholar] [CrossRef]
  46. Oliver, M.A.; Webster, R. Kriging: A method of interpolation for geographical information systems. Int. J. Geogr. Inf. Syst. 1990, 4, 313–332. [Google Scholar] [CrossRef]
  47. Kang, D.; Mathur, R.; Rao, S.T. Assessment of bias-adjusted PM2.5 air quality forecasts over the continental united states during 2007. Geosci. Model. Dev. 2009, 2, 309–320. [Google Scholar]
  48. Duncan, B.N.; Lamsal, L.N.; Thompson, A.M.; Yoshida, Y.; Lu, Z.F.; Streets, D.G.; Hurwitz, M.M.; Pickering, K.E. A space-based, high-resolution view of notable changes in urban NOX pollution around the world (2005–2014). J. Geophys. Res. Atmos. 2016, 121, 976–996. [Google Scholar] [CrossRef]
  49. Krotkov, N.A.; McLinden, C.A.; Li, C.; Lamsal, L.N.; Celarier, E.A.; Marchenko, S.V.; Swartz, W.H.; Bucsela, E.J.; Joiner, J.; Duncan, B.N.; et al. Aura omi observations of regional SO2 and NO2 pollution changes from 2005 to 2015. Atmos. Chem. Phys. 2016, 16, 4605–4629. [Google Scholar] [CrossRef]
  50. Wu, Y.; Zhang, S.J.; Hao, J.M.; Liu, H.; Wu, X.M.; Hu, J.N.; Walsh, M.P.; Wallington, T.J.; Zhang, K.M.; Stevanovic, S. On-road vehicle emissions and their control in China: A review and outlook. Sci. Total Environ. 2017, 574, 332–349. [Google Scholar] [CrossRef] [PubMed]
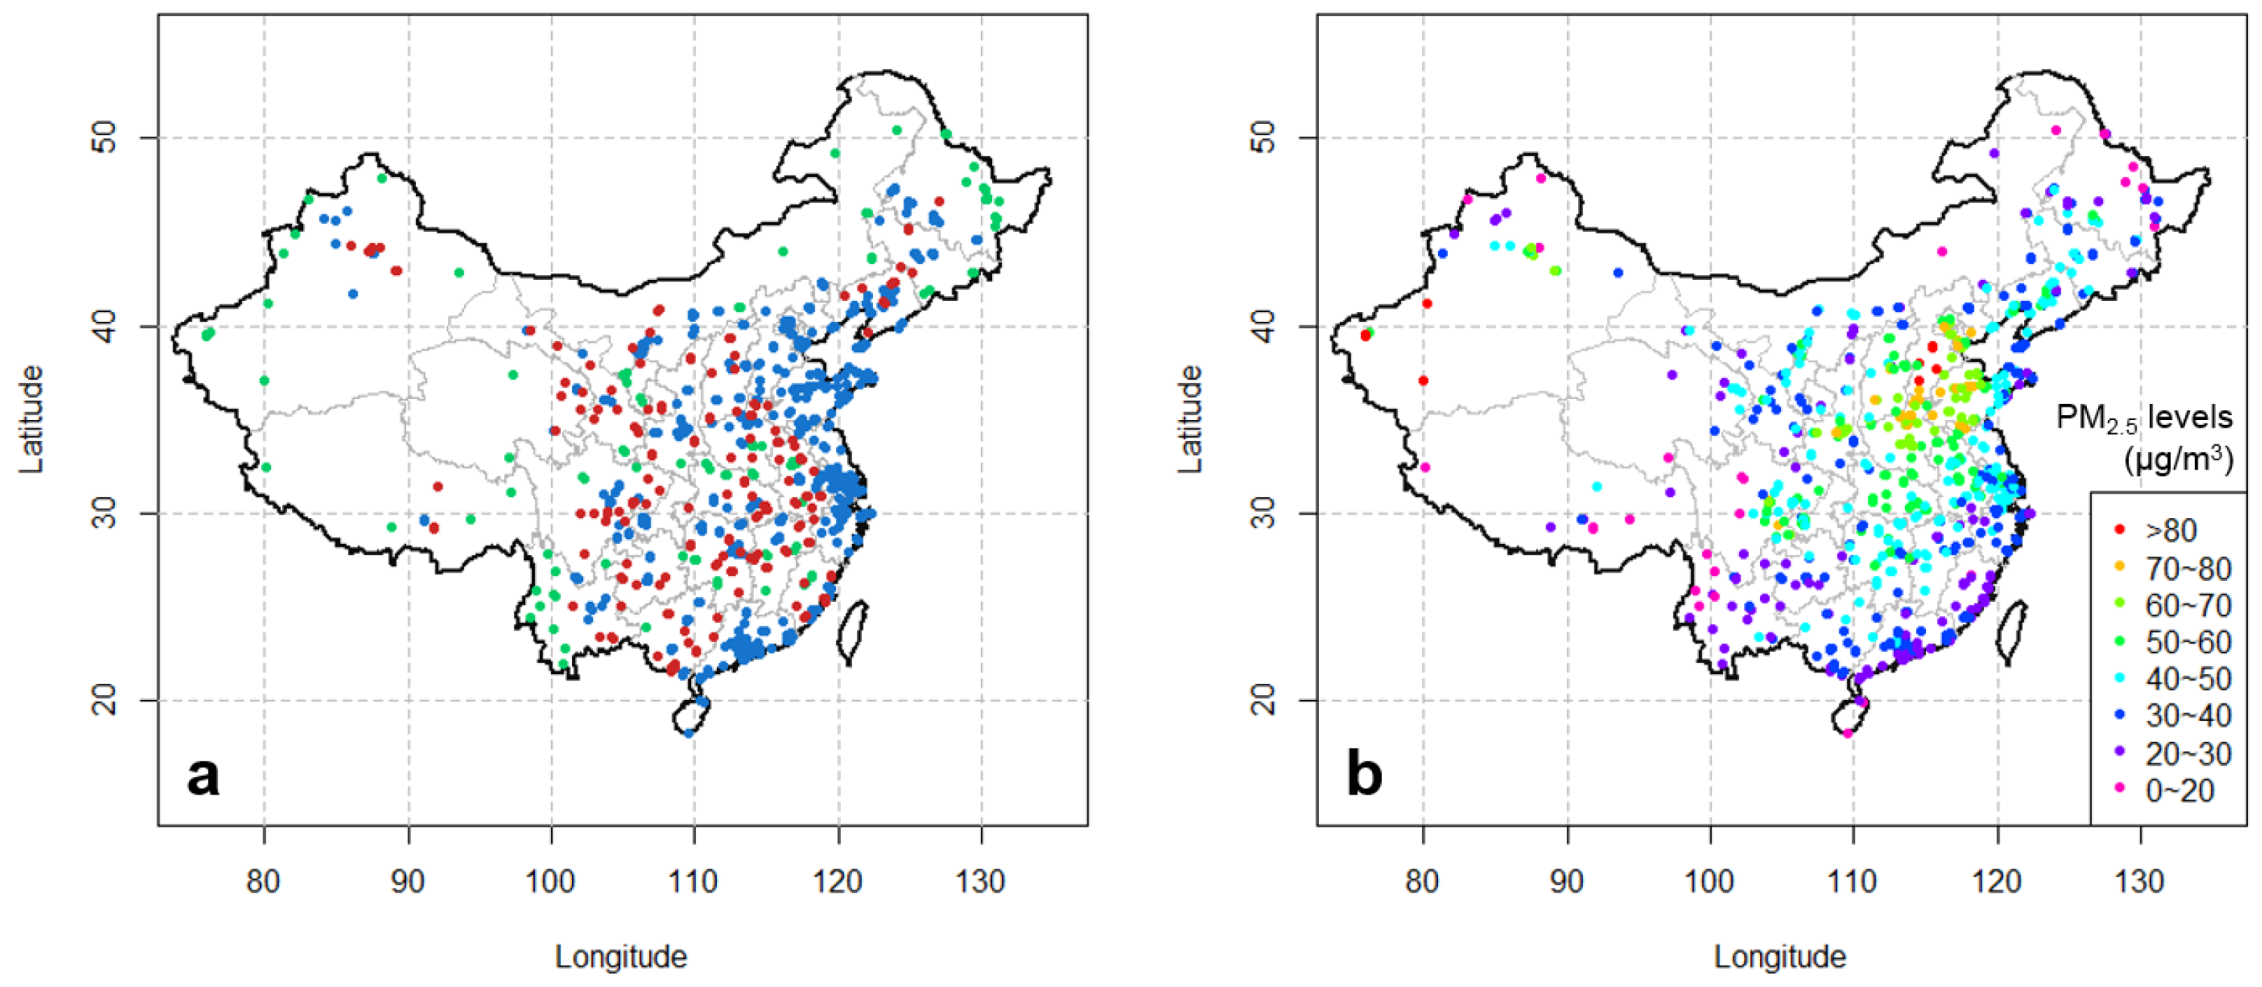
Figure 1. (a) Avg-monitors used in this study. The monitors located in the same grid cell have been averaged to derive avg-monitors. The blue dots denote the monitors operational since 2014. The red and green dots both denote monitors operational since 2015, but the red dots represent monitors that are used for evaluating the “final product”. (b) Annual mean PM2.5 concentrations observed at avg-monitors in 2016.
Atmosphere 08 00147 g001
Figure 2. Bias-correction framework with its four steps and the four method combinations that are tested in this study. The fifth method tested is the 7-day Moving Average (7-Day-MA) method, which can be regarded as a special case within the framework but is not explicitly shown here.
Atmosphere 08 00147 g002
Figure 3. Number counts of the avg-monitors that used each of the 19 features respectively by the linear regression (a) and the random forest (b) based feature selection method.
Atmosphere 08 00147 g003
Figure 4. Performance of the raw PM2.5 model forecasts in predicting observations at avg-monitors in 2016: (a,b,c) annual mean biases for the 1, 3, and 5-day lead times and (d,e,f) annual mean R2, NME, and RMSE for the 1-day lead-time.
Atmosphere 08 00147 g004
Figure 5. Percentage (%) of avg-monitors with increased R2 values (a), and decreased NME (b) and RMSE values (c) by the five post-correction methods and for the 1, 3, and 5-day lead times.
Atmosphere 08 00147 g005
Figure 6. Bias-corrected CMAQ PM2.5 forecast over China for 30 December 2016 (5-day lead time) by the CART-LM-KF-AN method. The dots represent observed PM2.5 levels.
Atmosphere 08 00147 g006
Figure 7. Percentage (%) of avg-monitors with increased R2 values (a) and decreased NME (b) and RMSE values (c) by the five post-correction methods and for the 1, 3, and 5-day lead times by spatially interpolating the estimated biases.
Atmosphere 08 00147 g007
Figure 8. The difference in R2 (a,d,g), NME (b,e,h), and RMSE (c,f,i) values between bias-corrected forecasts by the CART-LM-KF-AN method and raw CMAQ forecasts (Corrected forecast minus raw forecasts) at the 545 avg-monitors for the 1, 3, and 5-day lead times. The differences in RMSE is in µg/m3.
Atmosphere 08 00147 g008
Table 1. Performance statistics, R2, NME, and RMSE (in ug/m3) after the “local correction estimation” step.
Lead TimeMetricsRaw7-Day-MADIST-ANDIST-KF-ANCART-RF-KF-ANCART-LM-KF-AN
1 dayR20.460.450.460.480.480.49
NME0.490.390.400.400.450.41
RMSE32.227.027.027.229.727.5
3 dayR20.380.350.330.370.380.39
NME0.500.430.460.450.440.43
RMSE31.427.829.028.028.227.5
5 dayR20.340.310.280.310.330.34
NME0.510.460.490.470.460.45
RMSE32.429.130.328.829.528.7
Table 2. Percentage changes (%) of the performance statistics with respect to original model forecast by the five methods in the “correction estimation” step.
Lead TimeMetrics7-Day-MADIST-ANDIST-KF-ANCART-RF-KF-ANCART-LM-KF-AN
1 dayR2−2.70.33.13.56.1
NME−19.3−18.3−17.3−7.4−14.7
RMSE−16.0−16.1−15.6−7.8−14.6
3 dayR2−8.3−13.3−4.0−1.50.7
NME−13.6−7.3−10.0−12.6−14.4
RMSE−11.6−7.5−10.9−10.1−12.5
5 dayR2−8.9−17.7−7.0−2.0−0.3
NME−11.2−4.5−8.9−10.7−12.2
RMSE−10.0−6.3−11.1−9.0−11.3
Table 3. Performance statistics for R2, NME, and RMSE (in ug/m3) at locations without monitors after correction spread.
Lead TimeMetricsRaw7-Day-MADIST-ANDIST-KF-ANCART-RF-KF-ANCART-LM-KF-AN
1 dayR20.380.330.400.390.440.43
NME0.480.470.420.460.420.41
RMSE28.427.725.627.424.524.3
3 dayR20.340.290.330.340.330.33
NME0.490.470.440.470.440.44
RMSE27.726.825.326.625.825.6
5 dayR20.310.260.290.310.300.30
NME0.500.490.460.480.460.46
RMSE28.327.626.127.126.526.5