An Interactive Web Mapping Visualization of Urban Air Quality Monitoring Data of China


Abstract
1. Introduction
2. Method and Data
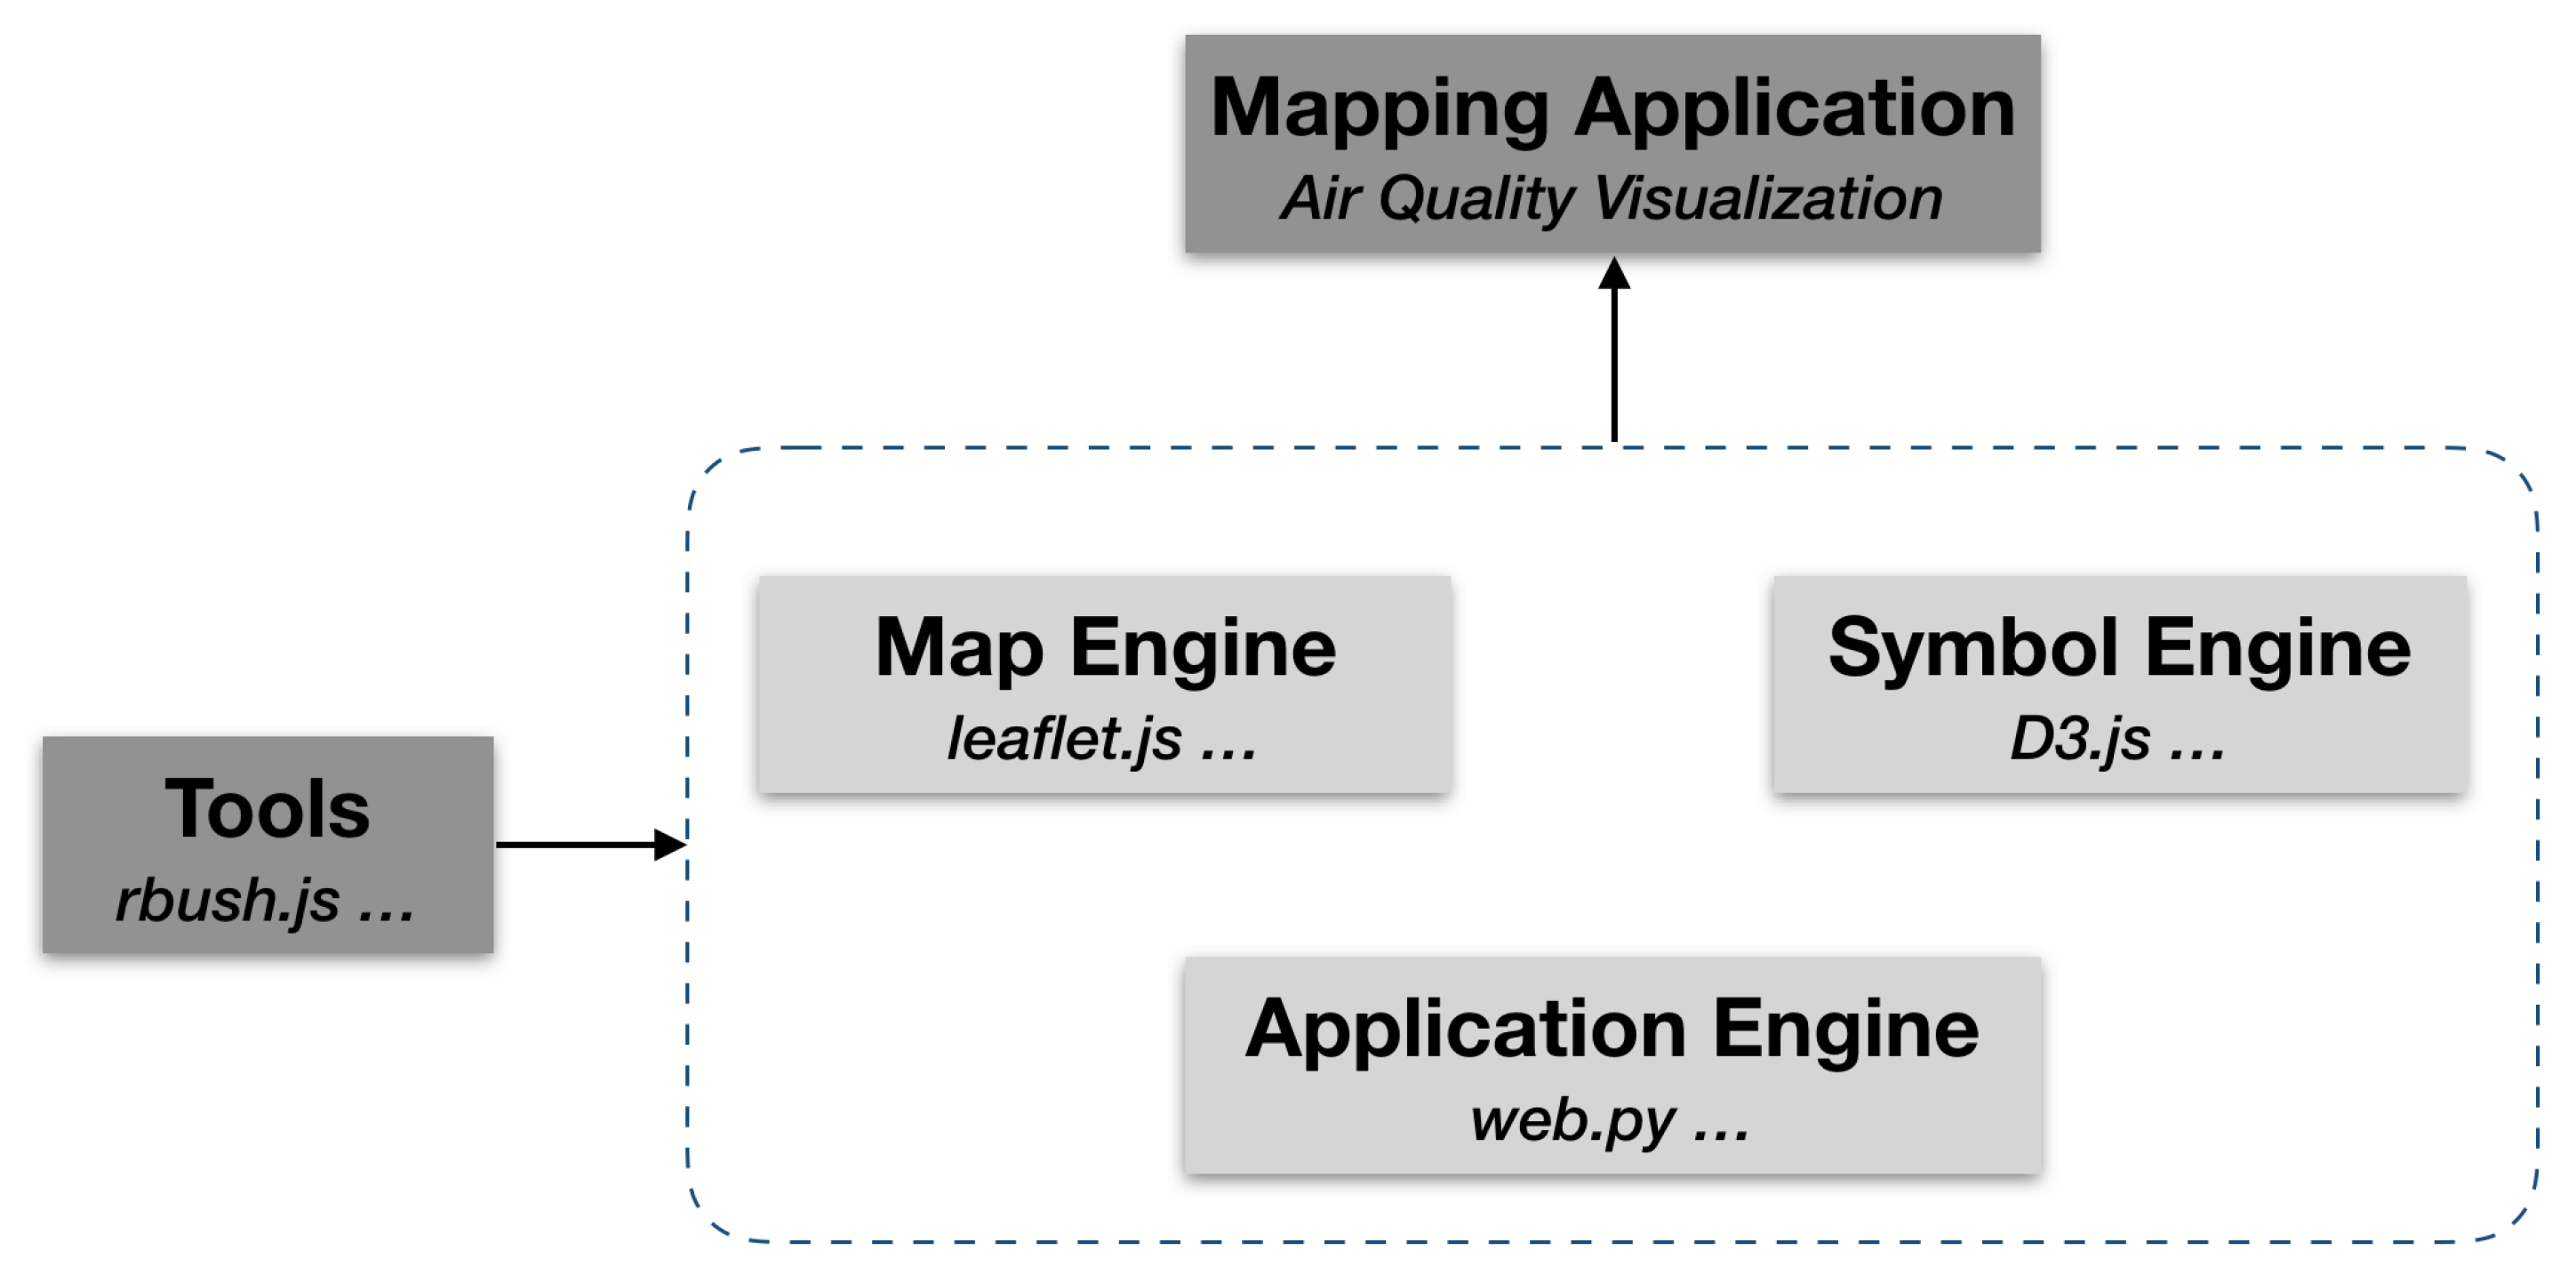
2.1. Air Quality Mapping Technologies and Framework
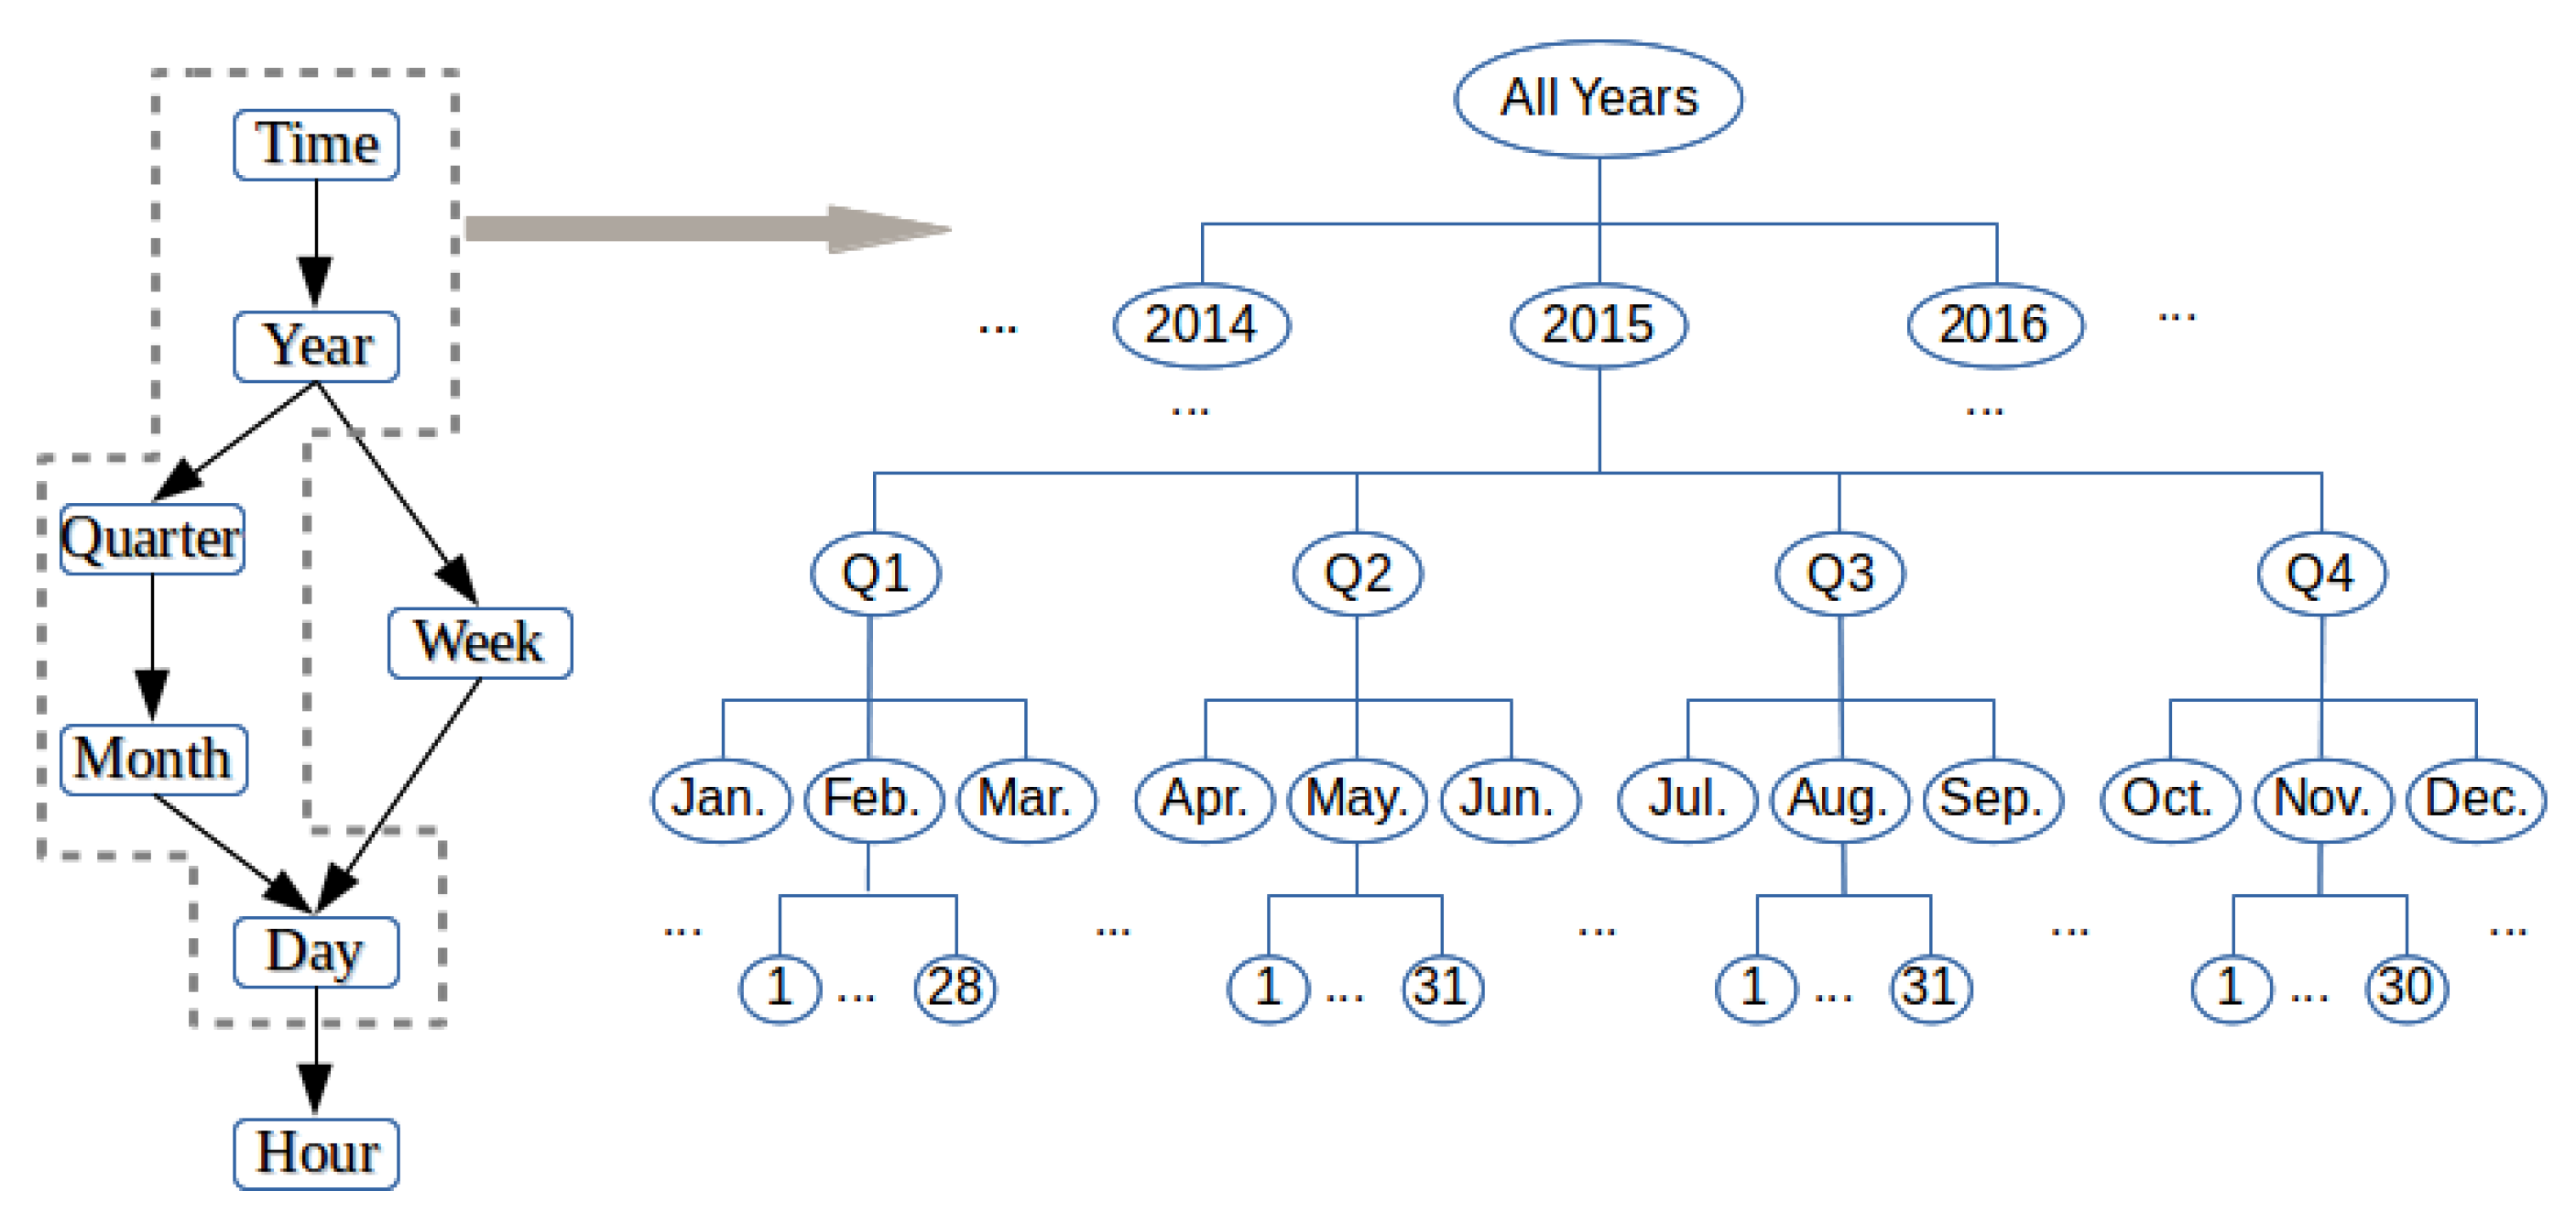
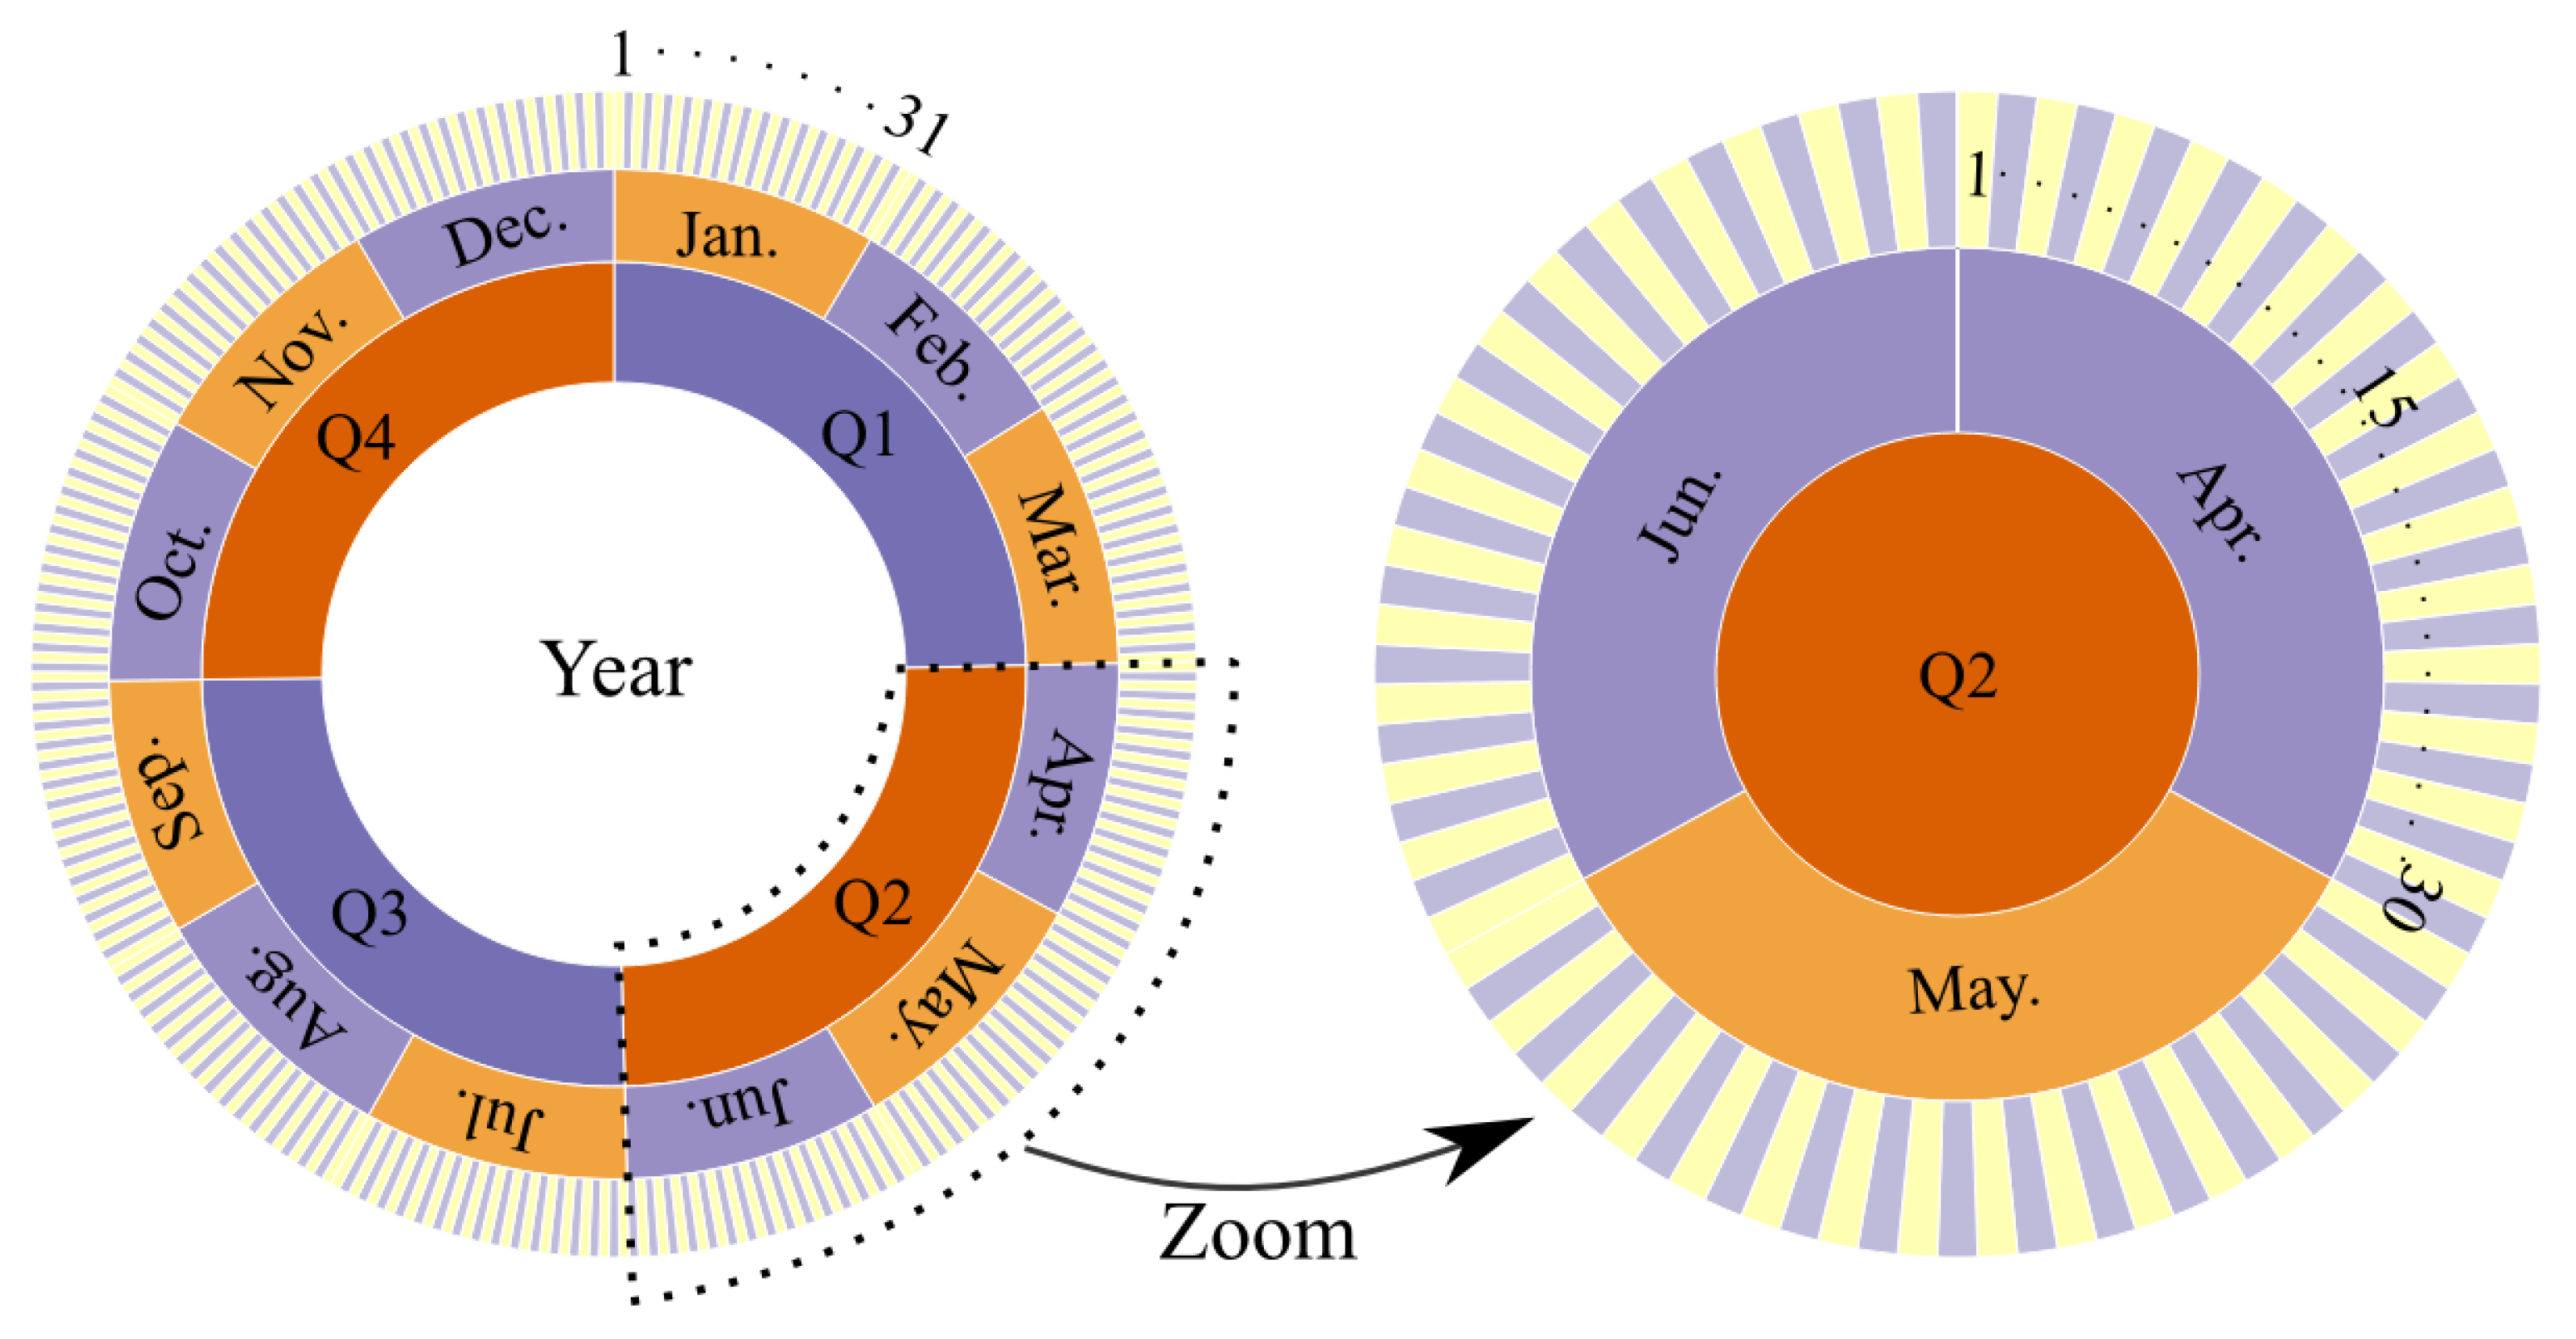
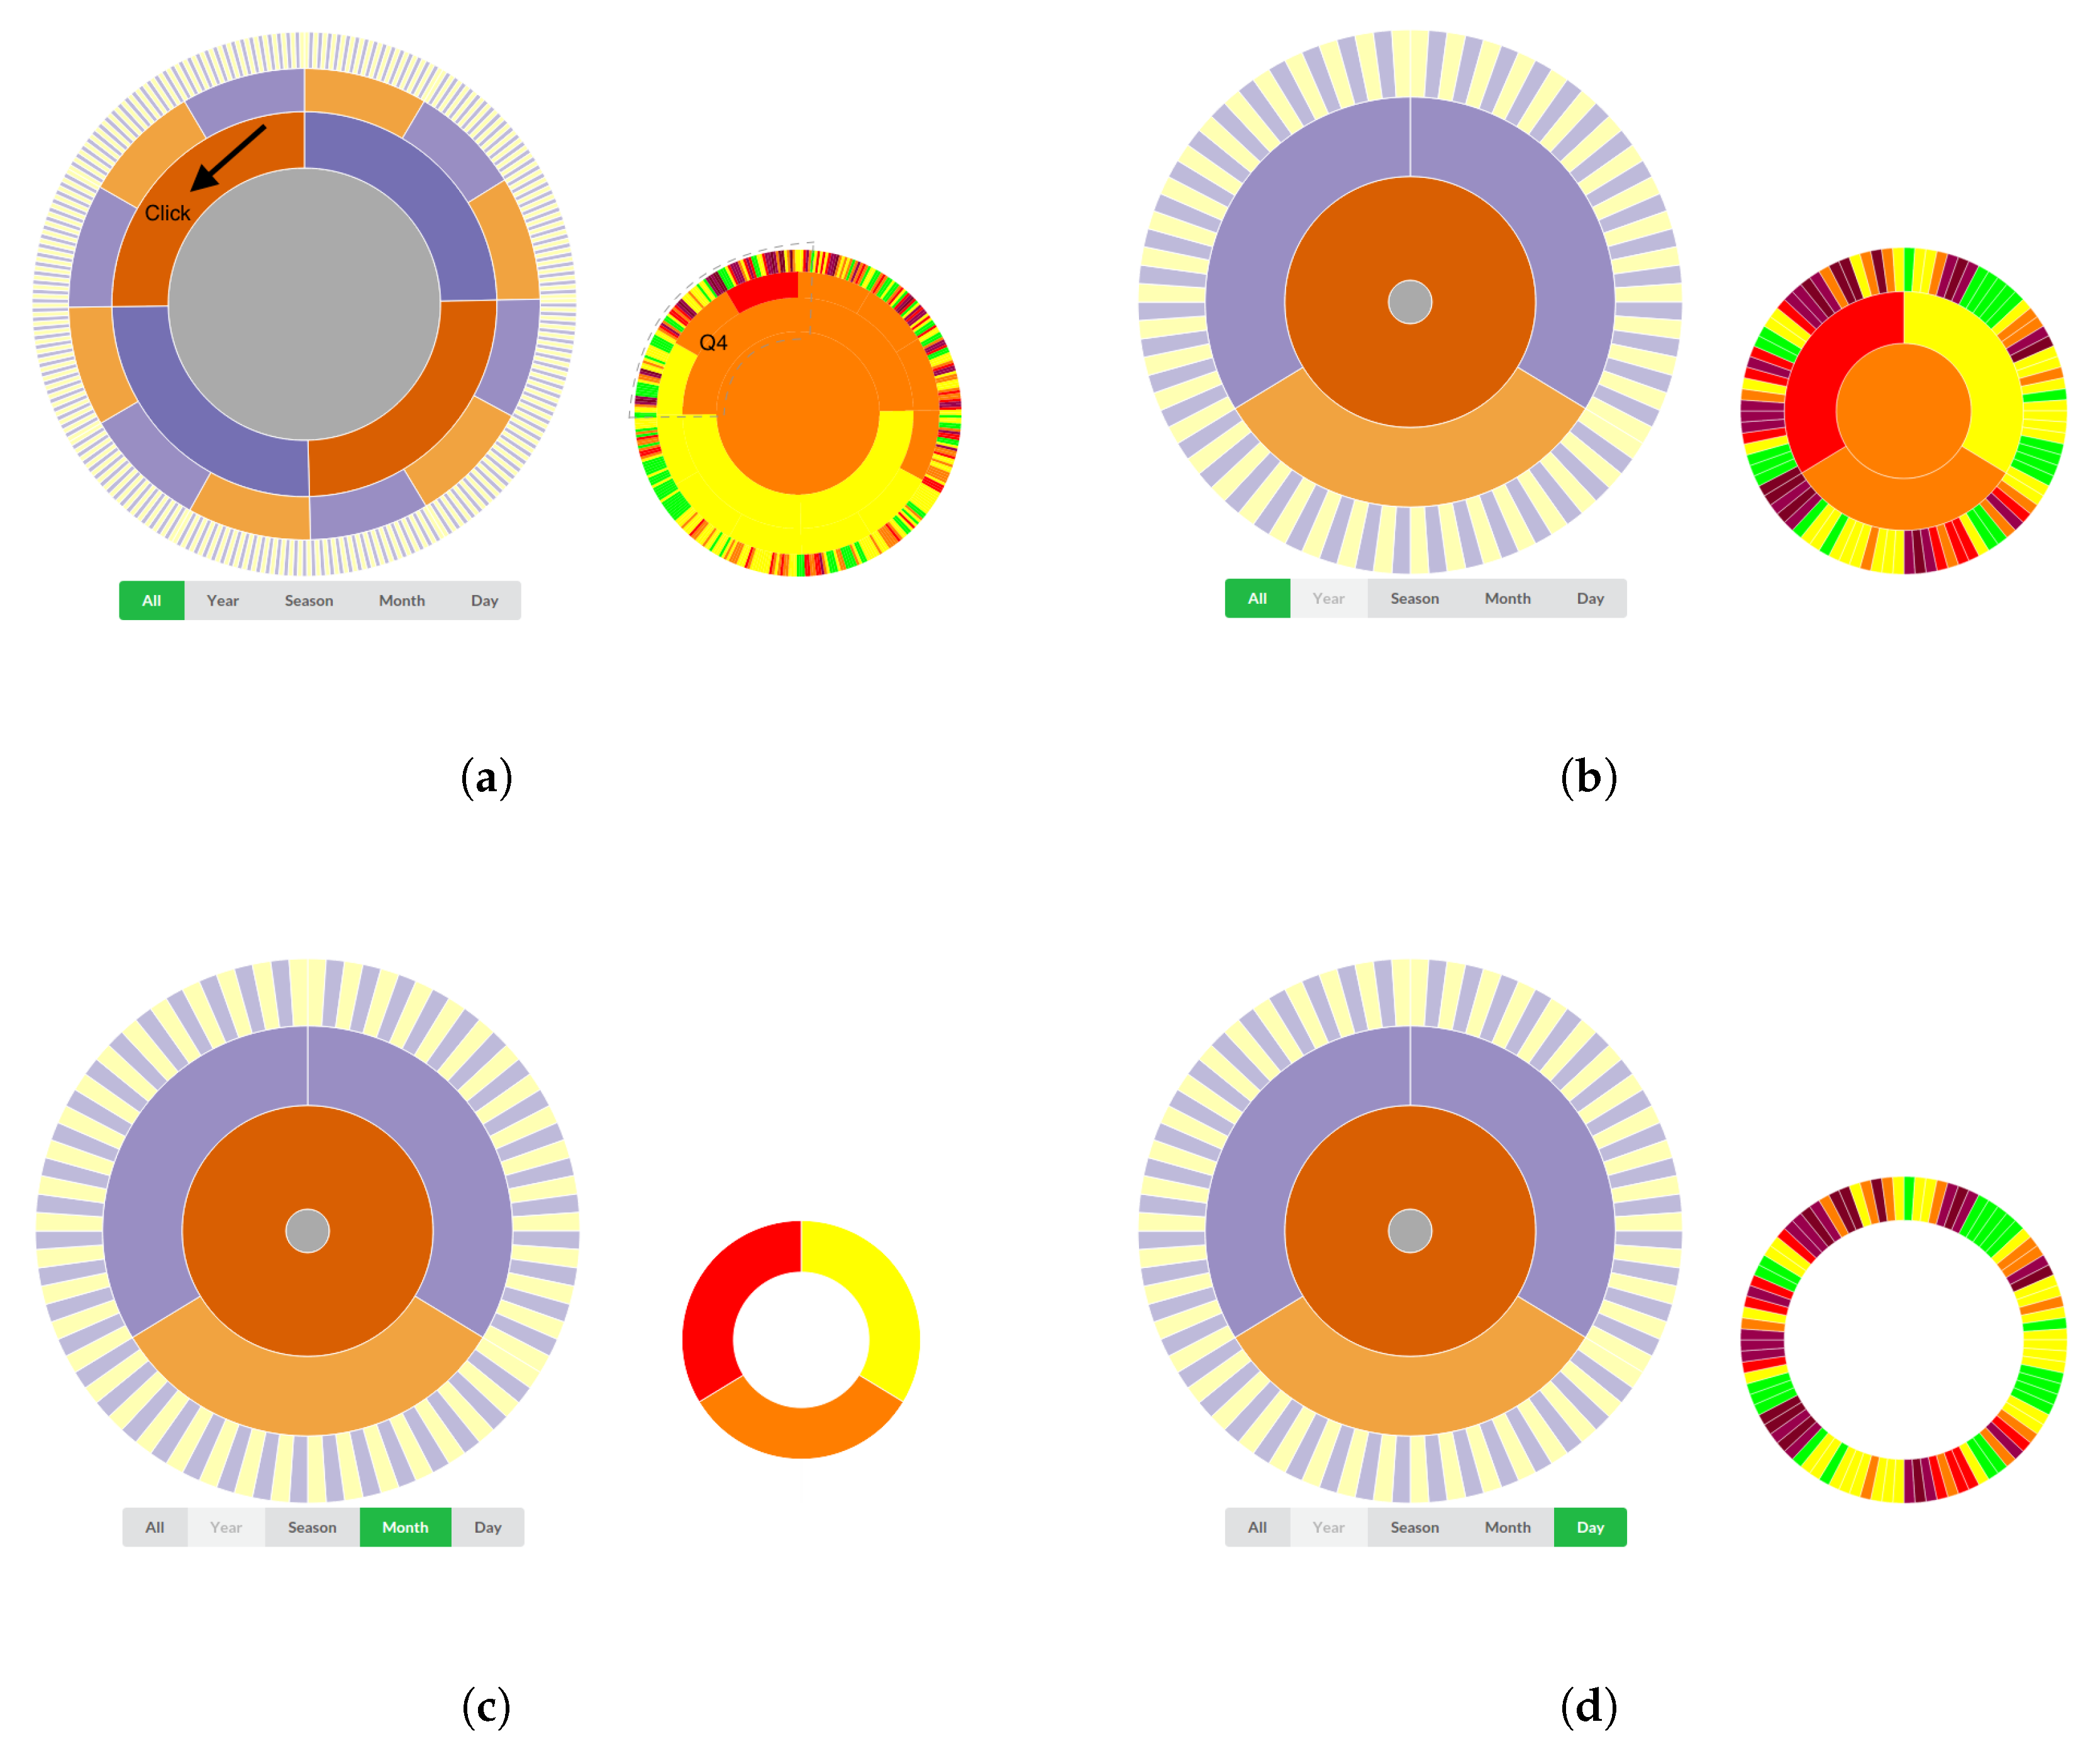
2.2. Time Series Map Symbol Encoding: timezoom.js
- is the time hierarchy structure that will be calculated;
- is the time series values’ array, such as the 365 days of one year data value array, {};
- is the time system for hierarchy construction, such as {}. This can be decided by users and can be extended to hours, minutes and seconds levels, as shown in Figure 2;
- is the operation for the value aggregation from the lower time level to the higher time level. This can be any statistical method for aggregation, such as average, median, quantile, etc.
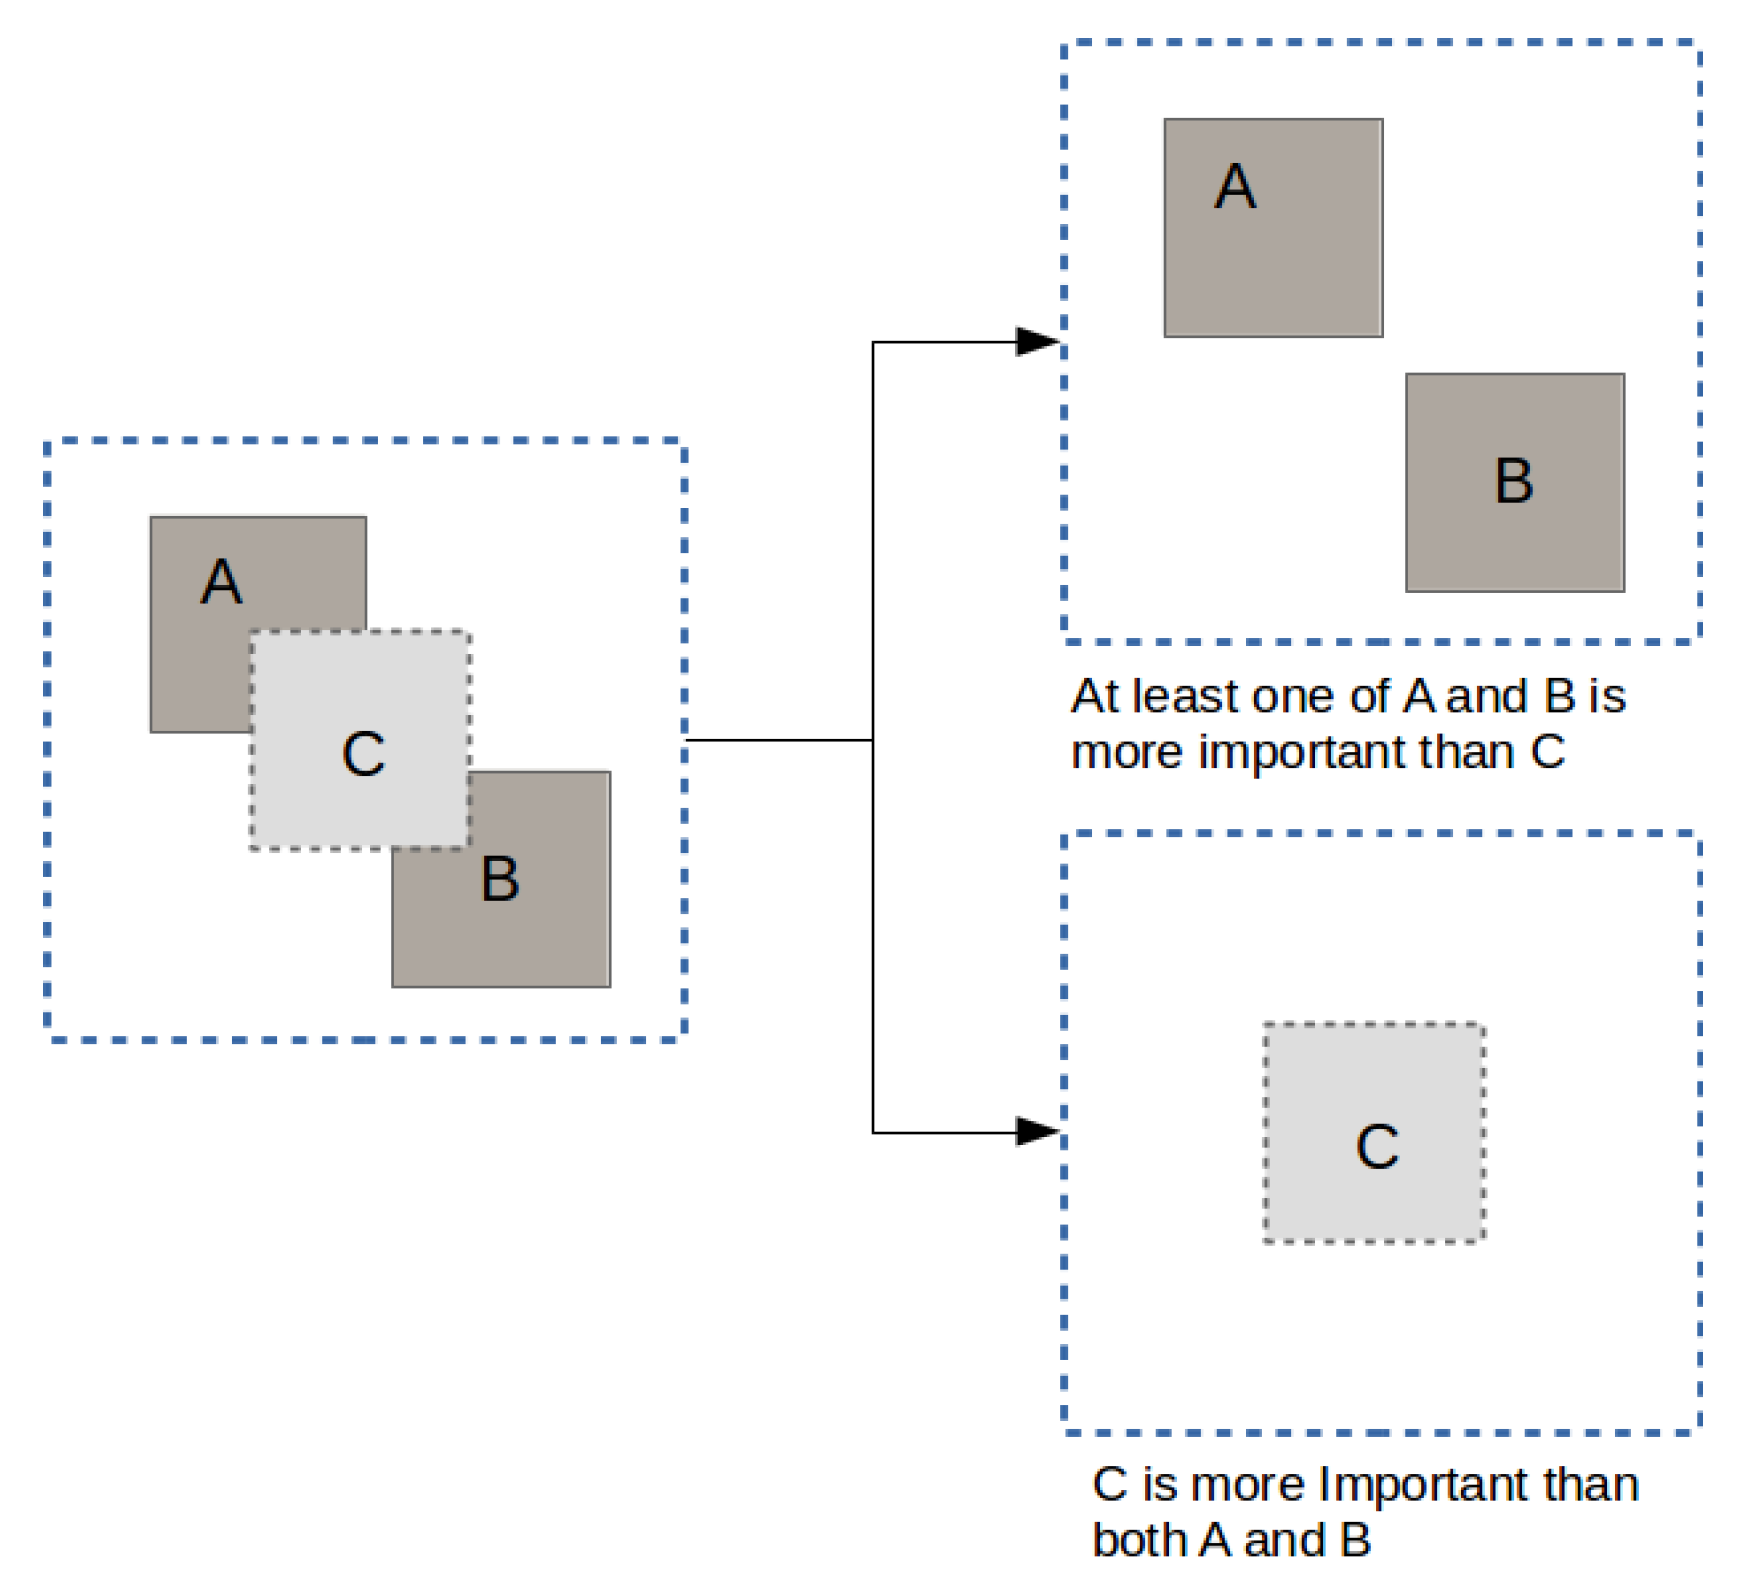
2.3. Adaptive Map Symbol Control: symadaptive.js
2.4. Data Sources and Processing
- is the individual Air Quality Index of pollutant P,
- is the concentration of pollutant P,
- is the the concentration division point of pollution P that is ,
- is the concentration breakpoint of pollution P that is ,
- is the index division point (Table 3) corresponding to ,
- is the index division point (Table 3) corresponding to .
3. Results and Discussion
3.1. Air Quality Data Map Visualization Design
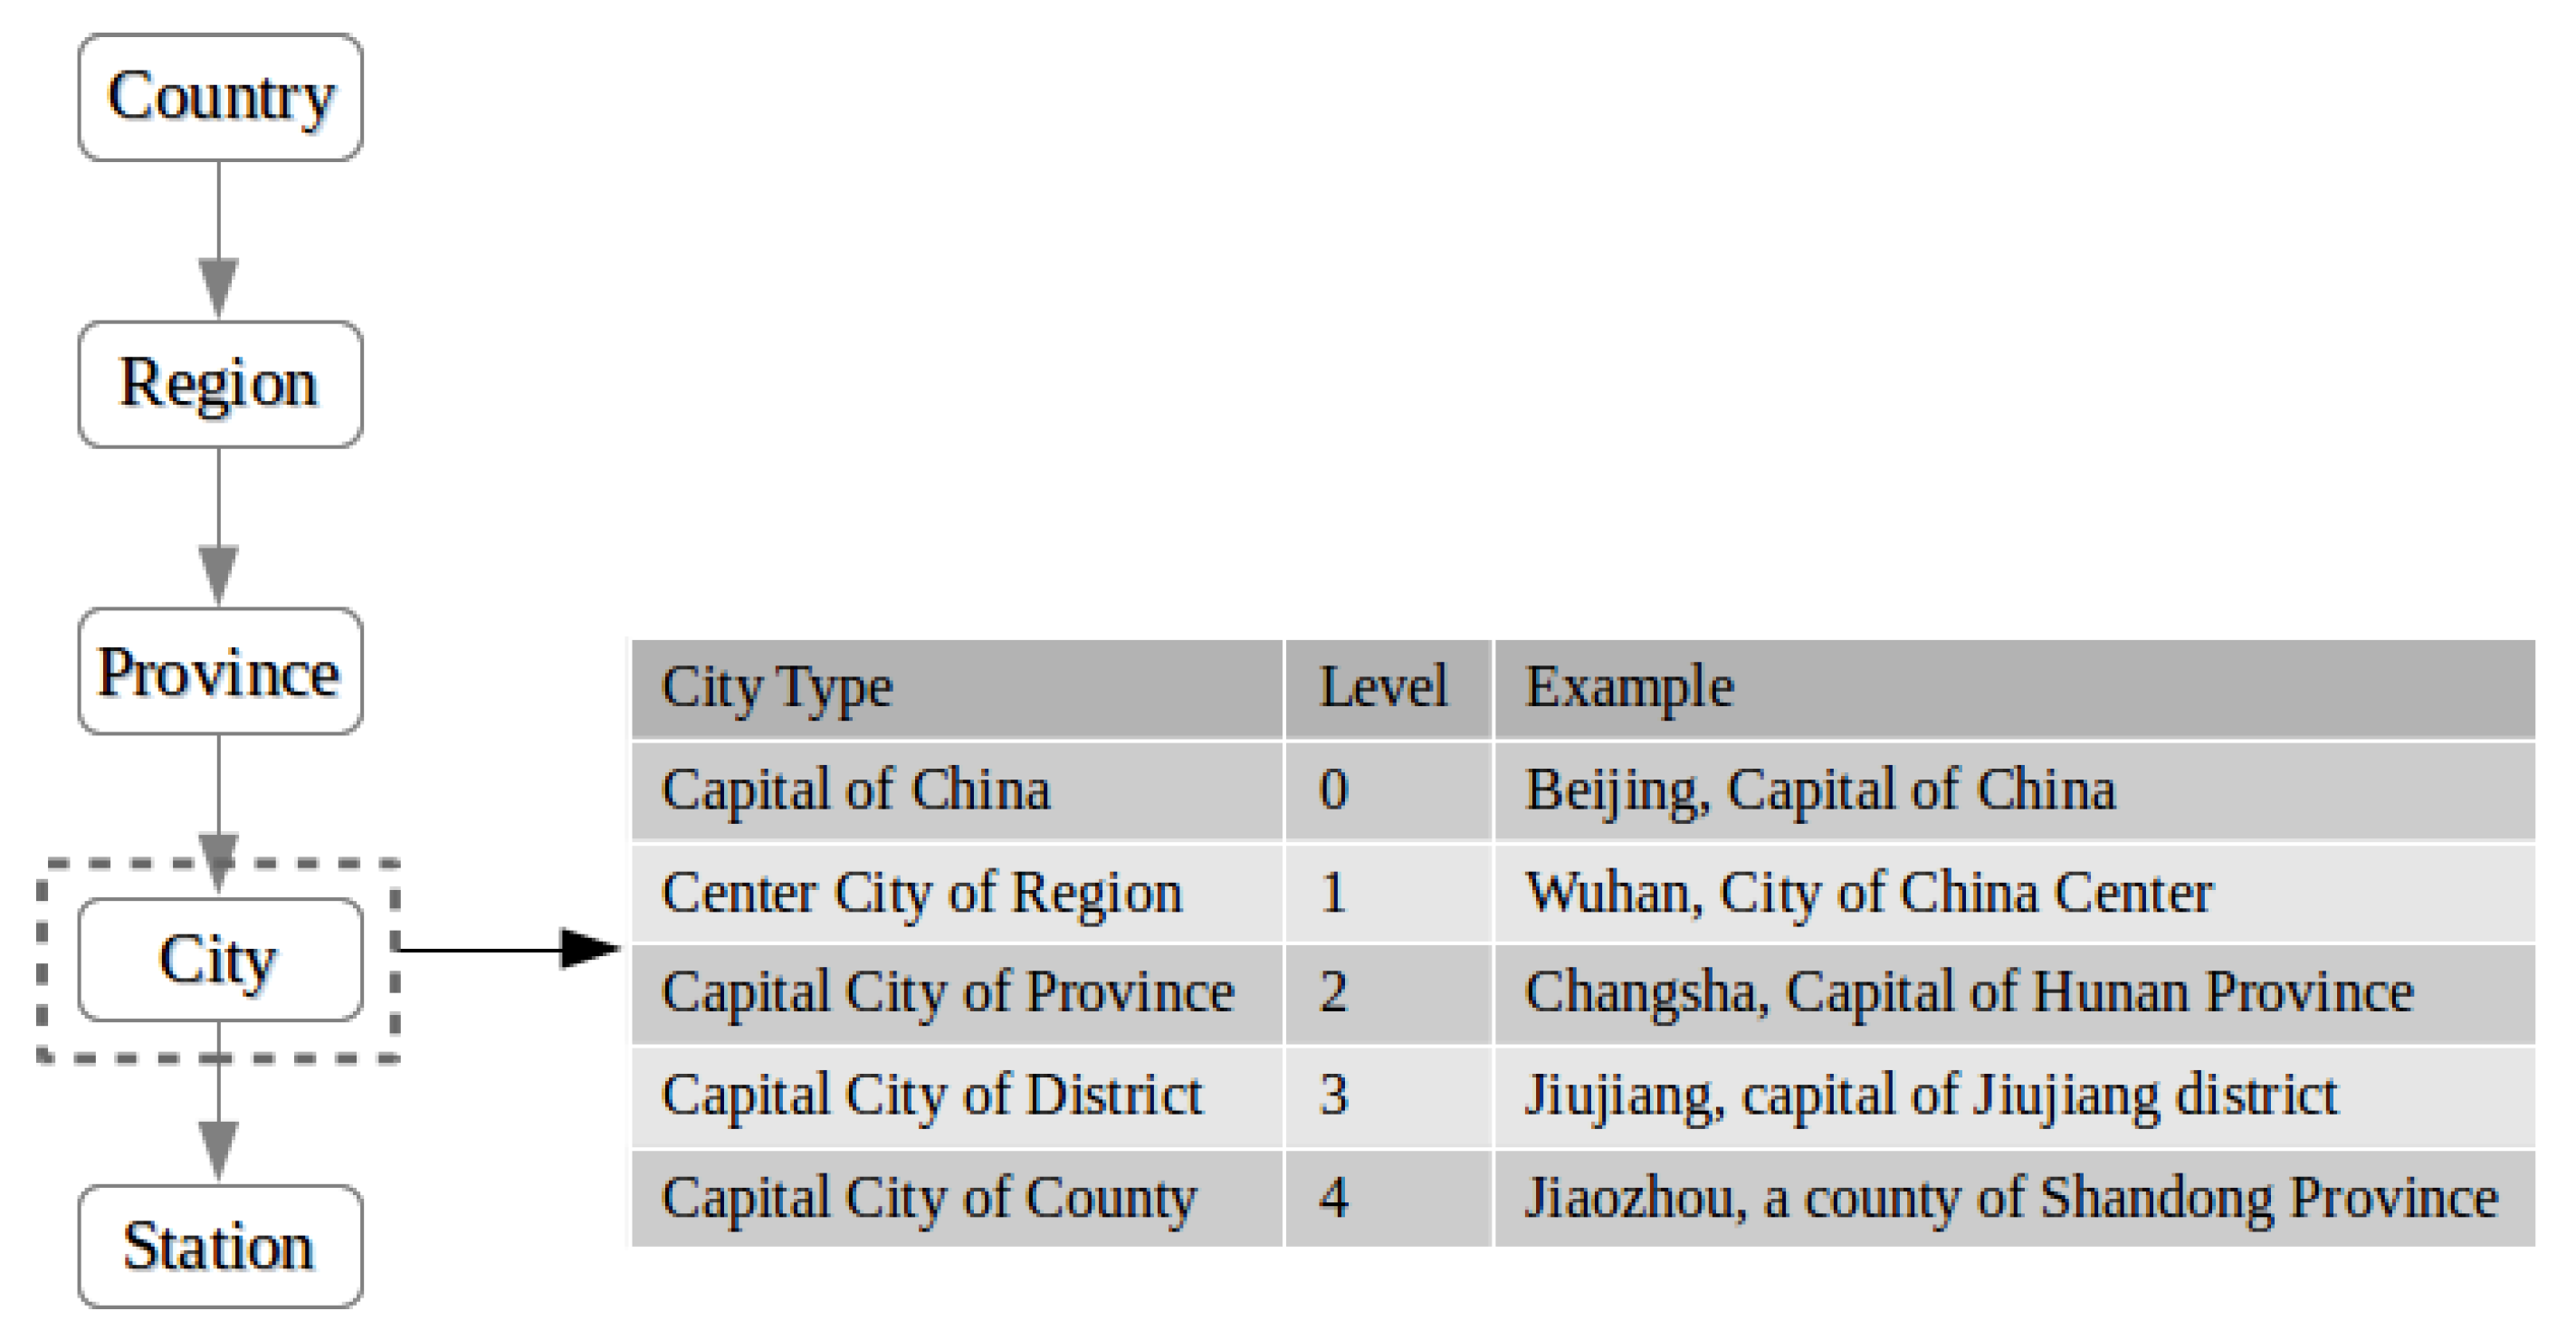
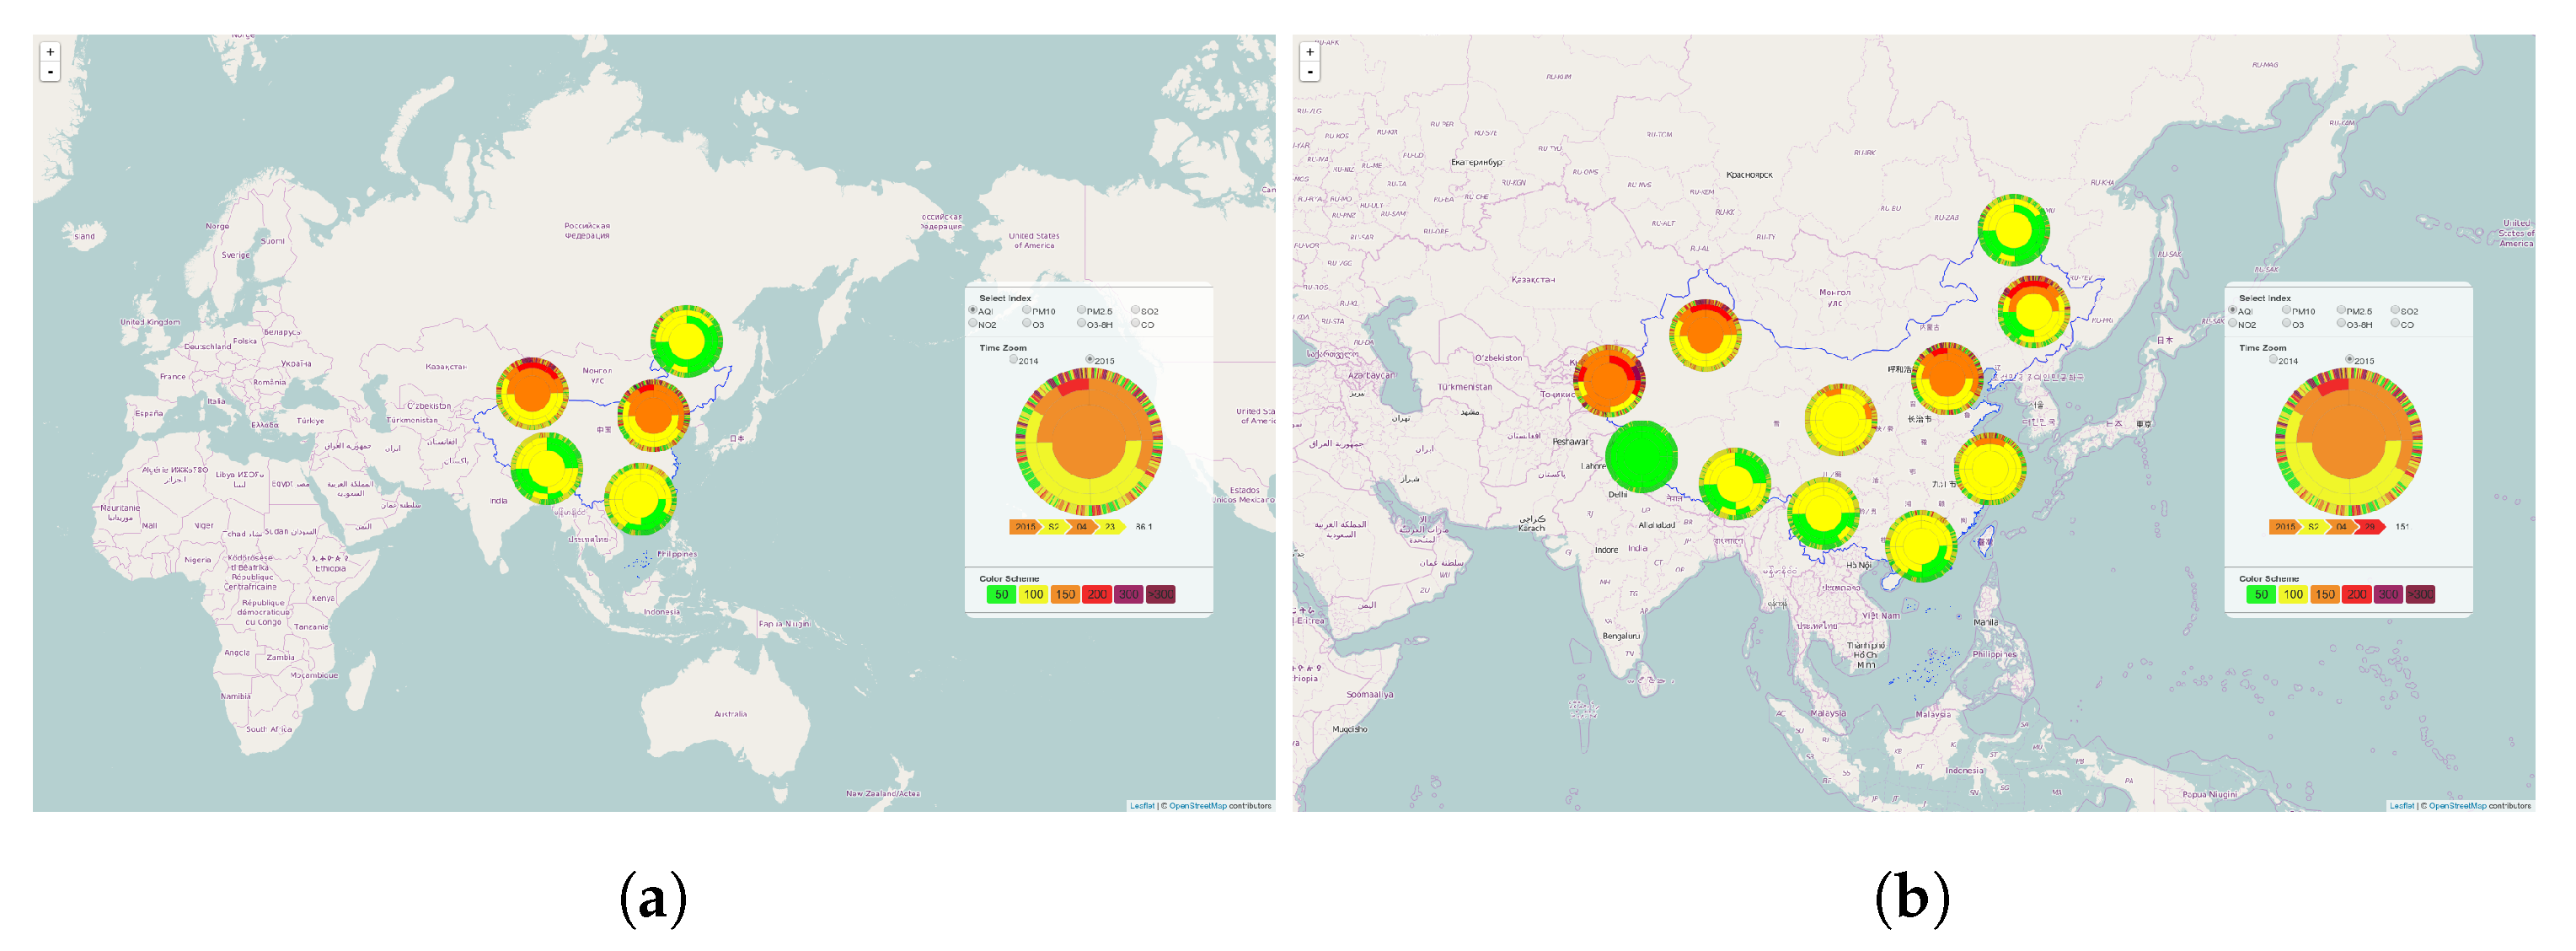
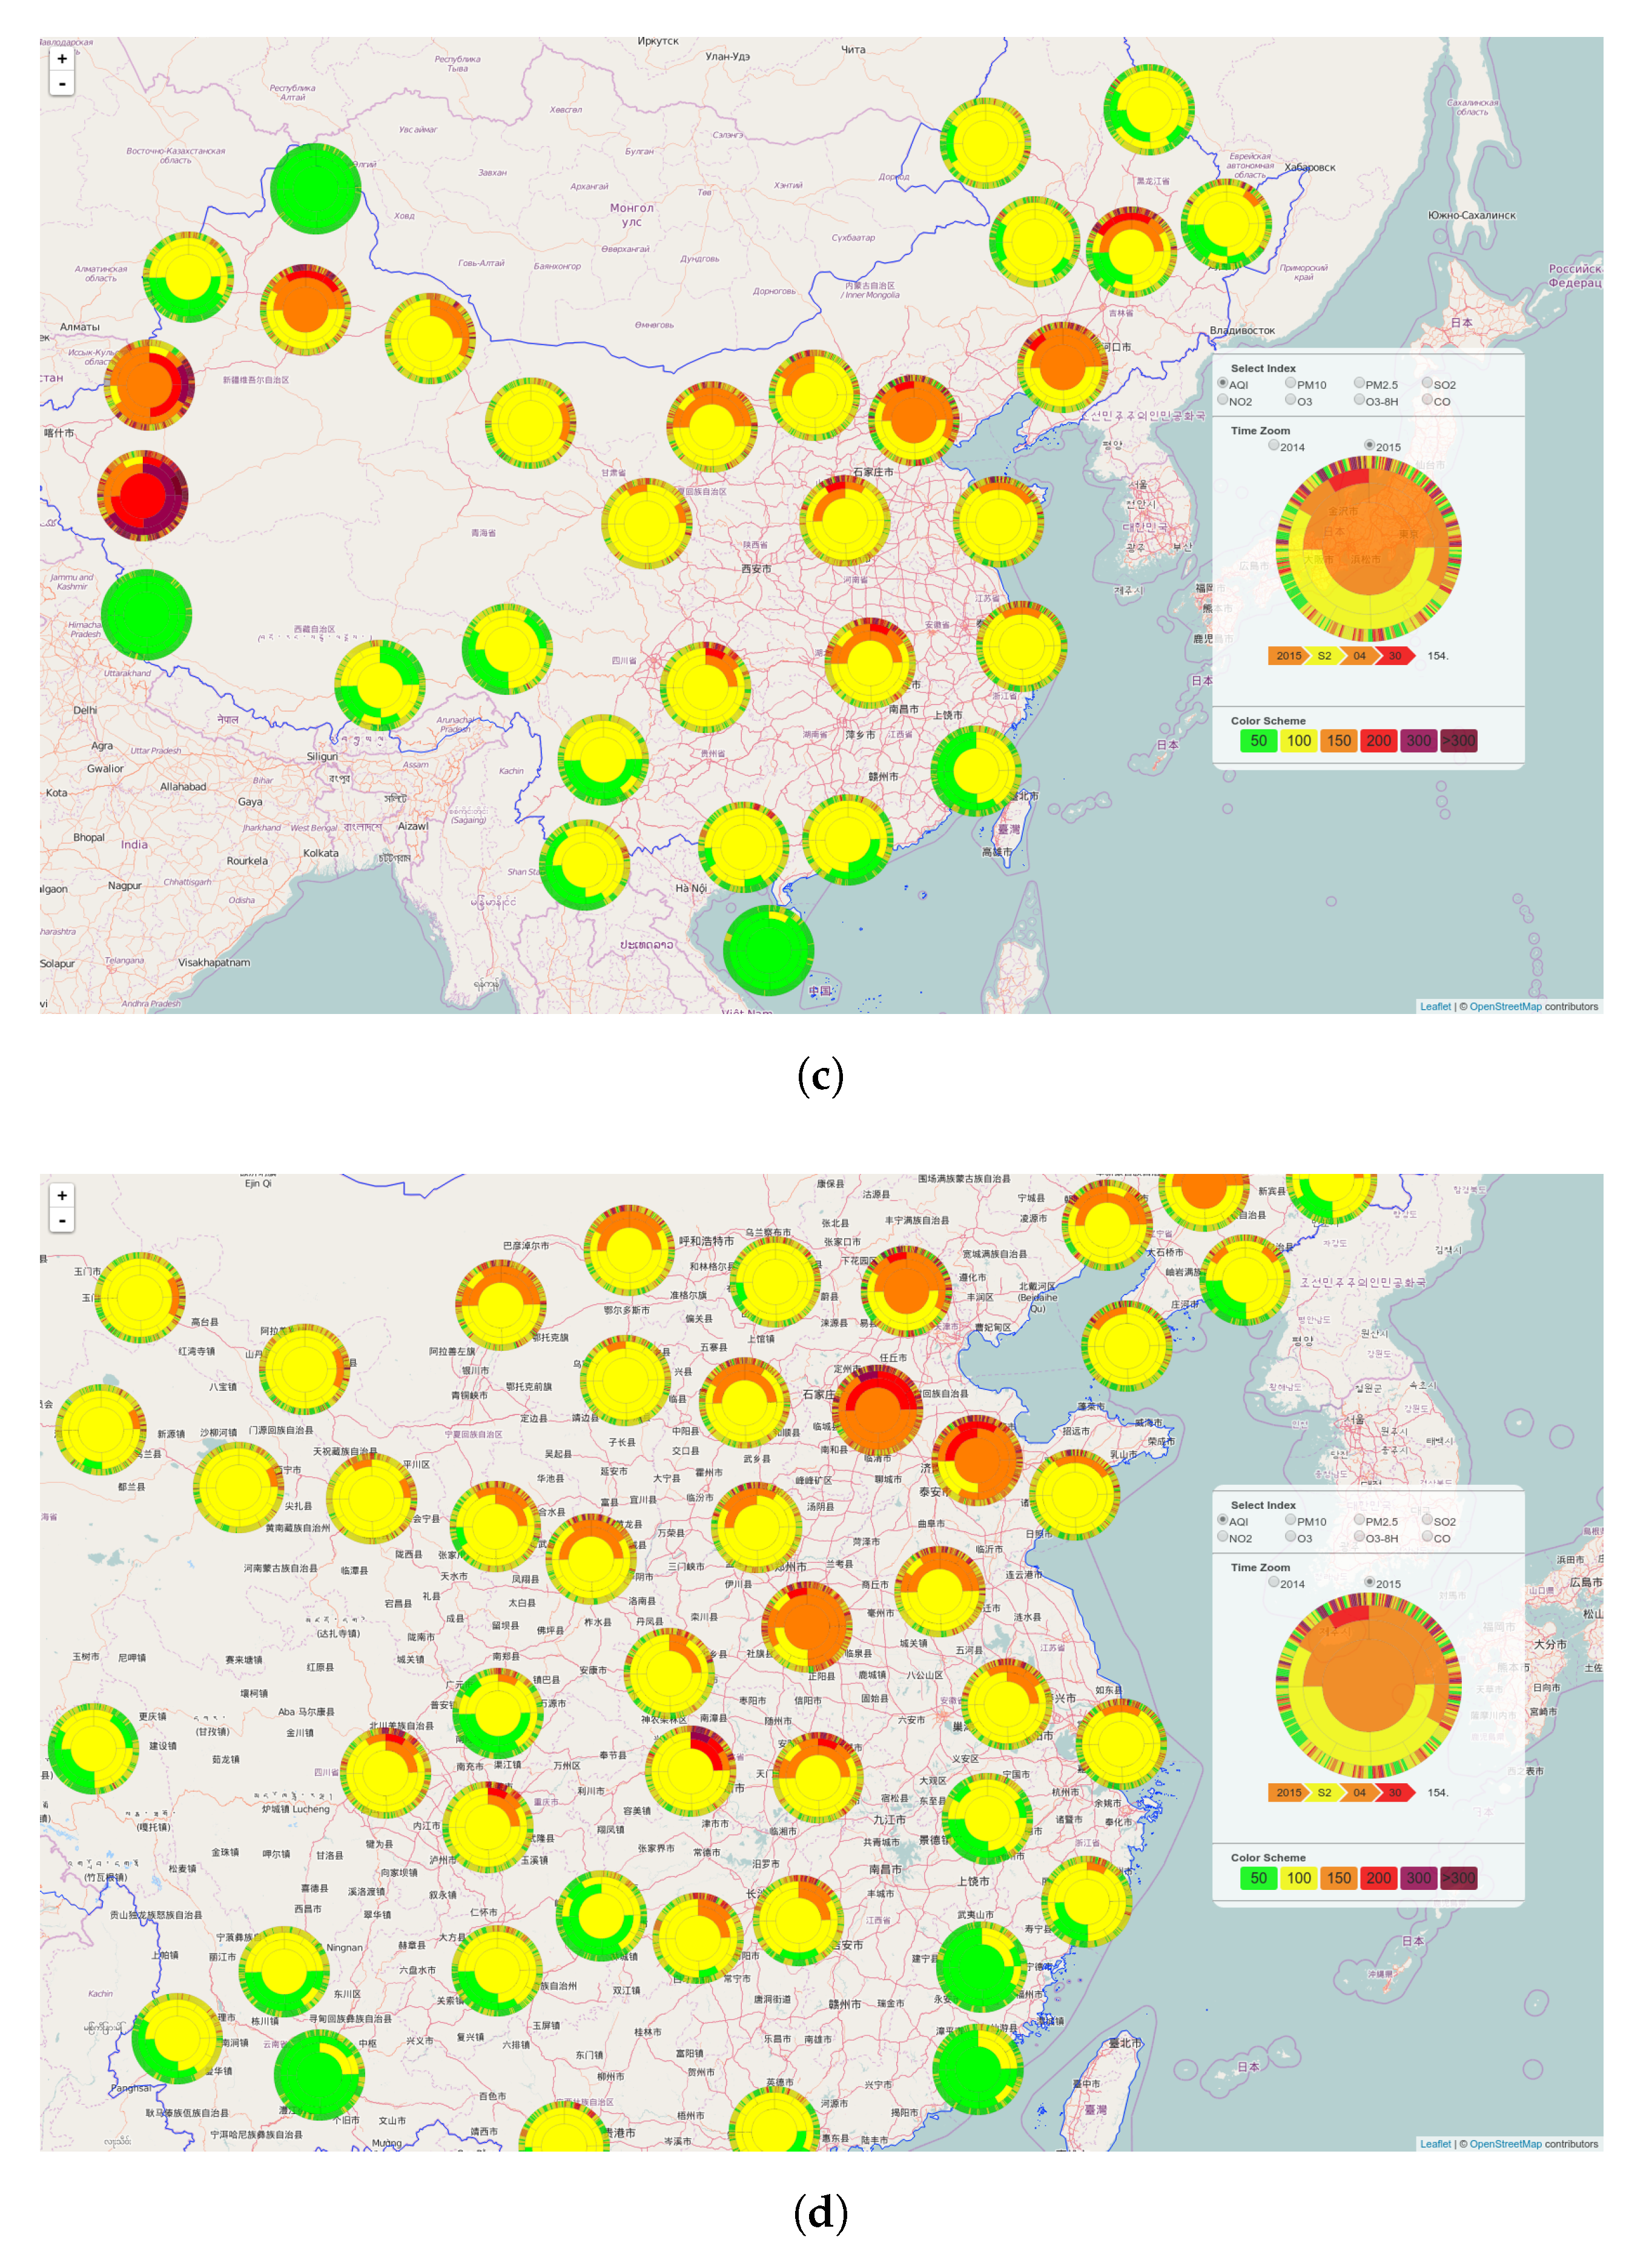
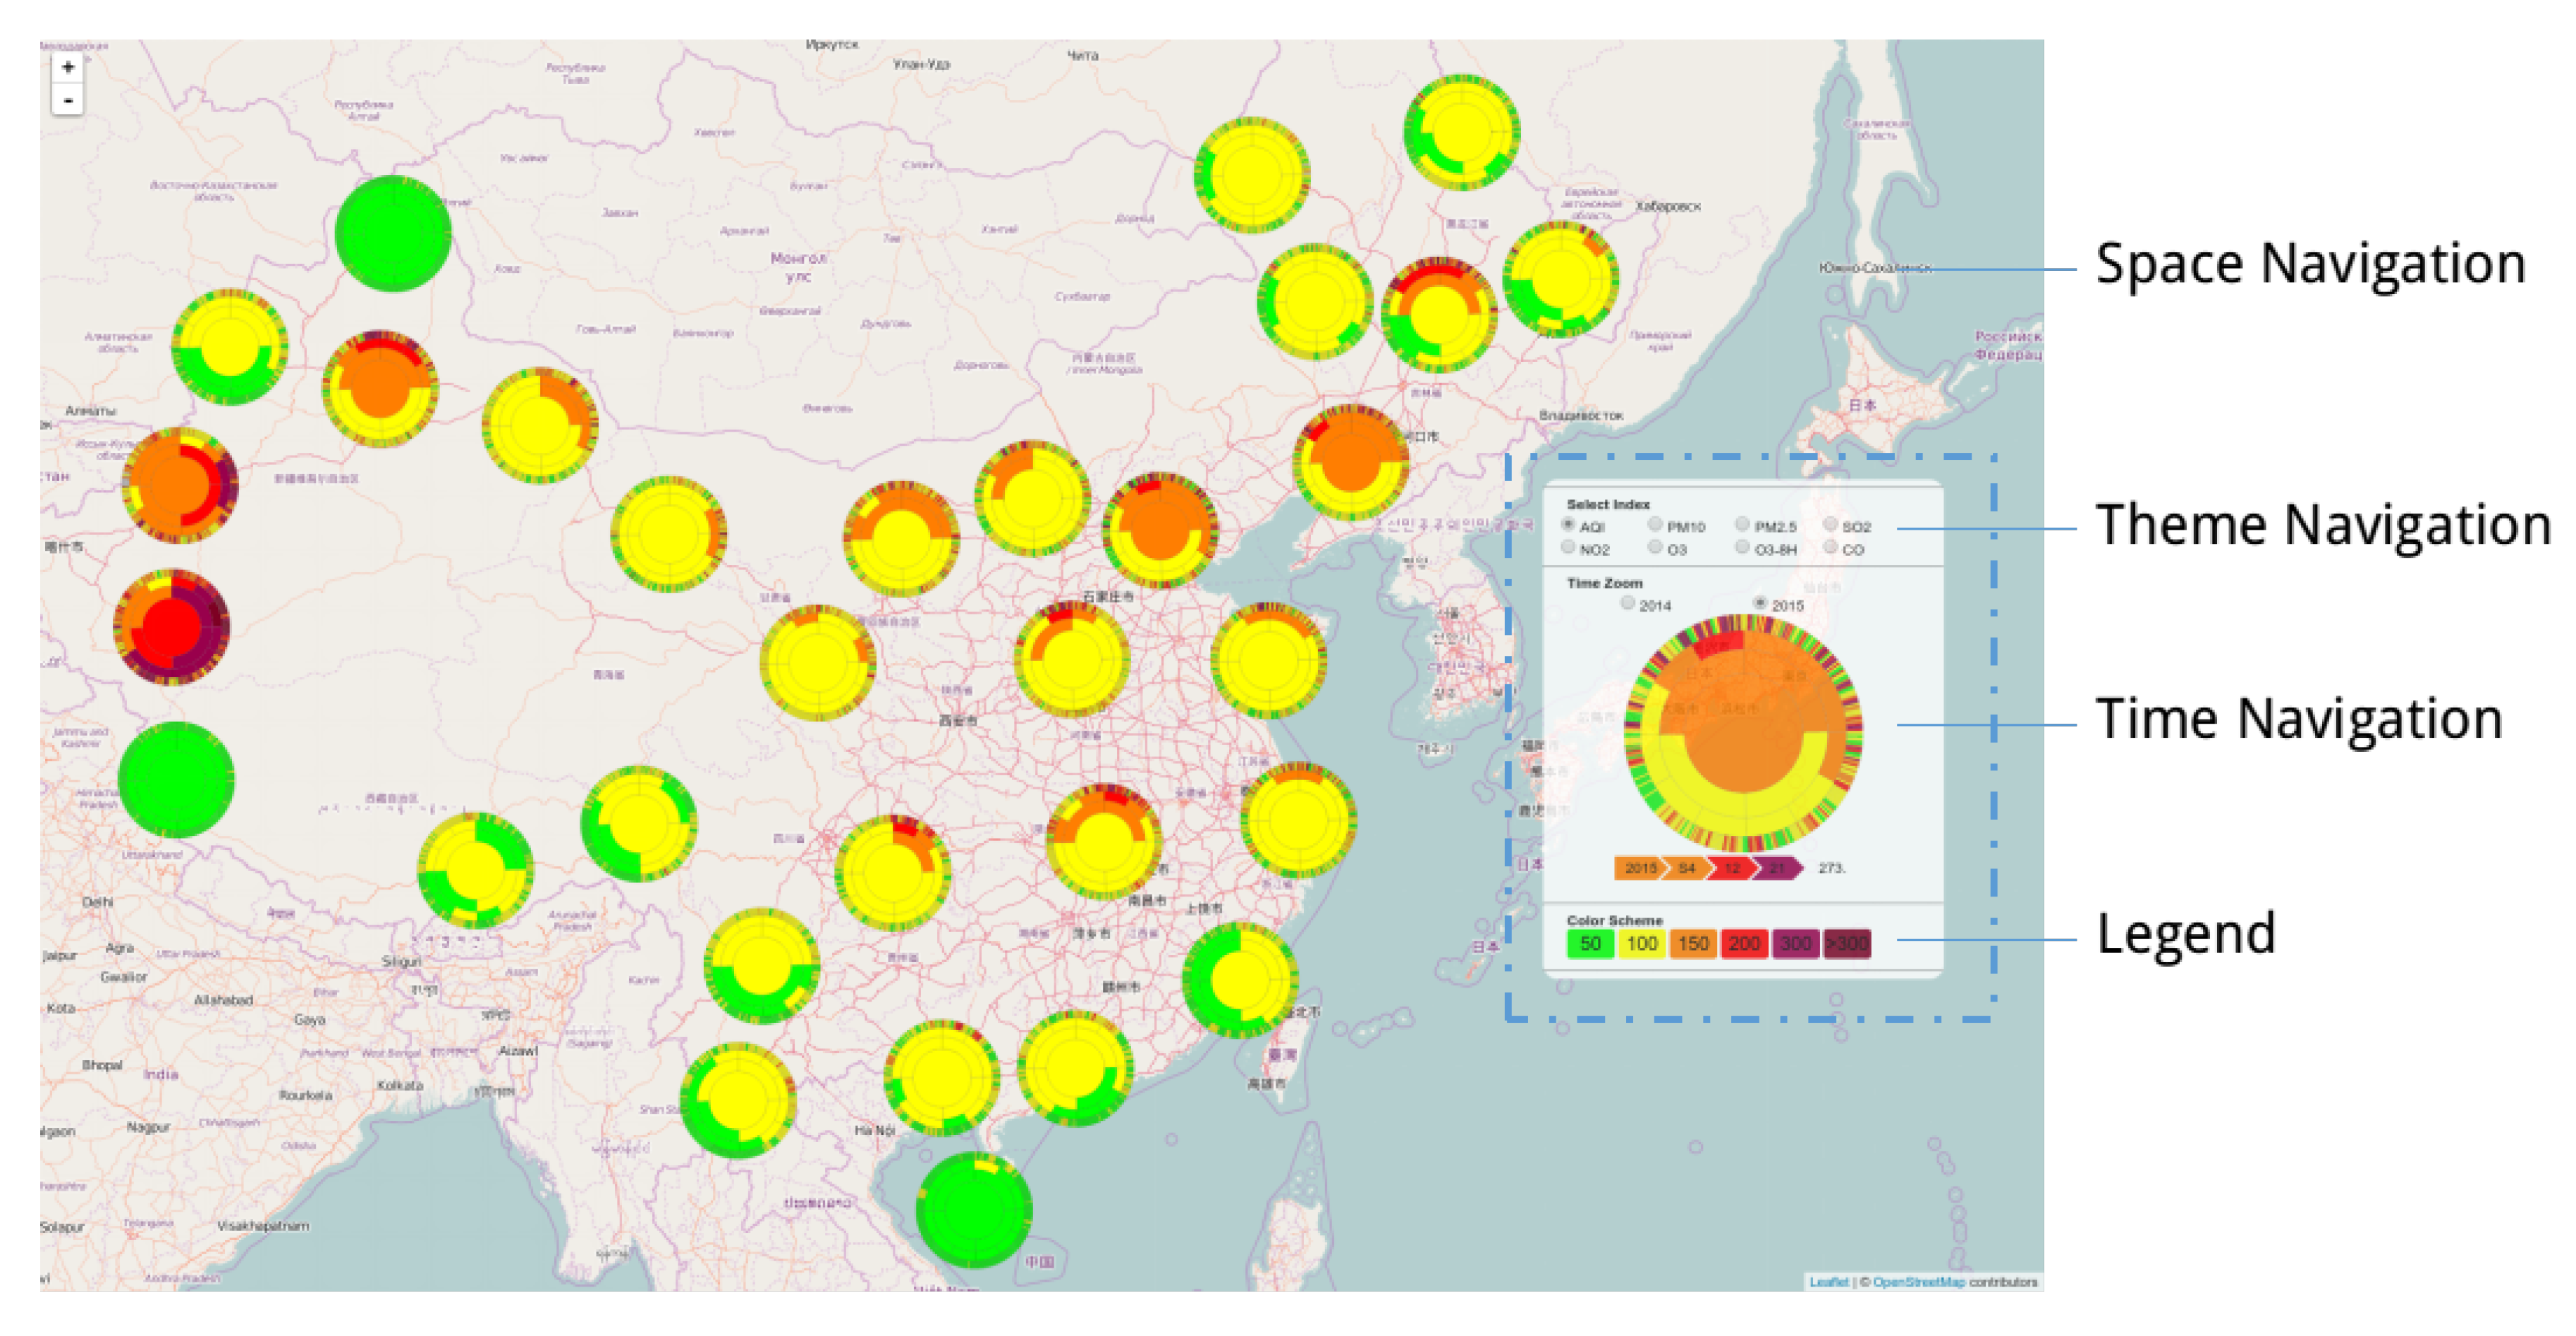
3.1.1. Spatial Navigation
3.1.2. Temporal Navigation
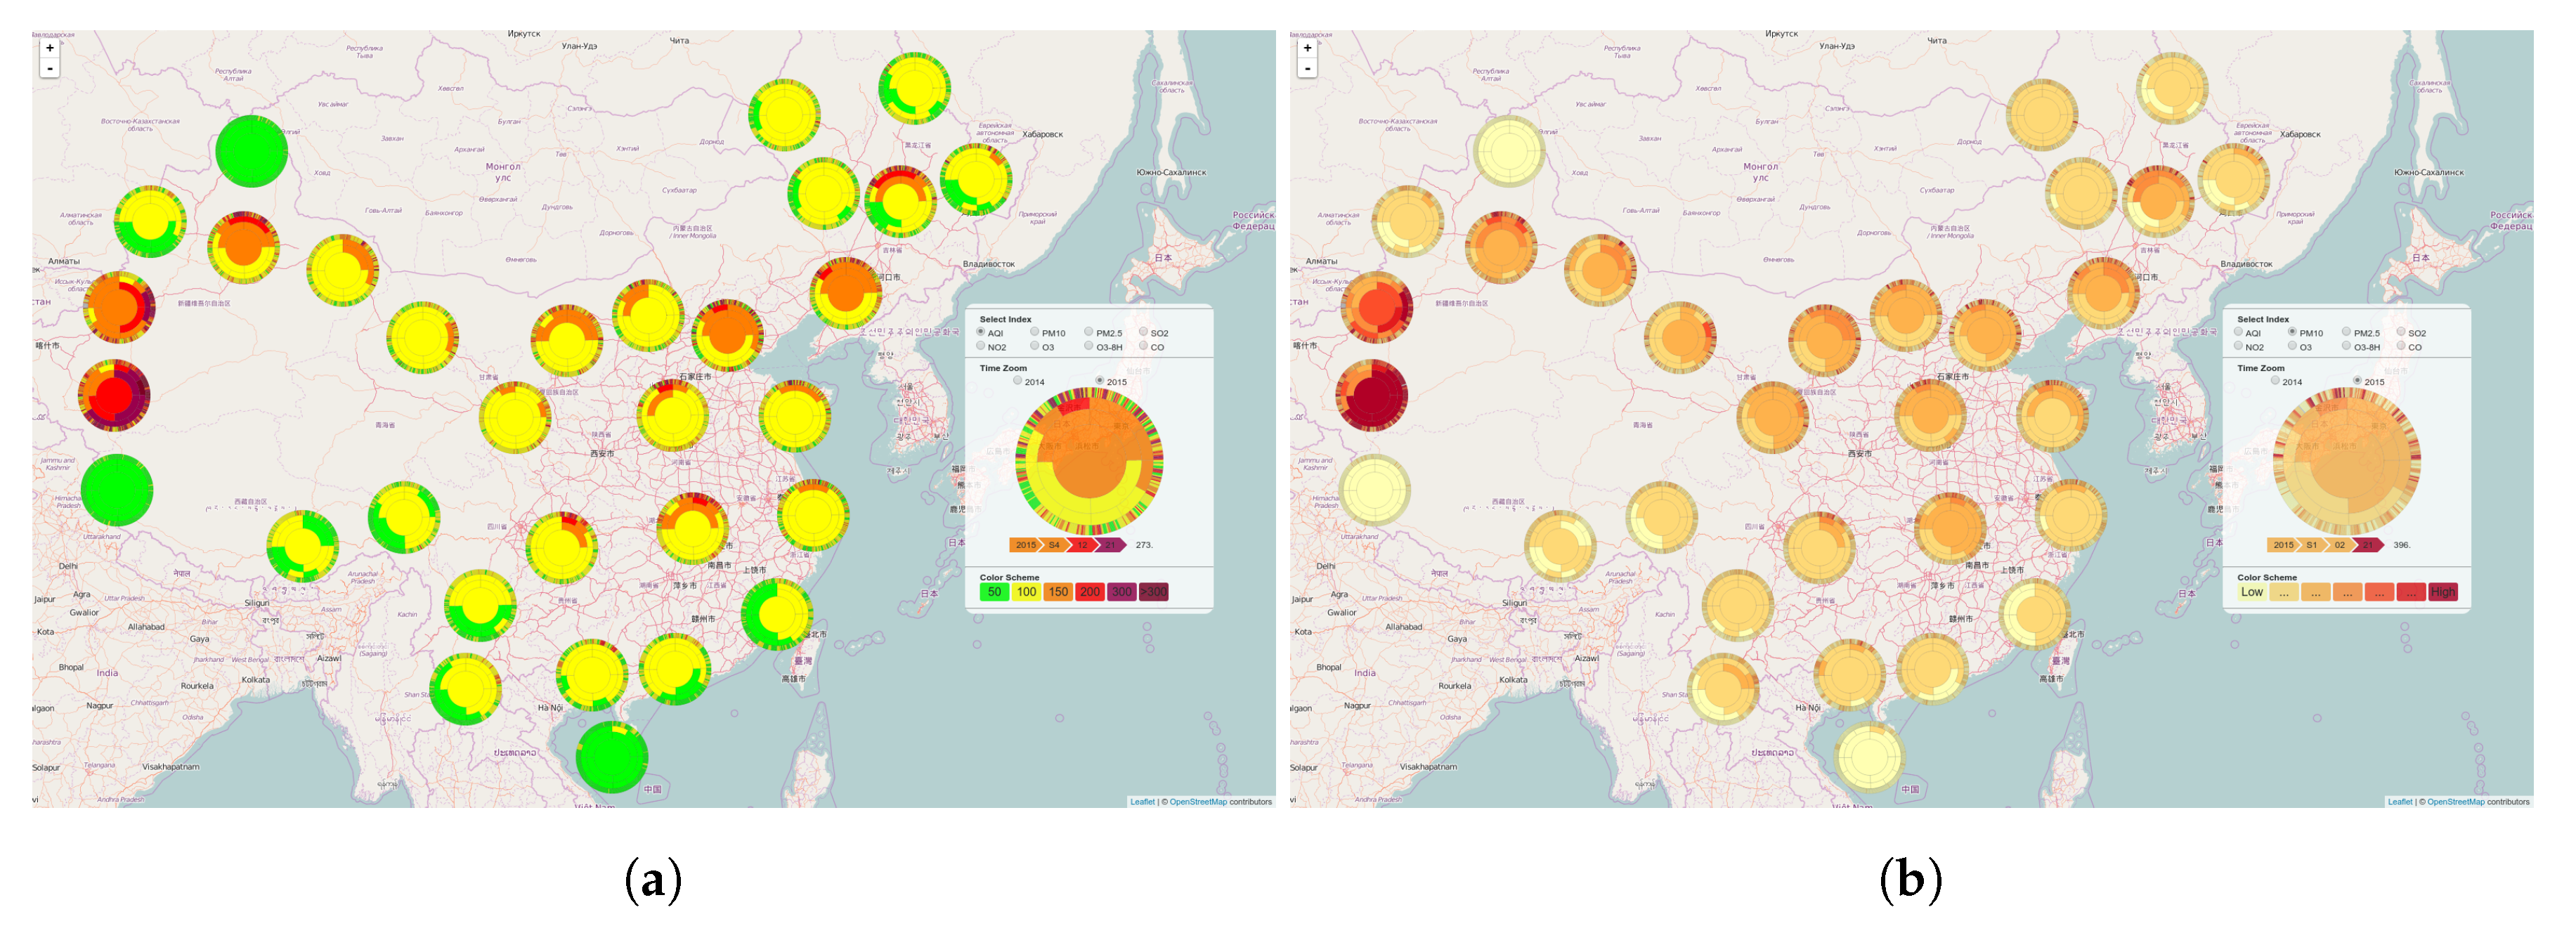
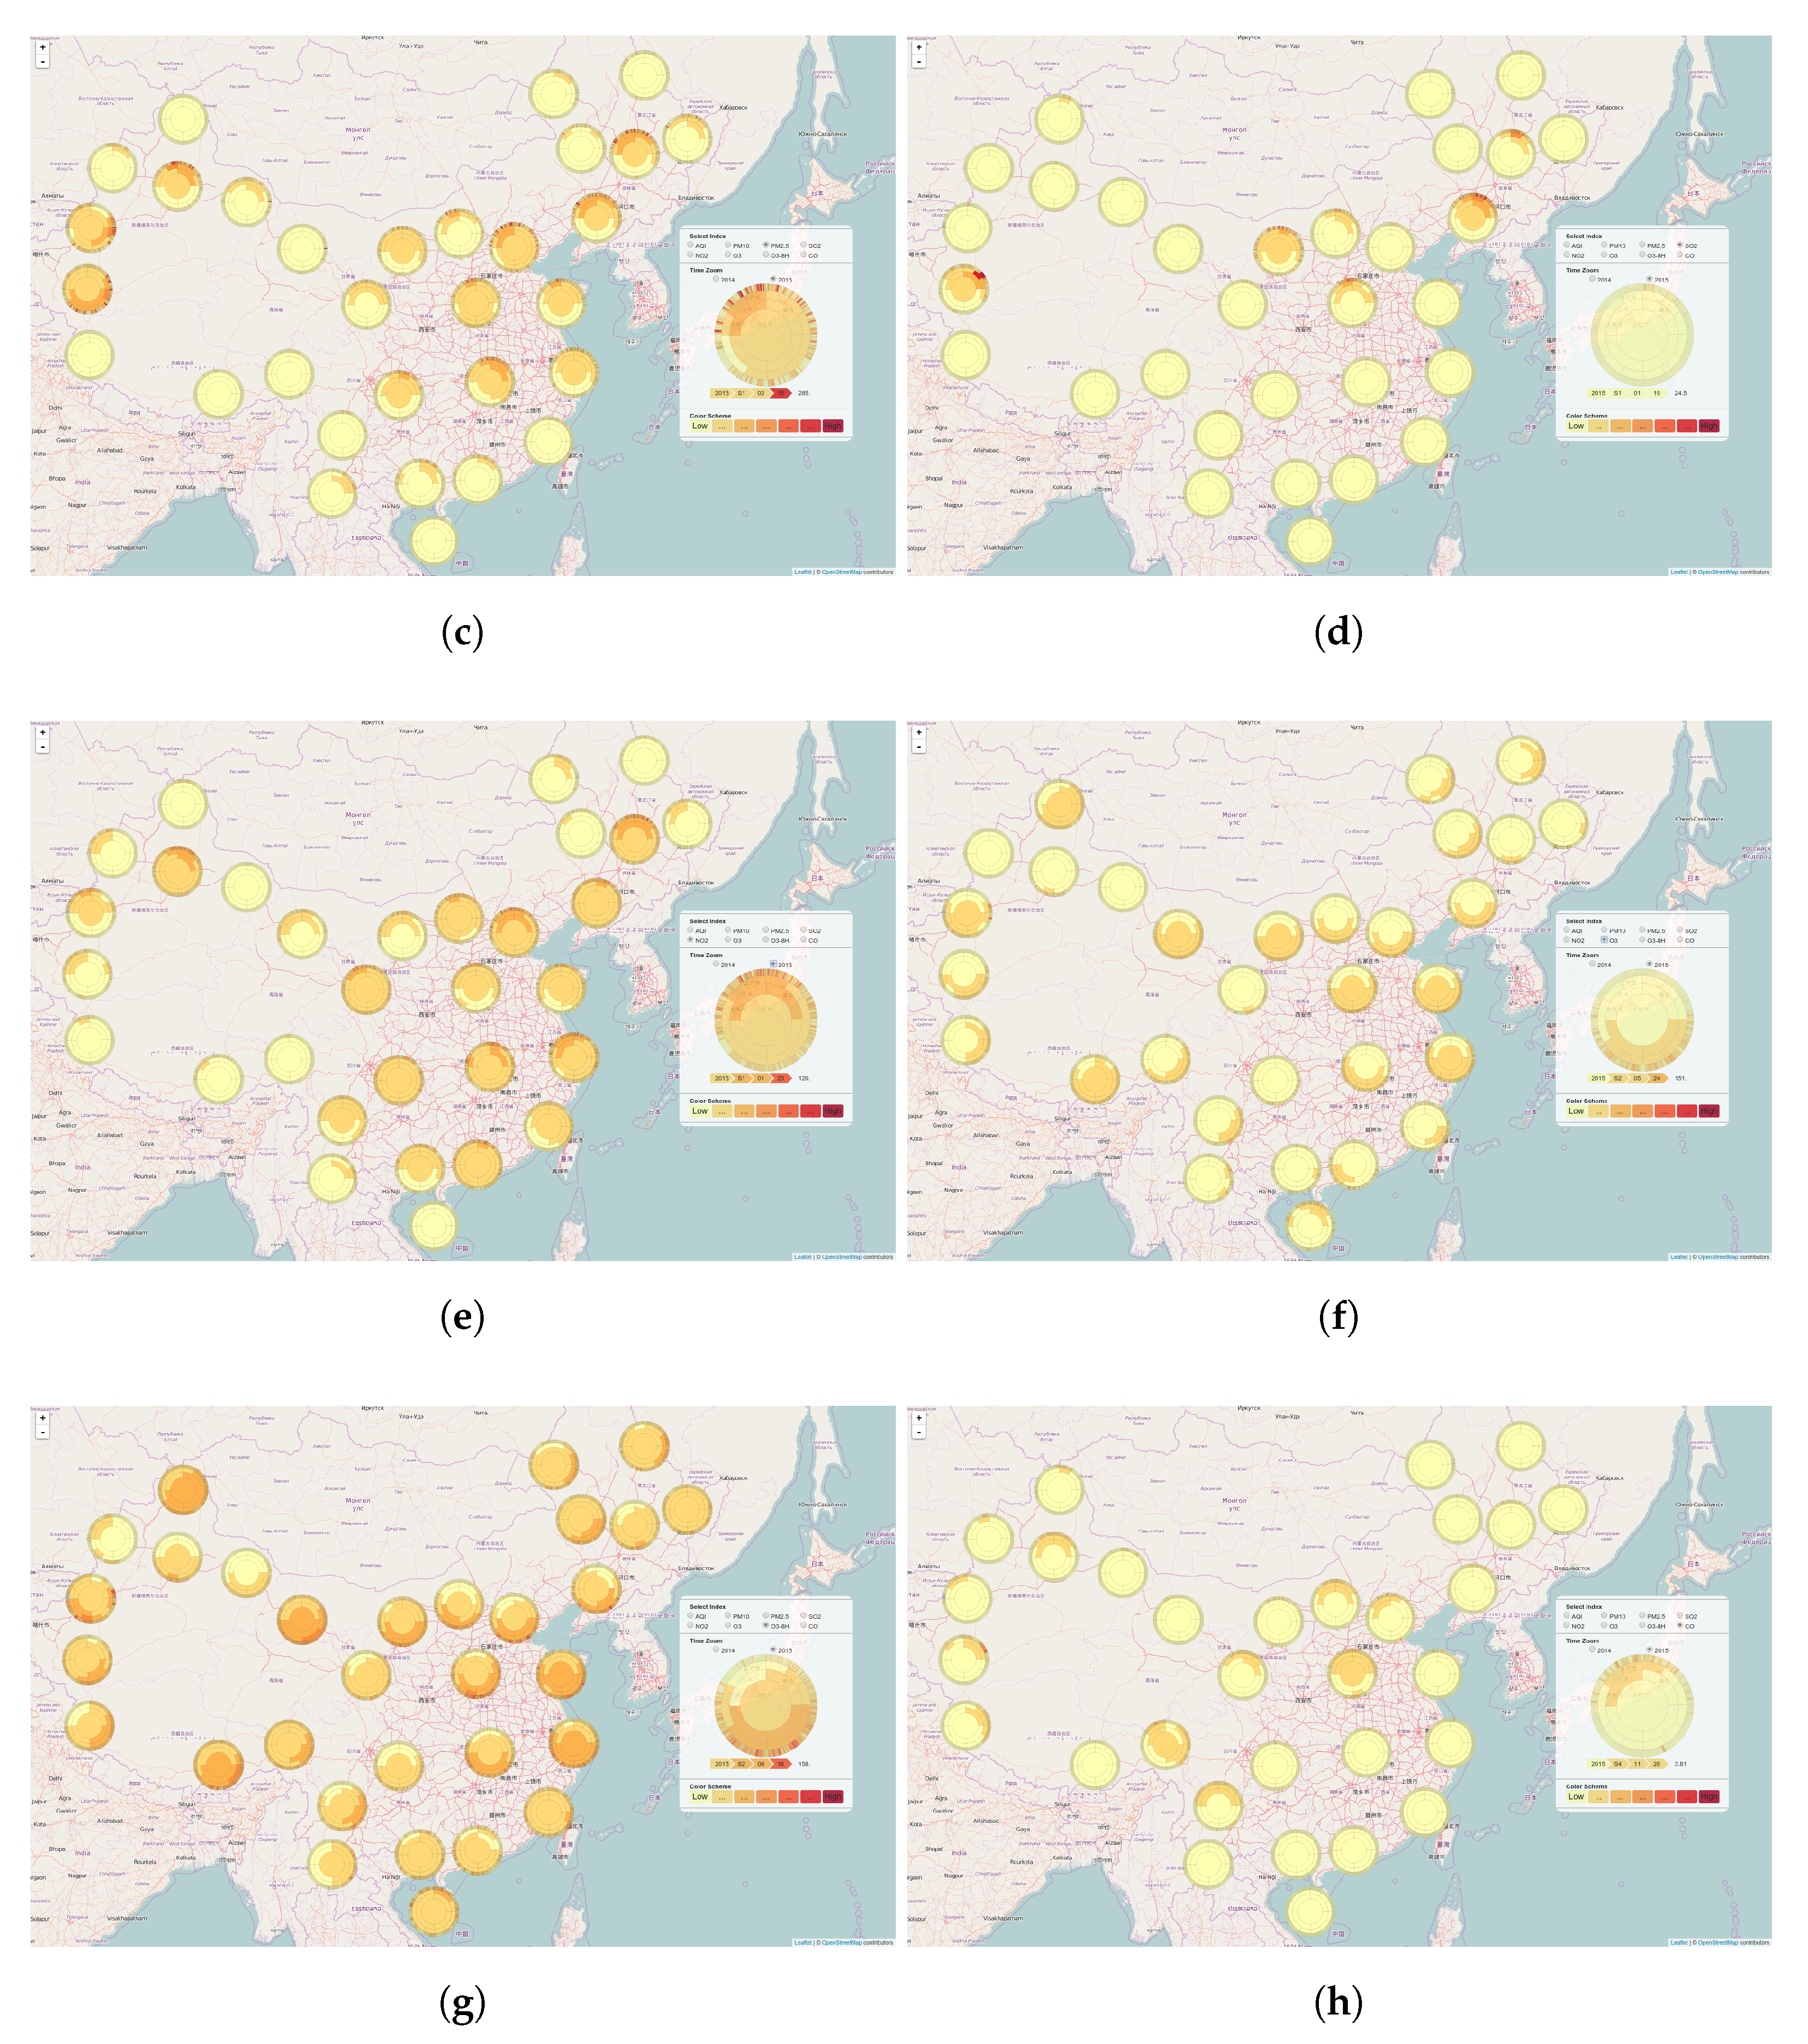
3.1.3. Thematic Navigation
3.2. Results and Analysis
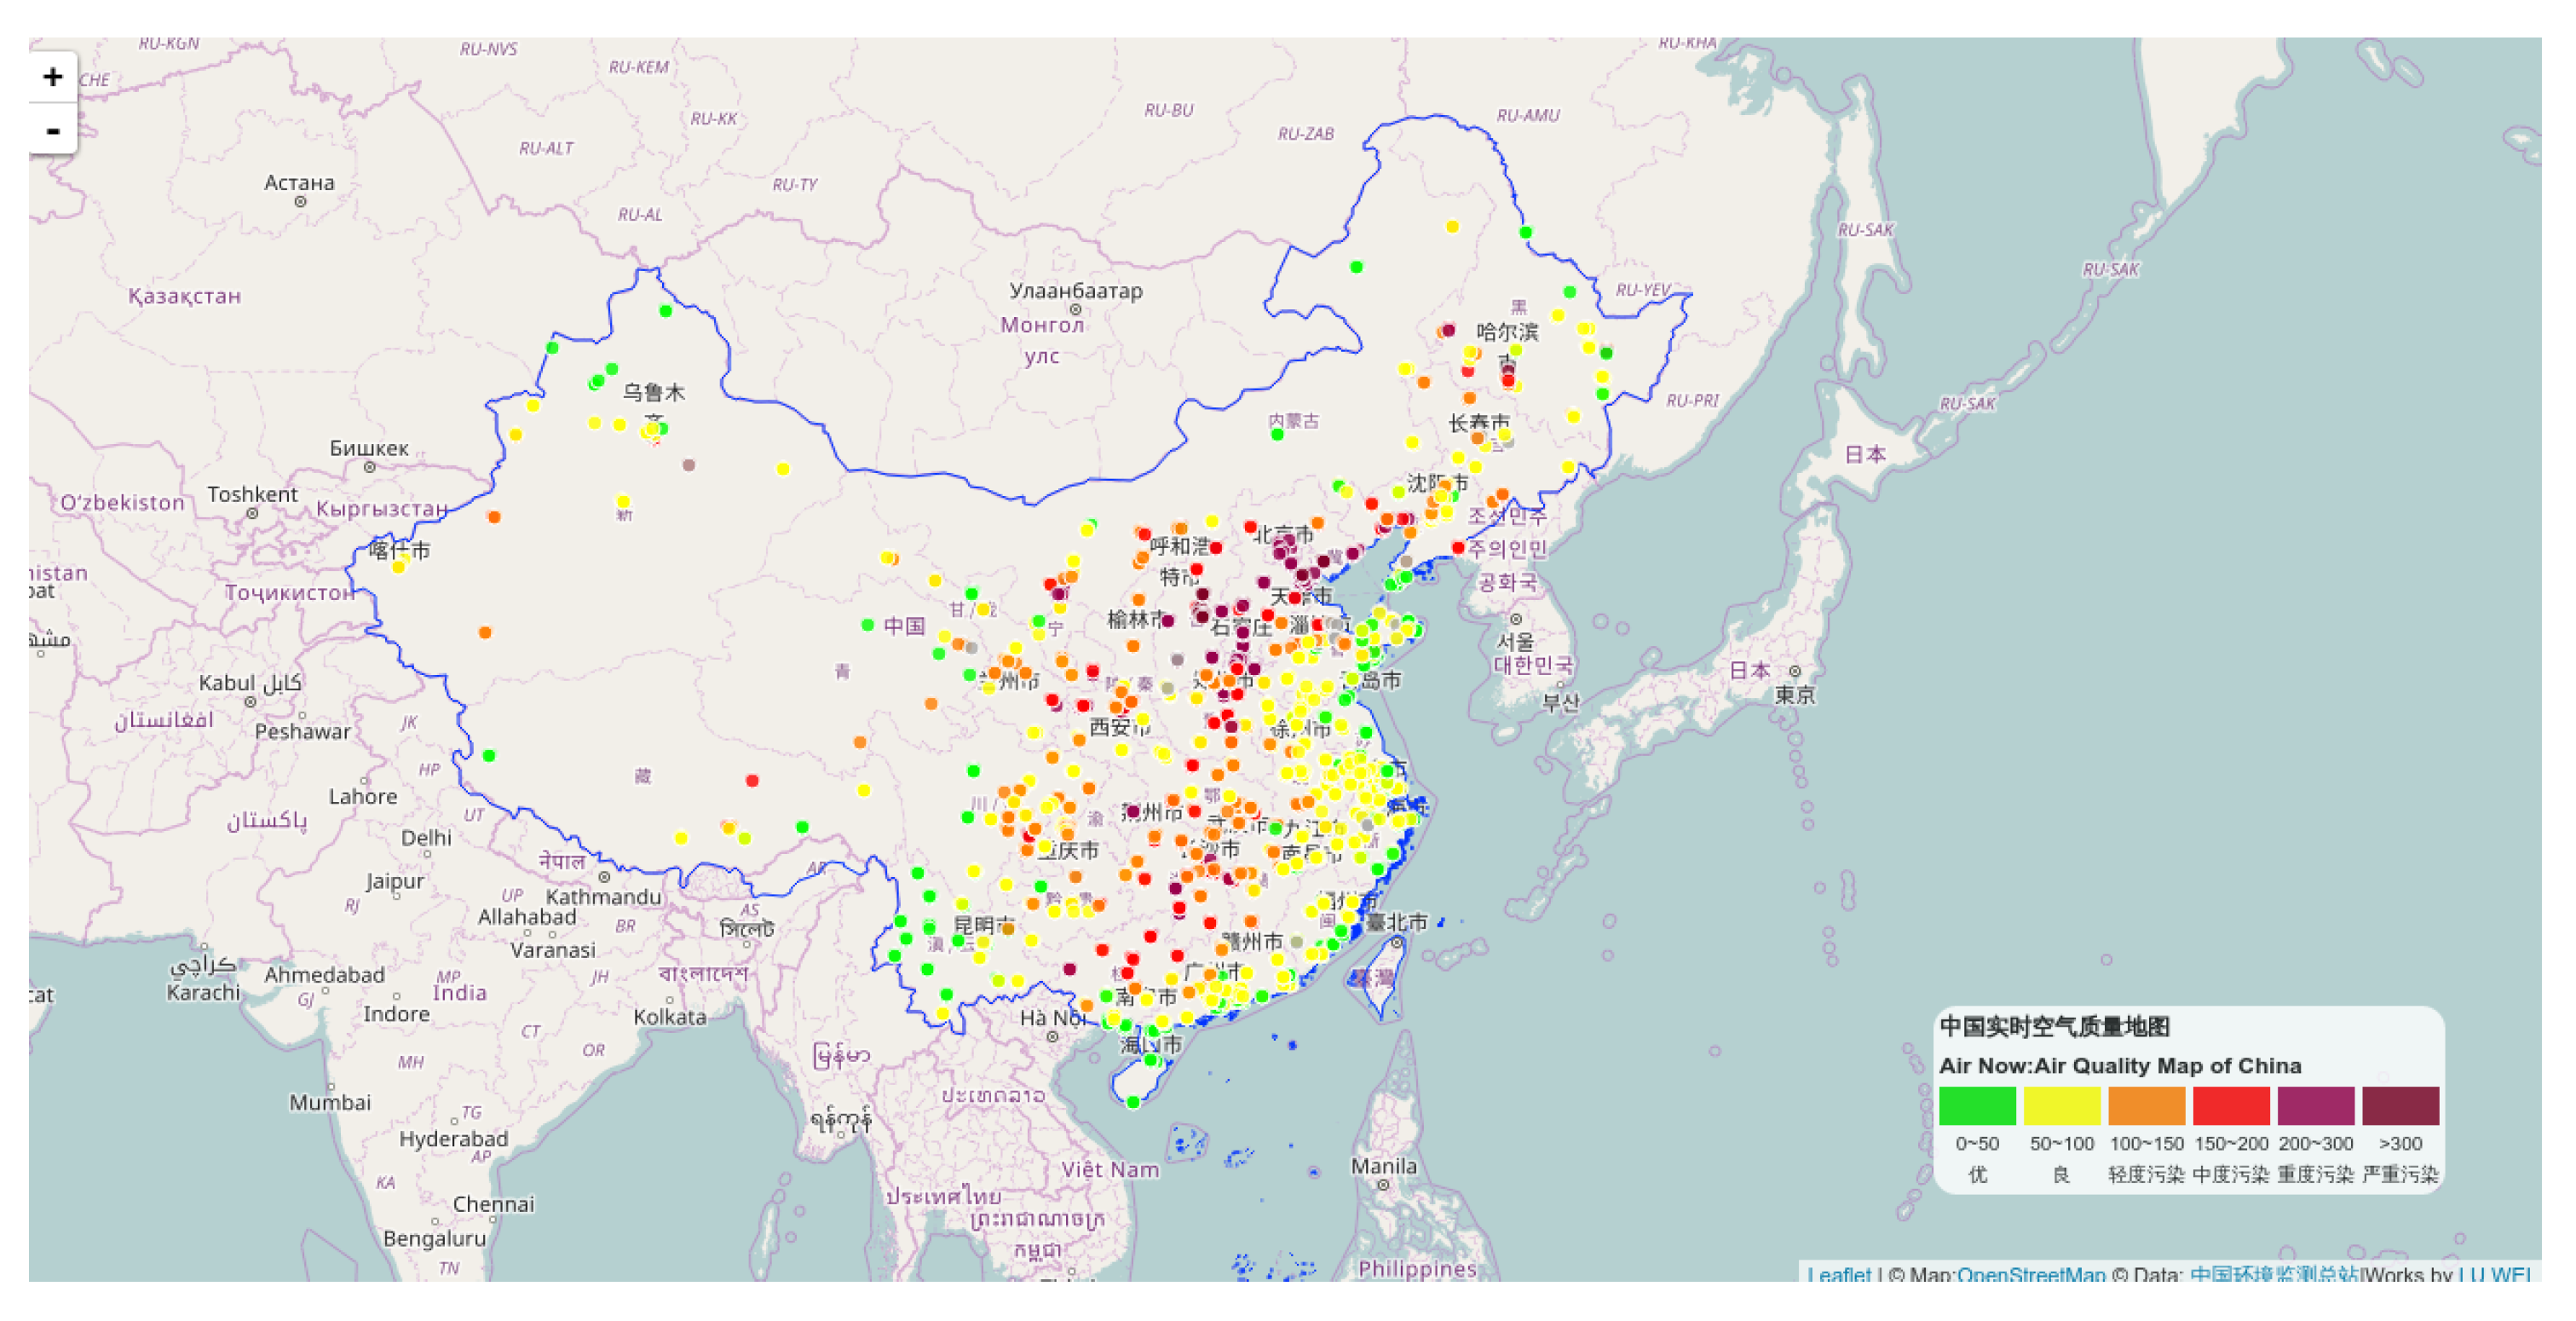
3.3. Nationwide Air Quality Condition of China
3.4. Spatio-Temporal Pattern of Air Pollutants
4. Conclusions
Acknowledgments
Author Contributions
Conflicts of Interest
Appendix A. Mapping and Visualization Technologies Used
References
- MEP China. Ambient Air Quality Standards. GB 3095-2012; China Environmental Science Press: Beijing, China, 2012. [Google Scholar]
- MEP China. Technical Regulation on Ambient Air Quality Index (on Trial) (HJ633-2012); China Environmental Science Press: Beijing, China, 2012. [Google Scholar]
- Chen, C.; Arjomandi, M.; Balmes, J.; Tager, I.; Holland, N. Effects of Chronic and Acute Ozone Exposure on Lipid Peroxidation and Antioxidant Capacity in Healthy Young Adults. Environ. Health Perspect. 2007, 115, 1732–1737. [Google Scholar] [CrossRef] [PubMed]
- Sicard, P.; Lesne, O.; Alexandre, N.; Mangin, A.; Collomp, R. Air quality trends and potential health effects—Development of an aggregate risk index. Atmos. Environ. 2011, 45, 1145–1153. [Google Scholar] [CrossRef]
- Ochoa-Hueso, R.; Munzi, S.; Alonso, R.; Arróniz-Crespo, M.; Avila, A.; Bermejo, V.; Bobbink, R.; Branquinho, C.; Concostrina-Zubiri, L.; Cruz, C.; et al. Ecological impacts of atmospheric pollution and interactions with climate change in terrestrial ecosystems of the Mediterranean Basin: Current research and future directions. Environ. Pollut. 2017, 227, 194–206. [Google Scholar] [CrossRef] [PubMed]
- Andrienko, N.; Andrienko, G.; Gatalsky, P. Exploratory spatio-temporal visualization: An analytical review. J. Vis. Lang. Comput. 2003, 14, 503–541. [Google Scholar] [CrossRef]
- Kraak, M.J.; Ormeling, F. Cartography: Visualization of Spatial Data; Guilford Press: New York, NY, USA, 2011. [Google Scholar]
- Guo, D.; Chen, J.; MacEachren, A.M.; Liao, K. A visualization system for space-time and multivariate patterns (vis-stamp). IEEE Trans. Vis. Comput. Graph. 2006, 12, 1461–1474. [Google Scholar] [PubMed]
- Rink, K.; Scheuermann, G.; Kolditz, O. Visualisation in environmental sciences. Environ. Earth Sci. 2014, 72, 3749–3751. [Google Scholar] [CrossRef][Green Version]
- Grünfeld, K. Integrating spatio-temporal information in environmental monitoring data-a visualization approach applied to moss data. Sci. Total Environ. 2005, 347, 1–20. [Google Scholar] [CrossRef] [PubMed]
- Huang, B. Web-based dynamic and interactive environmental visualization. Comput. Environ. Urban Syst. 2003, 27, 623–636. [Google Scholar] [CrossRef]
- Hugentobler, M.; Hurni, L. Web cartography with open standards-a solution to cartographic challenges of environmental management. Environ. Model. Softw. 2010, 25, 988–999. [Google Scholar]
- Kulawiak, M.; Prospathopoulos, A.; Perivoliotis, L.; Kioroglou, S.; Stepnowski, A.; łuba, M. Interactive visualization of marine pollution monitoring and forecasting data via a Web-based GIS. Comput. Geosci. 2010, 36, 1069–1080. [Google Scholar] [CrossRef]
- Long, Y.; Wang, J.; Wu, K.; Zhang, J. Population Exposure to Ambient PM 2.5 at the Subdistrict Level in China. Available online: https://papers.ssrn.com/sol3/papers.cfm?abstract_id=2486602 (accessed on 27 August 2014).
- Rohde, R.A.; Muller, R.A. Air pollution in China: Mapping of concentrations and sources. PLoS ONE 2015, 10, e0135749. [Google Scholar] [CrossRef] [PubMed]
- Sicard, P.; Serra, R.; Rossello, P. Spatiotemporal trends in ground-level ozone concentrations and metrics in France over the time period 1999–2012. Environ. Res. 2016, 149, 122–144. [Google Scholar] [CrossRef] [PubMed]
- Huan, L.; Hong, F.; Feiyue, M. A Visualization Approach to Air Pollution Data Exploration—A Case Study of Air Quality Index (PM2.5) in Beijing, China. Atmosphere 2016, 7, 35. [Google Scholar]
- Chung, K.L.; Qu, H.; Chan, W.Y.; Guo, P.; Xu, A.; Lau, K.H. Visual Analysis of the Air Pollution Problem in Hong Kong. IEEE Trans. Vis. Comput. Graph. 2007, 13, 1408–1415. [Google Scholar]
- Zhang, Y.L.; Cao, F. Fine particulate matter (PM2.5) in China at a city level. Sci. Rep. 2015, 5. [Google Scholar] [CrossRef] [PubMed]
- MacEachren, A.M.; Kraak, M.J. Research challenges in geovisualization. Cartogr. Geogr. Inf. Sci. 2001, 28, 3–12. [Google Scholar] [CrossRef]
- Qiang, Y.; Chavoshi, S.H.; Logghe, S.; De Maeyer, P.; Van de Weghe, N. Multi-scale analysis of linear data in a two-dimensional space. Inf. Vis. 2013, 3, 248–265. [Google Scholar] [CrossRef]
- Van de Weghe, N.; De Roo, B.; Qiang, Y.; Versichele, M.; Neutens, T.; De Maeyer, P. The continuous spatio-temporal model (CSTM) as an exhaustive framework for multi-scale spatio-temporal analysis. Int. J. Geogr. Inf. Sci. 2014, 28, 1047–1060. [Google Scholar] [CrossRef]
- Shneiderman, B. The eyes have it: A task by data type taxonomy for information visualizations. In Proceedings of the IEEE Symposium on Visual Languages, Boulder, CO, USA, 3–6 September 1996; pp. 336–343. [Google Scholar]
- Bach, B.; Dragicevic, P.; Archambault, D.; Hurter, C.; Carpendale, S. A review of temporal data visualizations based on space-time cube operations. In Proceedings of the Eurographics Conference on Visualization, Wales, UK, 9–13 June 2014. [Google Scholar]
- Shrestha, A.; Zhu, Y.; Miller, B.; Zhao, Y. Storygraph: Telling stories from spatio-temporal data. In International Symposium on Visual Computing; Springer: Berlin, Germany, 2013; pp. 693–702. [Google Scholar]
- Stolte, C.; Tang, D.; Hanrahan, P. Polaris: A system for query, analysis, and visualization of multidimensional relational databases. IEEE Trans. Vis. Comput. Graph. 2002, 8, 52–65. [Google Scholar] [CrossRef]
- Roth, R.E.; Donohue, R.G.; Sack, C.M.; Wallace, T.R.; Buckingham, T. A process for keeping pace with evolving web mapping technologies. Cartogr. Perspect. 2015, 25–52. [Google Scholar] [CrossRef]
- Swartz, A. Web.py Home Page. Available online: http://webpy.org/ (accessed on 4 December 2016).
- Agafonkin, V. Leaflet-a JavaScript library for interactive maps. Available online: http://leafletjs.com/ (accessed on 4 December 2016).
- Bostock, M. D3.js-Data-Driven Documents. Available online: http://d3js.org/ (accessed on 4 December 2016).
- Wood, J.; Dykes, J.; Slingsby, A.; Clarke, K. Interactive visual exploration of a large spatio-temporal dataset: Reflections on a geovisualization mashup. IEEE Trans. Vis. Comput. Graph. 2007, 13, 1176–1183. [Google Scholar] [CrossRef] [PubMed]
- Peuquet, D.J. It’s about time: A conceptual framework for the representation of temporal dynamics in geographic information systems. Ann. Assoc. Am. Geogr. 1994, 84, 441–461. [Google Scholar] [CrossRef]
- Aigner, W.; Miksch, S.; Schumann, H.; Tominski, C. Visualization of Time-Oriented Data; Springer: London, UK, 2011; p. 232. [Google Scholar]
- Munzner, T. Visualization Analysis and Design; CRC Press: Boca Raton, FL, USA, 2014. [Google Scholar]
- Carlis, J.V.; Konstan, J.A. Interactive visualization of serial periodic data. In Proceedings of the 11th Annual ACM Symposium on User Interface Software and Technology, New York, NY, USA, 1–4 November 1998; pp. 29–38. [Google Scholar]
- Min, Y.; Tinghua, A.; Wei, L.; Xiaoqiang, C.; Qi, Z. A Real-time Generalization and Multi-scale Visualization Method for POI Data in Volunteered Geographic Information. Acta Geodaetica Cartogr. Sin. 2015, 44, 228. [Google Scholar]
- Korpi, J.; Ahonen-Rainio, P. Clutter reduction methods for point symbols in map mashups. Cartogr. J. 2013, 50, 257–265. [Google Scholar] [CrossRef]
- Agafonkin, V. RBush-a high-performance JavaScript R-tree-based 2D spatial index for points and rectangles. Available online: https://github.com/mourner/rbush (accessed on 4 December 2016).
- Guttman, A. R-Trees: A Dynamic Index Structure for Spatial Searching; Springer: Berlin, Germany, 1984; Volume 14. [Google Scholar]
- Neumann, A. Spatial, Temporal and Thematic Navigation: Visualizing Biographies of European Artists Using a Task Oriented User Interface Design Approach. Ph.D. Thesis, ETH, Zürich, Switzerland, 2010. [Google Scholar]


| Name | Description and Unit |
|---|---|
| AQI | Air Quality Index, value without unit, range 0–500 |
| SO | Sulfur Dioxide, g/m |
| NO | Nitrogen Dioxide, g/m |
| CO | Carbon Monoxide, |
| O | Ozone, g/m |
| O_8H | 8-h average concentration of Ozone, g/m |
| PM2.5 | Particulate Matter, diameter less than 2.5 m, g/m |
| PM10 | Particulate Matter, diameter less than 10 m, g/m |
| Divisions | Health Influences | Color Coding |
|---|---|---|
| 0–50 | Good: Satisfactory | Green (0,228,0) |
| 51–100 | Moderate: Acceptable, but influential for very sensitive groups. | Yellow (255,255,0) |
| 101–150 | Slightly Unhealthy: Influential for sensitive groups. | Orange (255,126,0) |
| 151–200 | Unhealthy | Red (255,0,0) |
| 200–300 | Very Unhealthy | Purple (153,76,0) |
| >300 | Hazardous | Maroon (126,0,35) |
| IAQI Ranges | SO g/m | NO g/m | PM10 g/m | PM2_5 g/m | CO mg/m | O g /m | O_8H g /m |
|---|---|---|---|---|---|---|---|
| 0 | 0 | 0 | 0 | 0 | 0 | 0 | 0 |
| 50 | 50 | 40 | 50 | 35 | 2 | 160 | 100 |
| 100 | 150 | 80 | 150 | 75 | 4 | 200 | 160 |
| 150 | 475 | 180 | 250 | 115 | 14 | 300 | 215 |
| 200 | 800 | 280 | 350 | 150 | 24 | 400 | 265 |
| 300 | 1600 | 565 | 420 | 250 | 36 | 800 | 800 |
| 400 | 2100 | 750 | 500 | 350 | 48 | 1000 | - |
| 500 | 2620 | 940 | 600 | 500 | 60 | 1200 | - |
© 2017 by the authors. Licensee MDPI, Basel, Switzerland. This article is an open access article distributed under the terms and conditions of the Creative Commons Attribution (CC BY) license (http://creativecommons.org/licenses/by/4.0/).
Share and Cite
Lu, W.; Ai, T.; Zhang, X.; He, Y. An Interactive Web Mapping Visualization of Urban Air Quality Monitoring Data of China. Atmosphere 2017, 8, 148. https://doi.org/10.3390/atmos8080148
Lu W, Ai T, Zhang X, He Y. An Interactive Web Mapping Visualization of Urban Air Quality Monitoring Data of China. Atmosphere. 2017; 8(8):148. https://doi.org/10.3390/atmos8080148
Chicago/Turabian StyleLu, Wei, Tinghua Ai, Xiang Zhang, and Yakun He. 2017. "An Interactive Web Mapping Visualization of Urban Air Quality Monitoring Data of China" Atmosphere 8, no. 8: 148. https://doi.org/10.3390/atmos8080148
APA StyleLu, W., Ai, T., Zhang, X., & He, Y. (2017). An Interactive Web Mapping Visualization of Urban Air Quality Monitoring Data of China. Atmosphere, 8(8), 148. https://doi.org/10.3390/atmos8080148