Article

Mobile DOAS Observations of Tropospheric NO2 Using an UltraLight Trike and Flux Calculation

by
Daniel-Eduard Constantin
1,*,
Alexis Merlaud
2,
Mirela Voiculescu
1,
Carmelia Dragomir
1,
Lucian Georgescu
1,
Francois Hendrick
2,
Gaia Pinardi
2 and
Michel Van Roozendael
2
1
European Center of Excellence for the Environment, Faculty of Sciences and Environment, “Dunarea de Jos” University of Galati, Str. Domneasca 111, Galati 800008, Romania
2
Royal Belgian Institute for Space Aeronomy, Ringlaan-3-Avenue Circulaire, B-1180 Brussels, Belgium
*
Author to whom correspondence should be addressed.
Atmosphere 2017, 8(4), 78; https://doi.org/10.3390/atmos8040078
Submission received: 24 February 2017 / Revised: 18 April 2017 / Accepted: 19 April 2017 / Published: 22 April 2017
(This article belongs to the Special Issue Air Quality Monitoring and Forecasting)

Abstract

:
In this study, we report on airborne Differential Optical Absorption Spectroscopy (DOAS) observations of tropospheric NO2 using an Ultralight Trike (ULT) and associated flux calculations. The instrument onboard the ULT was developed for measuring the tropospheric NO2 Vertical Column Density (VCD) and it was operated for several days between 2011 and 2014, in the South-East of Romania. Collocated measurements were performed using a car-DOAS instrument. Most of the airborne and mobile ground-based measurements were performed close to an industrial platform located nearby Galati city (45.43° N, 28.03° E). We found a correlation of R = 0.71 between tropospheric NO2 VCDs deduced from airborne DOAS observations and mobile ground-based DOAS observations. We also present a comparison between stratospheric NO2 Slant Column Density (SCD) derived from the Dutch OMI NO2 (DOMINO) satellite data product and stratospheric SCDs obtained from ground and airborne measurements. The airborne DOAS observations performed on 13 August 2014 were used to quantify the NO2 flux originating from an industrial platform located nearby Galati city. Measurements during a flight above the industrial plume showed a maximum tropospheric NO2 VCD of (1.41 ± 0.27) × 1016 molecules/cm2 and an associated NO2 flux of (3.45 ± 0.89) × 10−3 kg/s.

1. Introduction

Nitrogen dioxide (NO2) is a chemical gaseous compound with an important role in the Earth’s atmosphere. NO2 is a key trace element in the chemistry of ozone, since it is involved in the catalytic destruction of ozone in the stratosphere [1], while in the troposphere its photolysis leads directly to the formation of ozone (O3) in the presence of VOCs (volatile organic compounds). NO2 is released in the atmosphere from natural sources (soil, lightning, solar cosmic rays) and anthropogenic emissions (fossil fuels and biomass burning, industrial activities). Long-term exposure to NO2 may affect the respiratory system and lead to coronary diseases. NO2 can lead to acidification of the aquatic ecosystem following the oxidation to HNO3.
The Differential Optical Absorption Spectroscopy (DOAS) technique [2] has been used for NO2 atmospheric measurements since the early 1970s [3,4]. Nowadays, besides ground-based zenith sky measurements, DOAS techniques have developed into Multi-Axis Differential Optical Absorption Spectroscopy (MAX-DOAS) observations [5]. The mobile DOAS technique was recently used on several platforms such as: cars [6,7], airplanes [8,9,10], Unmanned Aerial Vehicles (UAVs) [11] or satellites [12,13,14,15,16].
Airborne observations have a number of important advantages for atmospheric research such as: the flexibility during the flights and the possibility to access remote areas such as oceans, deserts, rural or areas without roads.
The ULMs (Ultralight Motorized) are airborne platforms with an important scientific potential for atmospheric research. So far, ULMs have been used to study the ultraviolet actinic radiation flux [17], formaldehyde distribution [18], aerosol profiles [19], SO2, NO2 and ozone distribution [20,21,22,23].
This work highlights the capability of a low-cost system (ULT-DOAS) used for measurements of tropospheric NO2 VCD and associated flux calculations. This study presents airborne DOAS observations of tropospheric NO2 using an Ultralight Trike (ULT) and associated flux calculations. The work presented here was motivated by the need to further assess the intrapixel variability of NO2 detected by UV-VIS DOAS instruments onboard satellites. This work comes in the context of a validation programme of the future Atmospheric Sentinels, starting with the Sentinel-5 Precursor to be launched in summer 2017. A similar system based on DOAS onboard the ULM was used during the Airborne Romanian Measurements of Aerosols and Trace gases (AROMAT) campaign, held in Romania in August 2015 [24]. The AROMAT campaign was conducted under the aegis of the European Space Agency (ESA) in the framework of a series of ESA field campaigns.

2. Methodology

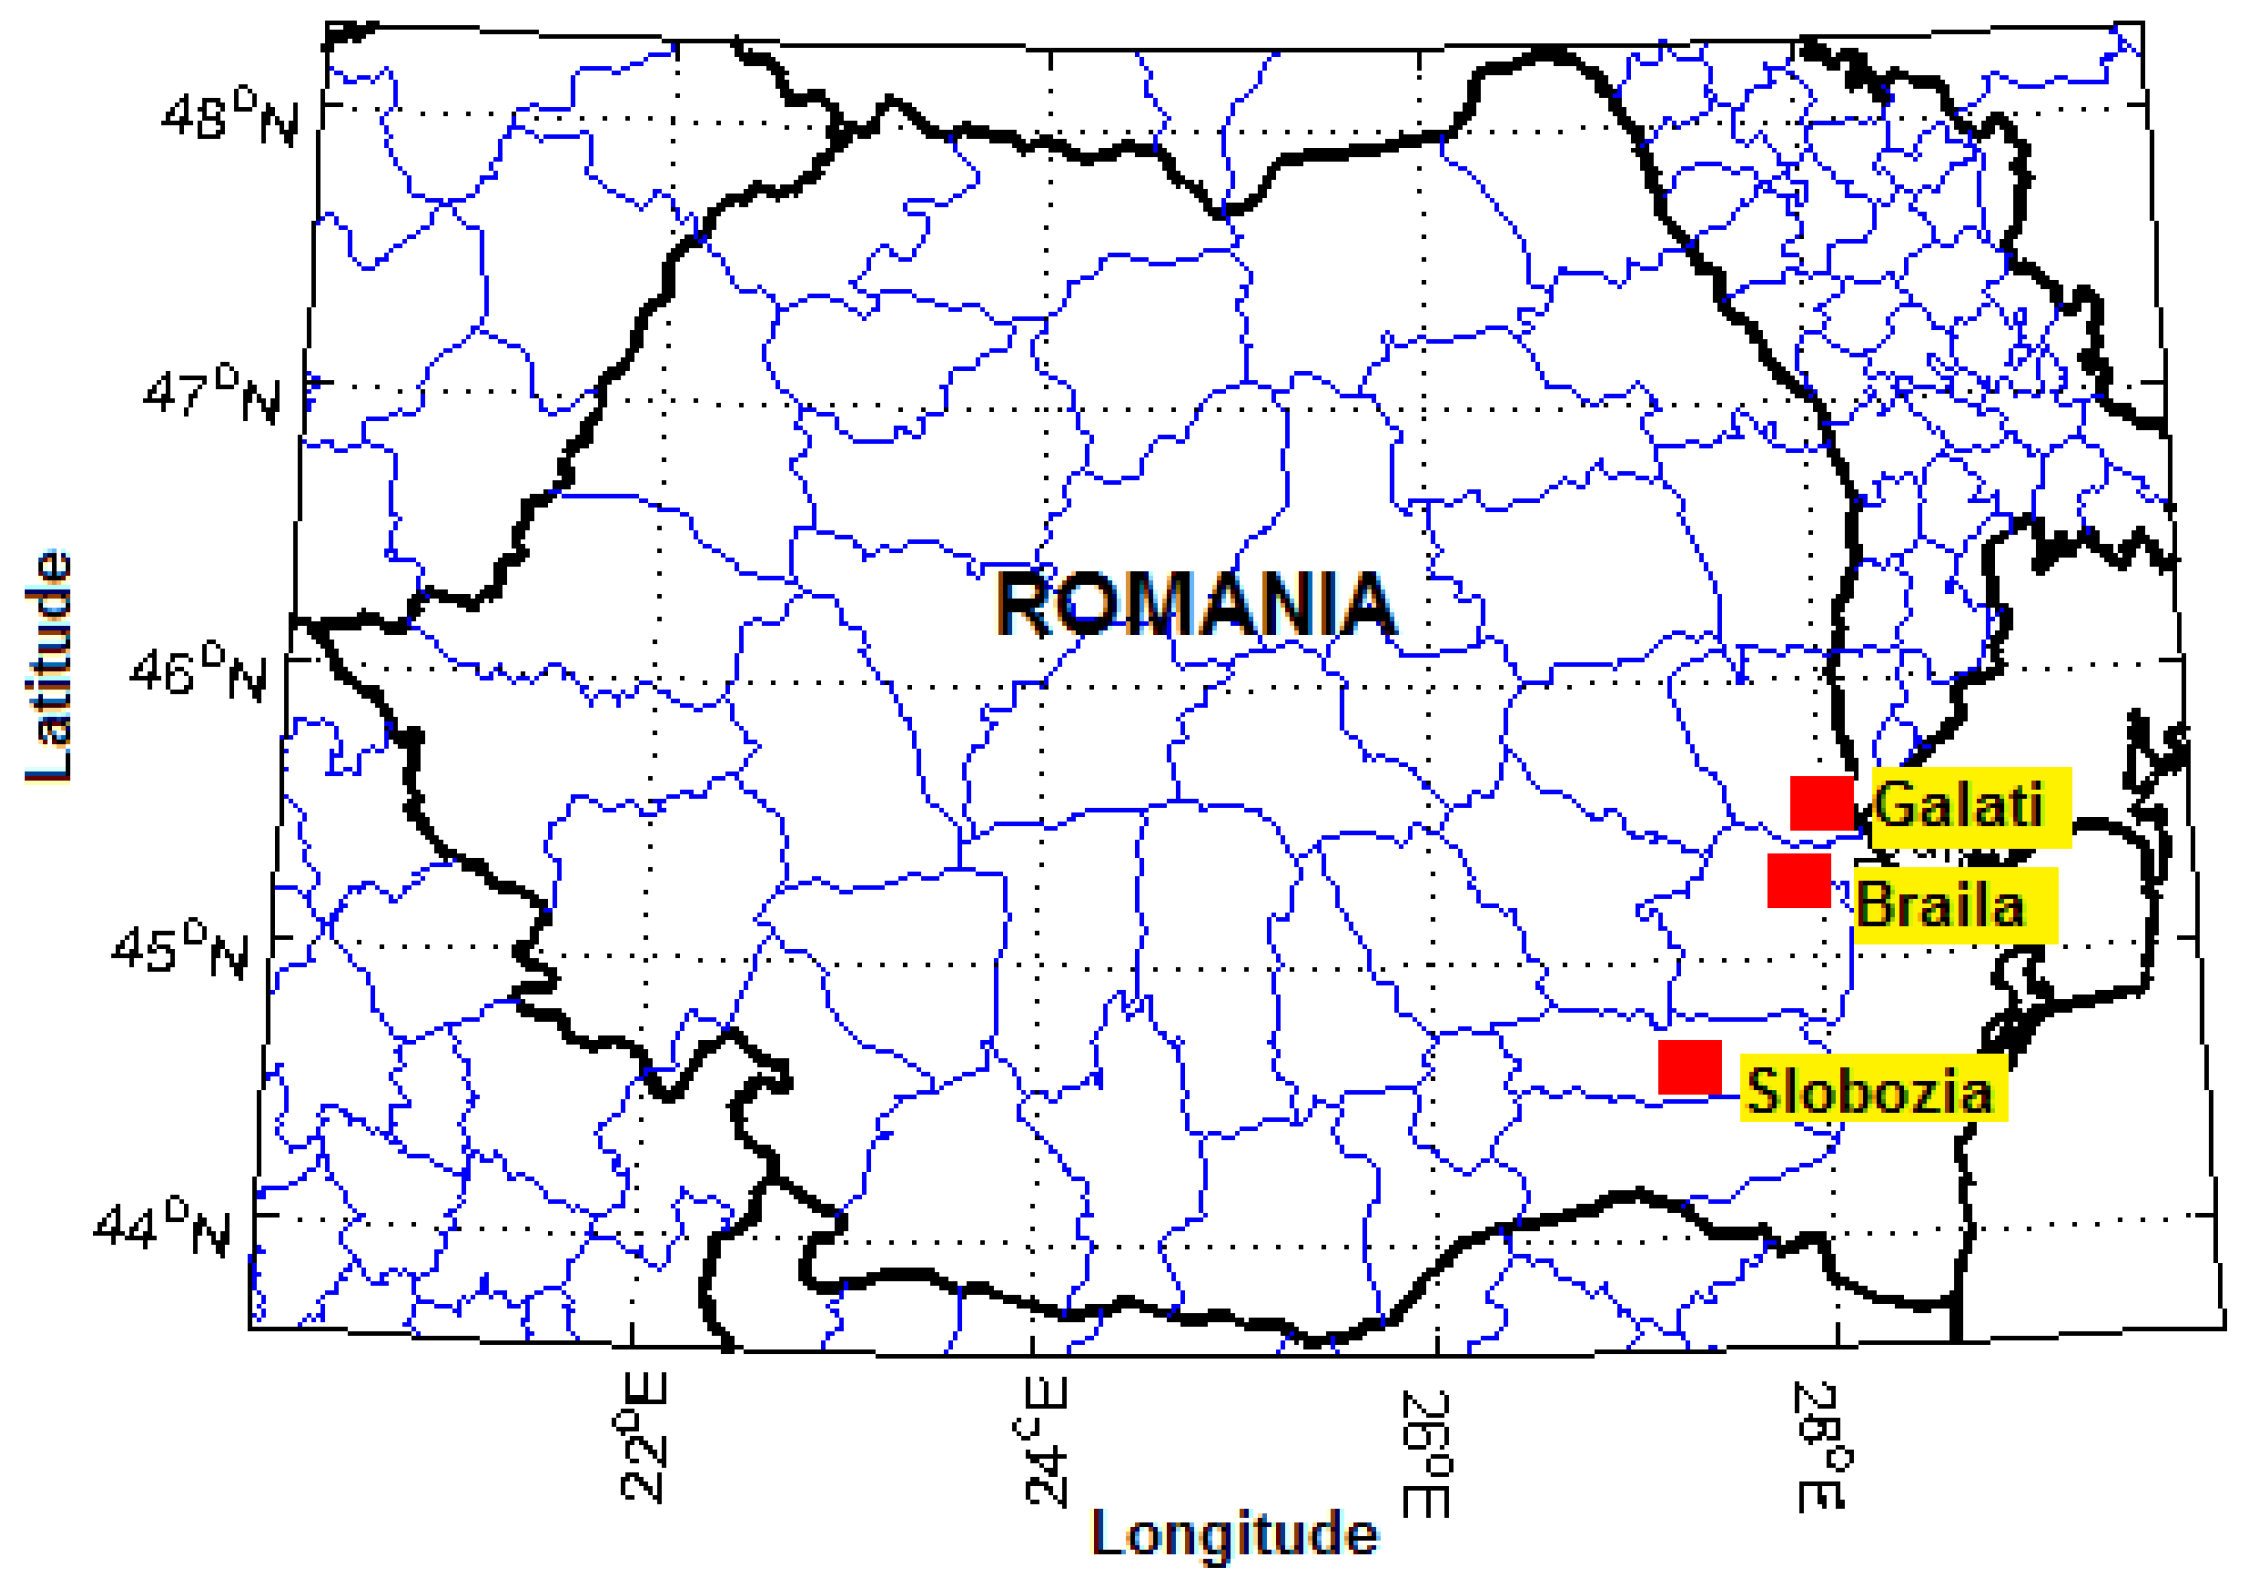
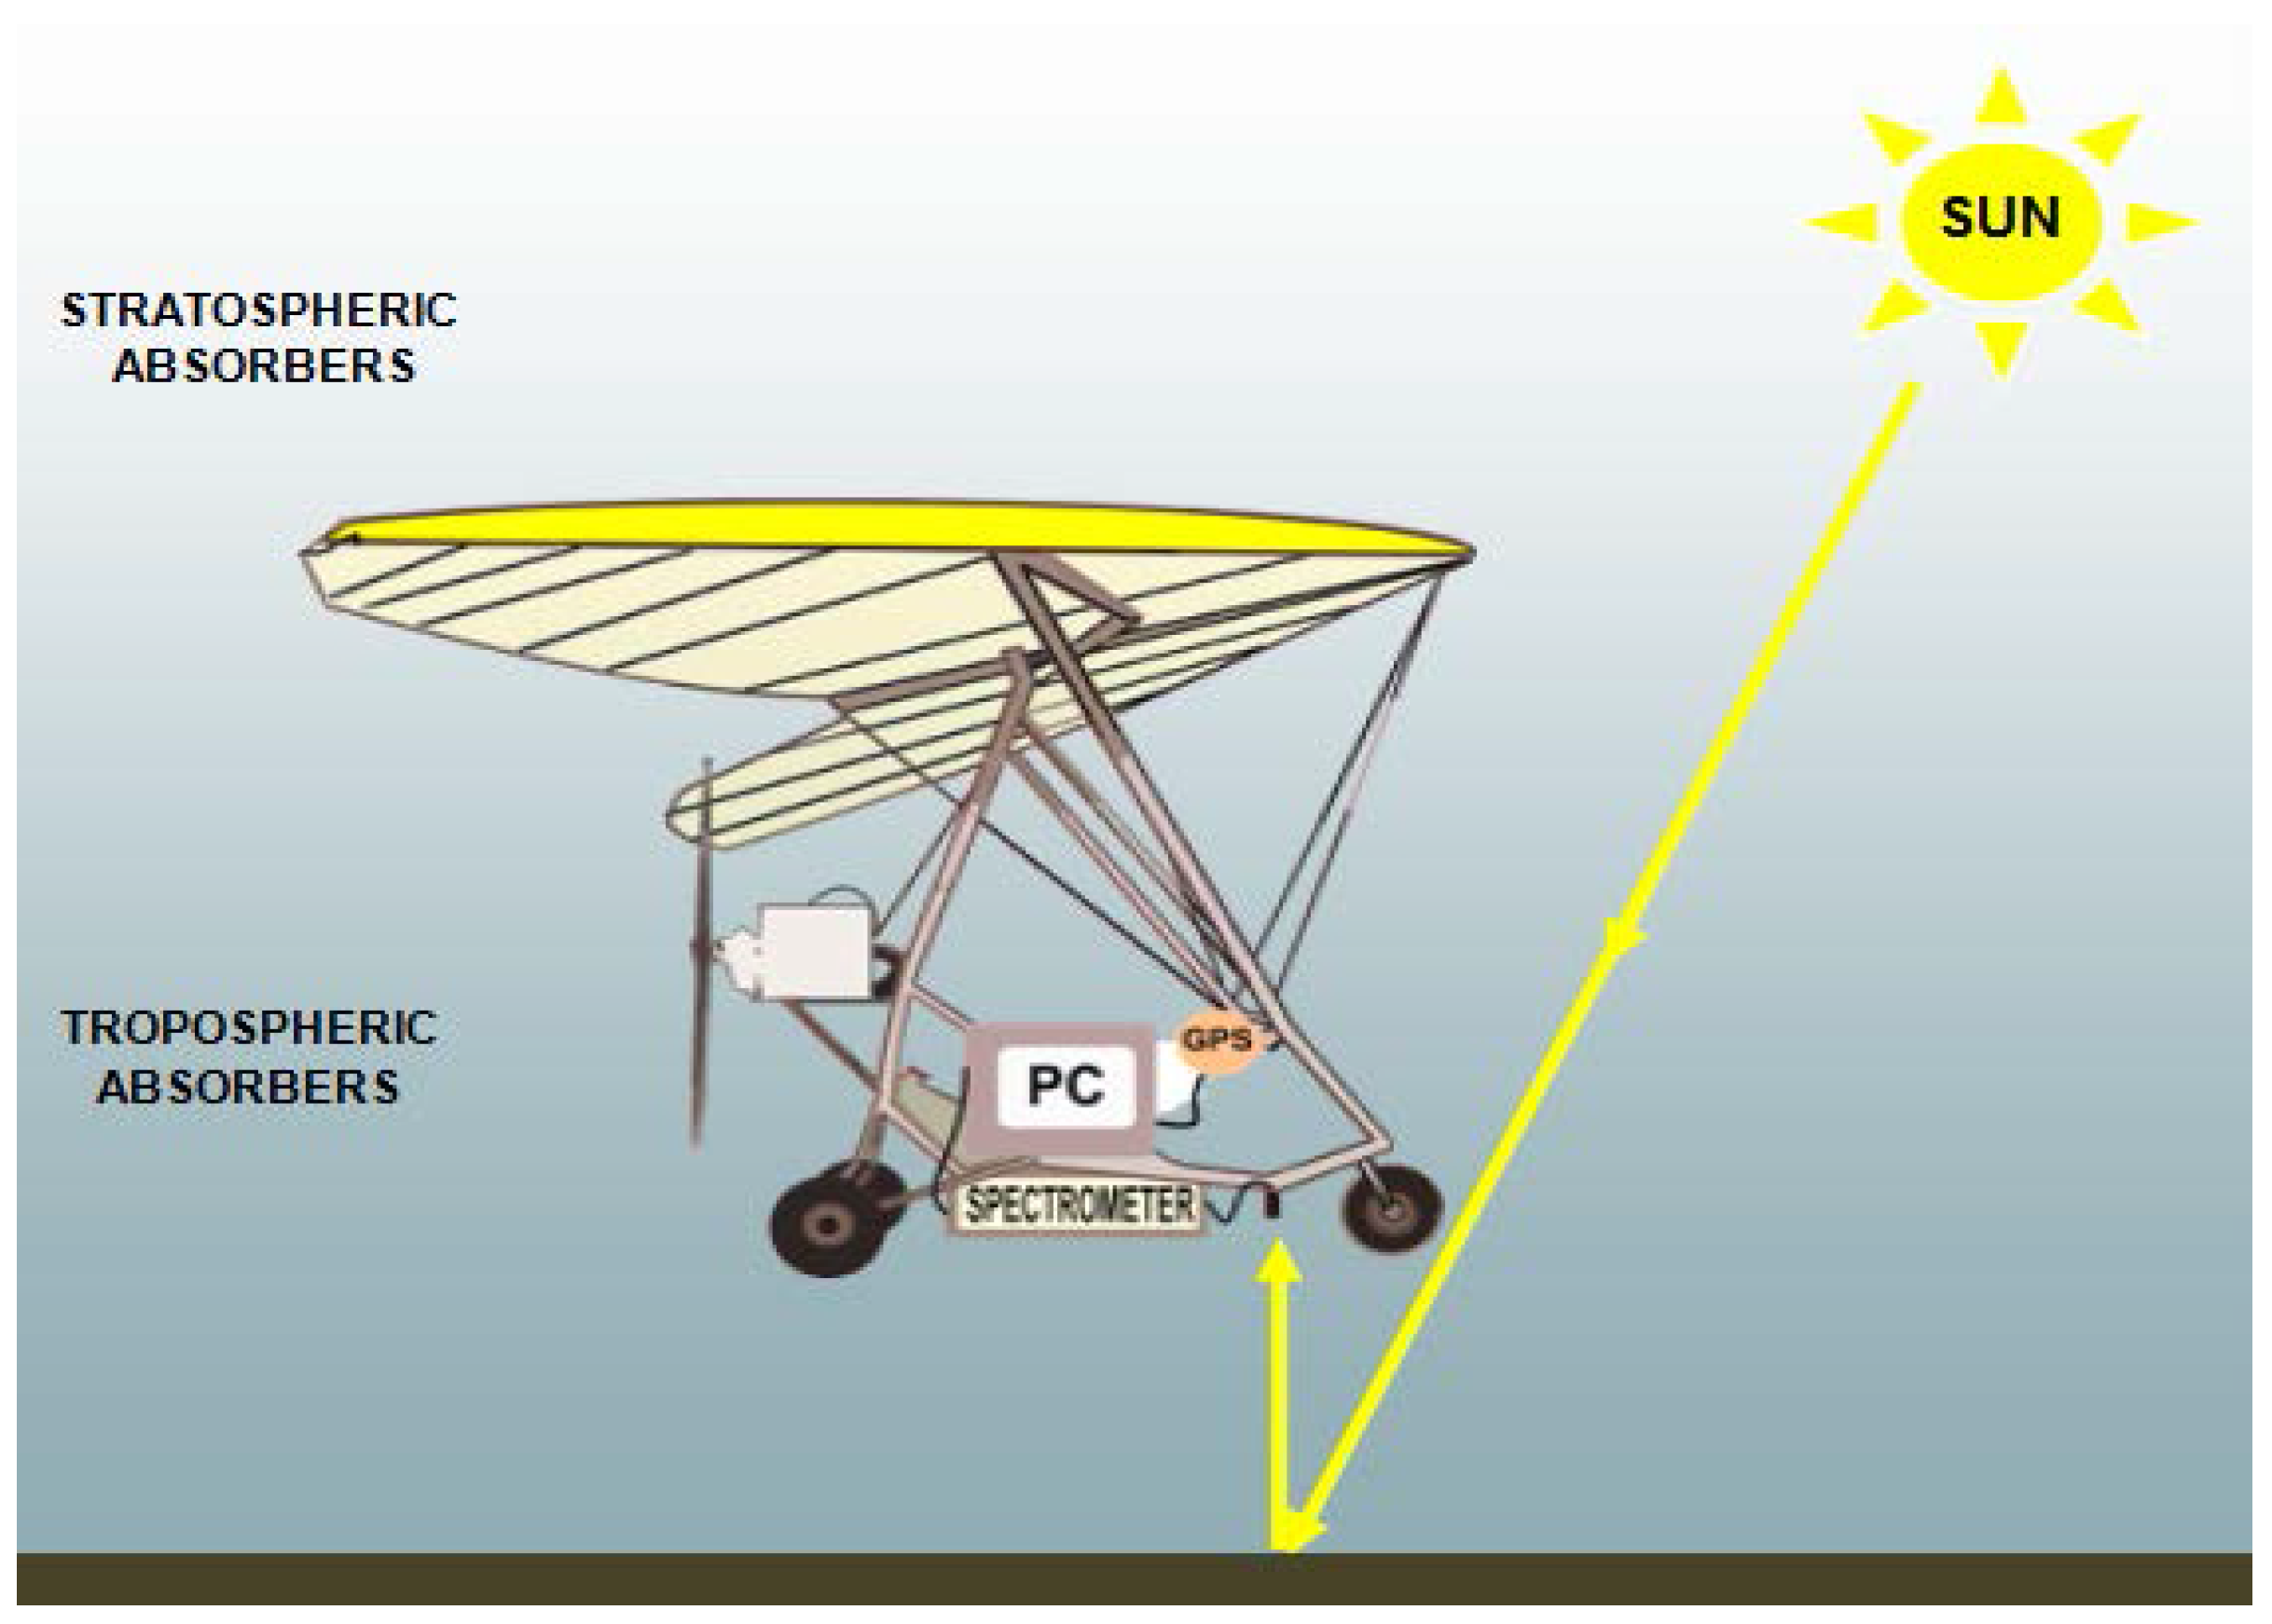
2.1. Experimental and Instrumental Descriptions

The mobile DOAS observations were performed onboard of an Ultralight Trike (ULT), in the South-East of Romania (Figure 1) during several days between 2011 and 2014. All measurements were performed under clear-sky conditions (see Table 1). The Mobile DOAS system used for measurements will be described in the following as the ULT-DOAS system. The measurements took place in an area around Galati (located at 45.43° N, 28.03° E), Braila (45.26° N, 27.95° E), and close to the industrial areas of Slobozia (44.56° N, 27.35° E). Note that an operational steel mill factory is located in the vicinity of Galati, while Slobozia was chosen due to the presence of a fertilizer factory. Due to security concerns, direct flights above the cities or industrial platforms were not performed. Most of the airborne DOAS observations were performed in nadir geometry. Details about the ULT-DOAS measurements are presented in Table 1.
Airborne-DOAS measurements were accompanied by car-DOAS measurements and static twilight observations on 21 July 2014. Static twilight DOAS measurements, used for determination of the NO2 content from the reference spectra, were performed in a rural area close to Galati city. The car-DOAS measurements were performed right before or after the experimental flights.
The aircraft used for all the flight experiments presented in this paper is a double-seated, open-cockpit ultralight aircraft, trike type (model Fanagoria 21, produced by Plovdiv Air Bulgaria). The flexible wing (Atlant-21, produced by Plovdiv Air Bulgaria) has an area of 16 m2. The ULT is powered by a Subaru EA81 engine with 75 HP. The cruise speed is 75 km/h and the maximum speed is 100 km/h relative to the ground. The aircraft has a maximum total weight at take-off of 450 kg.
The ULT-DOAS instrument consists of a compact Czerny-Turner spectrometer (AvaSpec-ULS2048XL-USB2, of 175 × 110 × 44 mm dimensions and 855 g weight) placed in the Ultralight Trike. Figure 2 presents the instrumental DOAS set-up. The spectral range of the spectrometer is 280–550 nm with 0.7 nm resolution (FWHM—Full Width at Half Maximum) with a focal length of 75 mm. The entrance slit is 50 μm and the grating is 1200 L/mm, blazed at 250 nm. The spectrometer is connected to the telescope through a 400 μm chrome-plated brass optical fiber. The telescope achieves a 2.3° field-of-view with fused silica collimating lenses. Each spectrum is recorded by a laptop and georeferenced by a GPS receiver. The spectrometer and the GPS receiver are powered by the laptop USB ports. The entire set-up is powered by 12 V of the ULT through an inverter. Each measurement is a 10-second average of 10 scans accumulations at an integration time between 50 and 150 ms.
This work is mostly based on nadir-DOAS observations but we also present zenith-sky observations onboard ULT for stratospheric NO2 measurements. The same DOAS system was used in the case of the zenith sky car-DOAS observations.

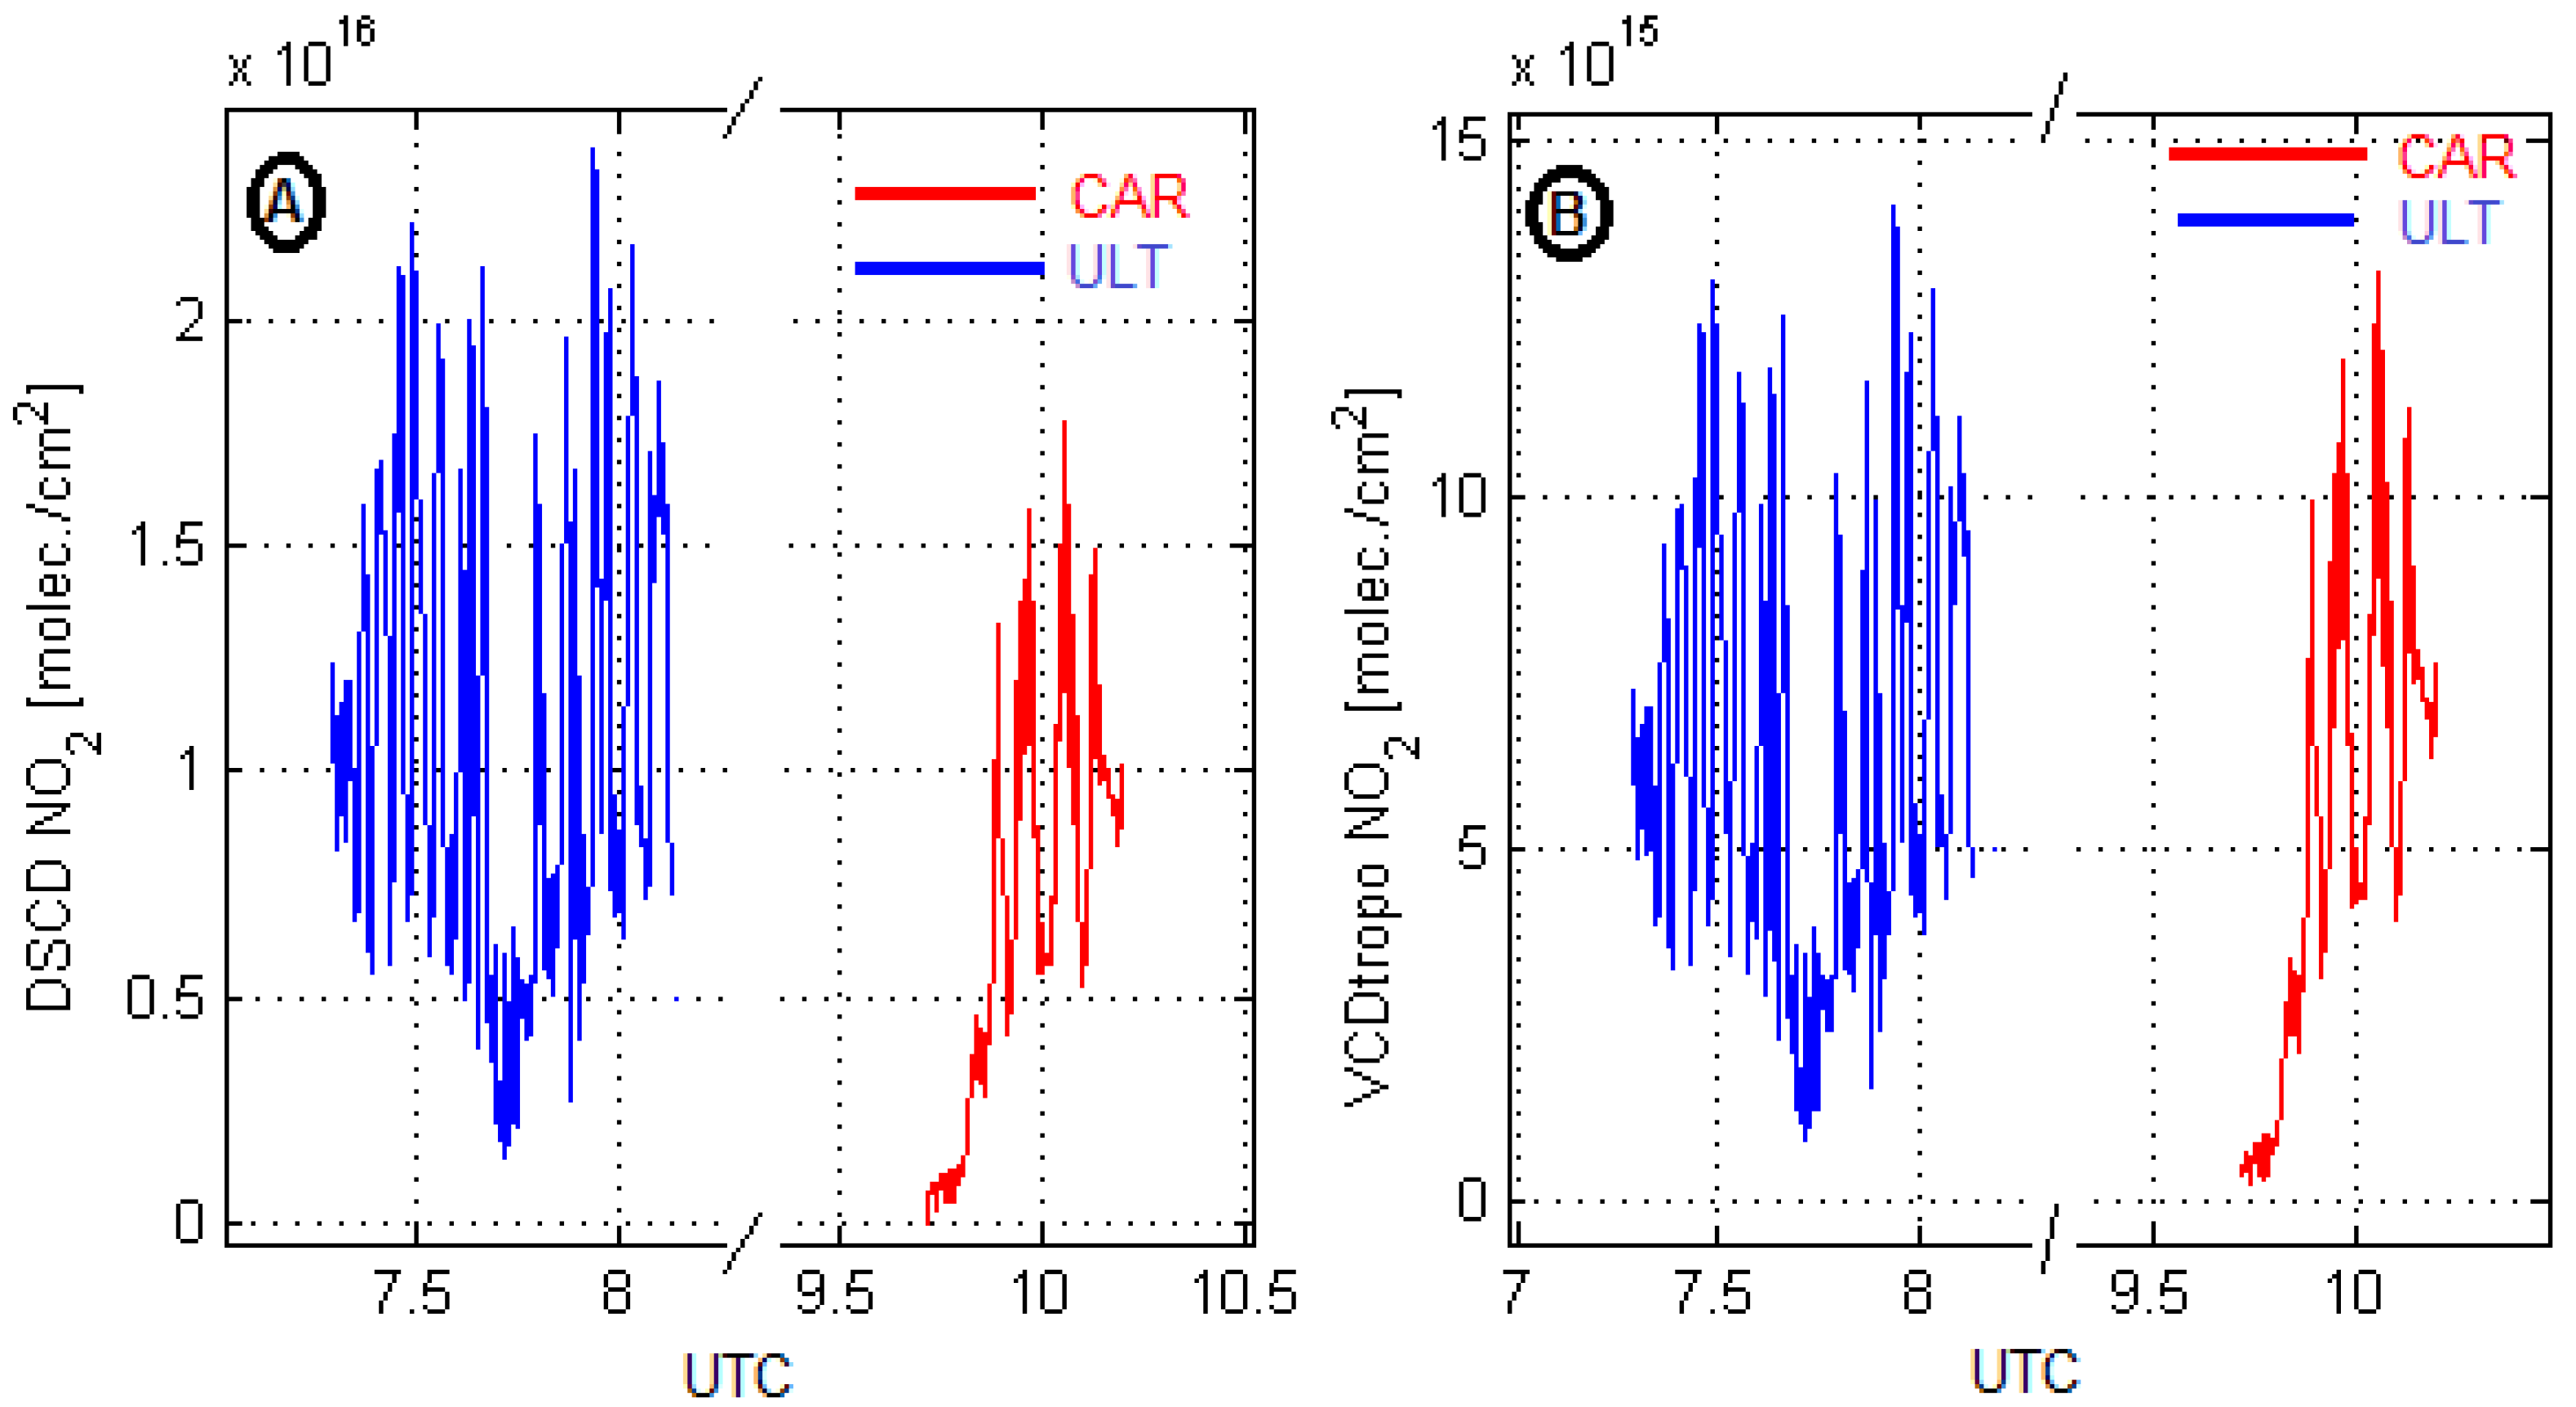
2.2. Determination of the NO2 Tropospheric Vertical Column and Flux Calculation

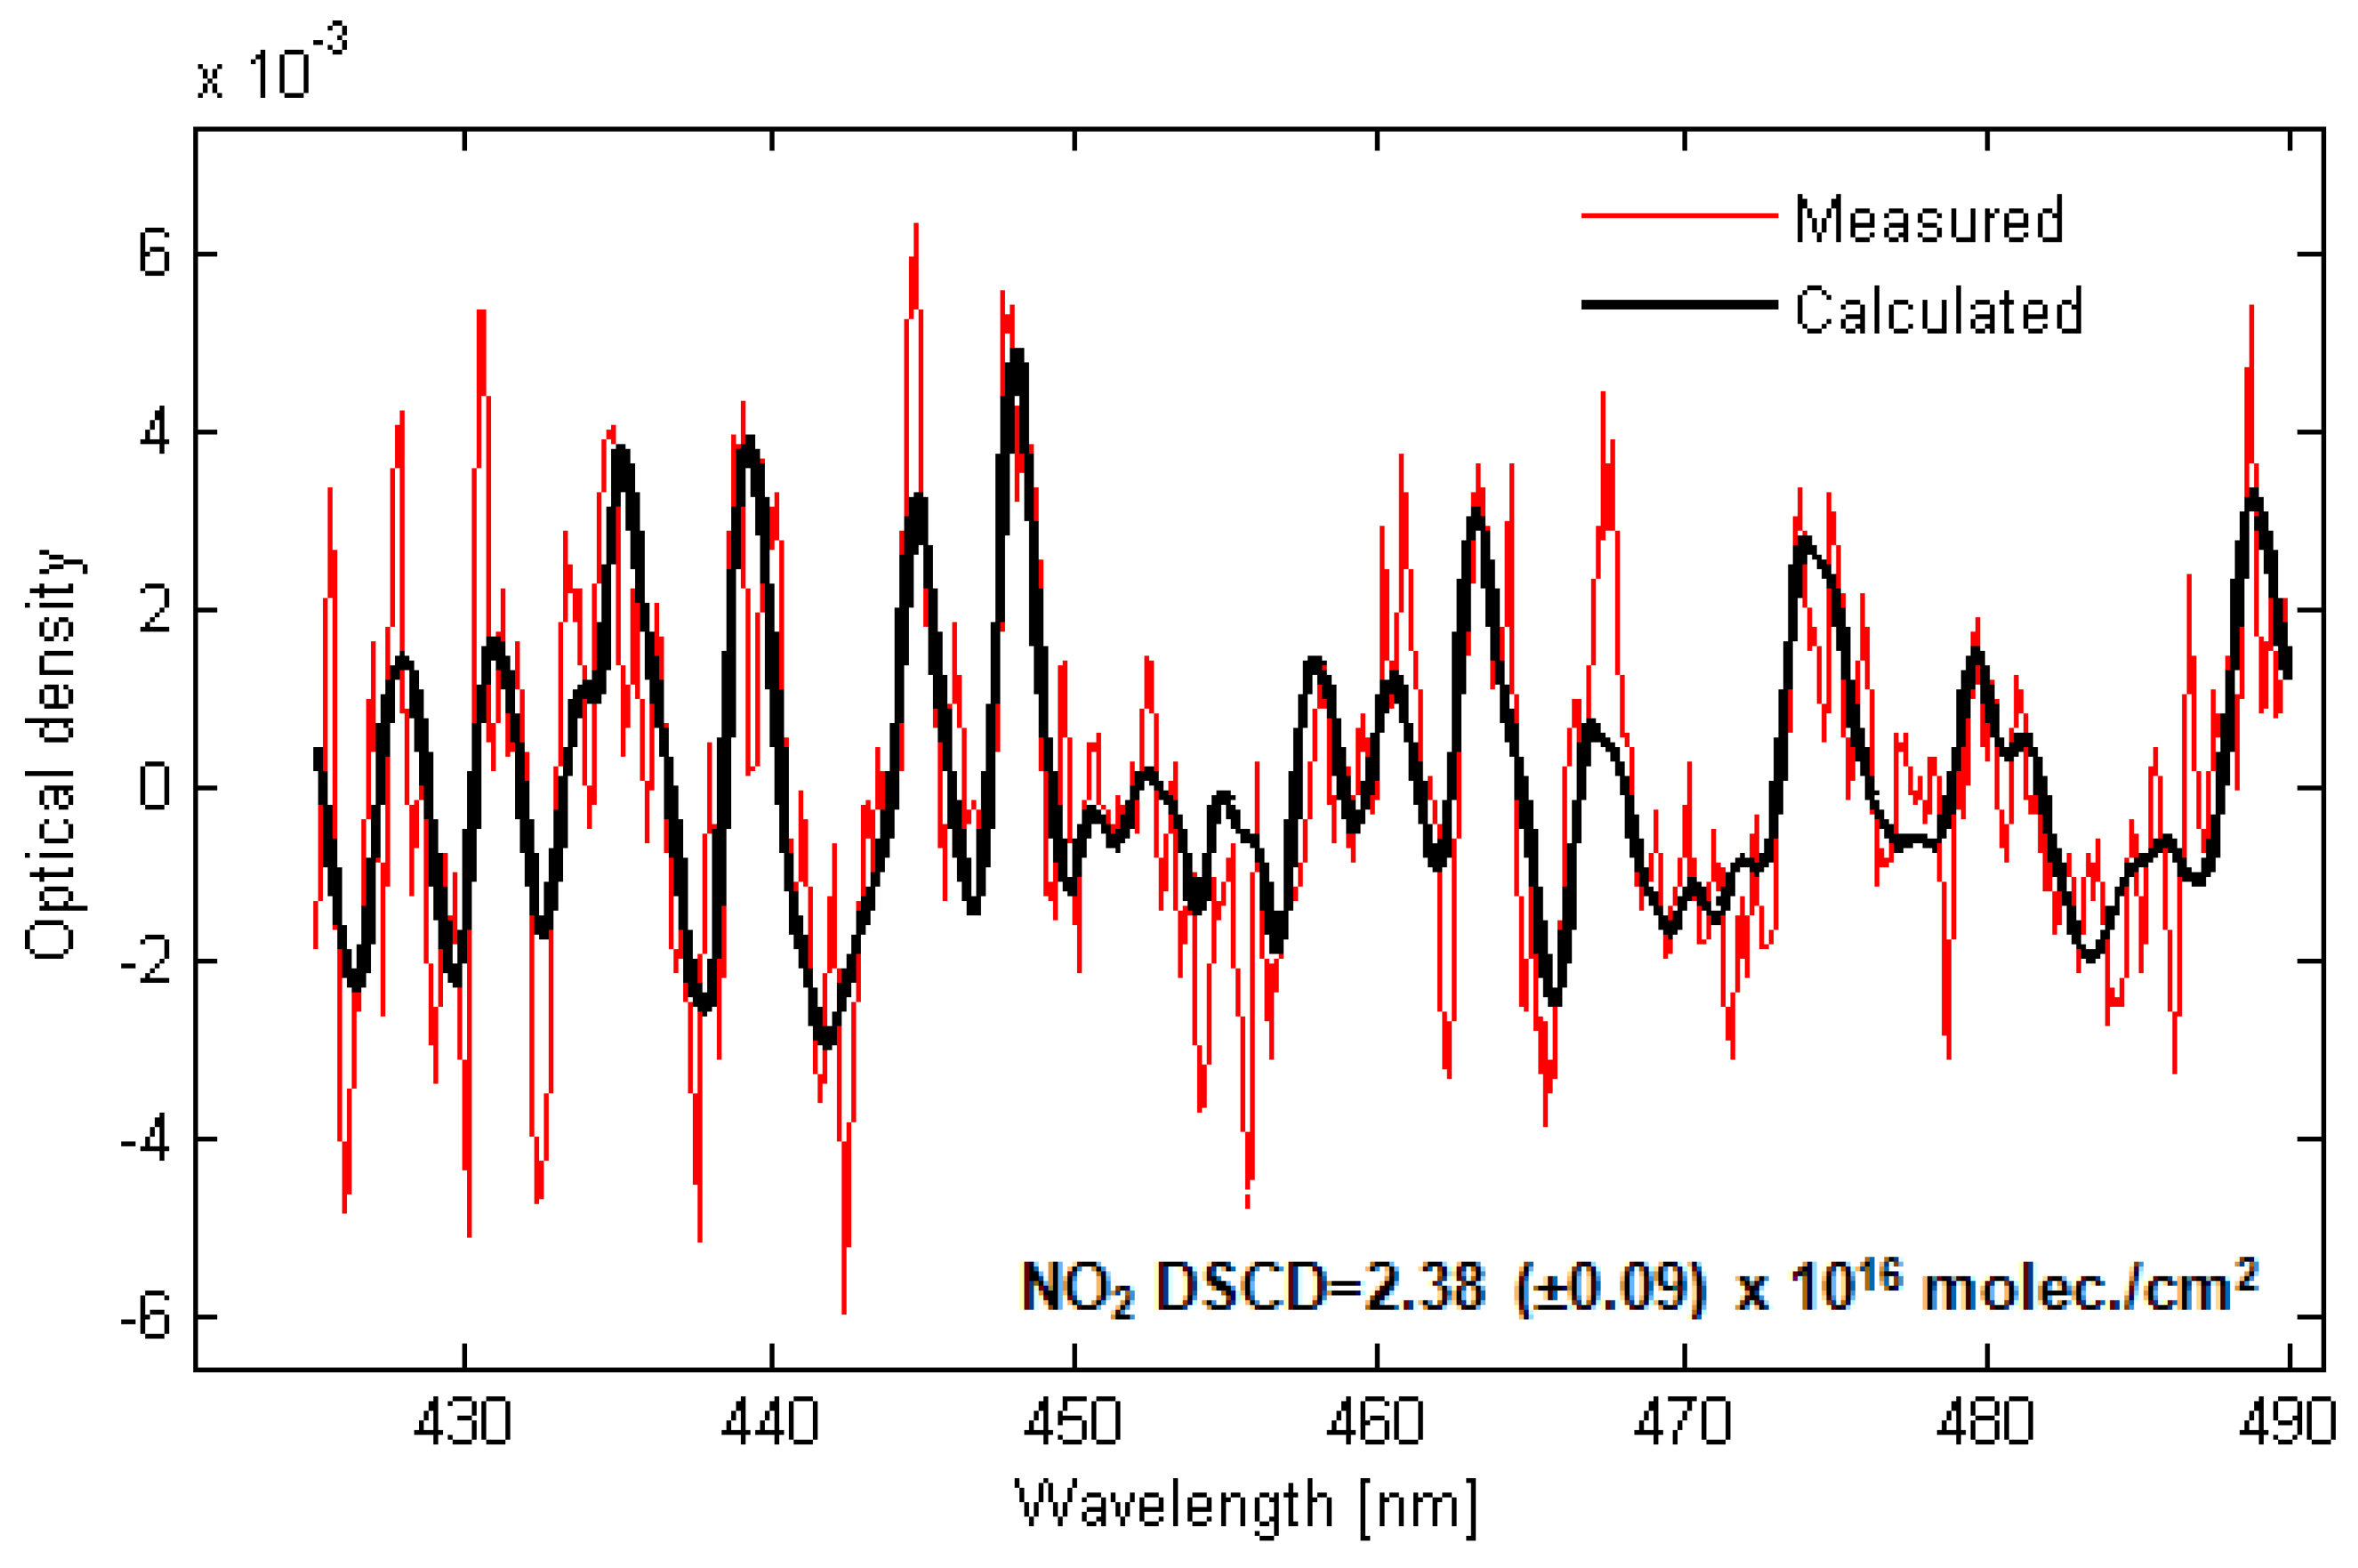
2.2.1. Retrieval of NO2 Slant Column

The analysis of the measured spectra was performed using the QDOAS software [25]. For the NO2 fit, the spectral window of 425–490 nm was used. The NO2 spectral analysis included five absorption cross sections: the NO2 cross sections at 298 K and 220K [26], the O3 cross section at 223 K [27], the O4 cross section [28] and a Ring spectrum [29]. A fifth-degree polynomial to account for scattering processes and broad-band absorption in the atmosphere was used in the DOAS analysis. The direct result of the spectral analysis is a differential slant column density (DSCD), which is the integrated trace gas concentration along the light path through the atmosphere. The DSCD is the difference between the slant column densities in the measured spectra (SCDmeas) and the Fraunhofer reference spectrum (SCDref). The NO2 amount in the Fraunhofer reference spectrum is unknown and its retrieval is important for the determination of the SCDmeas (Equation (1)).
SCD meas = DSCD + SCD ref
Figure 3 presents a typical DOAS fit using a spectrum recorded during the experiment close to the Galati steel factory, on 13 August 2014.
The Slant Column Density (SCD) is converted to a Vertical Column Density (VCD) by means of an Air Mass Factor (AMF), which is defined as the ratio between SCD and VCD (Equation (2))
AMF = SCD VCD = τ SCD τ VCD
where τSCD and τVCD are the optical thickness for the slant column (SCD) and vertical column (VCD), respectively.
Since the measured spectra contain information about both stratospheric and tropospheric NO2 content, the SCDmeas can be written as:
SCD meas = AMF tropo VCD tropo + AMF strato VCD strato SCD ref
The above equations can be further simplified assuming that SCDref is dominated by stratospheric NO2. Using this assumption, the stratospheric contributions can be canceled by the NO2 amount in the reference spectrum (Equation (4)) [8].
VCD tropo = DSCD / AMF tropo
The assumption presented above is valid if the reference spectrum (needed for the spectral evaluation) is recorded at noon, in an area with a very low NO2 content and if SCDstrato does not vary in time. The Fraunhofer reference spectrum could also be a zenith-sky spectrum recorded at high altitude over the boundary layer [30]. However, in this work the tropospheric NO2 VCD is based on calculations using Equation (3).

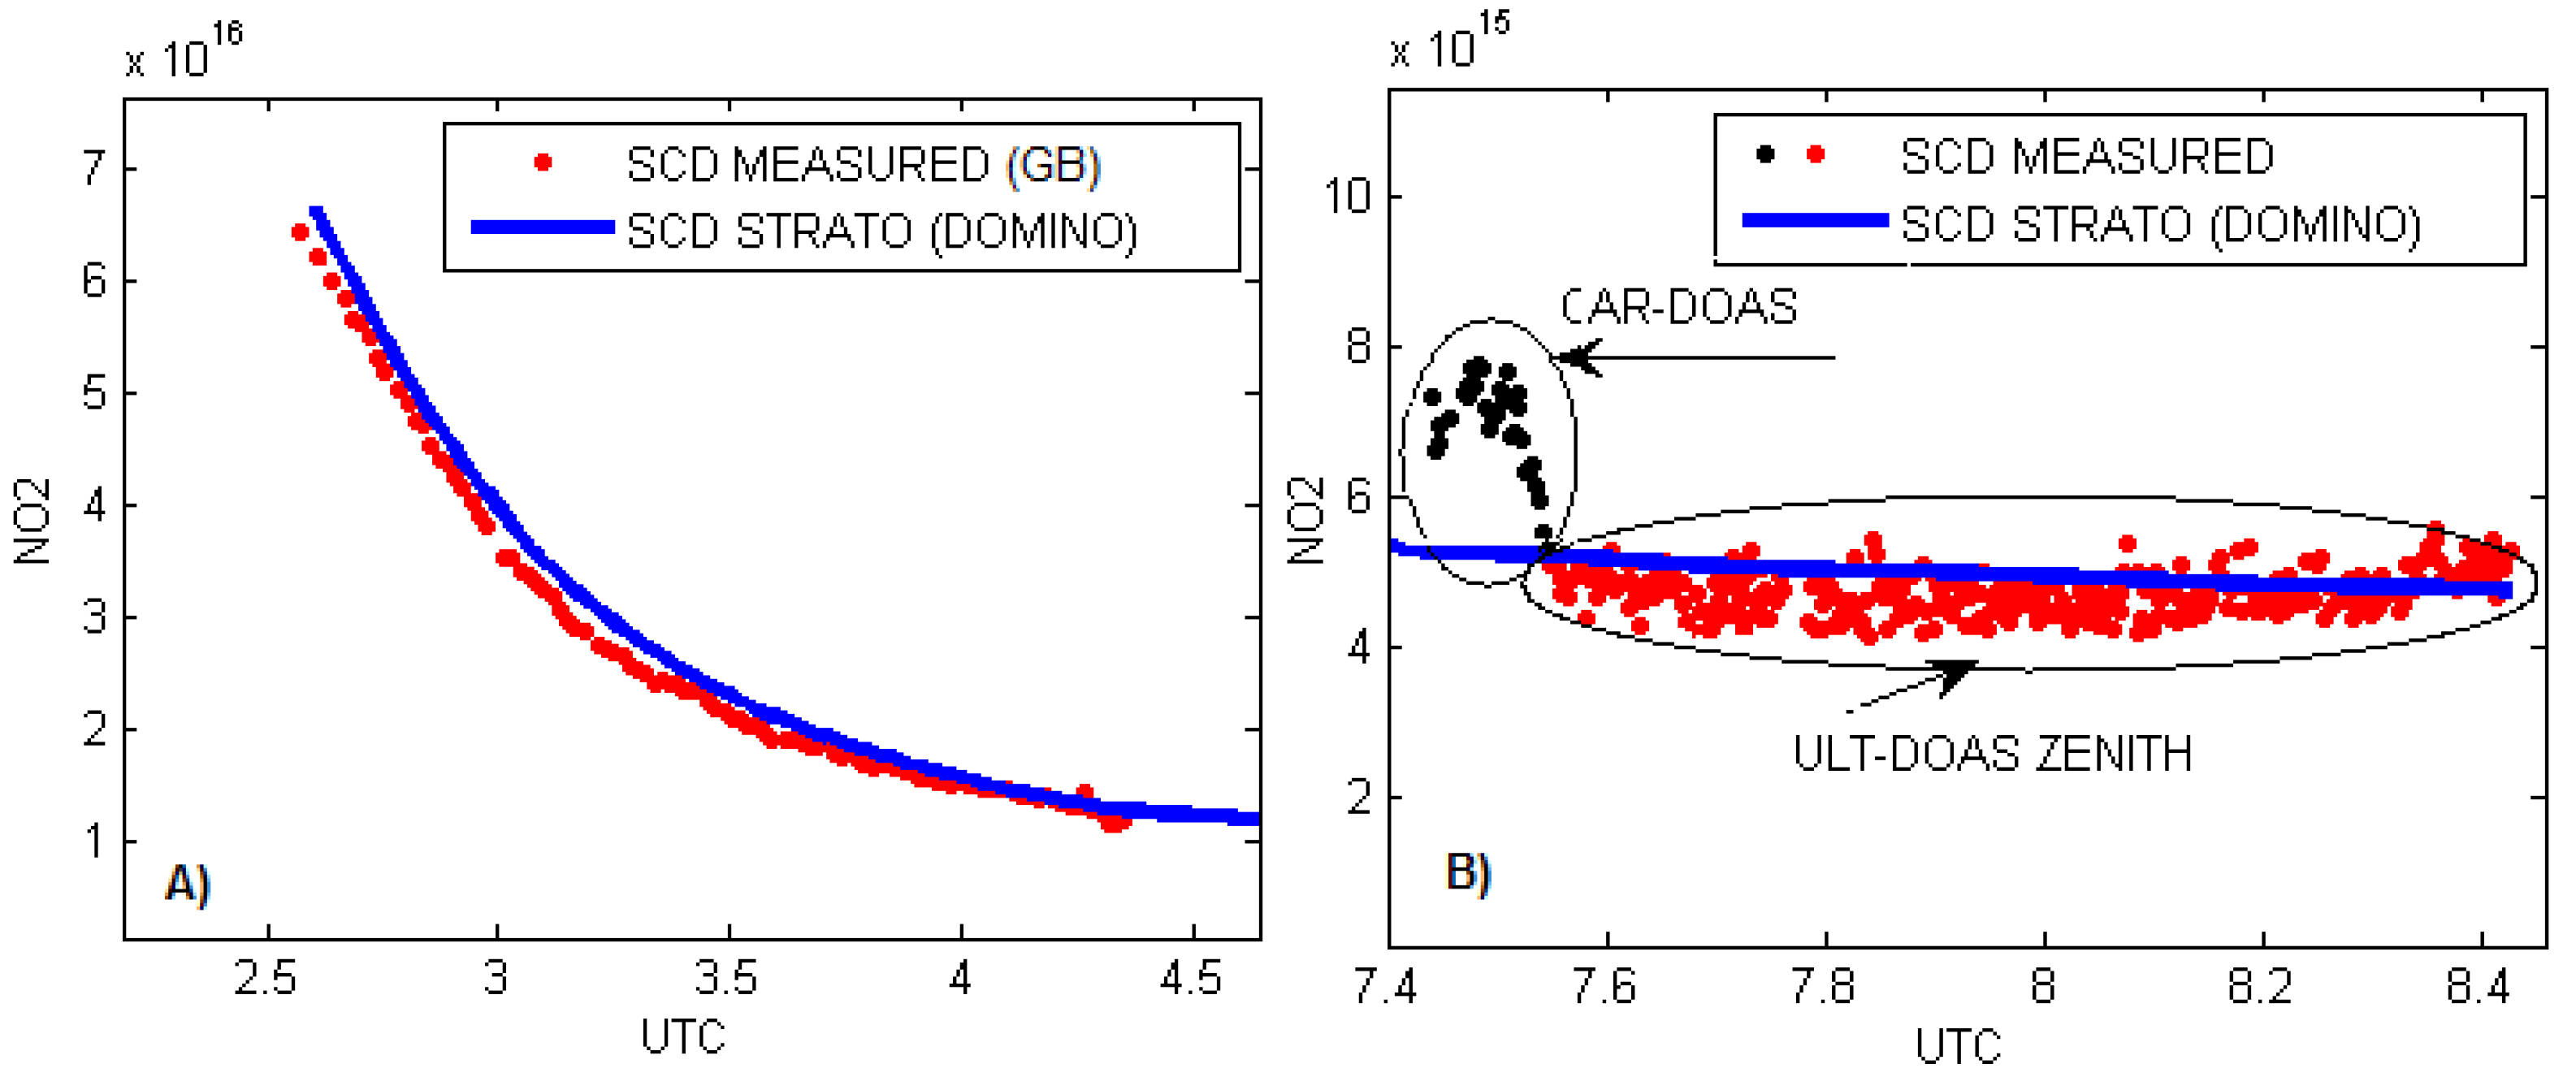
2.2.2. Deduction of the SCDref and VCDstrato

To avoid systematic errors due to the use of multiple reference spectra, only one spectrum will be used for the spectral analysis of all DOAS observations presented in this paper.
The NO2 amount in the reference spectrum was calculated using a photo-chemically modified Langley plot [6,31]. The SCDref corresponds to a zenith spectrum recorded at noon, in a clean rural area close to Galati city. The spectrum was recorded on 13 August 2014 (9.70 UTC and solar zenith angle (SZA) = 31.55°).
The photo-chemically modified Langley plot was applied for the twilight sunrise observations performed on 21 July 2014. By applying the Langley plot method, we calculated the SCDref as 4.1 × 10¹⁵ molecules/cm2 of NO2.
The stratospheric contribution used for the retrieval of the VCDtropo is derived from the assimilated vertical stratospheric columns simulated by Dutch OMI NO2 (DOMINO). Table 2 shows the satellite overpass data sets that were used for the retrieval algorithm presented in this work.
Figure 4A presents the SCD determined at twilight sunrise on 21 July 2014 compared with the SCDstrato derived from the DOMINO Level 2 product [32] scaled with a chemically modified AMF calculated by PSCBOX [33,34]. More details about the retrieval of the SCDstrato using twilight observations and model simulations are presented in [6]. A good agreement between the two types of SCDstrato determinations is obtained, which gives confidence in the stratospheric SCD measured by our static DOAS observations.
Figure 4B shows the SCDstrato derived from DOMINO compared with the SCDs determined by car-DOAS zenith-sky observations and ULT-DOAS measurements performed in the zenith geometry, for the same day of 21 July 2014. From this plot, one can see that the car-DOAS measurements are dominated by tropospheric NO2 while the zenith-sky ULT-DOAS observation presents a low amount of NO2 close to the stratospheric NO2 SCD derived from OMI. This is due to the fact that zenith-sky ULT-DOAS observations are performed above the NO2 plume or above the planetary boundary layer.

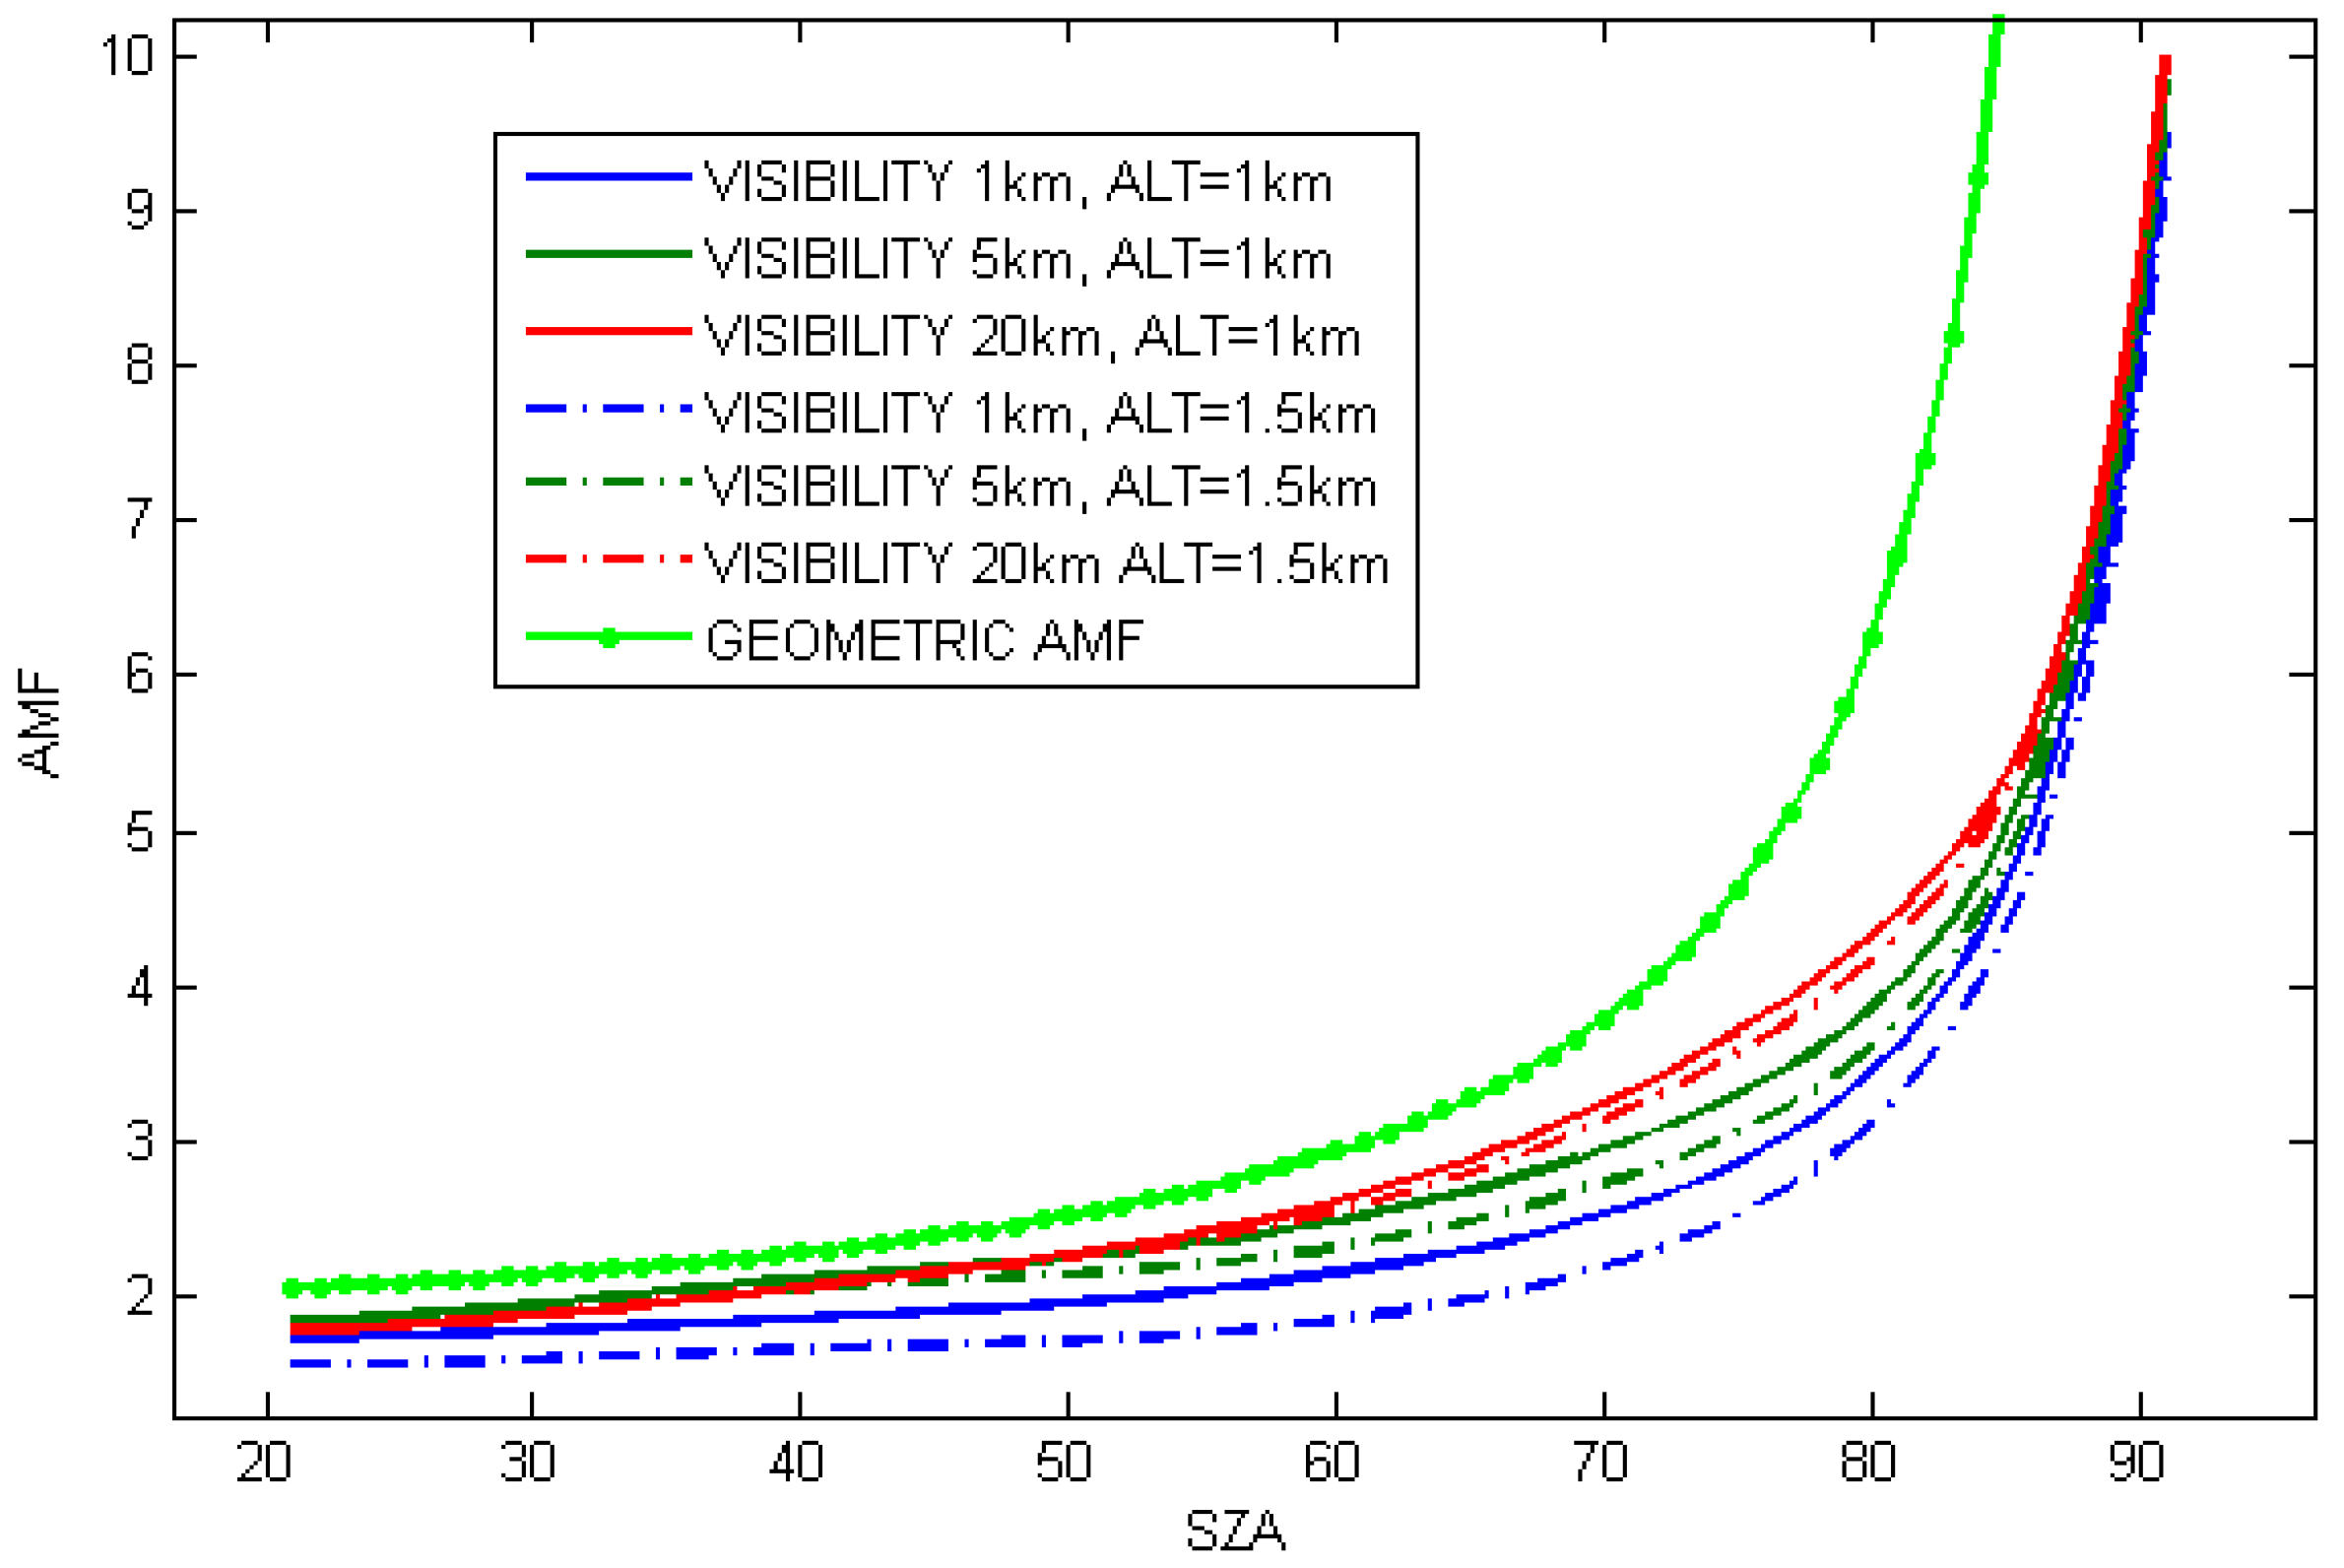
2.2.3. Radiative Transfer Calculation

In order to determine the VCD, the SCD retrieved with the DOAS method has to be converted using an appropriate AMF. The geometric approximation for the airborne DOAS observations assumes a simple reflection of the sunlight on the earth’s surface. In this case (neglecting the earth’s sphericity) the nadir AMF can be described as a function of the solar zenith angle (SZA) as:
AMF geo = 1 + 1 / cos ( SZA )
Since the ULT-DOAS measurements were performed in the open atmosphere using scattered sunlight radiation, the radiative transfer during the observations needs to be modeled to interpret the retrieved data. In this work, the AMF was calculated using the radiative transfer model (RTM) UVspec/DISORT [35], which is a fully spherical model. This RTM has been validated using six other different codes [34].
The general assumptions made for the radiative transfer calculation using the RTM UVspec/DISORT are introduced in Table 3.
Results of AMF simulations for the nadir flight performed on 13 August 2014, using the input parameters presented in Table 3, are displayed in Figure 5. The geometric AMF for the nadir view is also shown. The visibility parameter accounts for the effect of aerosols.

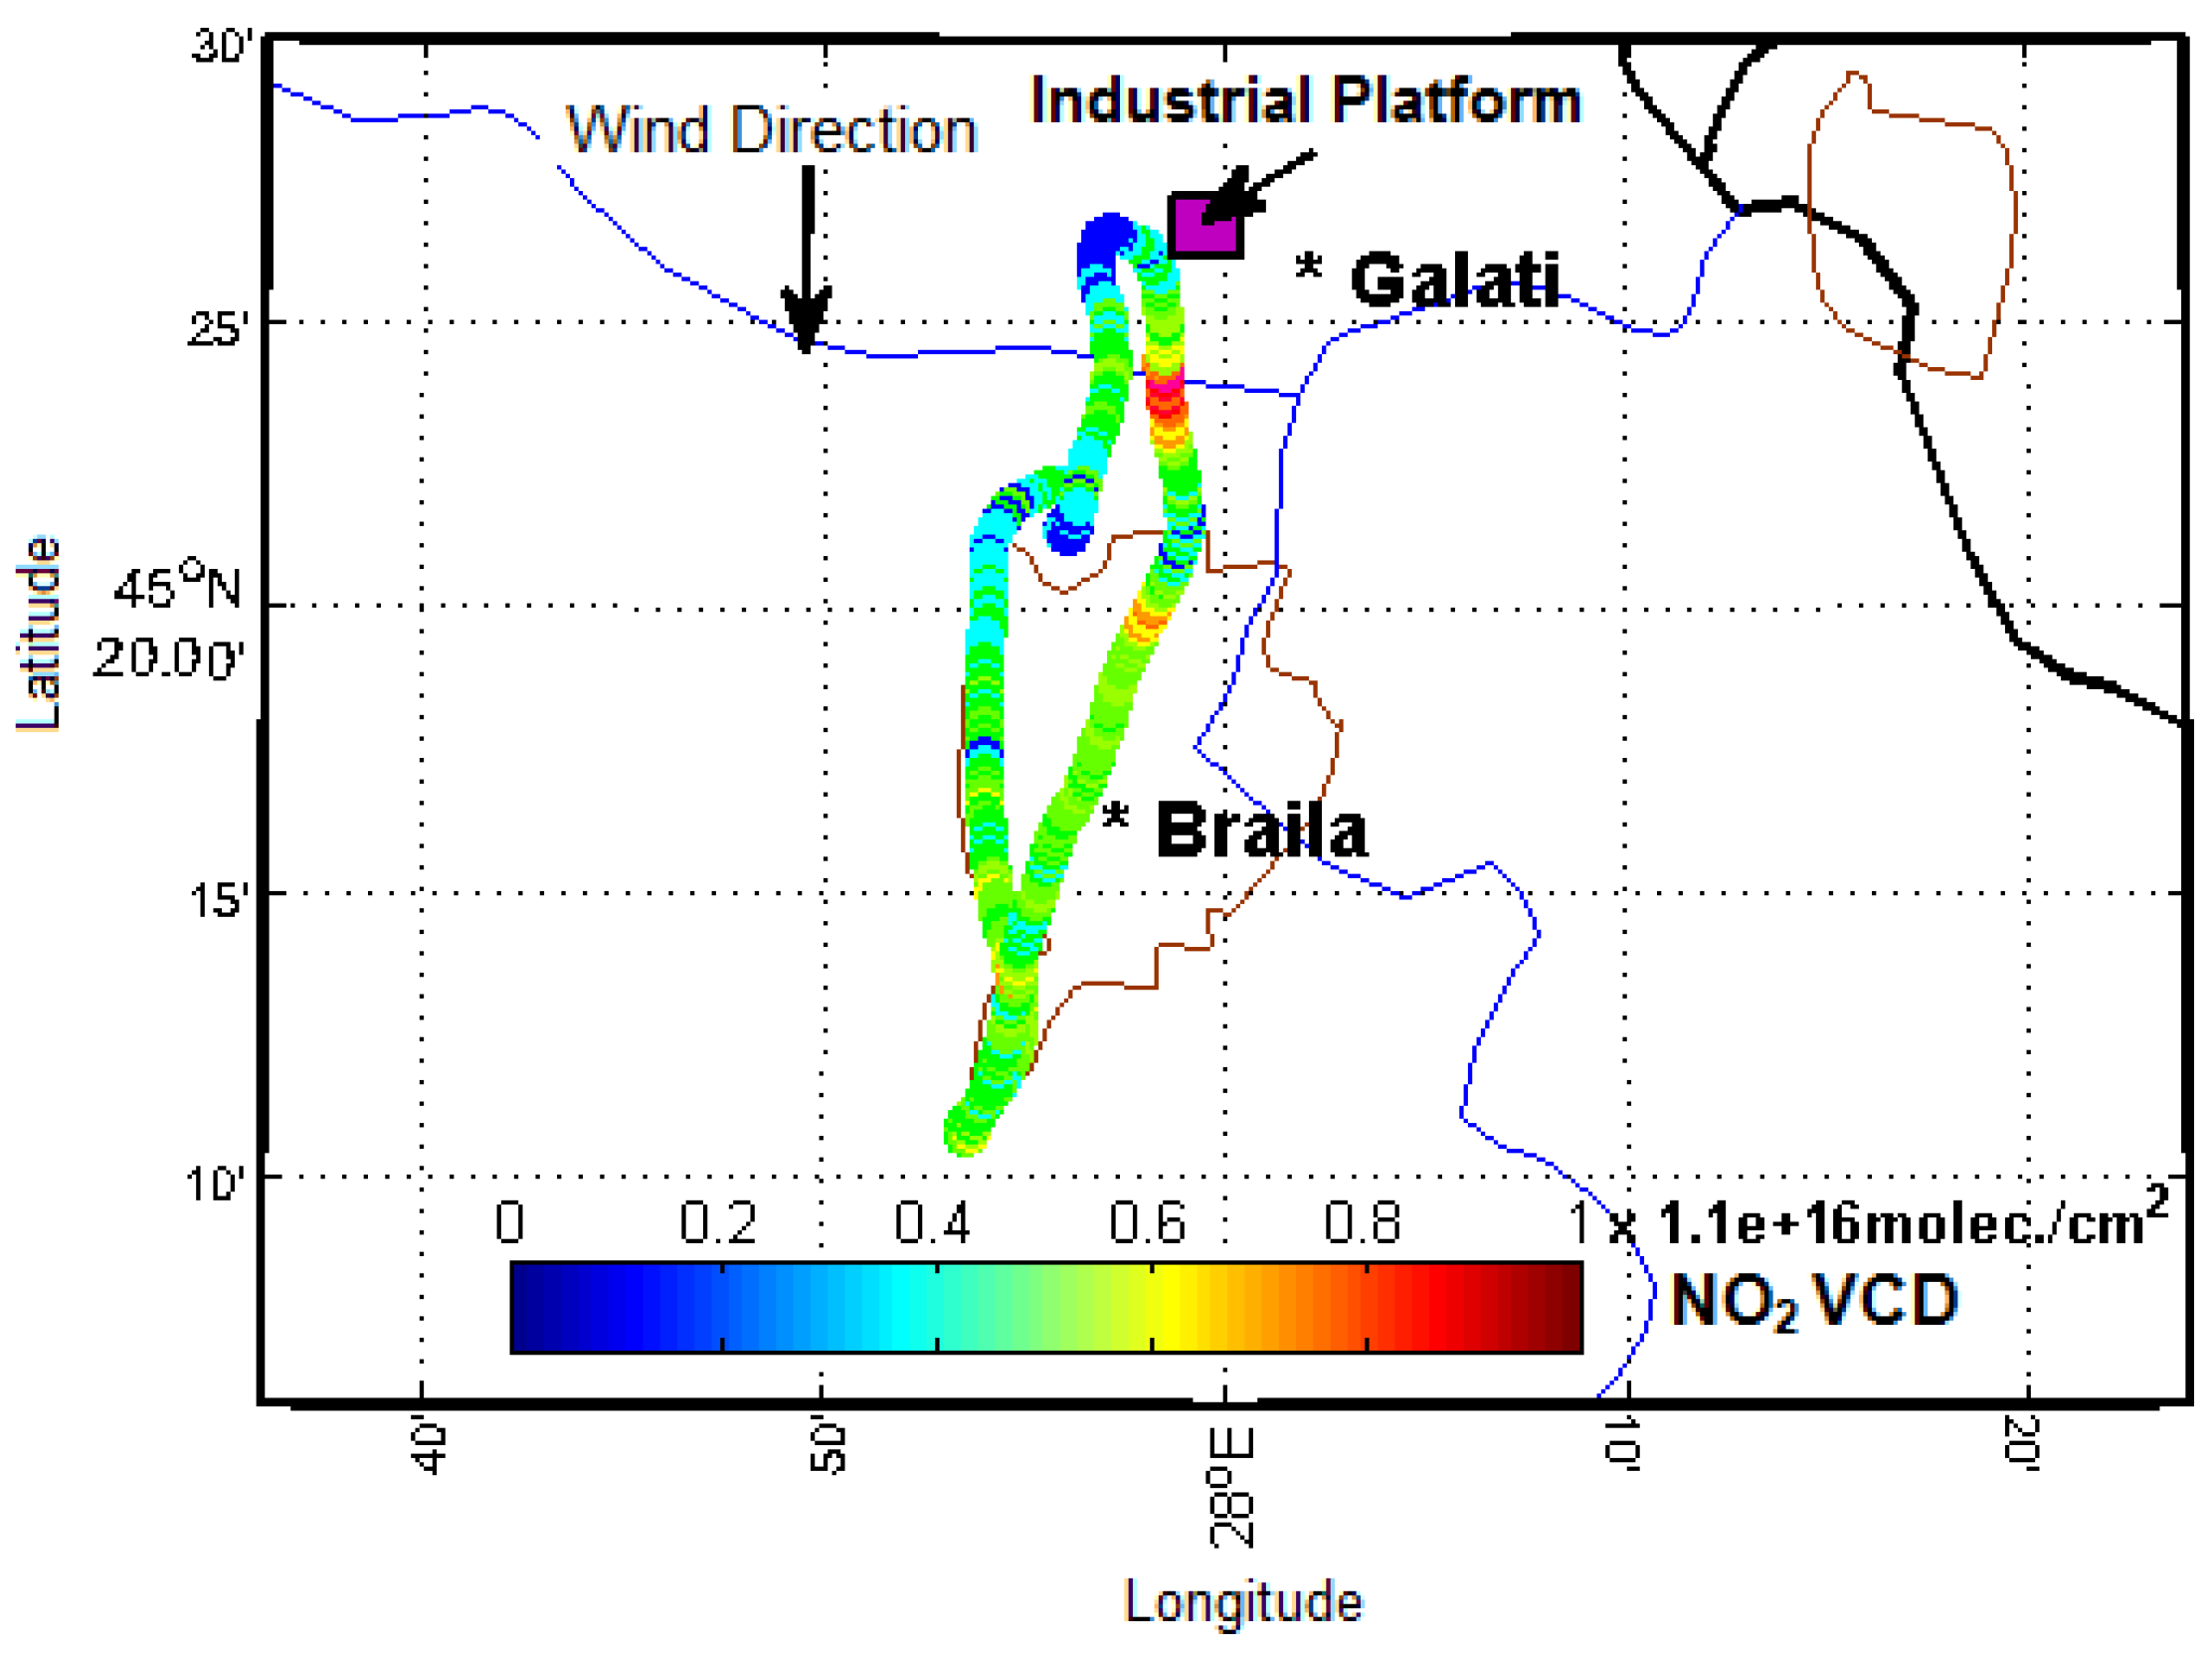
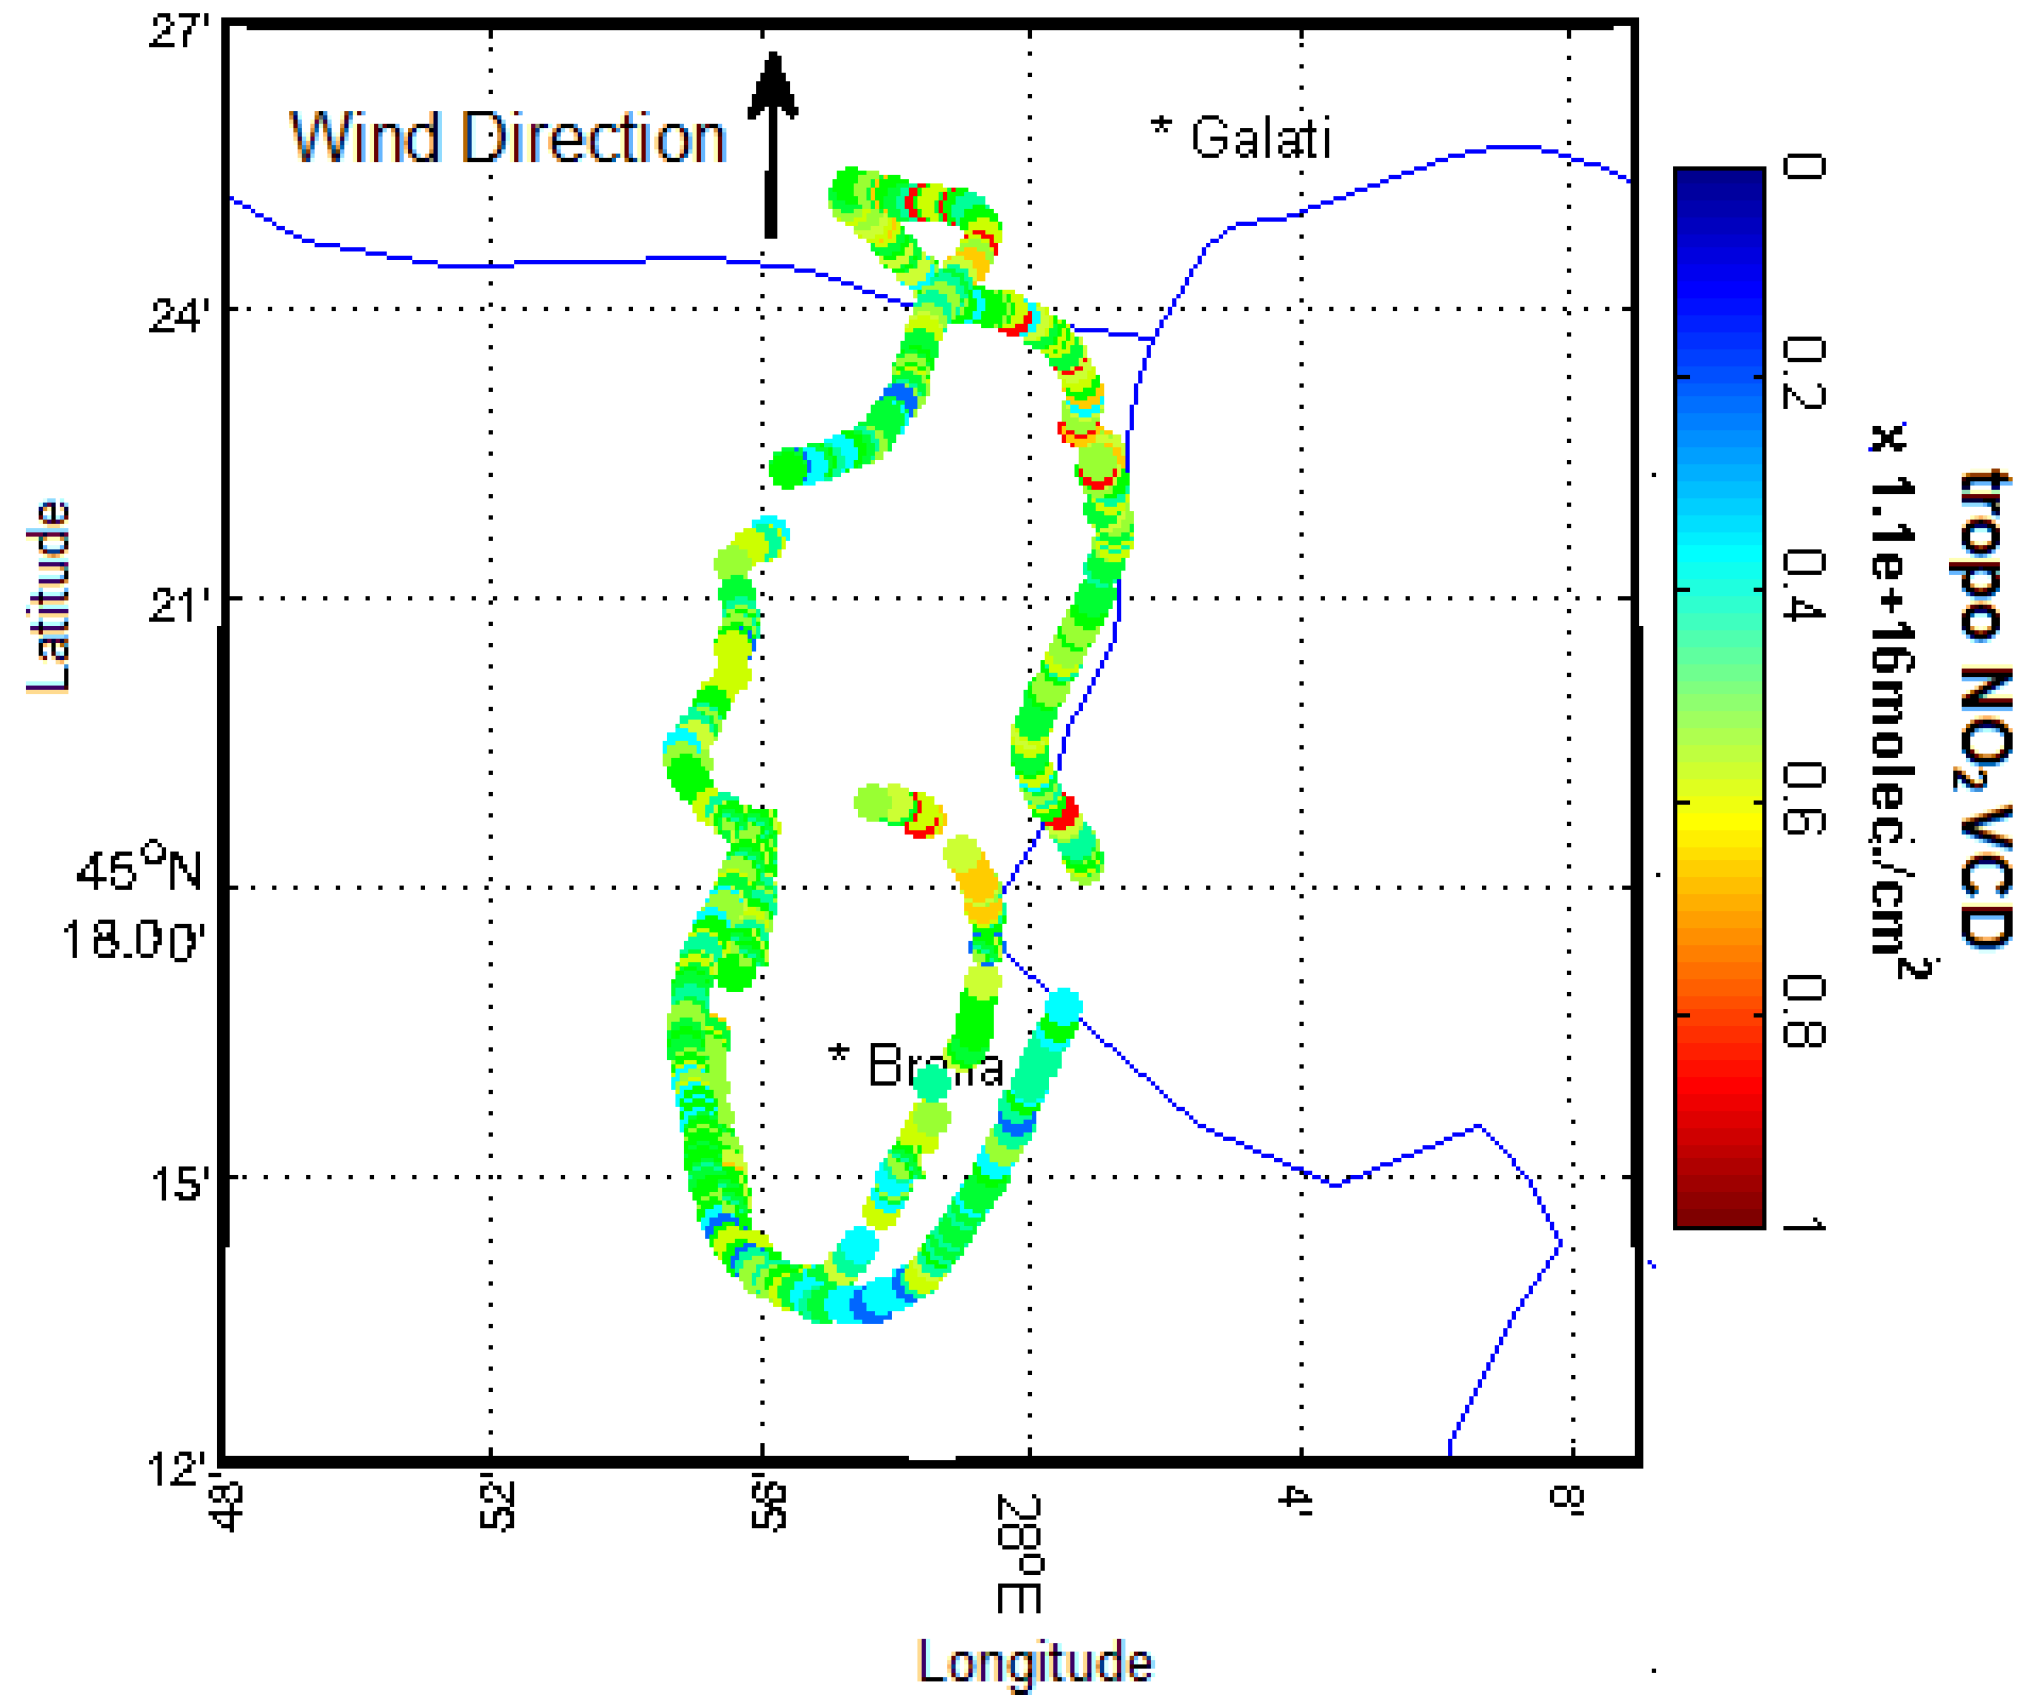
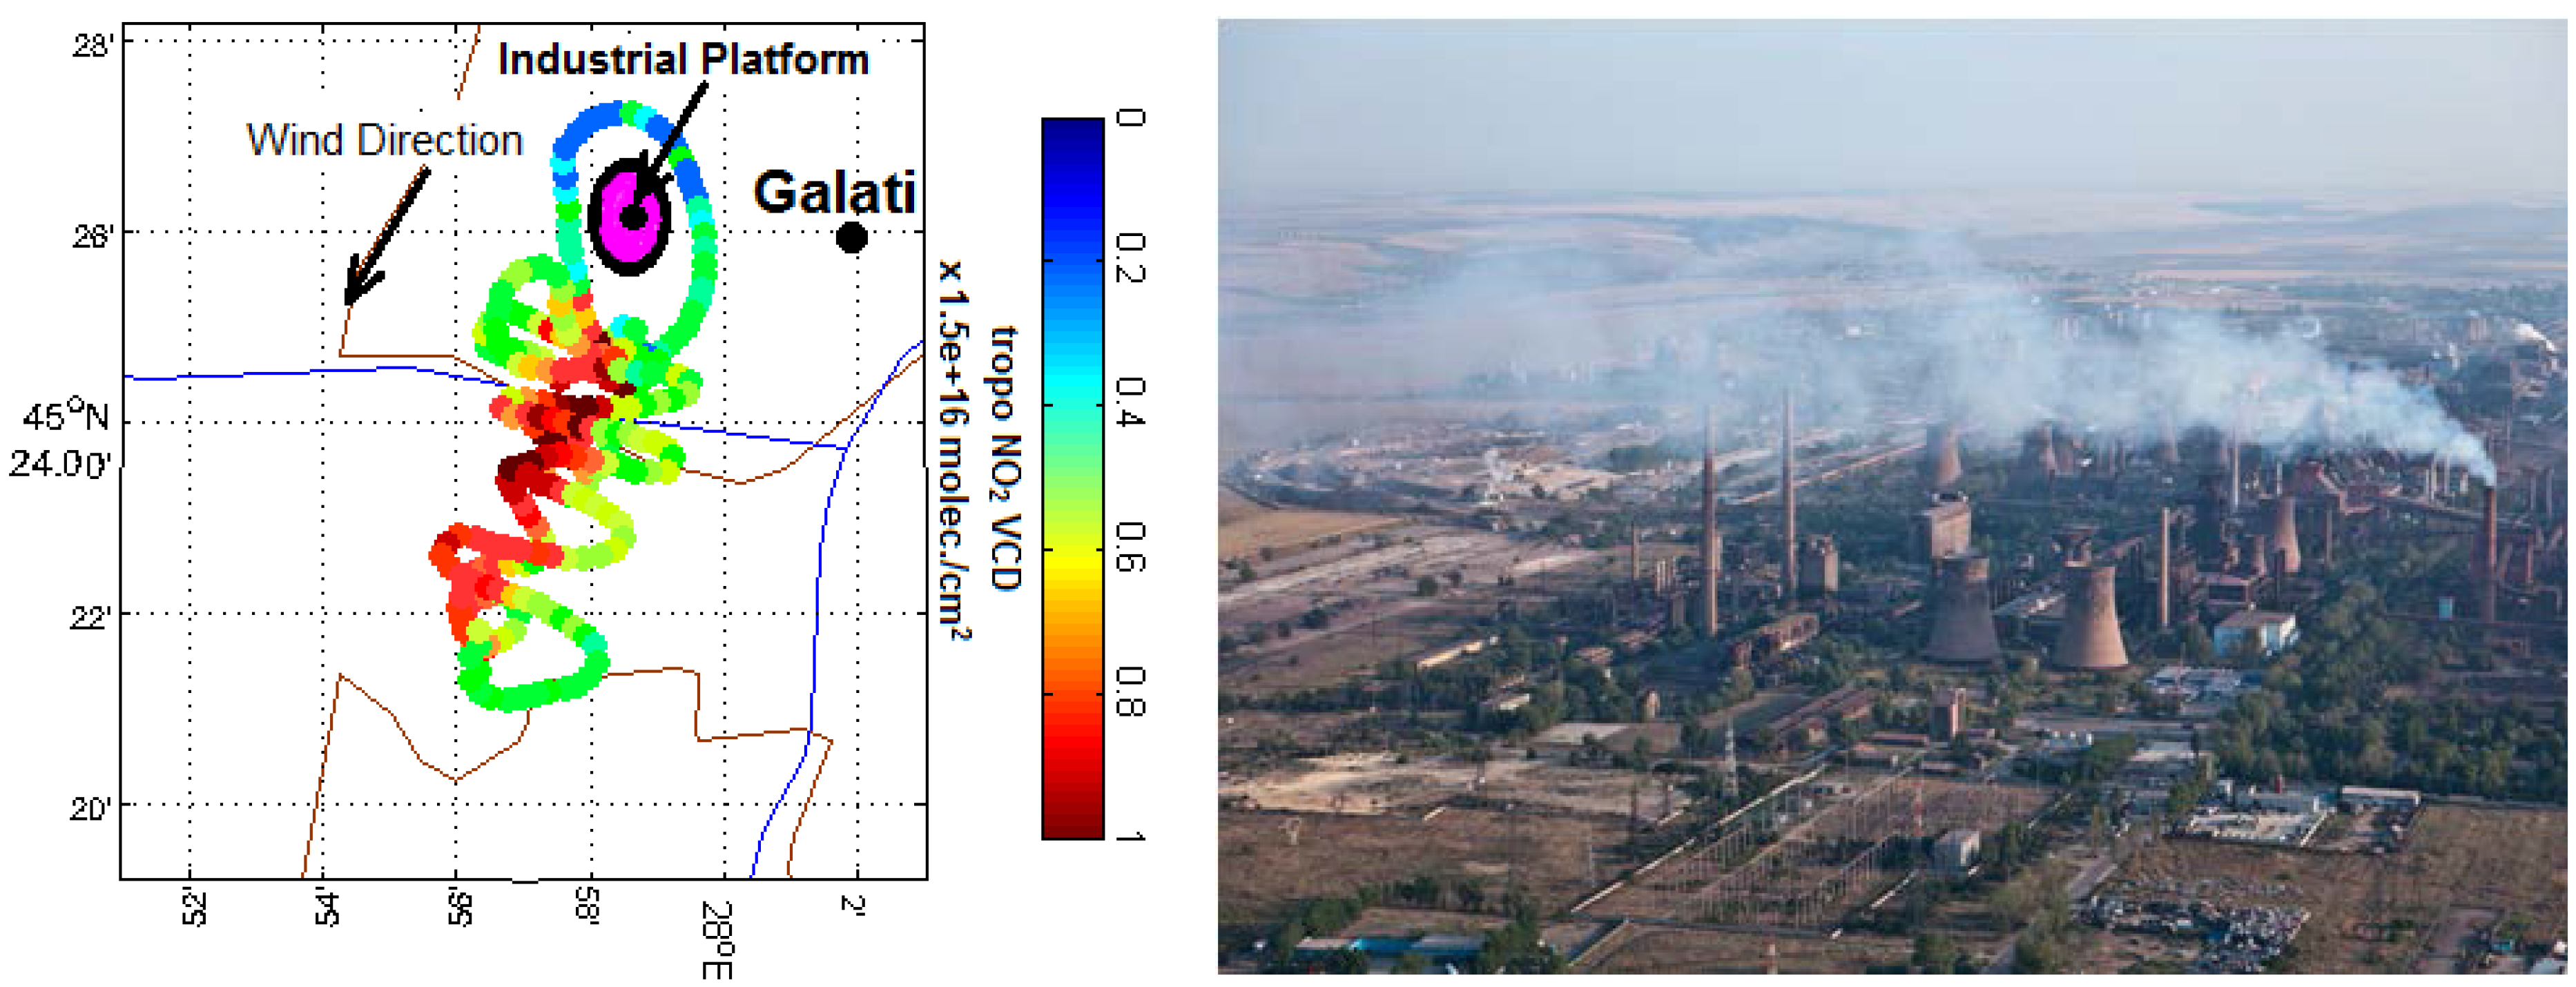
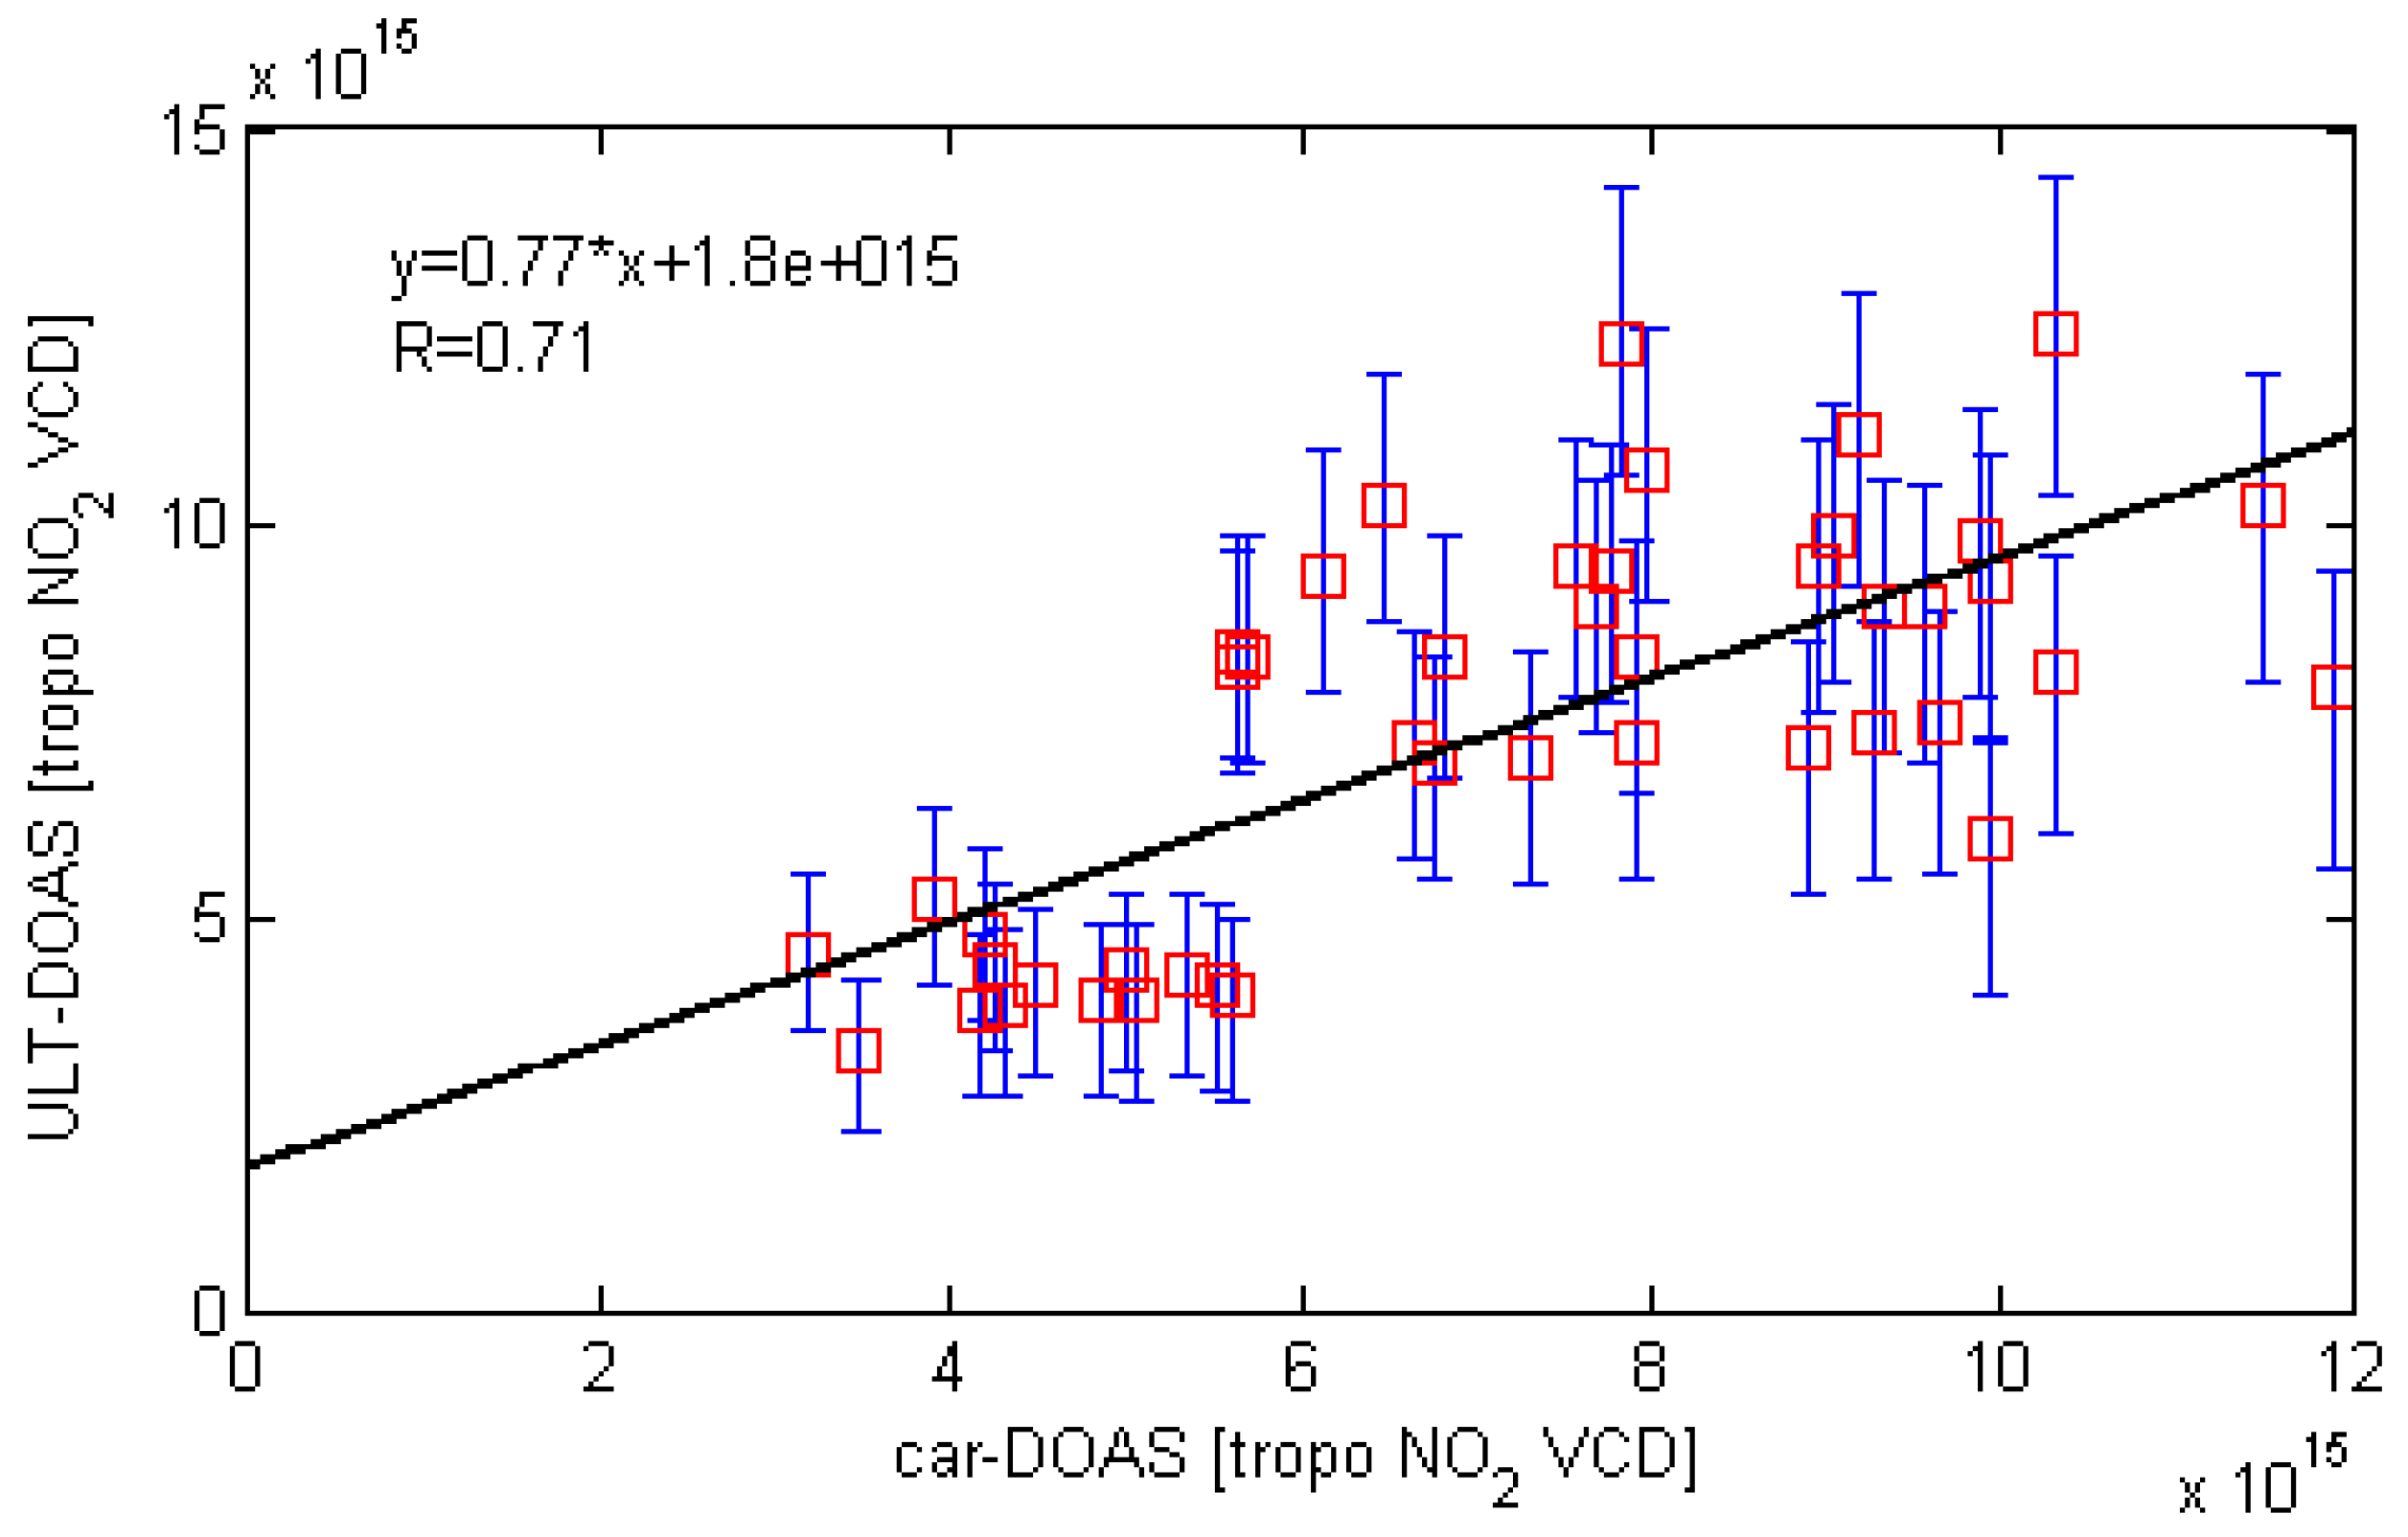
3. Results and Discussions

The airborne DOAS observations were designed to determine the distribution of tropospheric NO2 from the South-East of Romania from urban, industrial and rural areas and associated flux.
The first flights were performed on 1 September 2011 and 25 August 2012, and aimed at measuring the NO2 around the industrial area of Galati city and from Braila city. The flight performed on 21 July 2014 aimed to measure the NO2 emitted by a fertilizer factory located nearby Slobozia city; unfortunately, during the DOAS flight the fertilizer factory was not operational. Figure 6 presents the horizontal distribution of the tropospheric NO2 determined in nadir geometry for 1 September 2011, while Figure 7 depicts the results during a similar flight, but on 25 August 2012. During this experiment, the plume from the industrial platform was not fully crossed by the optical instrument onboard the ULT. The wind was northerly resulting in local increases of the NO2 amount detected by the spectrometer. The maximum tropospheric NO2 VCD detected during this experiment was (1.1 ± 0.24) × 1016 molecules/cm2 while the minimum tropospheric NO2 VCD was (2.1 ± 0.81) × 1015 molecules/cm2.
The trajectory of the flight on 13 August 2014 gave us the opportunity of calculating the NO2 flux emissions around the industrial area of Galati city. This was not possible for the other flights because encircling the NO2 source was not authorized.
On 1 September 2011, the NO2 amount was low relative to the other day. The flight comprised almost two complete circles around Braila; however, the NO2 displayed no clear variation. The horizontal distribution of NO2 was quite homogenous over Braila city on this day.
A double experiment was performed on 13 August 2014, using both a ULT-DOAS and a car-based DOAS system. The mobile ground-based DOAS observations were performed using the same equipment during 9.75–10 UTC, while the ULT-DOAS observations were performed during 7.30–8.15 UTC.
Figure 8 shows the tropospheric NO2 VCD derived along the trajectory of the ULT-DOAS measurements. The right plot shows a photograph of the plume crossed by the ULT flights. During the same day, approximately 1 h after the acquisition of the ULT-DOAS measurements, a zenith-sky car-DOAS system was used to sample the NO2 plume at the same location as the ULT-DOAS observations. We assume that the quantity of the NO2 emitted by the steel factory was almost constant during the airborne and car-DOAS system.
Figure 9 presents the NO2 VCD derived from the nadir airborne DOAS observations performed over the industrial area of Galati city compared with zenith-sky ground-based mobile DOAS measurements performed over the same area in the same day (13 August 2014). In these figures, we show the original SCDs (A) and the retrieved tropospheric NO2 VCD (B). Figure 9A shows that the DSCDs determined from the ULT-DOAS system are ~30% higher than the DSCDs determined using car-DOAS observations. This difference is attributed to the different observation geometries. After appropriate AMF calculation (see Section 2.2.2), both observations show close results.
The ULT flight above the industrial plume led to the detection of a maximum tropospheric NO2 VCD of (1.41 ± 0.27) × 1016 molecules/cm2 while the car-DOAS observation shows a maximum tropospheric NO2 VCD of (1.36 ± 0.21) × 1016 molecules/cm2. Figure 10 displays the correlation between the tropospheric NO2 VCD retrieved by the ULT-DOAS and the car-DOAS instrument, where closest spatially coincident data were selected. A Pearson correlation coefficient R = 0.71 was obtained between ground mobile DOAS observations and airborne DOAS measurements.

NO2 Flux Calculation

The NO2 flux above the industrial platform located nearby Galati city was calculated by performing upwind and downwind measurements around the point source using ULT-DOAS observations on 13 August 2014. The calculation of the emission flux is based on the following parameters: the NO2 VCD determined from the transect over the plume, the wind speed and the wind factor correction, taking into account the angle between the flight direction and wind direction (Equation (6)), [20,36,37]:
Flux NO 2 = i VCD NO 2 ( s i ) v sin ( α i ) Δ s i
where VCDNO2 is the NO2 tropospheric vertical column, v is the wind speed, α the angle between wind direction and driving route, i is the observations index, and ∆si is the distance between two successive spectra.
The wind data used for the NO2 flux calculation rely on measurements of the automatic weather station (Davis Vantage Pro2) located in the campus university of Galati city (45.44° N, 28.05° E), while vertical wind profiles come from the Hybrid Single Particle Lagrangian Integrated Trajectory Model (HYSPLIT) [38] model using archived dataset GDAS 0.5° × 0.5°. The weather station is located at 30 m height and acquires data every 30 min. Since no atmospheric sounding was possible during the experiments, the wind measured on the ground was scaled to the output of HYSPLIT model simulation at 1000 m altitude. During the period of the ULT-DOAS measurements, the mean NO2 emission flux was determined to be (3.45 ± 0.89) × 10−3 kg/s. A local environmental report indicates ~600 tons/year NOx emissions emitted by the steel factory [39]. Using a Leighton ratio (L = [NO]/[NO2]) of 0.3, we calculated that the steel factory has emitted a mean of ~10 × 10−3 kg/s of NO2. The difference between the two types of estimation may be attributed to the fact that the NOx emissions from the steel factory are dependent on the quantity of the steel produced, which can vary from one day to another. Also, the derived NO2 fluxes must be dealt with some care because of the probably incomplete NO to NO2 conversion [40].

4. Conclusions

Ultralight-trike DOAS observations were performed in the South-East of Romania during four days between 2011 and 2014. The first two flights were focused over Braila city, the third aimed at measurements of the NO2 plume emitted by a fertilizer factory near Slobozia city. Unfortunately, during the DOAS flight the fertilizer factory was not operational. The last flight, performed on 13 August 2014, was focused over the industrial area of Galati city. Nadir observations were performed around the industrial platform of Galati city aiming at measuring the tropospheric NO2 VCD around the source and at evaluating the associated NO2 flux. To retrieve the tropospheric NO2 VCD from ULT-DOAS observations, complementary ground- and space-based measurements were used.
We showed that the tropospheric NO2 VCD deduced from the ULT-DOAS observations are consistent with measurements performed from the ground using a zenith-sky car-DOAS system. Although two hours separated the two experiments, a correlation coefficient of R = 0.71 was found between the two results, a tropospheric NO2 VCD of (1.41 ± 0.27) × 1016 molecules/cm2 and an estimated associated flux of (3.45 ± 0.89) × 10−3 kg/s was measured close to the industrial area of Galati city on 13 August 2014, the only day that it was possible to determine the NO2 flux.
Also, we showed that the stratospheric SCD derived from ground-based and airborne measurements correlates well with stratospheric NO2 derived from observations by the OMI satellite sensor.
Based on this study, we conclude that the ULT is an efficient tool which allows determining with a high resolution the NO2 distribution around urban or industrial sources. Also, the ULT-DOAS system is a very efficient tool for measuring fluxes due to its flexibility during the flights and the possibility to access remote areas. The ULT-DOAS system might also constitute a promising tool for satellite validation and calibration under clear-sky conditions, especially for upcoming high-resolution sensors such as the TROPOMI/Sentinel-5 Precursor instrument to be launched in summer 2017.

Acknowledgments

The work of D.E. Constantin was supported by Project PN-II-RU-TE-2014-4-2584, a grant of the Romanian National Authority for Scientific Research and Innovation, CNCS-UEFISCDI. The DOMINO data product was taken from the ESA TEMIS archive (www.temis.nl) maintained at KNMI, The Netherlands.

Author Contributions

Daniel-Eduard Constantin and Alexis Merlaud conceived and designed the study; Daniel-Eduard Constantin analyzed the data; and Mirela Voiculescu, Carmelia Dragomir, Lucian Georgescu, Gaia Pinardi, Francois Hendrick and Michel Van Roozendael improved the paper.

Conflicts of Interest

The authors declare no conflict of interest.

References

  1. Solomon, S.; Portmann, R.W.; Sanders, R.W.; Daniel, J.S.; Madsen, W.; Bartram, B.; Dutton, E.G. On the role of nitrogen dioxide in the absorption of solar radiation. J. Geophys. Res. 1999, 104, 12047–12058. [Google Scholar] [CrossRef]
  2. Platt, U. Differential optical absorption spectroscopy (DOAS). Chem. Anal. Ser. 1994, 127, 27–83. [Google Scholar]
  3. Brewer, A.W.; McElroy, C.T.; Kerr, J.B. Nitrogen dioxide concentration in the atmosphere. Nature 1973, 246, 129–133. [Google Scholar] [CrossRef]
  4. Noxon, J.F. Nitrogen dioxide in the stratosphere and troposphere measured by ground-based absorption spectroscopy. Science 1975, 189, 547–549. [Google Scholar] [CrossRef] [PubMed]
  5. Hendrick, F.; Müller, J.-F.; Clémer, K.; Wang, P.; De Mazière, M.; Fayt, C.; Gielen, C.; Hermans, C.; Ma, J.Z.; Pinardi, G.; et al. Four years of ground-based MAX-DOAS observations of HONO and NO2 in the Beijing area. Atmos. Chem. Phys. 2014, 14, 765–781. [Google Scholar] [CrossRef]
  6. Constantin, D.-E.; Merlaud, A.; van Roozendael, M.; Voiculescu, M.; Fayt, C.; Hendrick, F.; Pinardi, G.; Georgescu, L. Measurements of Tropospheric NO2 in Romania Using a Zenith-Sky Mobile DOAS System and Comparisons with Satellite Observations. Sensors 2013, 13, 3922–3940. [Google Scholar] [CrossRef]
  7. Dragomir, C.; Constantin, D.-E.; Voiculescu, M.; Georgescu, L.; Merlaud, A.; Roozendael, M.V. Modeling results of atmospheric dispersion of NO2 in an urban area using METI–LIS and comparison with coincident mobile DOAS measurements. Atmos. Pollut. Res. 2015, 6, 503–510. [Google Scholar] [CrossRef]
  8. Merlaud, A.; van Roozendael, M.; van Gent, J.; Fayt, C.; Maes, J.; Toledo-Fuentes, X.; Ronveaux, O.; de Mazière, M. DOAS measurements of NO2 from an ultralight aircraft during the Earth Challenge expedition. Atmos. Meas. Tech. 2012, 5, 2057–2068. [Google Scholar] [CrossRef]
  9. Meier, A.C.; Schönhardt, A.; Bösch, T.; Richter, A.; Seyler, A.; Ruhtz, T.; Constantin, D.-E.; Shaiganfar, R.; Wagner, T.; Merlaud, A.; et al. High-resolution airborne imaging DOAS-measurements of NO2 above Bucharest during AROMAT. Atmos. Meas. Tech. Discuss. 2016. [Google Scholar] [CrossRef]
  10. Tack, F.; Merlaud, A.; Iordache, M.-D.; Danckaert, T.; Yu, H.; Fayt, C.; Meuleman, K.; Deutsch, F.; Fierens, F.; van Roozendael, M. High resolution mapping of the NO2 spatial distribution over Belgian urban areas based on airborne APEX remote sensing. Atmos. Meas. Tech. Discuss. 2017. [Google Scholar] [CrossRef]
  11. Merlaud, A.; Constantin, D.; Fayt, C.; Maes, J.; Mingireanu, F.; Mocanu, I.; Georgescu, L.; Roozendael, M. Small whiskbroom imager for atmospheric composition monitoring (SWING) from an unmanned areal vehicle (UAV). In Proceedings of the 21st ESA Symposium on European Rocket and Balloon Programmes and related Research, Thun, Switzerland, 9–13 June 2014; pp. 1–7. [Google Scholar]
  12. Bovensmann, H.; Burrows, J.P.; Buchwitz, M.; Frerick, J.; Nöel, S.; Rozanov, V.V.; Chance, K.V.; Goede, A.H.P. SCIAMACHY—Mission objectives and measurement modes. J. Atmos. Sci. 1999, 56, 127–150. [Google Scholar] [CrossRef]
  13. Levelt, P.; van den Oord, G.; Dobber, M.; Malkki, A.; Visser, H.; de Vries, J.; Stammes, P.; Lundell, J.; Saari, H. The ozone monitoring instrument. IEEE T. Geosci. Remote. 2006, 44, 1093–1101. [Google Scholar] [CrossRef]
  14. Munro, R.; Eisinger, M.; Anderson, C.; Callies, J.; Corpaccioli, E.; Lang, R.; Lefebvre, A.; Livschitz, Y.; Albinana, A.P. GOME-2 on MetOp. In Proceedings of the 2006 EUMETSAT Meteorological Satellite Conference, Helsinki, Finland, 12–16 June 2006; p. 48. [Google Scholar]
  15. van der A, R.J.; Eskes, H.J.; Boersma, K.F.; van Noije, T.P.C.; van Roozendael, M.; de Smedt, I.; Peters, D.H.M.U.; Meijer, E.W. Trends, seasonal variability and dominant NOx source derived from a ten year record of NO2 measured from space. J. Geophys. Res. 2008, 113, D04302. [Google Scholar] [CrossRef]
  16. Varotsos, C.; Christodoulakis, J.; Tzanis, C.; Cracknell, A.P. Signature of tropospheric ozone and nitrogen dioxide from space: A case study for Athens, Greece. Atmos. Environ. 2014, 89, 721–730. [Google Scholar] [CrossRef]
  17. Junkermann, W. An ultralight aircraft as platform for research in the lower troposphere: System performance and first results from radiation transfer studies in stratiform aerosol layers and broken cloud conditions. J. Atmos. Ocean. Technol. 2001, 18, 934. [Google Scholar] [CrossRef]
  18. Junkermann, W. On the distribution of formaldehyde in the western Po-Valley, Italy, during FORMAT 2002/2003. Atmos. Chem. Phys. 2009, 9, 9187–9196. [Google Scholar] [CrossRef]
  19. Chazette, P.; Sanak, J.; Dulac, F. New Approach for Aerosol Profiling with a Lidar Onboard an Ultralight Aircraft: Application to the African Monsoon Multidisciplinary Analysis. Environ. Sci. Technol. 2007, 41, 8335–8341. [Google Scholar] [CrossRef] [PubMed]
  20. Wang, P.; Richter, A.; Bruns, M.; Burrows, J.P.; Scheele, R.; Junkermann, W.; Heue, K.-P.; Wagner, T.; Platt, U.; Pundt, I. Airborne multi-axis DOAS measurements of tropospheric SO2 plumes in the Po-valley, Italy. Atmos. Chem. Phys. 2006, 6, 329–338. [Google Scholar] [CrossRef]
  21. Grutter, M.; Basaldud, R.; Rivera, C.; Harig, R.; Junkerman, W.; Caetano, E.; Delgado-Granados, H. SO2 emissions from Popocatépetl volcano: Emission rates and plume imaging using optical remote sensing techniques. Atmos. Chem. Phys. 2008, 8, 6655–6663. [Google Scholar] [CrossRef]
  22. General, S.; Pöhler, D.; Sihler, H.; Bobrowski, N.; Frieß, U.; Zielcke, J.; Horbanski, M.; Shepson, P.B.; Stirm, B.H.; Simpson, W.R.; et al. The Heidelberg Airborne Imaging DOAS Instrument (HAIDI)—A novel imaging DOAS device for 2-D and 3-D imaging of trace gases and aerosols. Atmos. Meas. Tech. 2014, 7, 3459–3485. [Google Scholar] [CrossRef]
  23. Liu, L.; Flatøy, F.; Ordóñez, C.; Braathen, G.O.; Hak, C.; Junkermann, W.; Andreani-Aksoyoglu, S.; Mellqvist, J.; Galle, B.; Prévôt, A.S.H.; et al. Photochemical modelling in the Po basin with focus on formaldehyde and ozone. Atmos. Chem. Phys. 2007, 7, 121–137. [Google Scholar] [CrossRef]
  24. Airborne Romanian Measurements of Aerosols and Trace Gases (AROMAT). Available online: http://uv-vis.aeronomie.be/aromat/index.php (accessed on 15 January 2017).
  25. Danckaert, T.; Fayt, C.; van Roozendael, M.; de Smedt, I.; Letocart, V.; Merlaud, A.; Pinardi, G. QDOAS Software user manual Version 2.111-April 2016, UV-Visible DOAS Research Group of the Royal Belgian Institute for Space Aeronomy Web Site. Available online: http://uv-vis.aeronomie.be/software/QDOAS/QDOAS_manual.pdf (accessed on 15 December 2016).
  26. Vandaele, A.; Hermans, C.; Simon, P.; Carleer, M.; Colin, R.; Fally, S.; Mérienne, F.; Jenouvrier, A.; Coquart, B. Measurements of the NO2 absorption cross-section from 42000 cm−1 to 10000 cm−1 (238–1000 nm) at 220 K and 294 K (220 K). J. Quant. Spectrosc. Radiat. Transf. 1998, 59, 171–184. [Google Scholar] [CrossRef]
  27. Bogumil, K.; Orphal, J.; Homann, T.; Voigt, S.; Spietz, P.; Fleischmann, O.C.; Vogel, A.; Hartmann, M.; Kromminga, H.; Bovensmann, H.; et al. Measurements of molecular absorption spectra with the SCIAMACHY pre-flight model: Instrument characterization and reference data for atmospheric remote-sensing in the 230–2380 nm region. J. Photochem. Photobiol. A Chem. 2003, 157, 167–184. [Google Scholar] [CrossRef]
  28. Thalman, R.; Volkamer, R. Temperature dependent absorption cross-sections of O2-O2 collision pairs between 340 and 630 nm and at atmospherically relevant pressure. Phys. Chem. Chem. Phys. 2013, 15, 15371–15381. [Google Scholar] [CrossRef] [PubMed]
  29. Chance, K.V.; Spurr, R.J.D. Ring effect studies: Rayleigh scattering, including molecular parameters for rotational Raman scattering, and the Fraunhofer spectrum. Appl. Opt. 1997, 36, 5224–5230. [Google Scholar] [CrossRef] [PubMed]
  30. Baidar, S.; Oetjen, H.; Coburn, S.; Dix, B.; Ortega, I.; Sinreich, R.; Volkamer, R. The CU Airborne MAX-DOAS instrument: Vertical profiling of aerosol extinction and trace gases. Atmos. Meas. Tech. 2013, 6, 719–739. [Google Scholar] [CrossRef]
  31. Vaughan, G.; Quinn, P.T.; Green, A.C.; Bean, J.; Roscoe, H.K.; van Roozendael, M.; Goutail, F. SAOZ measurements of stratospheric NO2 at Aberystwyth. J. Environ. Monit. 2006, 8, 353–361. [Google Scholar] [CrossRef] [PubMed]
  32. Dirksen, R.J.; Boersma, K.F.; Eskes, H.J.; Ionov, D.V.; Bucsela, E.J.; Levelt, P.F.; Kelder, H.M. Evaluation of stratospheric NO2 retrieved from the Ozone Monitoring Instrument: Intercomparison, diurnal cycle and trending. J. Geophys. Res. 2011, 116, D08305. [Google Scholar] [CrossRef]
  33. Hendrick, F.; Barret, B.; van Roozendael, M.; Boesch, H.; Butz, A.; De Mazière, M.; Goutail, F.; Hermans, C.; Lambert, J.-C.; Pfeilsticker, K.; et al. Retrieval of nitrogen dioxide stratospheric profiles from ground-based zenith-sky UV-visible observations: Validation of the technique through correlative comparisons. Atmos. Chem. Phys. 2004, 4, 2091–2106. [Google Scholar] [CrossRef]
  34. Hendrick, F.; van Roozendael, M.; Kylling, A.; Petritoli, A.; Rozanov, A.; Sanghavi, S.; Schofield, R.; von Friedeburg, C.; Wagner, T.; Wittrock, F.; et al. Intercomparison exercise between different radiative transfer models used for the interpretation of ground-based zenith-sky and multi-axis DOAS observations. Atmos. Chem. Phys. 2006, 6, 93–108. [Google Scholar] [CrossRef]
  35. Mayer, B.; Kylling, A. Technical note: The libRadtran software package for radiative transfer calculations—description and examples of use. Atmos. Chem. Phys. 2005, 5, 1855–1877. [Google Scholar] [CrossRef]
  36. Rivera, C.; Sosa, G.; Wöhrnschimmel, H.; de Foy, B.; Johansson, M.; Galle, B. Tula industrial complex (Mexico) emissions of SO2 and NO2 during the MCMA 2006 field campaign using a mobile mini-DOAS system. Atmos. Chem. Phys. 2009, 9, 6351–6361. [Google Scholar] [CrossRef]
  37. Johansson, M.; Rivera, C.; de Foy, B.; Lei, W.; Song, J.; Zhang, Y.; Galle, B.; Molina, L. Mobile mini-DOAS measurement of the outflow of NO2 and HCHO from Mexico City. Atmos. Chem. Phys. 2009, 9, 5647–5653. [Google Scholar] [CrossRef]
  38. Stein, A.F.; Draxler, R.R.; Rolph, G.D.; Stunder, B.J.B.; Cohen, M.D.; Ngan, F. NOAA‘s HYSPLIT atmospheric transport and dispersion modeling system. Bull. Am. Meteorol. Soc. 2015, 96, 2059–2077. [Google Scholar] [CrossRef]
  39. Studiu Privind Calitatea Aerului in Municipiul Galati; Municipiul Galati: Galati, Romania, 2016.
  40. Frins, E.; Bobrowski, N.; Osorio, M.; Casaballe, N.; Belsterli, G.; Wagner, T.; Platt, U. Scanning and mobile multi-axis DOAS measurements of SO2 and NO2 emissions from an electric power plant in Montevideo, Uruguay. Atmos. Environ. 2014, 98, 347–356. [Google Scholar] [CrossRef]
Figure 1. The main locations where airborne and/or ground-based mobile Differential Optical Absorption Spectroscopy (DOAS) observations were performed.
Atmosphere 08 00078 g001
Figure 2. Schematic of the ULT-DOAS measurement principle.
Atmosphere 08 00078 g002
Figure 3. Example of a DOAS fit realized with the QDOAS software; the analyzed spectrum was recorded close to Galati, on 13 August 2014. Black line corresponds to molecular cross sections scaled to the detected absorptions in the measured spectrum (red line).
Atmosphere 08 00078 g003
Figure 4. Comparisons between measured SCD using various methods of determination and stratospheric SCD derived from OMI (21 July 2014); (A) Comparison between SCD determined from ground-based (GB) observations and stratospheric SCD derived from DOMINO; (B) Comparison between SCD determined from CAR-DOAS (black dots) and ULT-DOAS (red dots) and stratospheric SCD derived from DOMINO.
Atmosphere 08 00078 g004
Figure 5. AMF simulations obtained from RTM calculations using UVspec/DISORT for various input parameters, for 13 August 2014. AMF = Air Mass Factor.
Atmosphere 08 00078 g005
Figure 6. Map of tropospheric NO2 VCD determined on 1 September 2011 using ULT-DOAS observations.
Atmosphere 08 00078 g006
Figure 7. Map of tropospheric NO2VCD determined on 25 August 2012 using ULT-DOAS observations.
Atmosphere 08 00078 g007
Figure 8. The tropospheric NO2 VCD along the flight trajectory using the ULT-DOAS system on 13 August 2014 (left); Photography of the NO2 plume determined on the same day (right).
Atmosphere 08 00078 g008
Figure 9. Comparisons between ULT-DOAS and car-DOAS observations performed on 13 August 2014. (A) The results of the preliminary DOAS analysis (DSCDs) and (B) after determination of the vertical columns (VCDs).
Atmosphere 08 00078 g009
Figure 10. Correlation between tropospheric VCDs measured by the ULT-DOAS and the car-DOAS instrument on 13 August 2014.
Atmosphere 08 00078 g010
Table 1. Coordinates and temporal coverage of the mobile DOAS measurements.
DayTime Interval UTC *Route of ULT-DOAS ** MeasurementsNO2 Source Target
1 September 20118.31–9.45Galati–BrailaBraila urban area
25 August 20127.53–8.89Galati–BrailaBraila urban area
21 July 20149.51–10.96Galati–SloboziaSlobozia industrial area
13 August 20147.32–8.19GalatiGalati industrial area
* Coordinated Universal Time. ** ULT-DOAS = Ultralight Trike-Differential Optical Absorption Spectroscopy.
Table 2. OMI satellite overpasses data sets.
DayOrbit Nr.Overpass Time
UTC
Stratospheric VCD
[×1015 molecules/cm2]
1 September 201137,92311:04:283.76
25 August 201243,15111:11:073.75
21 July 201453,27211:17:364.14
13 August 201453,60711:23:473.74
VCD = Vertical Column Density.
Table 3. Input parameters used for the radiative transfer model (RTM) calculations.
Trace GasNitrogen Dioxide
wavelength440 nm
flight altitude1000 m1500 m
albedo0.1
visibility1 km5 km20 km
line of sight

