Article

Temperature and Heat-Related Mortality Trends in the Sonoran and Mojave Desert Region

1
Chairholder of the UNESCO Chair on Hydrometeorological Risks, Departamento de Ingeniería Civil y Ambiental, Universidad de Las Américas Puebla, Sta. Catarina Mártir, Cholula, Puebla 72810, Mexico
2
Division of Hydrologic Sciences, Desert Research Institute, 755 E. Flamingo Road, Las Vegas, NV 89119-7363, USA
3
Graduate Program Hydrologic Sciences, University of Nevada, Reno, NV 89557-0175, USA
*
Author to whom correspondence should be addressed.
Atmosphere 2017, 8(3), 53; https://doi.org/10.3390/atmos8030053
Submission received: 23 October 2016 / Revised: 23 February 2017 / Accepted: 24 February 2017 / Published: 3 March 2017
(This article belongs to the Special Issue Temperature Extremes and Heat/Cold Waves)

Abstract

:
Extreme temperatures and heat wave trends in five cities within the Sonoran Desert region (e.g., Tucson and Phoenix, Arizona, in the United States and Ciudad Obregon and San Luis Rio Colorado, Sonora; and Mexicali, Baja California, in Mexico) and one city within the Mojave Desert region (e.g., Las Vegas, Nevada) were assessed using field data collected from 1950 to 2014. Instead of being selected by watershed, the cities were selected because they are part of the same arid climatic region. The data were analyzed for maximum temperature increases and the trends were confirmed statistically using Spearman’s nonparametric test. Temperature trends were correlated with the mortality information related with extreme heat events in the region. The results showed a clear trend of increasing maximum temperatures during the months of June, July, and August for five of the six cities and statically confirmed using Spearman’s rho values. Las Vegas was the only city where the temperature increase was not confirmed using Spearman’s test, probably because it is geographically located outside of the Sonoran Desert or because of its proximity to the Hoover Dam. The relationship between mortality and temperature was analyzed for the cities of Mexicali, Mexico and Phoenix. Arizona.

1. Introduction

Extreme heat is an increasing concern, particularly in climate change sensitive areas [1]. Among the main effects reported for heat waves, their effects on human health are the most significant, particularly for population groups reported to be the most vulnerable, such as children, the elderly, outdoor workers, or inhabitants of urban areas [2]. Current climate models predict that some regions will experience more intense, frequent, and longer-lasting extreme heat events in the second half of this century, which will lead to dehydration, heat exhaustion, deadly heatstroke, kidney problems, lethargy, and poor work performance among the exposed population [3].
Extreme heat events account for a higher number of annual fatalities in the United States than any other extreme weather event. In a recent study, Habeeb et al. [4] analyzed exposure to dangerously high temperatures in 50 large U.S. cities to understand changes over time in heat wave frequency, duration, intensity, and timing from 1961 to 2010. They used the National Climate Data Center (NCDC) heat event threshold, that is, as “any day in which the minimum, maximum or average apparent temperature exceeds the 85th percentile of the base period 1961–1990”. They found that the annual number of heat waves has increased by 0.6 heat waves per decade for the average US city, the length of heat waves has increased by a fifth of a day, the intensity of heat waves has increased 0.1 °C above local thresholds, and the length of the heat wave season has increased by six days per decade. In previous work, the authors of this paper analyzed temperature trends in northwestern Mexico and found that the increase in maximum temperatures in the region has a statistically significant trend [5]. Other authors have found similar trends for the relationship between heat and mortality [6].
The Sonoran and Mojave Deserts (in northwestern Mexico and the southwestern United States) are among the most extreme arid zones in the world, with high temperatures exceeding 40 °C during the summer season and critically limited water resources [7,8,9]. Even under adverse geographical and weather conditions, these subtropical desert climates have developed significant urban populations in both Mexico and the United States [10]. The southwestern region of the United States is projected to experience the largest increase in population over the next decade and a significant increase in the frequency of extreme heat events [11]. Northwestern Mexico has the highest rate of mortality related with excessive heat in the country [12], and the current modeling results for climate change scenarios for Mexico indicate that this part of the country will reach the highest temperature anomaly [13]. For example, the city of Mexicali has the Mexican national record of heat related deaths, and other cities in the region, such as Hermosillo or Ciudad Obregon, are also suffering the effects of heat waves. According to Diaz Caravante et al. [6], there were 393 deaths in Mexico related with excessive heat during 2002 to 2010, most of which were in the northwest in the states of Baja California and Sonora.
Climate change is expected to increase the average temperature and probability of extreme climate events, including heat waves [14,15]. The best future climate estimates are for average temperatures, so uncertainty in extreme temperatures and heat waves is much greater [16]. Predictions of temperature increases are based on results from general circulation models. With respect to temperature, when multi-model results (i.e., the average of 23 general circulation models) are analyzed, the estimation error (i.e., the difference between observed and model estimated data), is rarely greater than 2 °C, although individual models can show errors close to 3 °C [17]. Furthermore, the reported trends and forecasts from general circulation models focus particularly on average values. For instance, there are average temperature forecasts for several scenarios, but no general forecasts for extreme temperatures are available. Nevertheless, the Intergovernmental Panel on Climate Change (IPCC) has pointed out that the number of cold days and nights has already decreased globally, and the number of heat waves has increased in Europe and North America [14]. Forecasting mean temperature changes at the local scale is a difficult task, although forecasting extreme temperatures is much more difficult since it depends almost entirely on observational evidence. Therefore, the analysis of the vulnerability to and effects of climate change at local or regional levels, and mainly for extremes, must be based on observed evidence.
Anticipating trends in exposure to heat extremes for these highly populated urban areas with limited water resources is a key component of avoiding further vulnerability and developing proper adaptation and heat-health operational plans [18] for the entire region. The goal of this work is to analyze the maximum temperature trends in six major cities within the Sonoran (Ciudad Obregon, Presa Morelos, and Mexicali in Mexico; Phoenix and Tucson in the United States) and Mojave (Las Vegas, NV, USA) Deserts to assess increasing temperatures and extreme heat events over the last five decades and correlate them with the current trends found in the health effects on the populations in these urban areas.

2. Materials and Methods

As the most recent climate change report by the IPCC [19] established, human influence on climate is undeniable, and many of its consequences are now observed in several regions of the world. In particular, climatic extremes have been shown to be pervasive and among them, heat waves are responsible for some of the worst recent climate-related human disasters (i.e., [20,21]). The Sonoran and Mojave Deserts share the same climatic region (see Figure 1), and therefore we decided to study cities located in this region instead of following the usual approach of studying watersheds, states, or countries.
For this study, we select meteorological stations located in Mexicali, Ciudad Obregon (Obregon City), and San Luis Río Colorado in Mexico. The San Luis Rio Colorado station is located at the Morelos Dam, and because it is also very close to Yuma, AZ and might be representative of either city we refer to it as Morelos Dam station. The cities selected in the United States are Las Vegas, Phoenix, and Tucson. The station records cover a period of 50 years, from 1960 to 2010. Because we are interested in extreme temperatures, we analyzed the maximum daily temperature records. Data from Mexico were obtained from the National Meteorological Service [22] data bases, and data from the United States were obtained from the National Oceanic and Atmospheric Administration (NOAA) National Centers for Environmental Information; in all the cases, direct daily temperature data was obtained from NOAA and used for the trend analysis. The temperature data set used for analysis of Las Vegas trends was from the McCarran International airport station (GHCND: USW00023169, 36.0719°, −115.1634°). In the case of Phoenix, the temperature data set was from the Sky Harbor International airport station (GHCND: USW00023183, 33.4277°, −112.0038°) and for Tucson, AZ the data set used was collected from the Tucson International airport (GHCND: USW00023160, 32.1313°, −110.9552°). In the case of Mexico, the stations used were, following the nomenclature of the National Meteorological Service, the 26018 in Ciudad Obregón, the 2037 in Presa Morelos, and the 2033 in Mexicali.
There are several methods for studying temperature trends. Probably the simplest method is to use the linear trend of the records. In the case of a clear trend, a qualitative description of the trend can be observed using this method. Nevertheless, to define a statistically significant trend, a statistical test must be used. There are several statistical tests used to analyze trends in climate data series. For example, linear correlation (i.e., [23]) and serial correlation techniques have been used. In recent years, nonparametric estimation methods such as the Mann-Kendall and Spearman’s rho tests have been most commonly used. The latter has proven to be a robust test compared with similar tests and it provides consistent results with those of the Mann-Kendall test (i.e., [24,25,26]). In this study, we use Spearman’s rho nonparametric statistical test.
For climate data series, the statistical (D) Spearman’s rho test is obtained using Equation (1):
D = 1 6   i = 1 n ( R i i ) 2 n   ( n 2 1 )
where Ri is the range of the ith observation, and n is the number of data in the sample. The standardized statistical ZSR is given by Equation (2):
Z S R = D   n 2 1 D 2
The no trend in the series statement is used as the null hypothesis for this method. If abs(ZSR) > t((n − 2, 1) − α/2), where t((n − 2, 1) − α/2) is the value of the statistics t in the table on Student’s t-distribution for an specific significant level α, then the null hypothesis is rejected and it is concluded that there is a trend in the series.
There is no consensus on an operational definition of a heat wave [27,28,29]. It varies among researchers and even civil protection systems. For example, in the United Kingdom absolute regional temperature limits are established: in North East England the threshold is 28 °C, while in London it is 32 °C. [30]. In the United States, limits on apparent temperature (i.e., taking into account the temperature and the relative humidity) are applied by NOAA [31]. An apparent temperature above 124 °F (51 °C) is considered very dangerous. The limits on apparent temperature include both the absolute temperature and relative humidity, which is shown in Equation (3):
H i = 42.379 + 2.049 T + 10.14 R 0.224 T R 6.83 × 10 3 T 2 5.48 × 10 2 R 2 + 1.22 × 10 3 T 2 R + 8.52 × 10 4 T R 2 1.99 × 10 6 T 2 R 2
where Hi stands for the apparent temperature, R is the relative humidity, and T is the ambient temperature (°F).
Recently, Kent et al. [32] carried out an extensive analysis that compared different heat indexes with the registered health effects during the dates analyzed. They found that simple indexes based solely on temperature may be the most applicable for use in alert systems, but that all the corresponding temperature thresholds should be considered for a regional analysis.
One suitable way to define a heat wave is to use a percentile threshold (90th or 95th) and a duration of ≥2 days, which is used by some researchers in the United States [33] and Mexico [34]. In this paper, we use the 90th percentile threshold calculated over the monthly maximum temperature average to assess which days exceed heat wave temperatures.

3. Results and Discussion

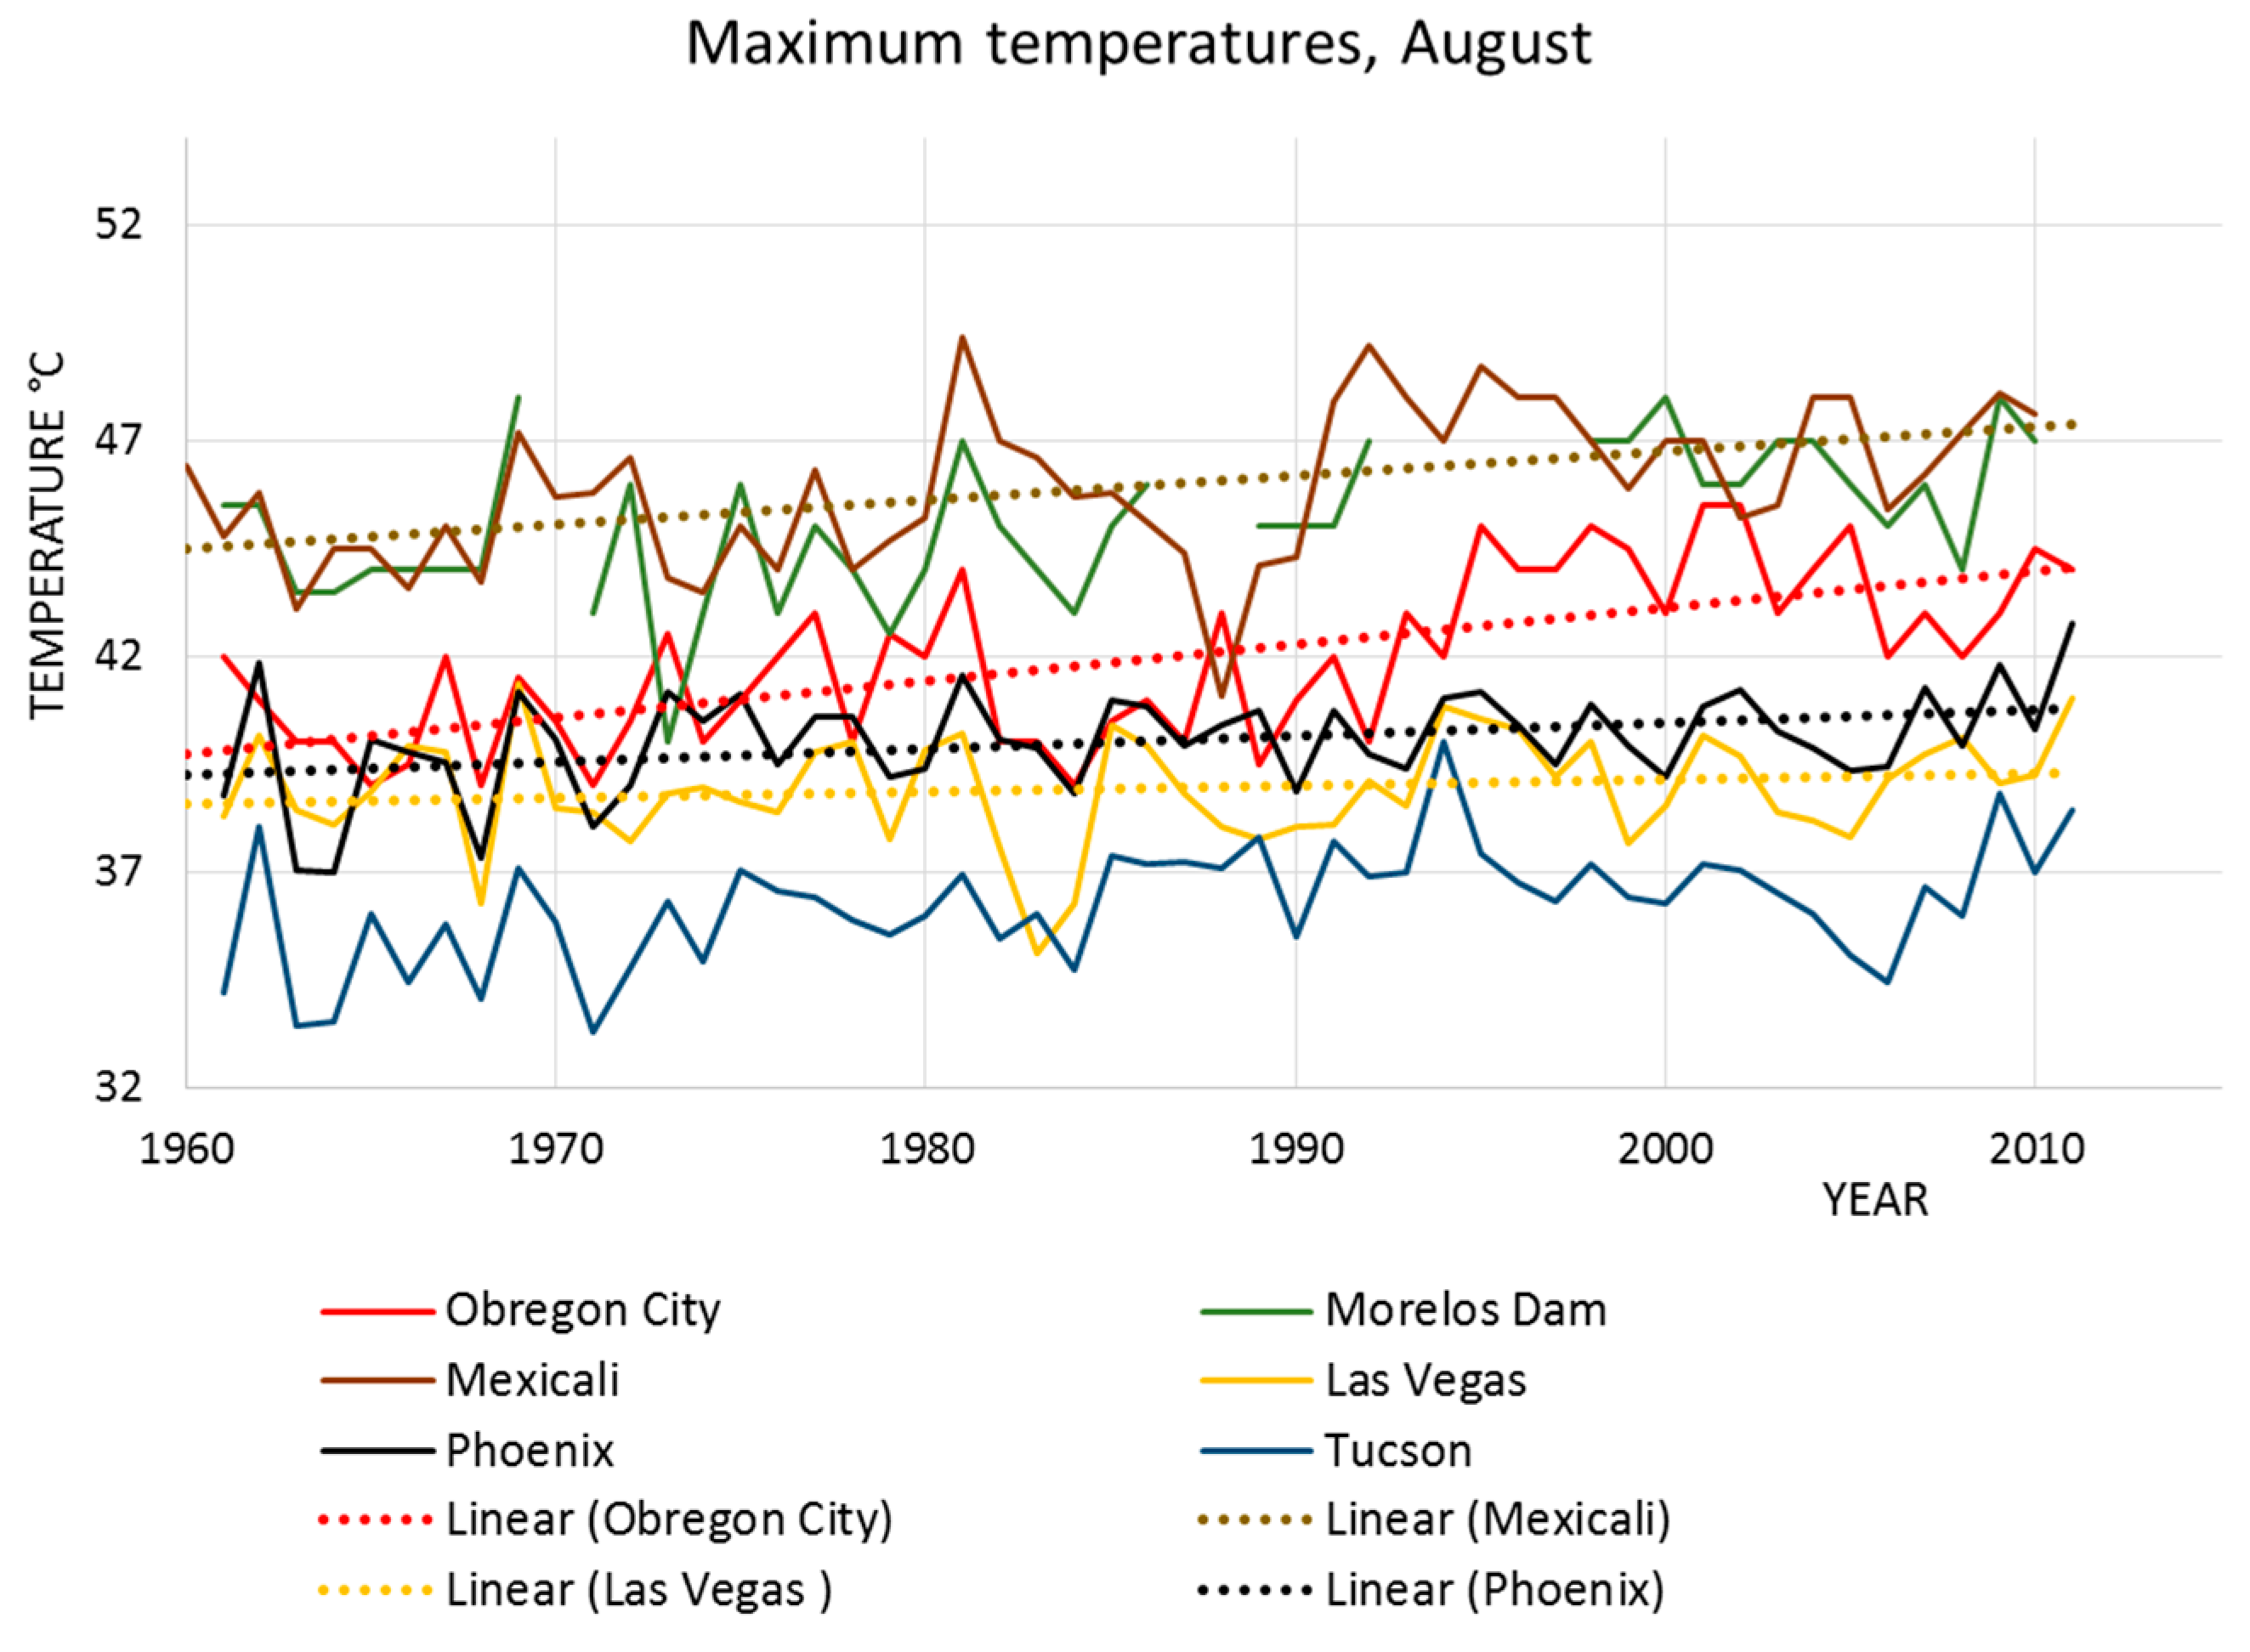
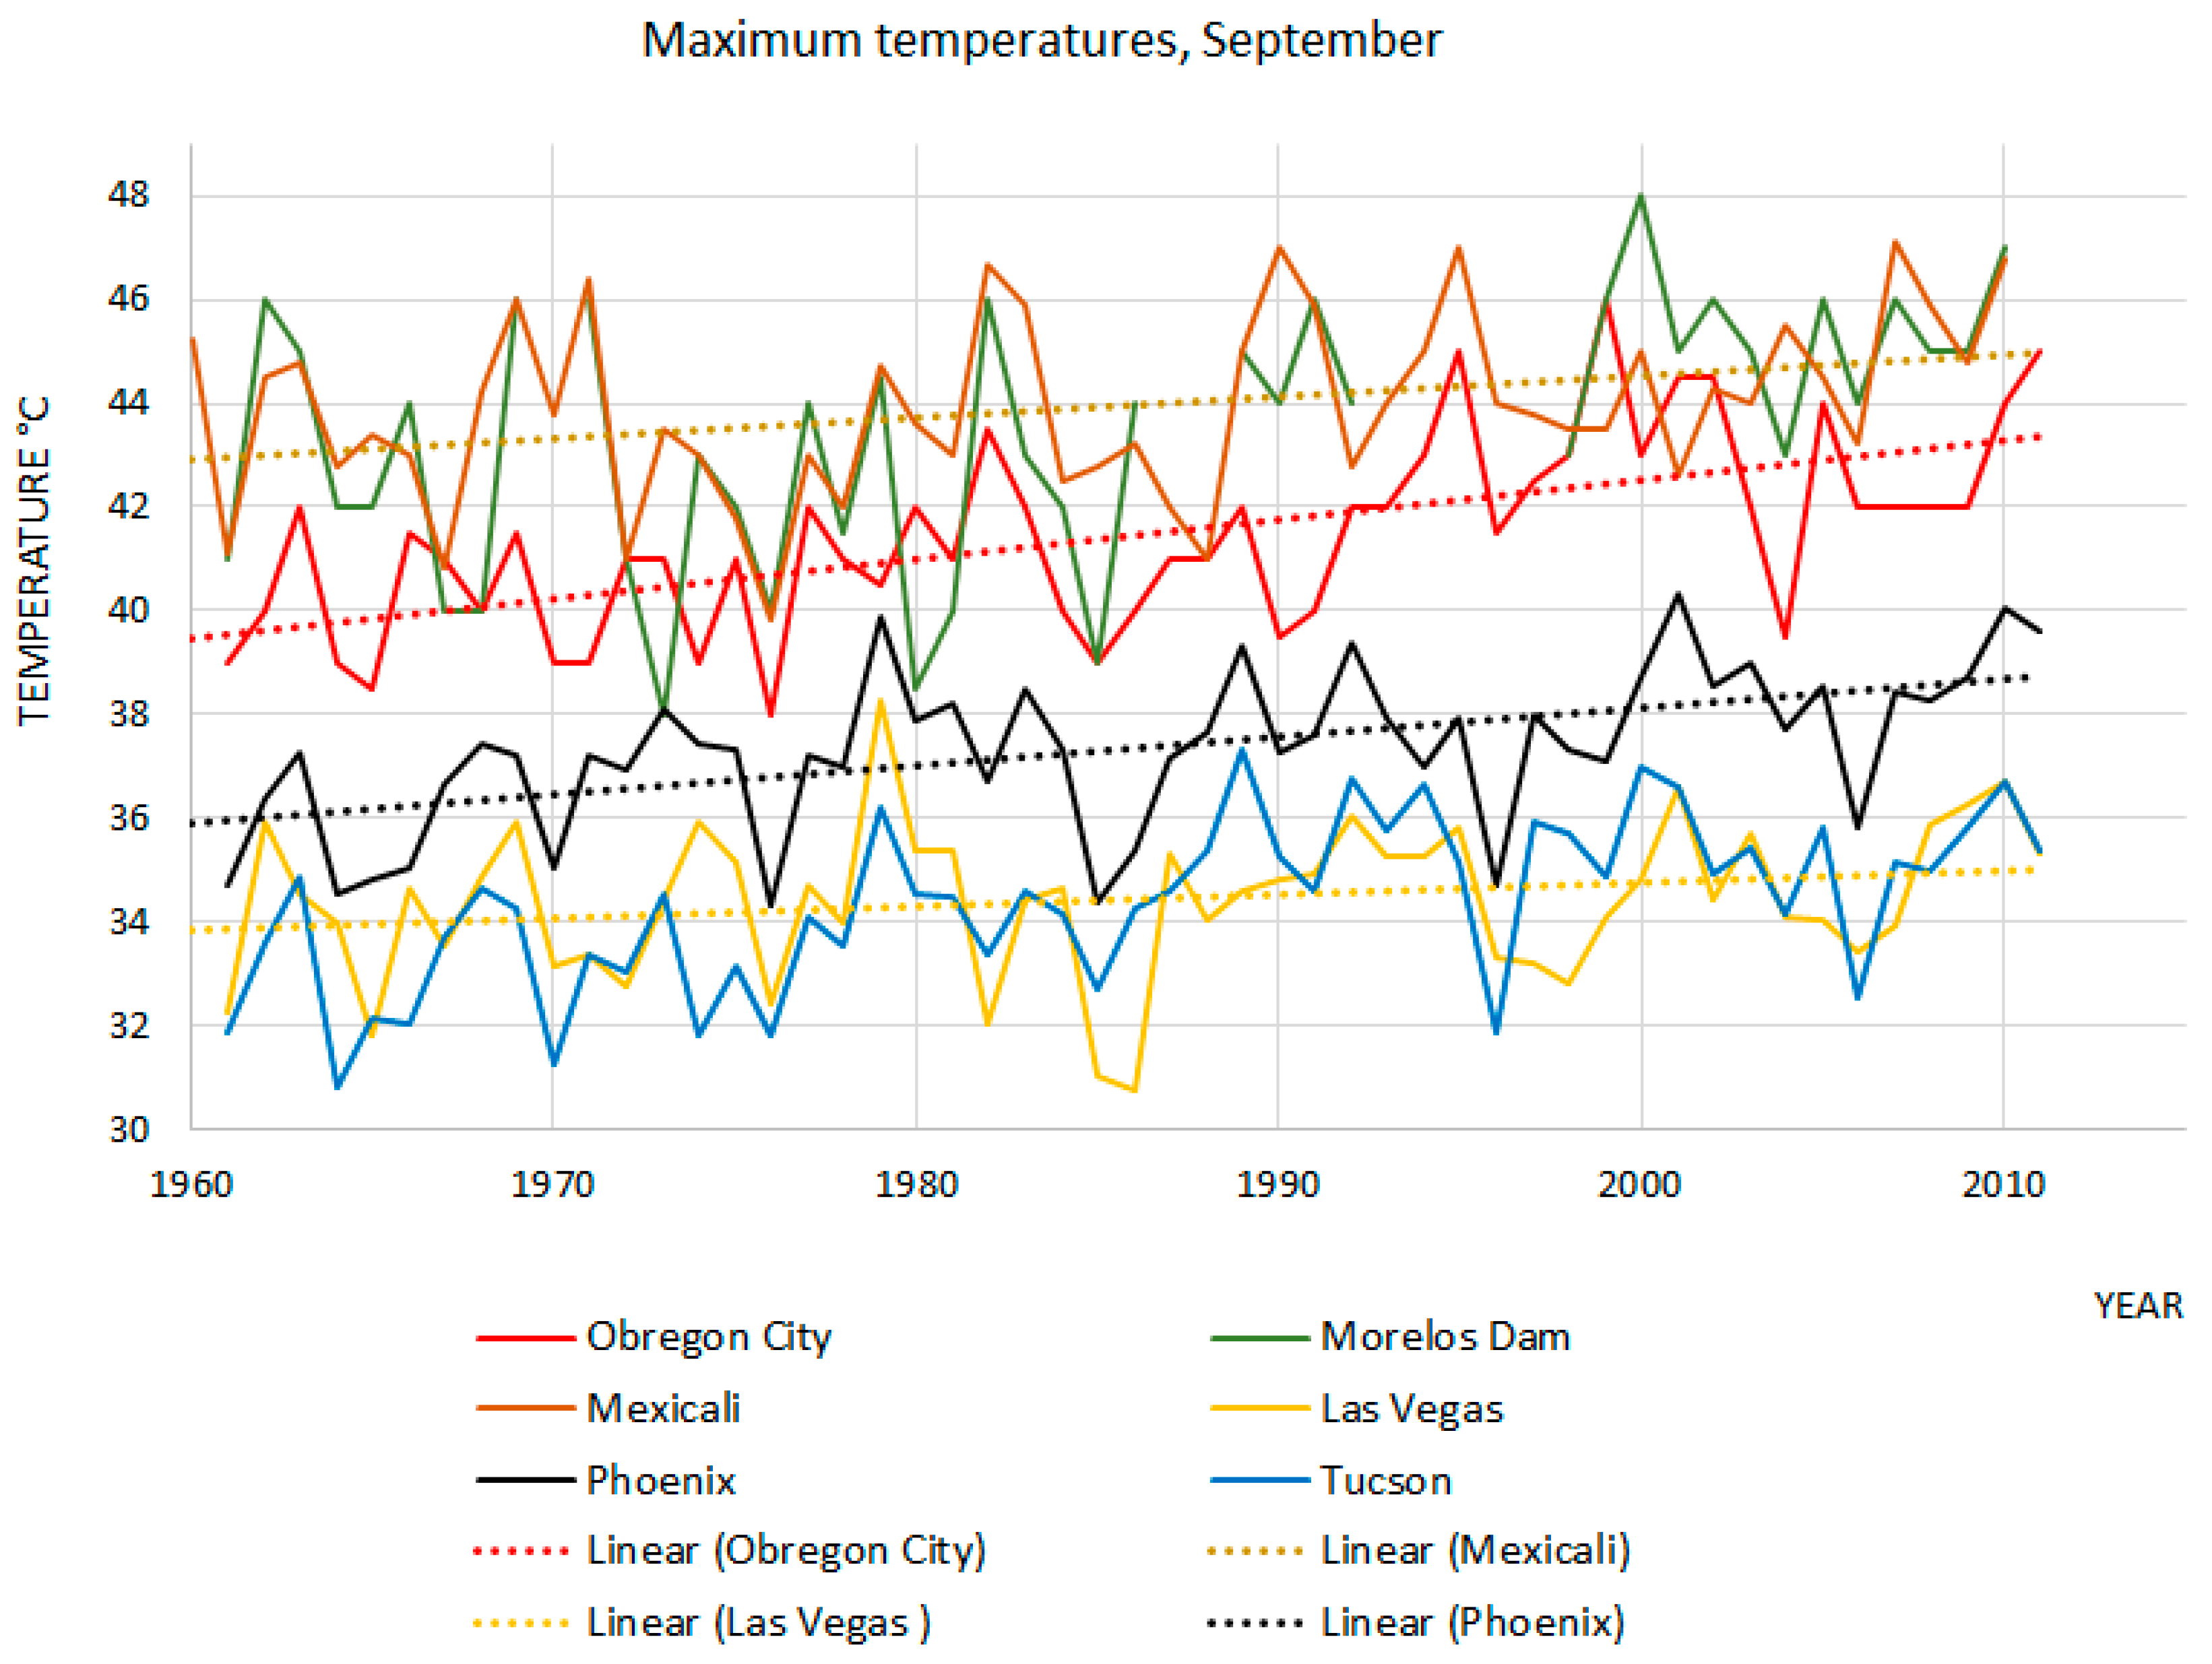
3.1. Temperature Trends

The total daily maximum temperature record was analyzed and, for the trend analysis, the daily maximum temperature recorded in each month was used (i.e., the monthly maximum recorded temperature). Those maximum monthly temperatures were analyzed for the six cities above mentioned. The maximum temperatures were concentrated in the summer months, from July to September.
Figure 2 and Figure 3 show the average maximum temperatures over the month registered during the period of analysis as well as the linear trend lines for four of the cities (two in each country). In both August and September, there is a clear trend of higher maximum temperatures. It is also very interesting that all the cities are experiencing more or less the same rate of temperature increase.
The observed increase in maximum temperatures is significant when compared with observed increases from the past. This can be seen clearly by comparing the average over the 2005 to 2010 period with the average from 1961 to 1965. In the former period (e.g., 2005–2010), the maximum temperature in Ciudad Obregon is 2.96 °C higher than in the later one (e.g., 1961–1965), 2.76 °C in Phoenix (which registered the highest temperature extremes, by far, over the last years), 2.52 °C higher in Tucson, 2.3 °C higher at Morelos Dam, 2.06 °C higher in Mexicali, and 1.34 °C higher in Las Vegas. The increase in maximum temperatures is higher than the change in average temperatures; this behavior was observed in the trend lines, but needed to be confirmed with a statistical test. Spearman’s nonparametric statistical test was used, and the results are summarized in Table 1 and Table 2 for August and September, respectively. From Table 1 and Table 2, there is a clear, positive, statistically significant trend toward an increase in the maximum temperatures in the cities analyzed, with the exception of Las Vegas. In the case of average temperatures, a different variation is observed, which is expected in climate change processes, as established by the IPCC [35].
Using the 90th percentile of the maximum temperatures in each month of the period as the threshold for a heat wave, the number of days in a month that exceed this value is also increasing, as can be seen in Figure 4 for the month of August.
Despite Las Vegas showing a similar temperature trend compared with the other cities included in the study, the results obtained from the statistical analysis showed that the increase in temperature there is not statistically significant. It was found that, in Las Vegas, the number of days exceeding the 90th percentile remained stable, not corresponding to the general pattern, and it could be argued that there must be a local cause. So far, we have not being able to find a reasonable explanation for this apparently inconsistent behavior, however, other researchers have established that large dams can influence the climate at distances up to 100 km [36,37,38], therefore, the city’s proximity to the Hoover Dam might be the reason for this unusual trend. Nevertheless, more detailed studies need to be done to explore that hypothesis. It is important to note that for Morelos Dam the effect of proximity with the water body is expected to be negligible because it is a diversion dam, with very limited storage capacity.

3.2. The Health Effects of Heat Waves

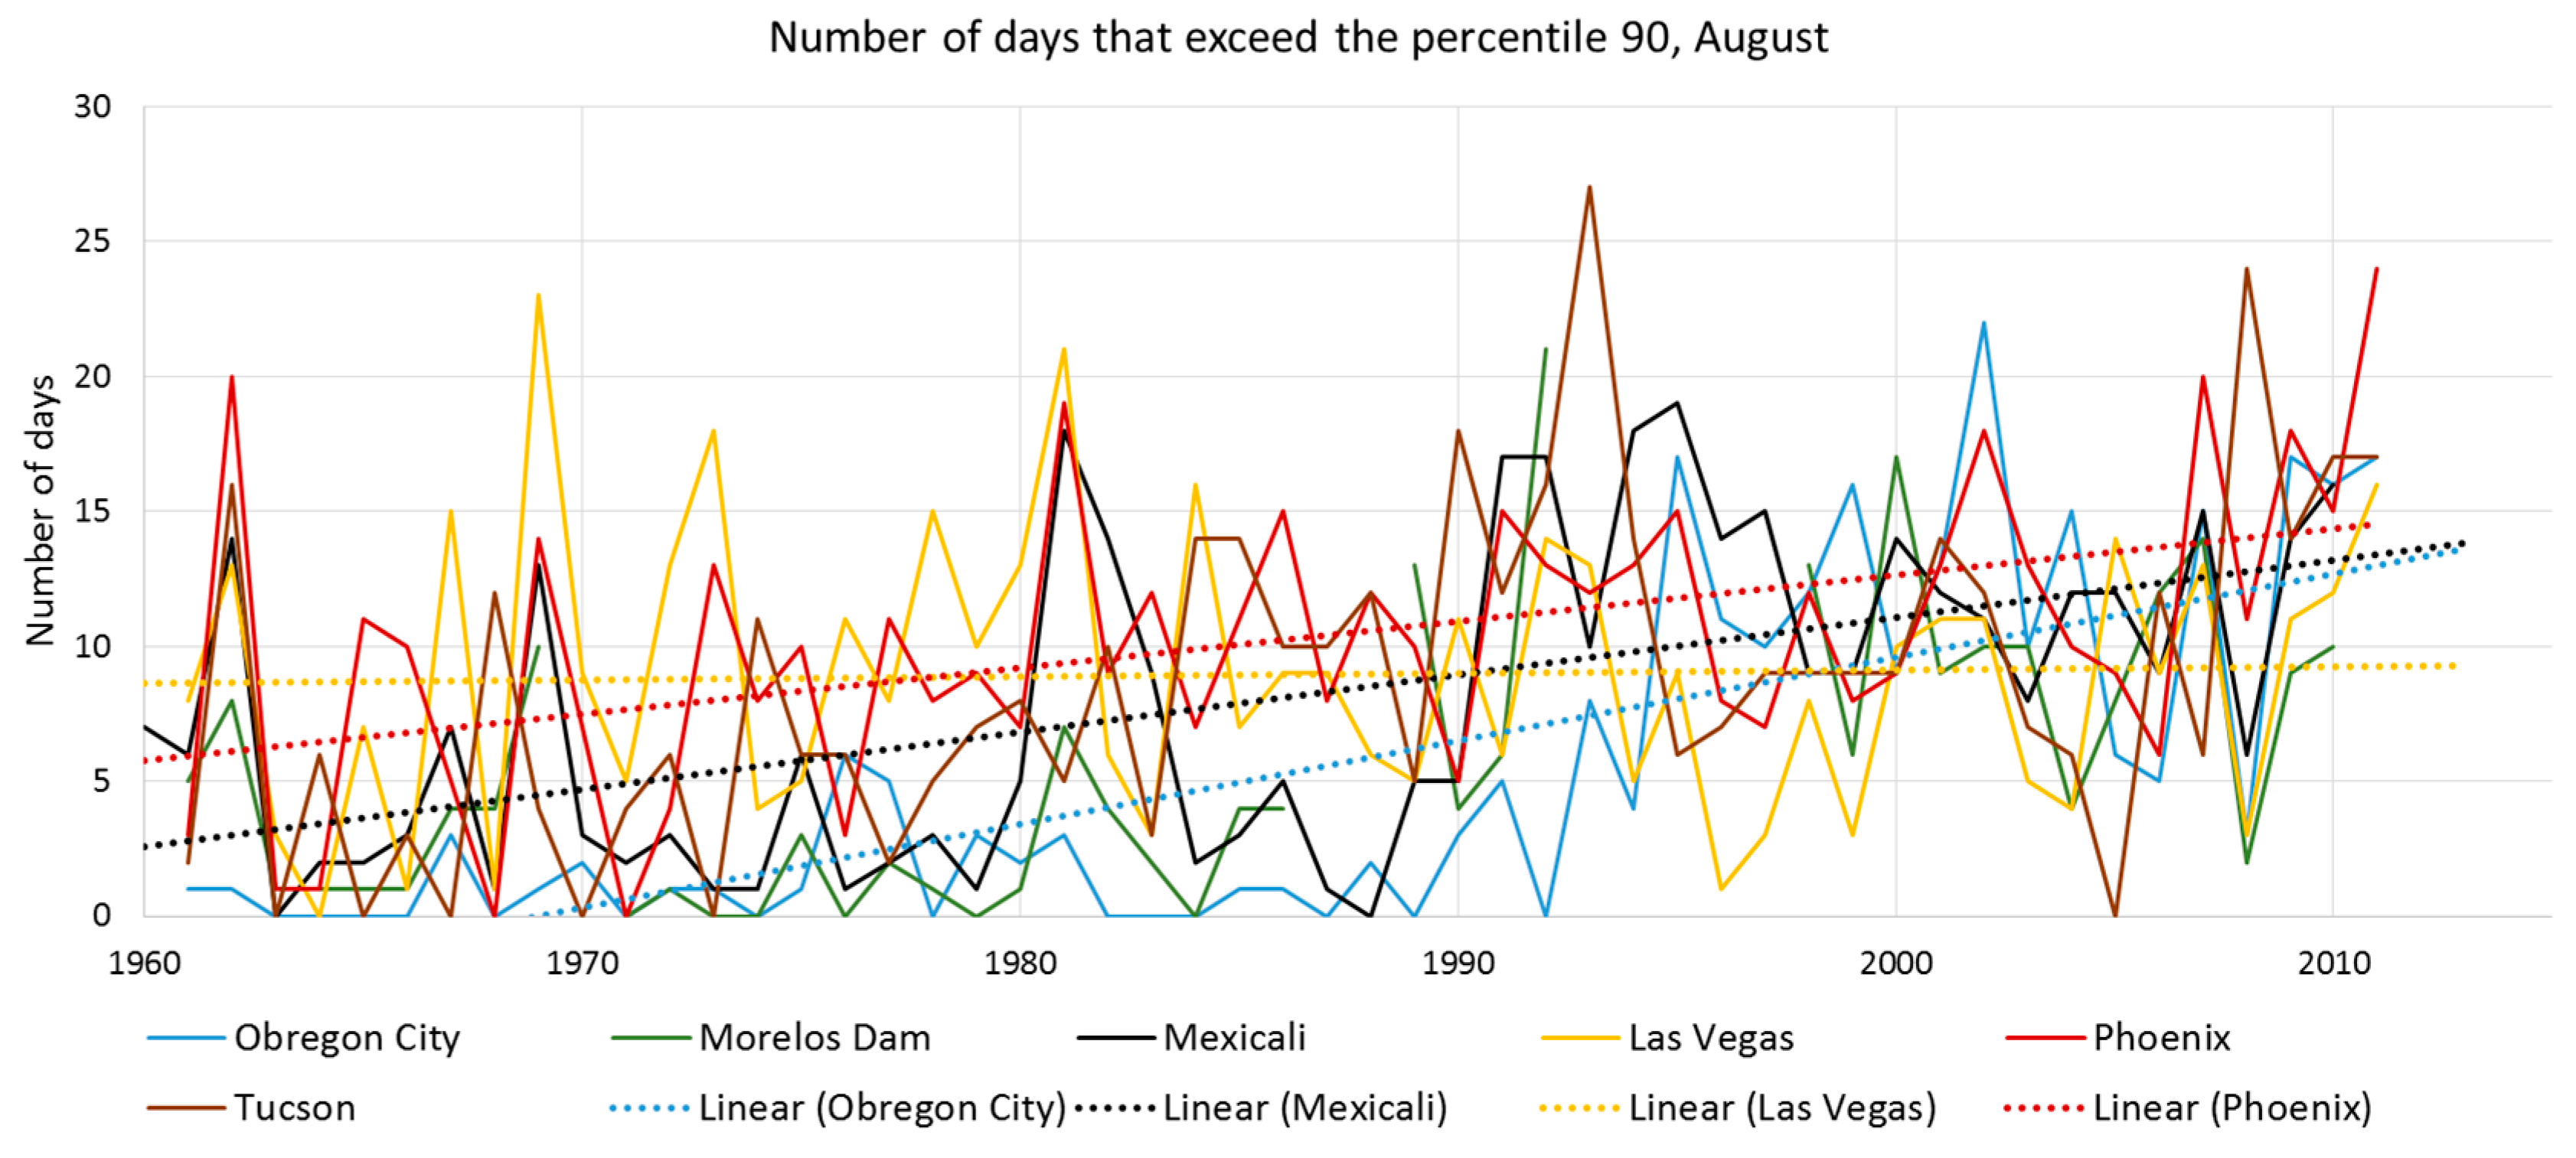
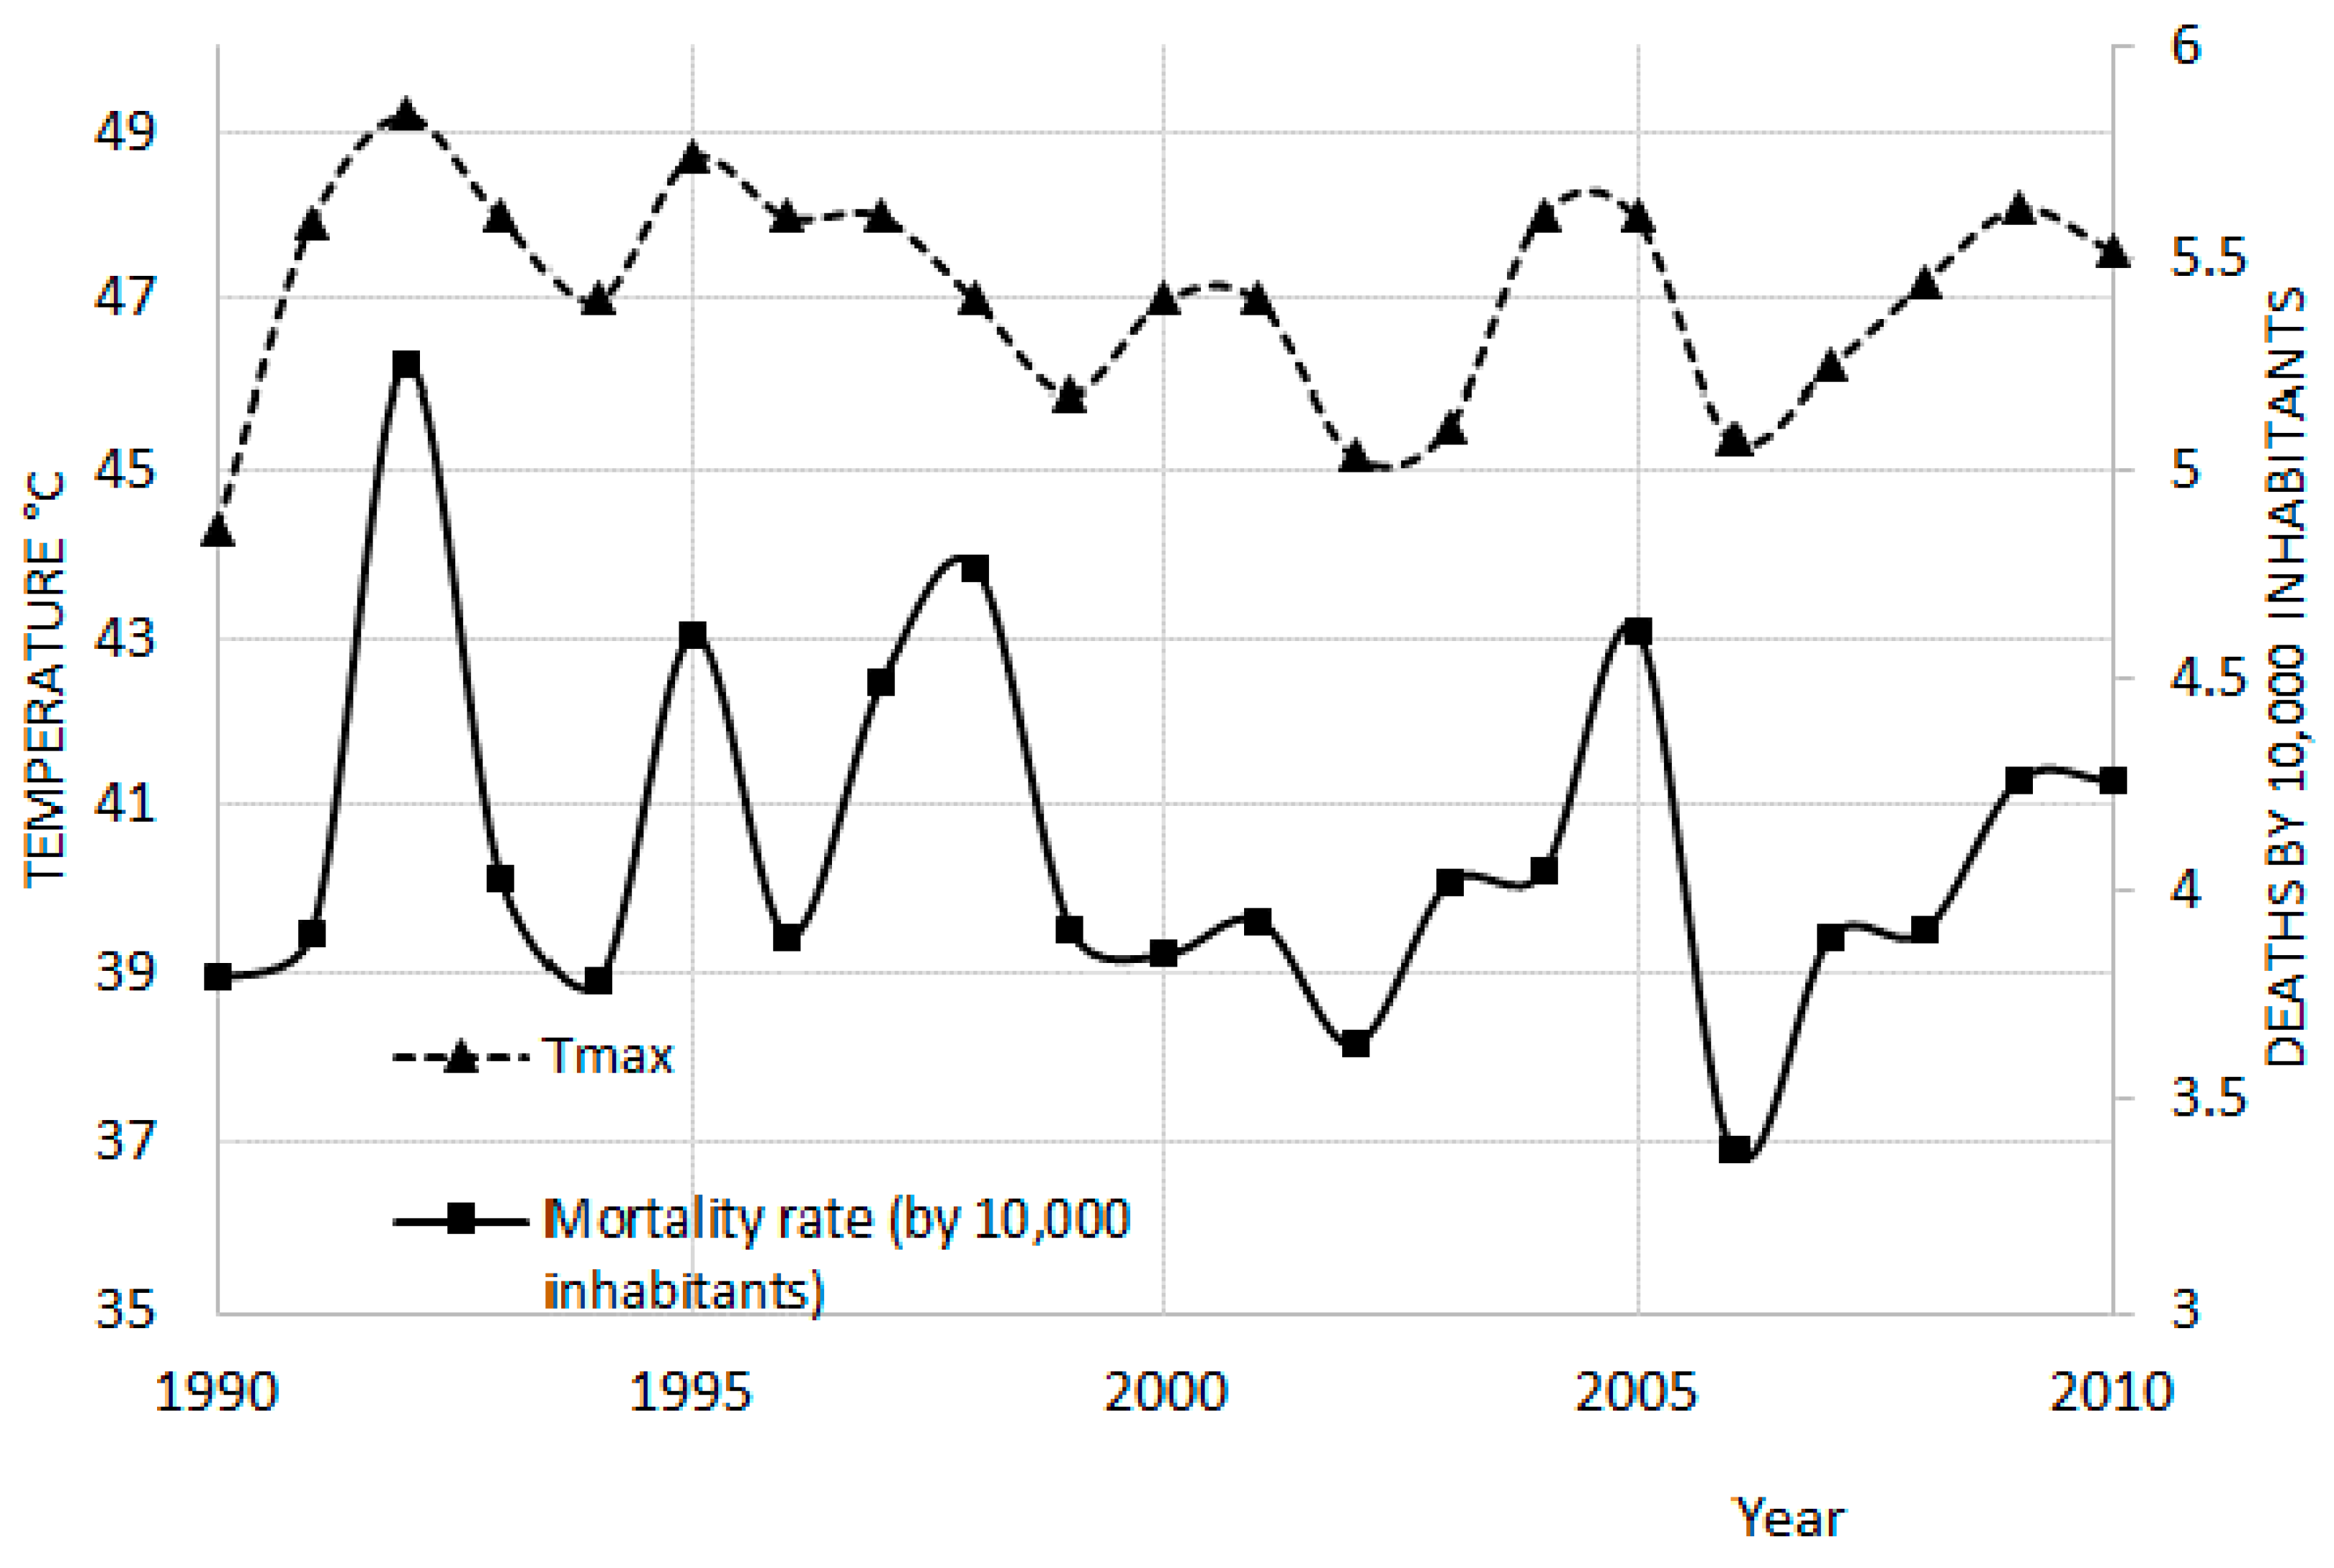
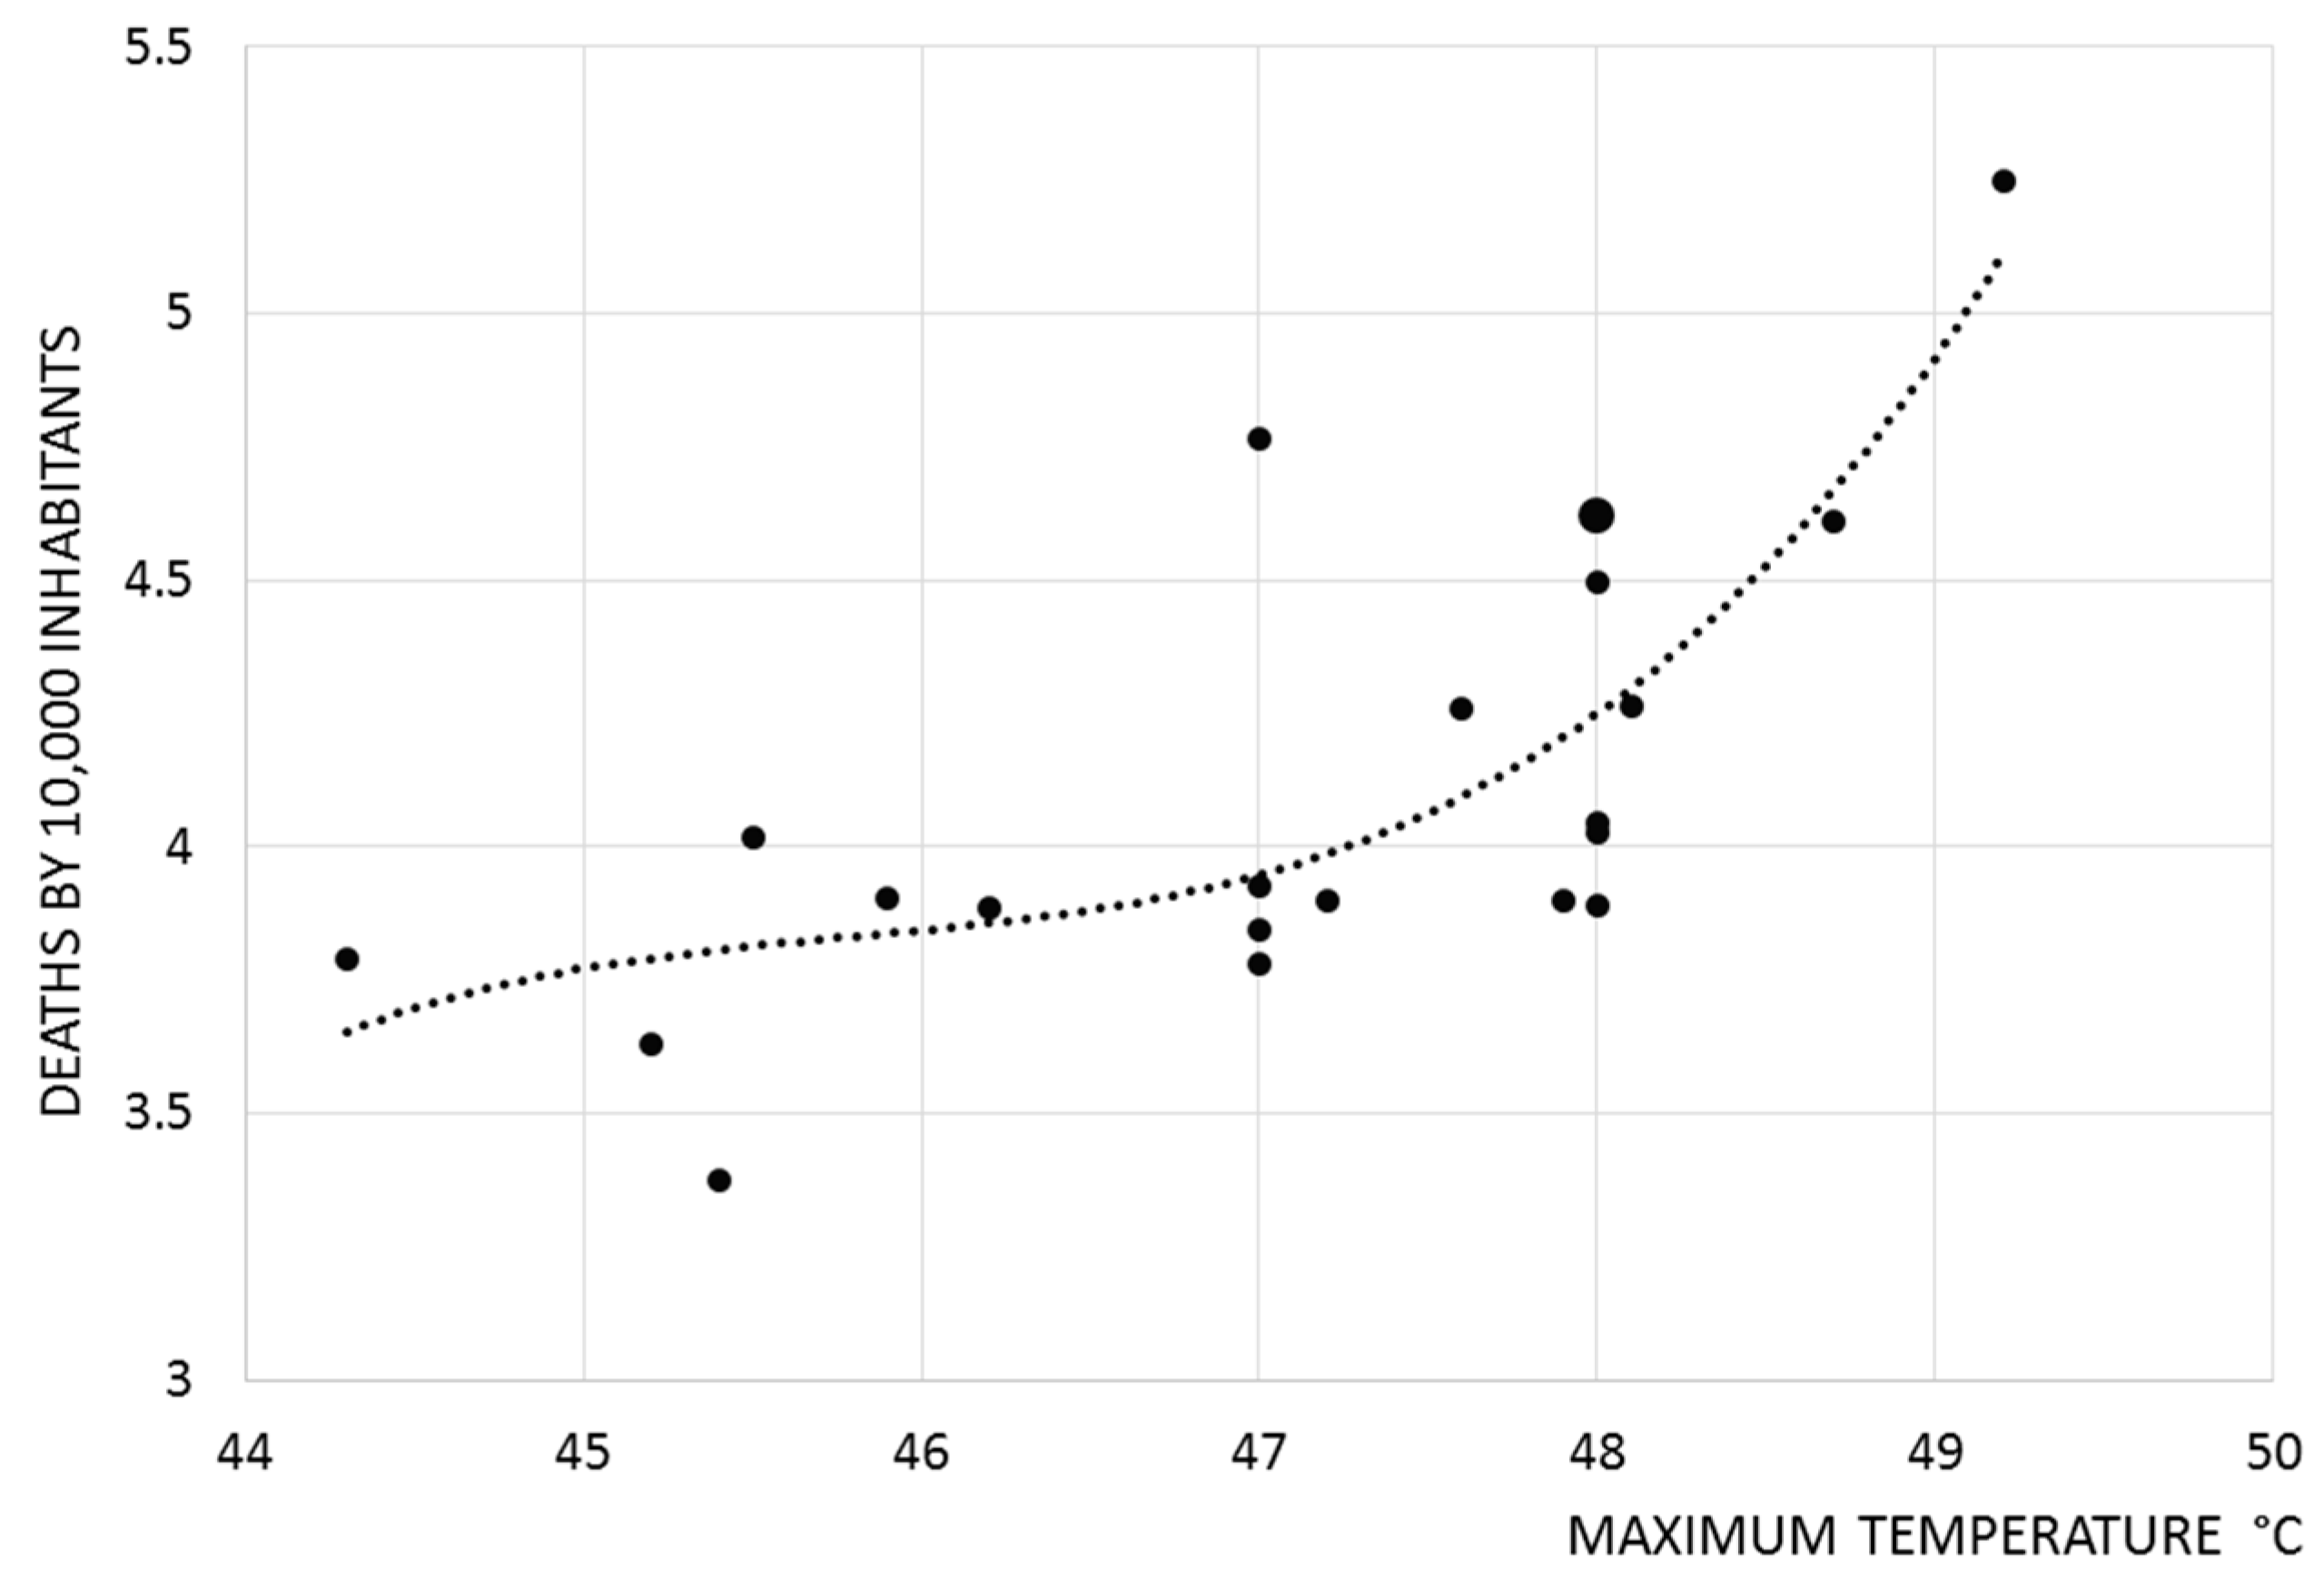
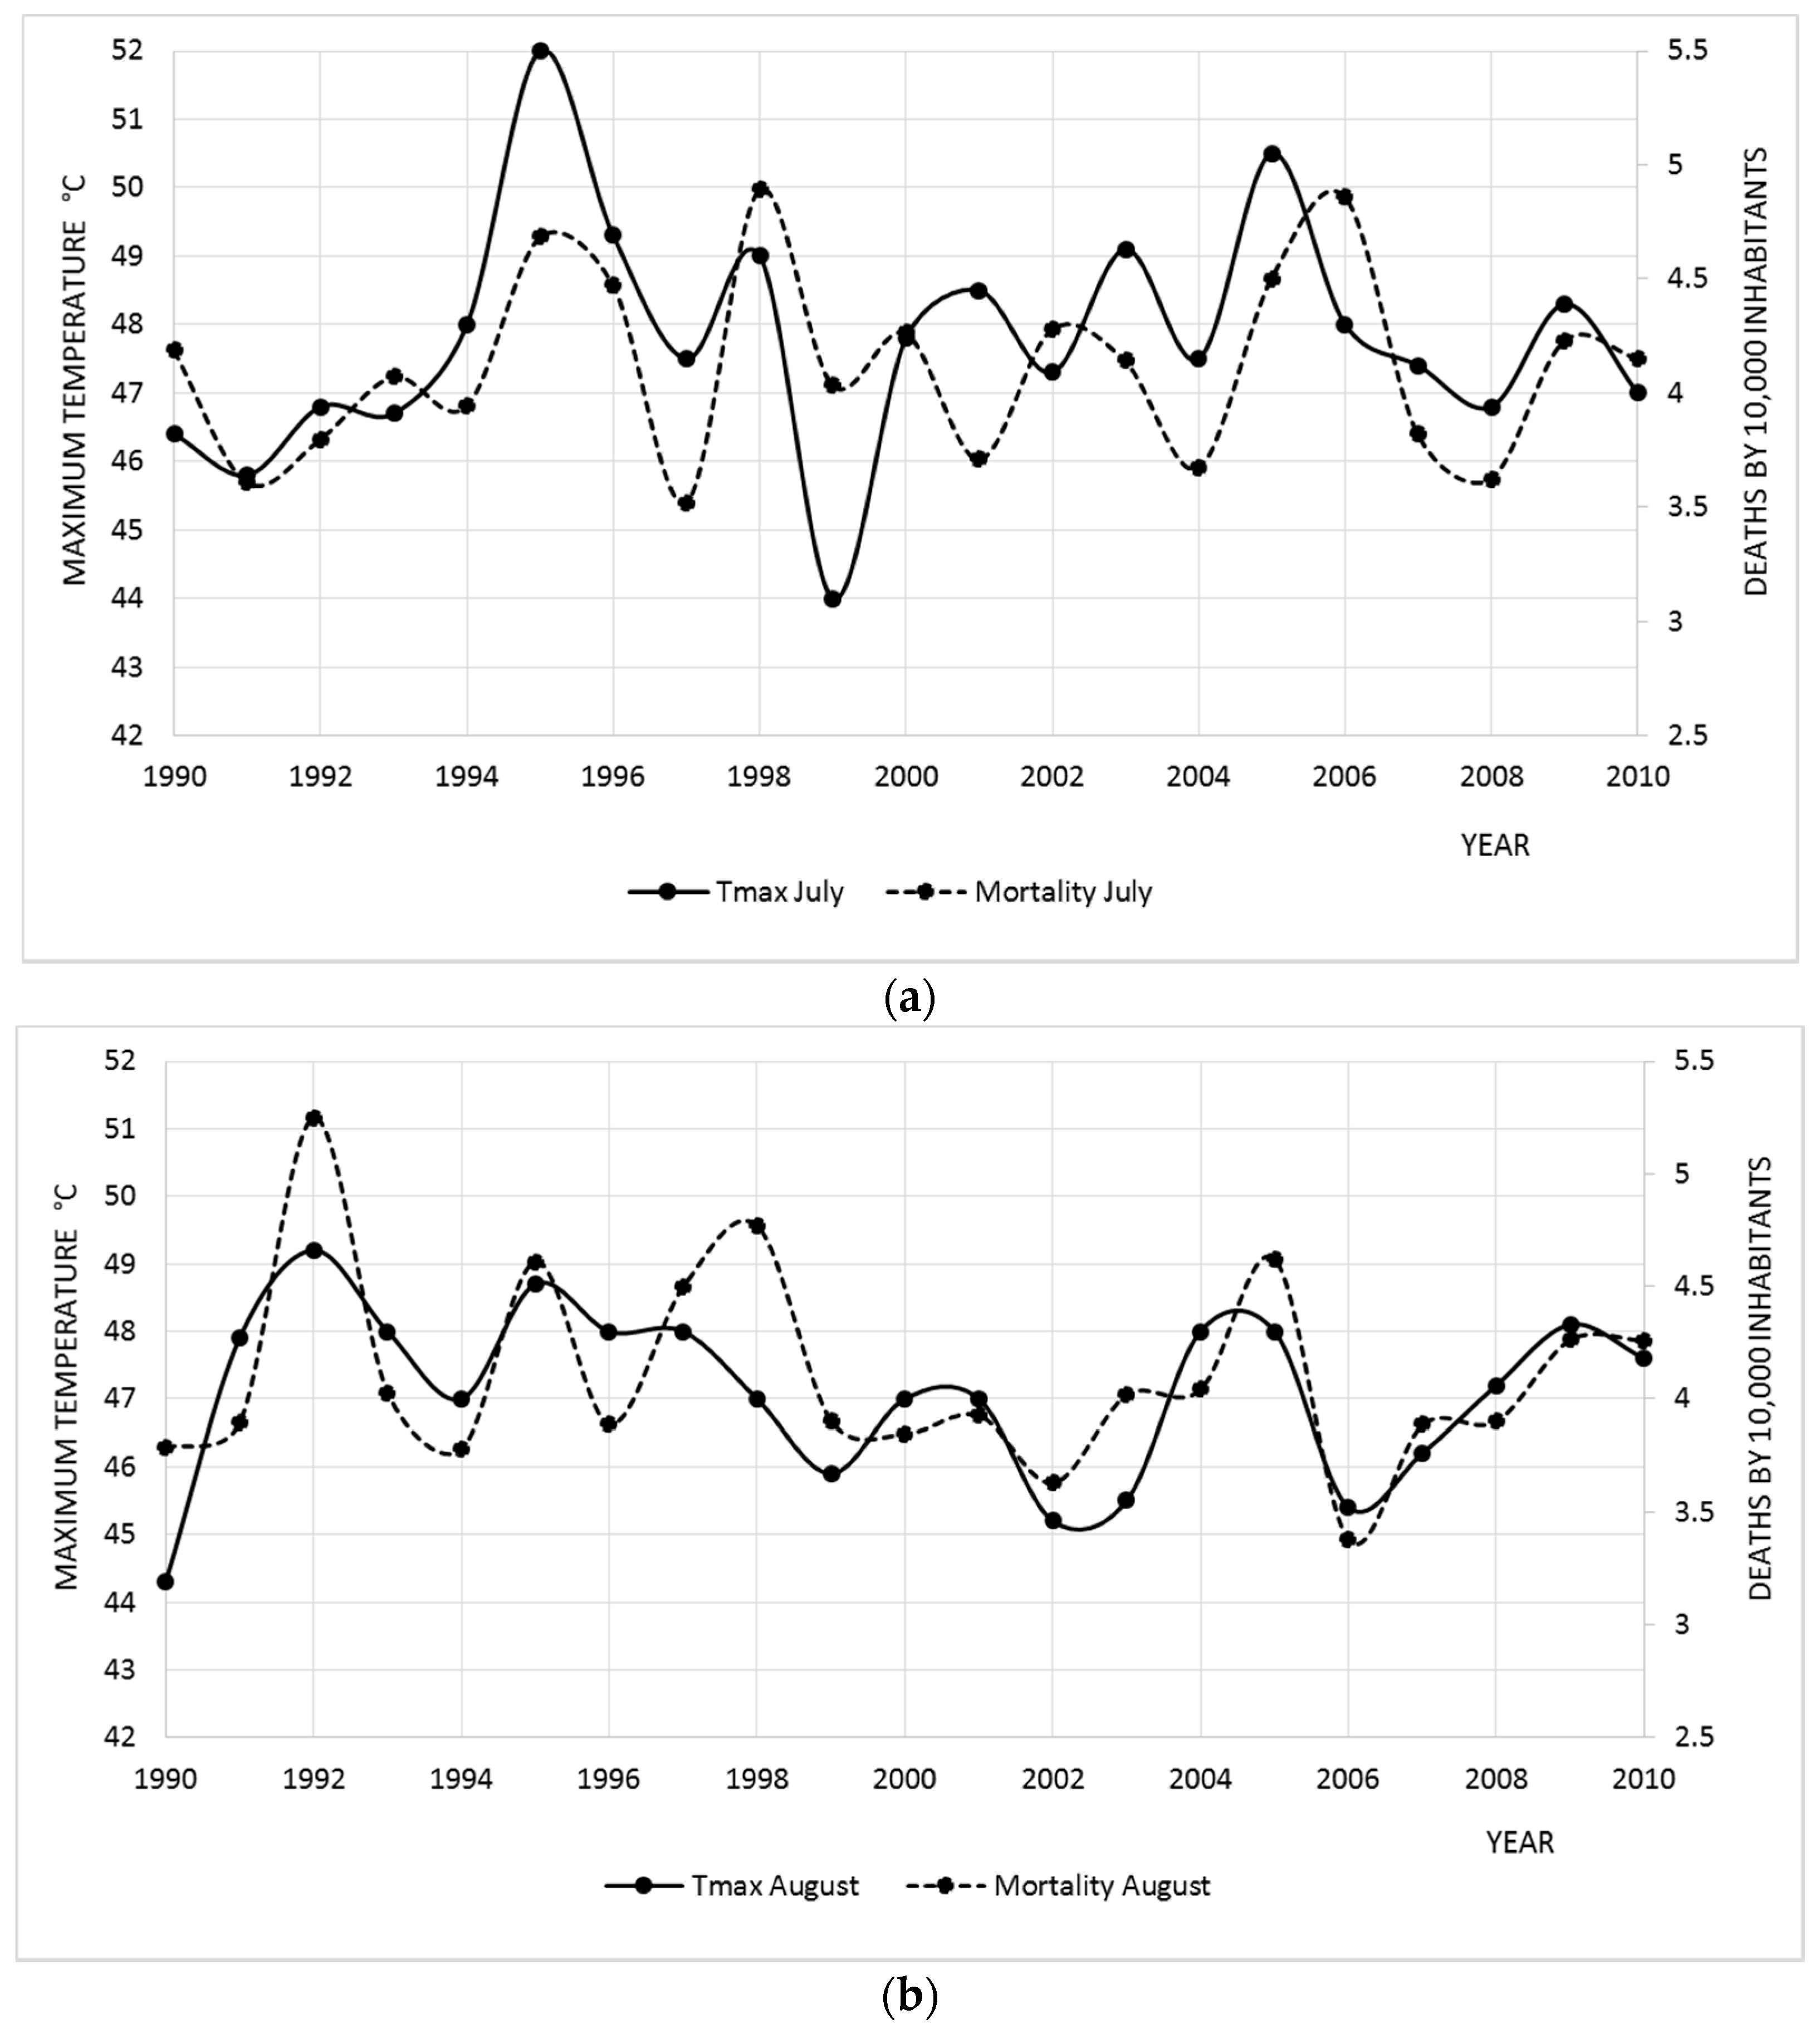
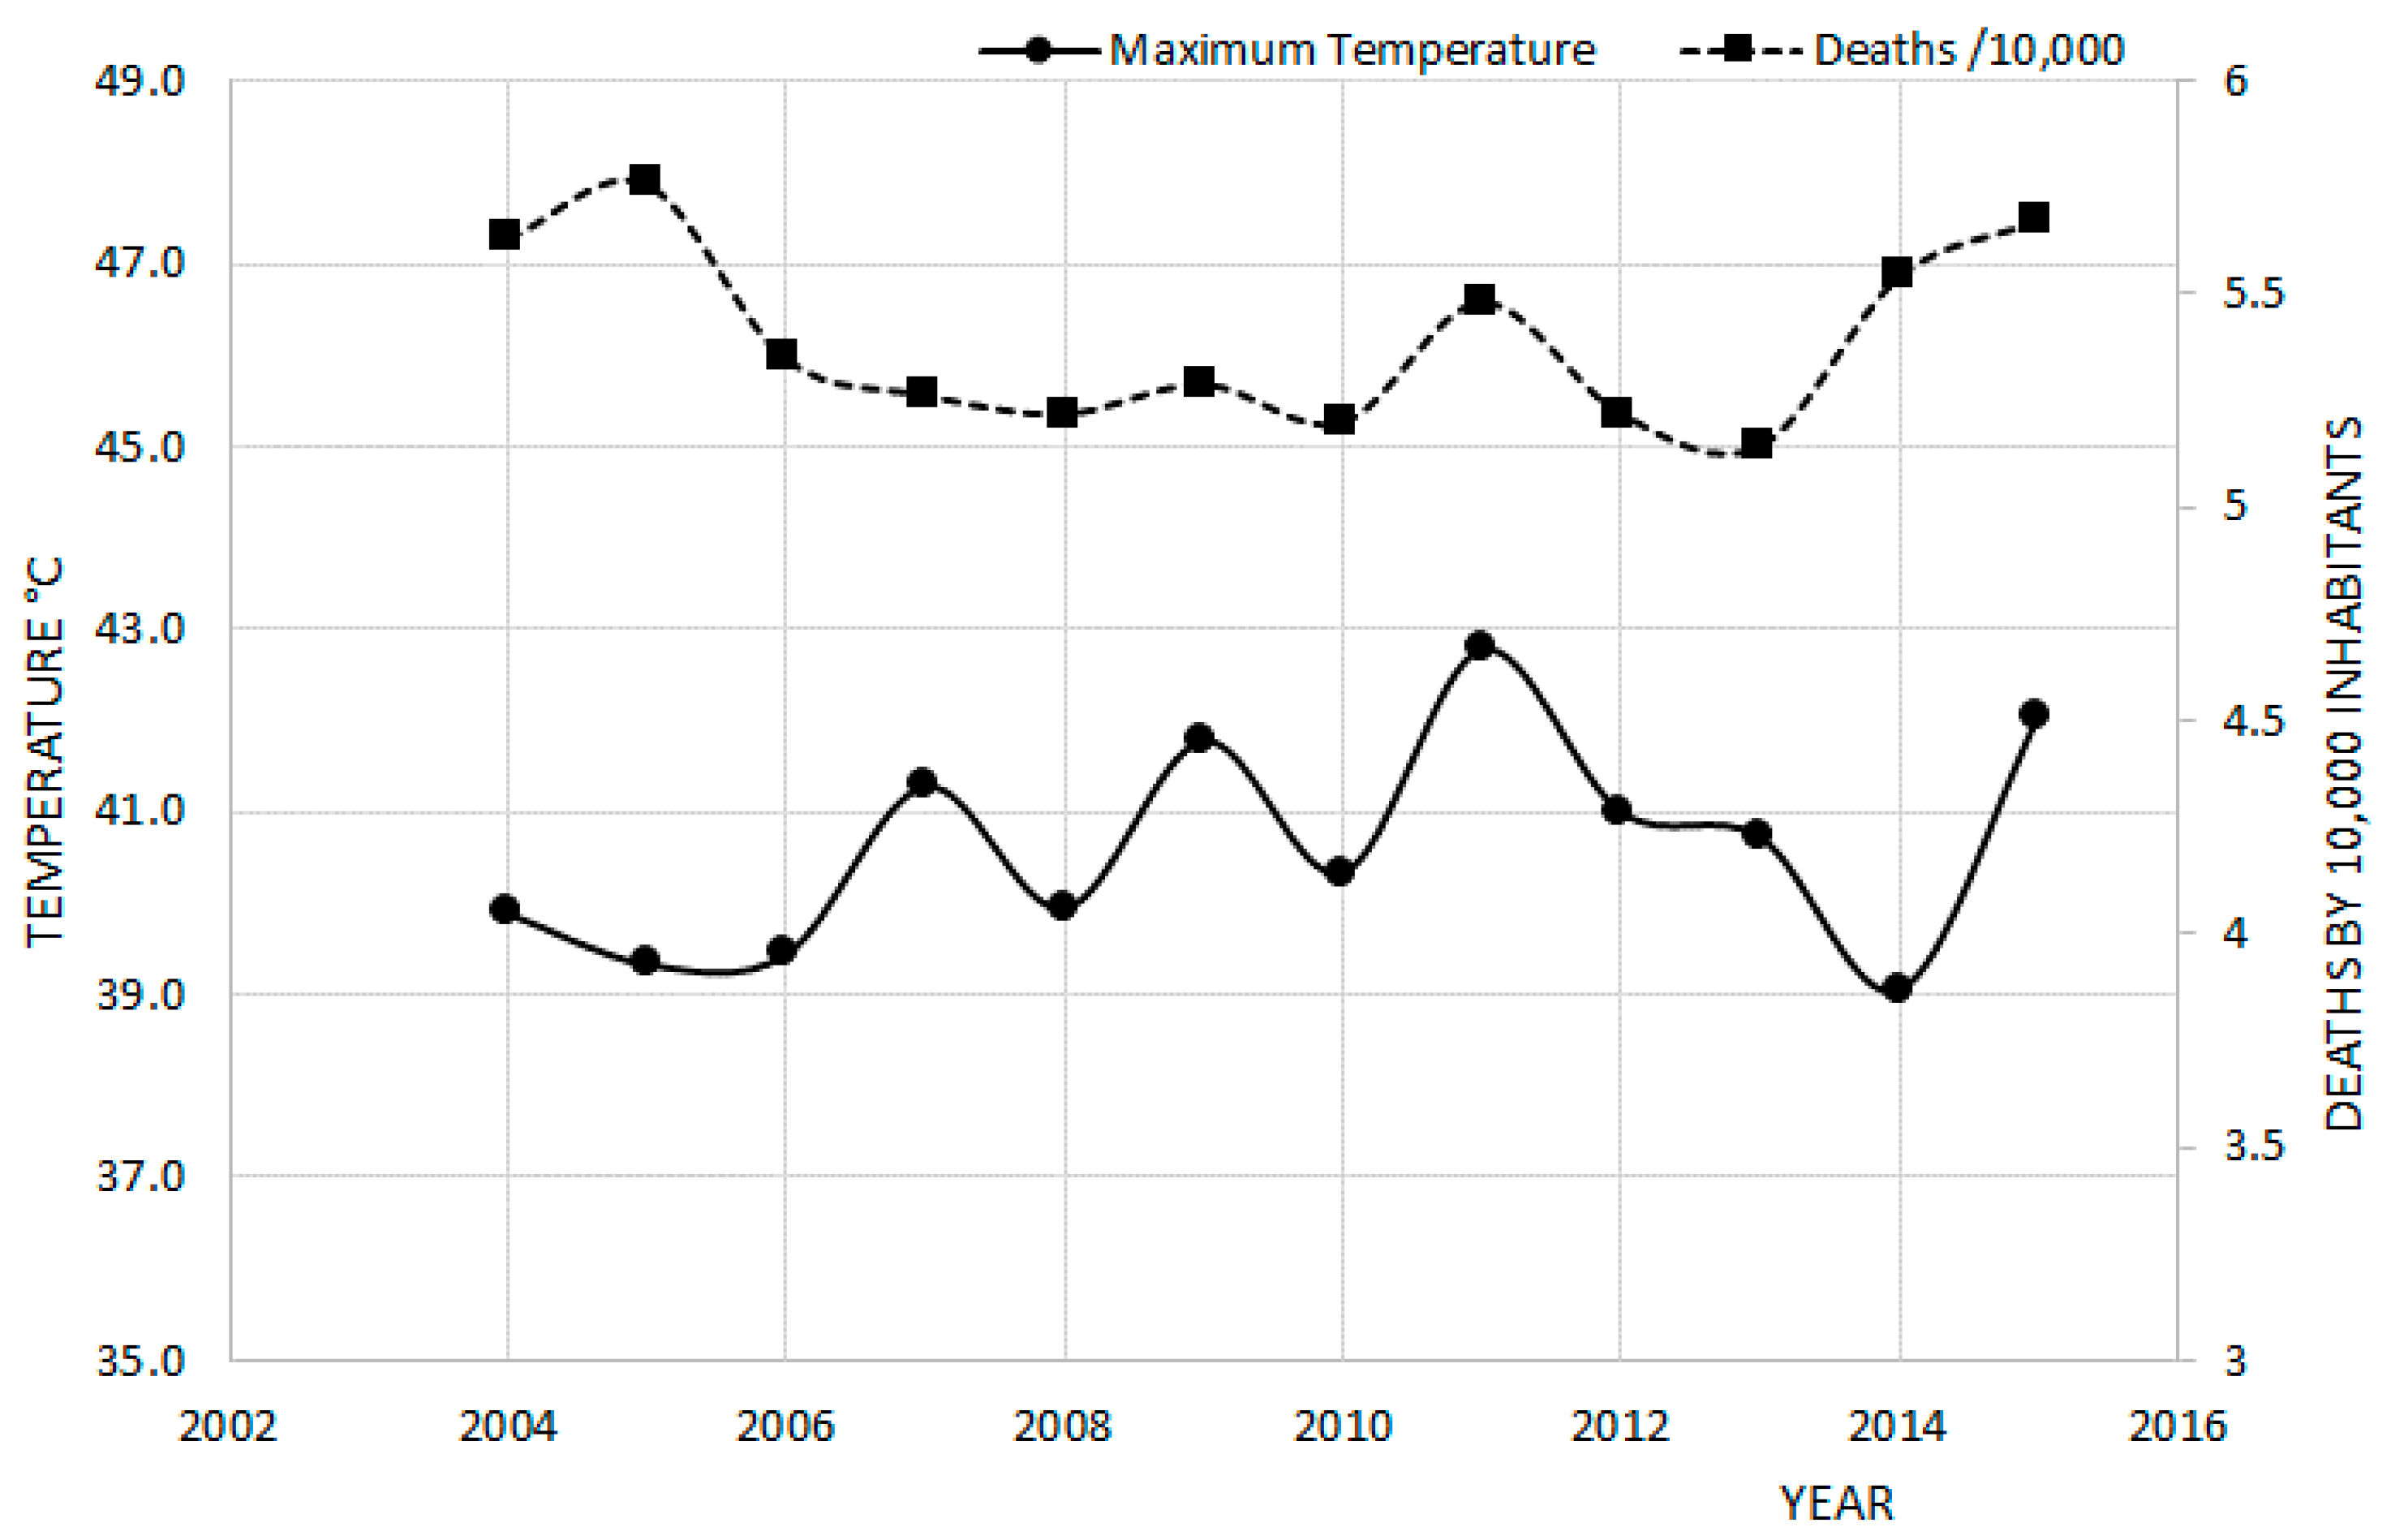
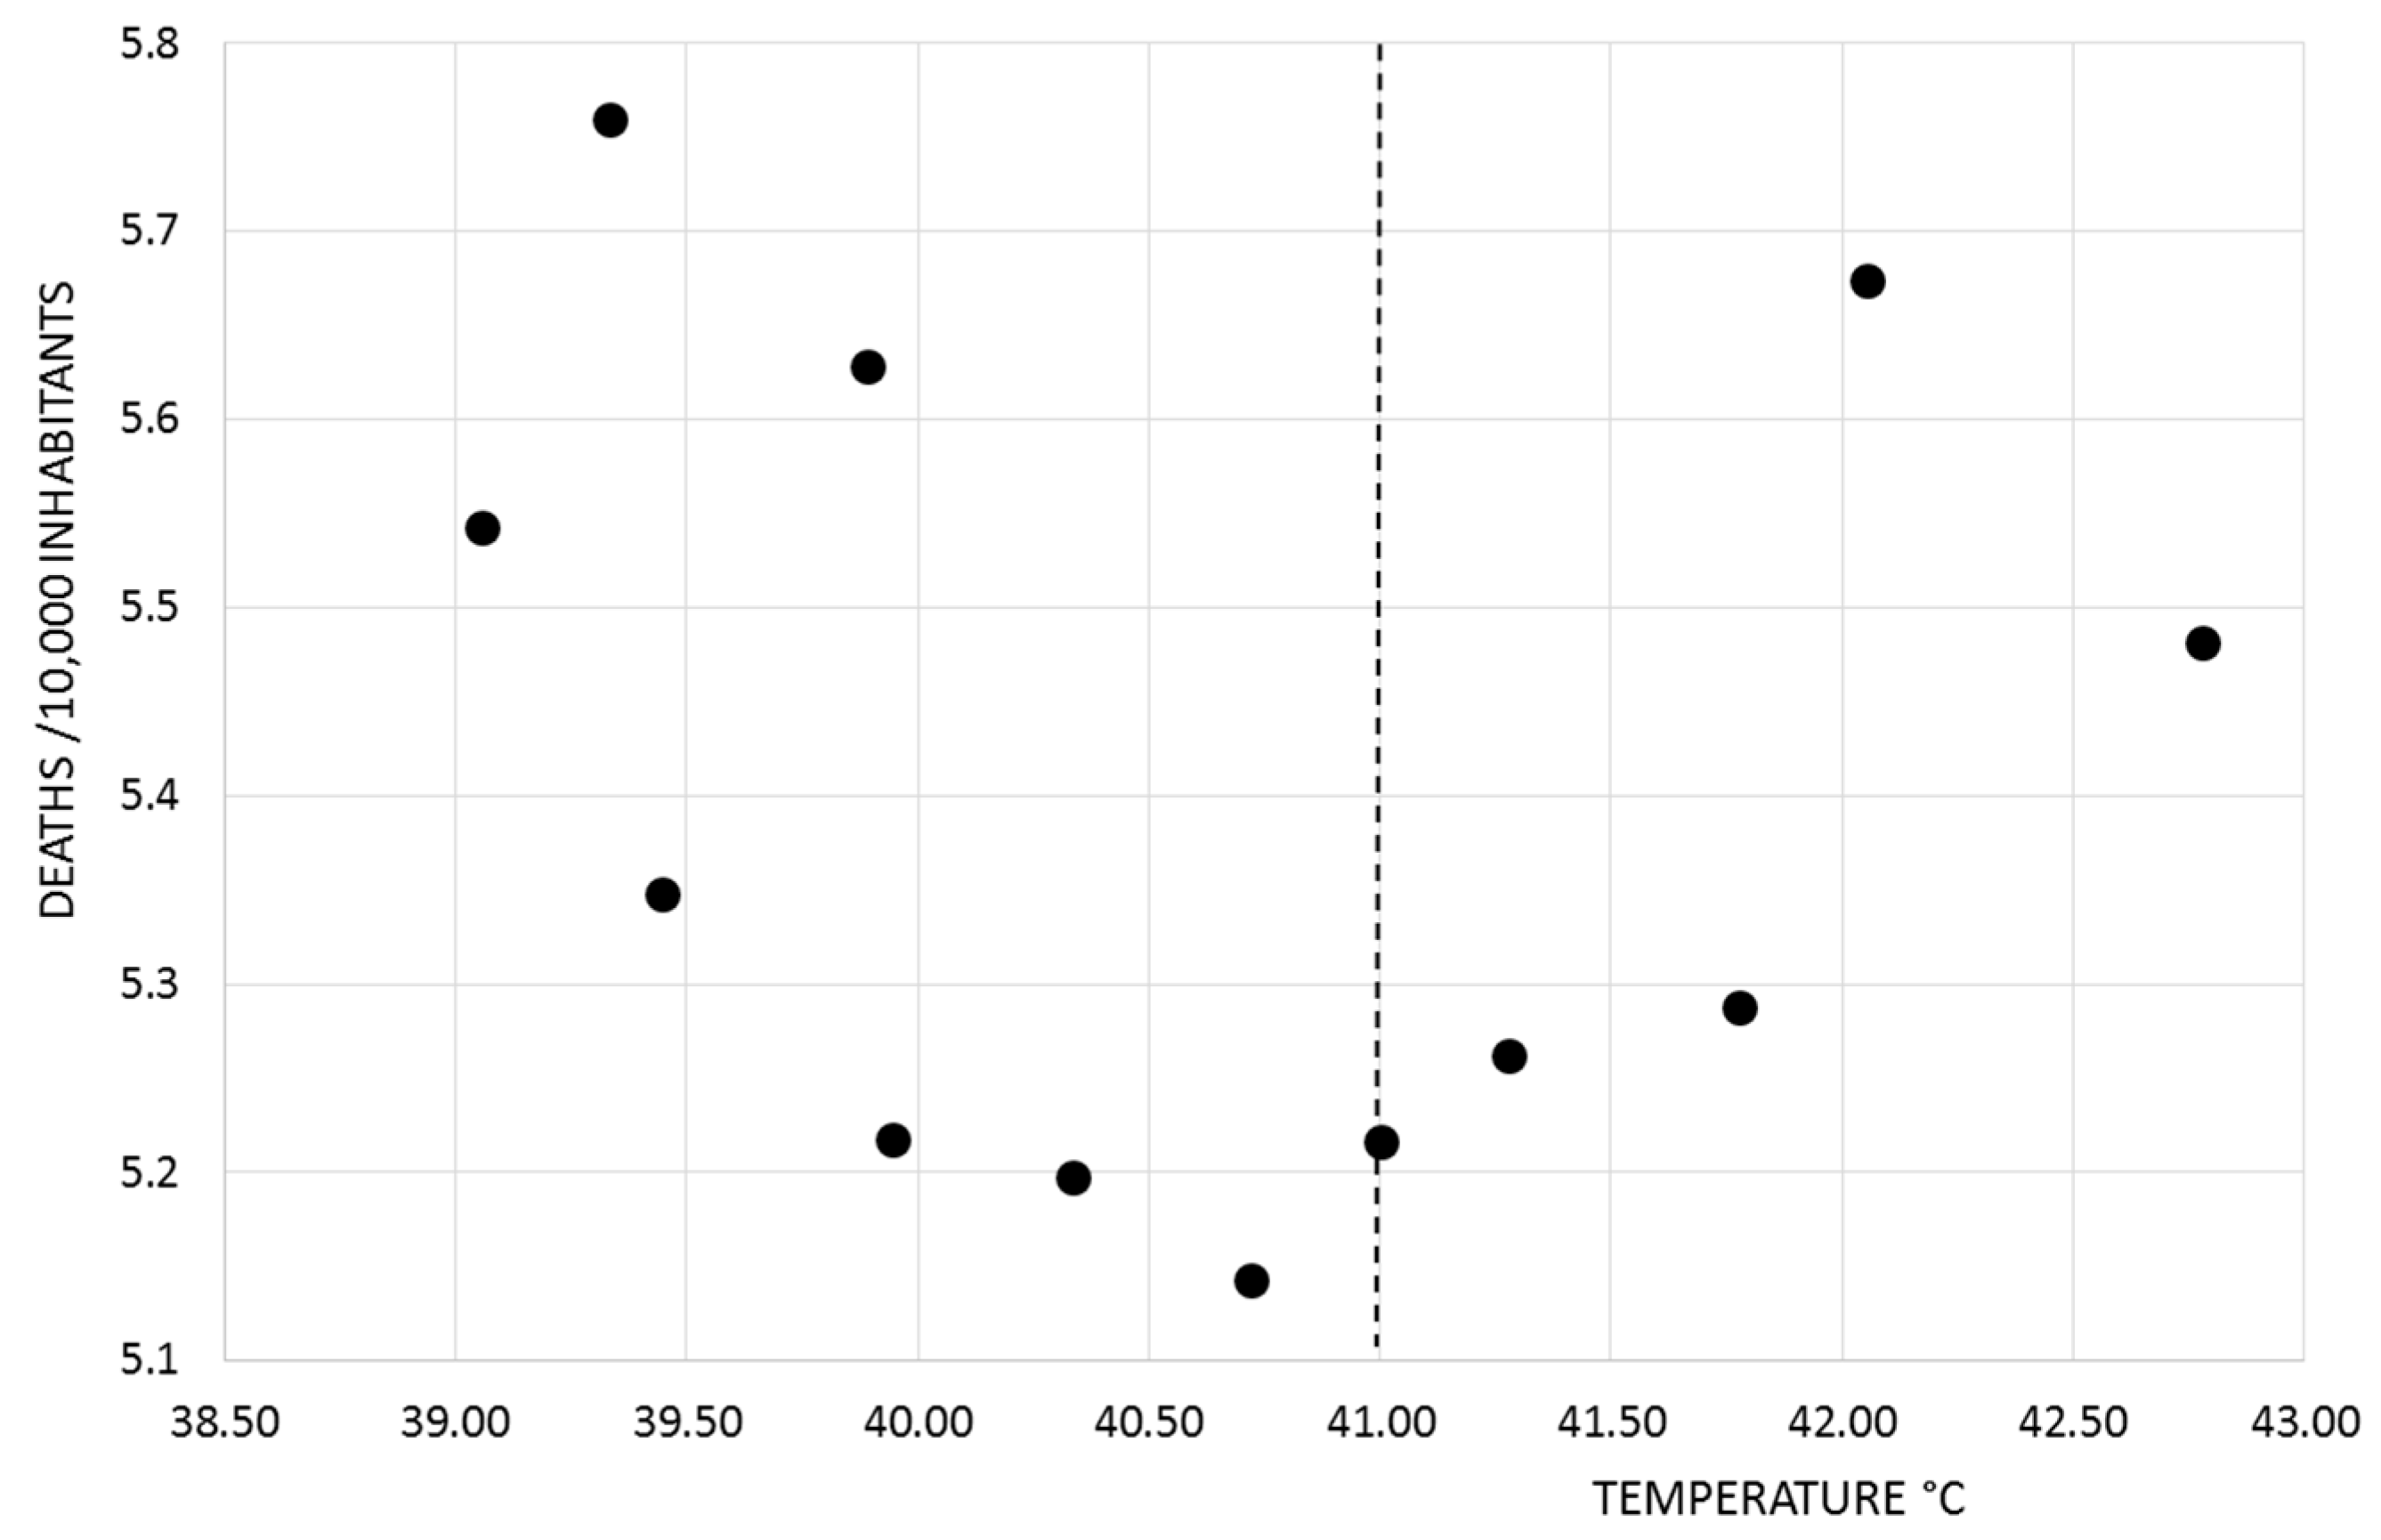
3.2.1. Heat Waves and Mortality in the Study Area

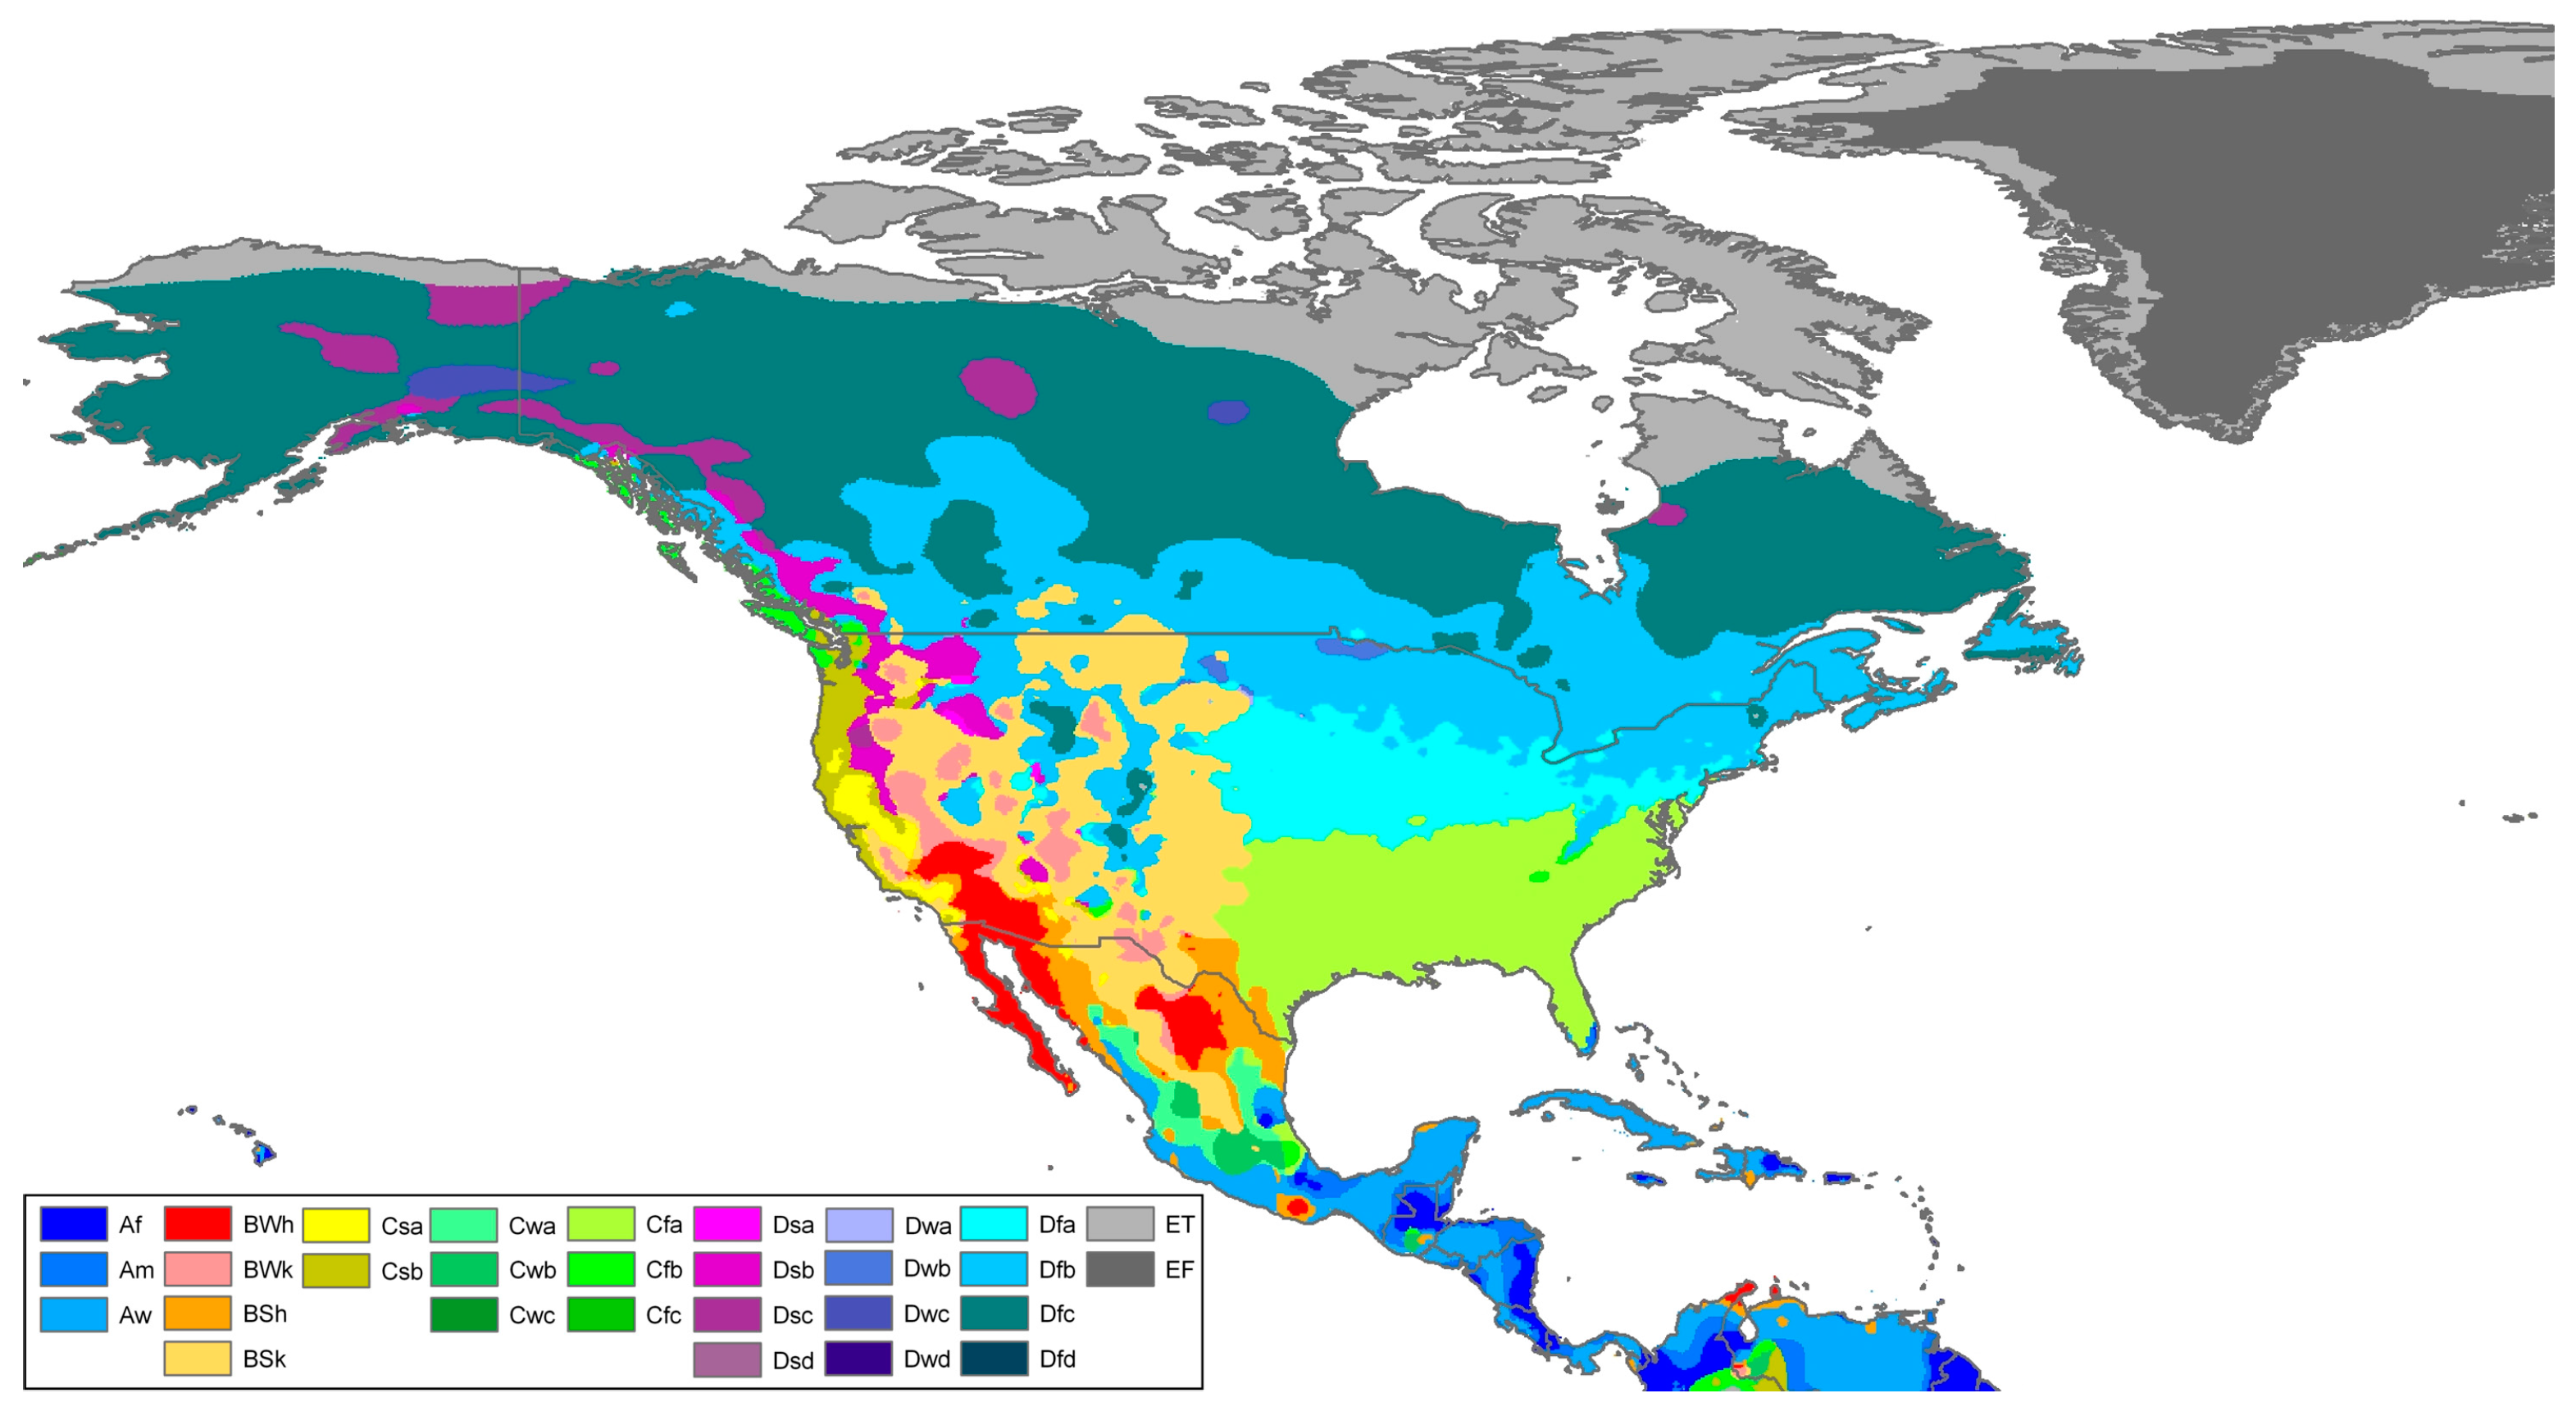
Southwestern United States

Figure 5 shows the relationship between maximum temperature in Phoenix and the total mortality rate values (per 10,000 inhabitants) in Maricopa County (where Phoenix is located) during August (2004 to 2015). Mortality information was obtained from the Arizona Department of Health Services. As shown, the mortality rate values vary widely within the time interval (low, 5.14, in 2013; high, 5.76, in 2005). Taking into account information from the Arizona Bureau of Public Health Statistics, in the state of Arizona and considering only heat-related deaths, in the period from 1992 to 2009 there were 1485 deaths, growing from only 10 deaths in 1993 to 110 in 2009, with one maximum of 225 in 2005 [39]. From 2009 to 2012, the number of deaths ranged from97 in 2012 to a peak of 137 in 2010 [40]. Considering the five-year average in the full 1992–2012 series [39,40], the annual average of heat-related deaths in Arizona increased from 35.6 in the period 1992–1996 to 116.2 in the 2007–2011 period.
The correlation between the maximum temperature values and the mortality rate was also studied in this paper. Figure 6 shows the relationship between the mortality rate (per 10,000 inhabitants) and the maximum temperatures recorded in the Maricopa County. If we consider the operational definitions of a heat wave, there must be a threshold from which temperature must have a discernible impact on mortality, and below which there should be no correlation. In the case of Maricopa County, the 90th percentile is 41 °C, which is shown in a dotted line in Figure 6. The extension of the data is not sufficient to prove a statistically valid correlation, but for now an inspection of the dispersion diagram shows an increasing trend from this value.
It is interesting that, as described in the report from Arizona Department of Health Services [39], from 2000 to 2012, illegal migrants from Mexico and Central and South America accounted for almost half of all the heat-related deaths (736), followed by Arizona residents (589), and 210 deaths from individuals from other states, countries, or of unknown origin. Among migrants, young adults between 20 and 44 years old accounted for 71% of the deaths related to excessive heat, and adolescents (ages 15 to 19) accounted for an additional 11.3% of the total number of deaths. The median age of death for migrants was 29 years of age. This is in contrast to Arizona residents, where 65% of all heat-related mortality occurs for adults over 45 years of age, and the median age of death was 57. These data are also interesting to contrast with the data from 1992 to 1999, during which only 54 deaths were registered for illegal immigrants [40].

Northwest Mexico

Mexicali is the Mexican city with the highest number of recorded deaths from heatstroke, so it is reasonable to expect a positive correlation between total mortality and extreme heat. Figure 7 shows the change in the mortality rate (per 10,000 inhabitants) and monthly maximum temperatures from 1990 to 2010 for that municipality. The graph shows that the mortality rate rises during higher maximum temperature periods. The Pearson correlation coefficient between the two variables, mortality rate and maximum temperature, is positive and high (0.67). The mortality information for Mexico was obtained from the databases of the National Institute of Information and Statistics (www.inegi.org.mx).
Figure 8 shows the correlation between maximum temperature in August and mortality rate. In the case of this city, the 90th percentile of average maximum temperatures is less than 44 °C, so the data set should show a more evident growing trend. The correlation between mortality and temperature of the data shown in the graph is 0.67, and the polynomial fit shown has a correlation coefficient r of 0.585.
Because the effects of extreme heat on health are manifested only starting from a temperature value or range, a threshold, the correlation between maximum temperatures and mortality will change from one month to another. Figure 9 shows the relationship between maximum monthly temperatures (continuous lines) and mortality (dotted lines) for the months of July, August, and September in the city of Mexicali, between 1990 and 2010. The correlation coefficient is 0.533, 0.67, and 0.322 for July, August, and September, respectively. Naturally, as the end of the summer comes and with the beginning of the coldest months of the year, there will be no correlation between mortality and maximum temperatures. It is therefore recommended that the selection of a maximum temperature threshold be made during the warmest month of the year.

4. Conclusions

The extreme temperature trends in the Sonoran and Mohave Deserts were analyzed. Some of the most populated cities in the region were selected: Phoenix, Tucson, and Las Vegas in the United States; and Mexicali, Ciudad Obregon, and San Luis Río Colorado (Morelos Dam) in Mexico. It was found that there is a clear increasing trend of extreme heat events in the region. This trend is also statistically significant, which was demonstrated using Spearman’s rho nonparametric test. The climate change models show that this is the expected behavior for the region under the effects of global warming, and therefore we can interpret this result as a signal of the effects of climate change.
As shown in Figure 4, the number of days exceeding the 90th percentile of the average temperatures of the maximums in the analyzed period, in each indicated month, has also increased, which makes the heat waves even more dangerous. Las Vegas was the only city where a statistically significant trend was not found, presumably because of the proximity of the Hoover Dam, but this should be studied in more detail.
A positive and significant correlation between mortality and extreme temperatures in two cities in the selected region was also found. In the case of Phoenix, upon considering the 90th percentile of the maximum temperature, a clear relationship between this variable and mortality was observed, which means that the mortality rate increases continually with the extreme temperature. In the case of Mexicali, with a correlation coefficient of 0.67, there seems to be an increasing trend of mortality as the maximum temperature increases. Because both extreme heat events and the number of days with those events are increasing, and given the undeniable negative health effects from extreme heat, these results prove that there is an urgent need for more detailed prevention and adaptation plans in this climatic region.

Acknowledgments

This research is a collaborative effort of the UNESCO Chair on Hydrometeorological Risks hosted by Universidad de las Americas Puebla. Both authors are members of the Chair. The authors are grateful to Nicole Damon for her editorial review.

Author Contributions

Both authors contributed in the planning, research, analysis of information, writing and review of the paper.

Conflicts of Interest

The authors declare no conflicts of interest.

References

  1. Xu, Z.; FitzGerald, G.; Guo, Y.; Jalaludin, B.; Tong, S. Impact of heatwave on mortality under different heatwave definitions: A Systematic review and meta-analysis. Environ. Int. 2016, 89–90, 193–293. [Google Scholar] [CrossRef] [PubMed]
  2. Madrigano, J.; Ito, K.; Johnson, S.; Kinney, P.; Matte, T. A case-only study of vulnerability to heat wave-related mortality in New York City (2000–2001). Environ. Health Perspect. 2015, 123, 672–678. [Google Scholar] [PubMed]
  3. Vanos, J.K.; Kalkstein, L.S.; Sanford, T.J. Detecting synoptic warming trends across the US Midwest and implications to human health and heat-related mortality. J. Climatol. 2014, 35, 85–96. [Google Scholar] [CrossRef]
  4. Habeeb, D.; Vaego, J.; Stone, B. Rising heat wave trends in large U.S. cities. Nat. Hazards 2015, 76, 1651–1665. [Google Scholar] [CrossRef]
  5. Martínez-Austria, P.; Bandala, E.; Patiño-Gómez, C. Temperature and heat wave trends in northwest Mexico. Phys. Chem. Earth 2015, 91, 20–26. [Google Scholar] [CrossRef]
  6. Caravante, E.R.D.; Luque, A.L.C.; Gallegos, P.A. Mortality for excesive natural heat in the northwest Mexico: Social conditions associated with the cause of death. Front. Norte 2014, 26, 52. [Google Scholar]
  7. Moreno-Rodriguez, V.; del Rio-Salas, R.; Adams, D.K.; Ochoa-Landin, L.; Zepeda, J.; Gomez-Alvarez, A.; Palafox-Reyes, J.; Meza-Figueroa, D. Historical Trends and sources of TSP in a Sonoran desert city: Can the North America Monsoon enhance dust emissions? Atmos. Environ. 2015, 110, 111–121. [Google Scholar] [CrossRef]
  8. Guirguis, K.; Gershunov, A.; Tardy, A.; Basu, R. The impact of recent heat waves on human health in California. J. Appl. Meteor. Climatol. 2014, 53, 3–19. [Google Scholar] [CrossRef]
  9. Drake, J.C.; Jennes, J.S.; Calvert, J.; Griffis-Keyle, K.L. Testing model for the prediction of isolated waters in Sonoran desert. J. Arid Environ. 2015, 118, 1–8. [Google Scholar] [CrossRef]
  10. Myint, S.W.; Zheng, B.; Talen, E.; Fran, C.; Kaplan, S.; Middel, A.; Smith, M.; Huang, H.; Brazel, A. Does the spatial arrangement of urban landscape matter? Examples of urban warming and cooling in Phoenix and Las Vegas. Ecosyst. Health Sust. 2015, 1, 1–5. [Google Scholar] [CrossRef]
  11. Jones, B.; O’neil, B.C.; McDaniel, L.; McGuinnis, S.; Mearns, L.O.; Tebaldi, C. Future population exposure to US heat extremes. Nat. Clim. Chang. 2015, 5, 652–655. [Google Scholar] [CrossRef]
  12. INE. Mexico third national communication to the United Nations Framework Convention on Climate Change; National Institute of Ecology, Ministry of Environment Resources: Insurgentes Cuicuilco, Mexico, 2007.
  13. Montero-Martínez, M.J.; Martínez-Jiménez, J.; Castillo-Perez, N.I.; Espinoza-Tamarindo, B.E. Escenarios Climáticos en México Proyectados Para el Siglo XXI: Precipitación y Temperaturas Máxima y Mínima. In Atlas de Vulnerabilidad Hídrica en México ante el Cambio Climático; Martínez-Austria, P.F., Patiño-Gómez, C., Eds.; Jiutepec, Morelos, Instituto Mexicano de Tecnología del Agua: Jiutepec, Mexico, 2010; pp. 10–39. [Google Scholar]
  14. Intergovernmental Panel on Climate Change. Intergovernmental Panel on Climate Change. Summary for Policymakers. In Climate Change 2013: The Physical Basis; Stocker, T.F., Ed.; Cambridge University Press: Cambrige, UK, 2013. [Google Scholar]
  15. Meehl, G.A.; Tebaldi, C. More intense, more frequent, and longer lasting heat waves in the 21st century. Sci. Rep. 2004, 305, 994–997. [Google Scholar] [CrossRef] [PubMed]
  16. Ganguly, R.; Steinhaeuser, K.; Erickson, D.J.; Branstetter, M.; Parish, E.S.; Singh, N.; Drake, J.B.; Buja, L. Higher trends but larger uncertainty and geographic variability in 21st century temperature and heat waves. Proc. Natl. Acad. Sci. USA 2009, 106, 15555–15559. [Google Scholar] [CrossRef] [PubMed]
  17. Randall, D.A.; Word, R.A. Climate Models and Their Evaluation. In IPCC, Climate 2007: Impacts, Adaptation and Vulnerability; Cambridge University Press: Cambridge, UK, 2007; pp. 589–662. [Google Scholar]
  18. WHO and WMO. Atlas of Health and Climate; WHO and WMO: Geneva, Switzerland, 2012. [Google Scholar]
  19. Intergovernmental Panel on Climate Change. Climate Change 2014: Synthesis Report. Contribution of Working Groups I, II and III to the Fifth Assessment Report of the Intergovernamental Panel on Climate Change; Intergovernmental Panel on Climate Change: Geneva, Switzerland, 2014; p. 151. [Google Scholar]
  20. Guha-Sapir, D.; Hoyois, P.; Below, R. Annual Disaster Statistical Review 2013. The Numbers and Trends; Centre for Research on the Epidemiology of Disasters: Brussels, Belgium, 2014. [Google Scholar]
  21. United Nations. Global Sustainable Development Report 2016; Departament of Economic and Social Affairs: New York, NY, USA, 2016. [Google Scholar]
  22. CLICOM. Base de datos Climatológica Nacional. Servicio Meteorológico Nacional & Centro de Investigación Científica y de Eduación Superior de Ensenada. Available online: http://clicom-mex.cicese.mx/ (accessed on 22 June 2016).
  23. McCabe, G.J.; Wolock, D.M. Climate change and the detection of trends in annual runoff. Clim. Res. 1997, 8, 129–134. [Google Scholar] [CrossRef]
  24. Santos, J.; Leite, S. Long-term variability of temperature time series recorded in Lisbon. J. Appl. Stat. 2009, 36, 323–337. [Google Scholar] [CrossRef]
  25. Yaseen, M.; Rientjes, T.; Nabi, G.; Rehman, H.U.; Latif, M. Assessment of recent temperature trends in Mangla watershed. J. Himal. Earth Sci. 2014, 47, 107–121. [Google Scholar]
  26. He, Y.-L.; Zhang, Y.-P.; Wu, Z.-J. Analysis of climate variability in the Jinsha river valley. J. Trop. Meteorol. 2016, 22, 243–251. [Google Scholar]
  27. The Centre for Australian Weather and Climate Research. Defining Heatwaves: Heatwave Defined as a Heat-Impact Event Servicing All Community and Business Sectors in Australia; Bureau of Meteorology, Australian Government: Melbourne, Australia, 2013.
  28. Robinson, P.J. On the definition of a heat wave. J. Appl. Meteorol. 2001, 40, 762–774. [Google Scholar] [CrossRef]
  29. Li, G. U.S. Heatwave Analysis. Exploring Different Paramaeters to Classify Extreme Heat Events; National Oceanic and Atmospheric Administration: Washington, DC, USA, 2016.
  30. Met Office. Met Office Heat-health Watch. Met Office United Kingdom, 2016. Available online: http://www.metoffice.gov.uk/public/weather/heat-health/#?tab=heatHealth (accessed on 18 August 2016).
  31. National Oceanic and Atmospheric Administration. The Heat Index Equation. NOAA Weather Prediction Center. Available online: http://www.wpc.ncep.noaa.gov/html/heatindex_equation.shtml (accessed on 15 December 2016).
  32. Kent, S.T.; McClour, L.A.; Zaitchik, B.F.; Smith, T.T.; Gohlke, J.M. Heath waves and health outcomes in Alabama (USA); The importance of heat wave definition. Environ. Health Perspect. 2104, 122, 151–158. [Google Scholar]
  33. Anderson, G.B.; Bell, M.L. Heat waves in the United States; Mortality risk during heat waves and effect modification by heat waves characteristics in 43 U.S. Communities. Environ. Health Perspect. 2011, 119, 210–218. [Google Scholar] [CrossRef] [PubMed]
  34. Matías-Ramírez, L.G. Actualización del Indice de Riesgo por Ondas de Calor en México (Mexico’s Heat Waves Risk Index Actualization); Centro Nacional de Prevención de Desastres: Pedregal de Santo Domingo, Mexico, 2014. [Google Scholar]
  35. Intergovernmental Panel on Climate Change. Managing the Risks of Extreme Events and Disasters to Advance Climate Change Adaptation; Field, C., Barros, V., Stocker, T.F., Dahe, Q., Eds.; Cambdrige Univeristy Press: Cambdrige, UK, 2012. [Google Scholar]
  36. Degu, M.; Hossain, F.; Nigoyi, D.; Sr, R.P.; Shepered, M.J.; Voisin, N.; Chronis, T. The influence of large dams on surrounding climate and precipitation patterns. Geophys. Res. Lett. 2011, 38, L04405. [Google Scholar] [CrossRef]
  37. Hossain, F.; Jeyachandran, I.; Pielke, R. Have large dams altered extreme precipitation patterns? EOS 2009, 90, 453–454. [Google Scholar] [CrossRef]
  38. Bulut, H.; Yesilata, B.; Yesilnacar, M.I. Trend analysis for examining the interaction between the Atatürk Dam Lake and its local climate. Int. J. Nat. Eng. Sci. 2008, 2, 115–123. [Google Scholar]
  39. Bureau of Public Health Statistics Arizona. Trends in Morbidity and Mortality from Exposure to Excessive Natural Heat in Arizona. 2012 report; Arizona Department of Health Services: Phoenix, AZ, USA, 2013.
  40. Mrela, C.; Torres, C. Deaths from Exposure to excessive Natural Heat Occurring in Arizona, 1992–2009; Arizona Department of Health Services: Phoenix, AZ, USA, 2010.
Figure 1. Koppen-Geiger climatic map of North America. (Image by Peel, M. C., Finlayson, B. L., and McMahon, T. A. (University of Melbourne) (CC BY-SA 3.0 (http://creativecommons.org/licenses/by-sa/3.0)), via Wikimedia Commons).
Atmosphere 08 00053 g001
Figure 2. Maximum monthly temperature variations and linear trend lines for August.
Atmosphere 08 00053 g002
Figure 3. Maximum monthly temperature variations and linear trend lines for September.
Atmosphere 08 00053 g003
Figure 4. Number of days that exceeded the 90th percentile of average maximum temperatures threshold in August.
Atmosphere 08 00053 g004
Figure 5. Maximum temperature and mortality rate (per 10,000 inhabitants) during August in Maricopa County (2004 to 2015).
Atmosphere 08 00053 g005
Figure 6. Relationship between mortality rate and max temperatures during August in Maricopa County (2004 to 2015).
Atmosphere 08 00053 g006
Figure 7. Mortality rate per 10,000 inhabitants and maximum monthly temperature in Mexicali during August (1990 to 2010).
Atmosphere 08 00053 g007
Figure 8. Mortality rate (per 10,000 inhabitants) versus maximum temperature during August in Mexicali (1990 to 2010).
Atmosphere 08 00053 g008
Figure 9. Mortality rate by 10,000 inhabitants for July (a), August (b), and September (c), 1990–2010 in Mexicali, Mexico.
Atmosphere 08 00053 g009
Table 1. Results of Spearman’s rho test for August at a significance level of α = 0.05.
CityMaximum TemperaturesAverage Temperatures
ZSRt(n − 2, 1 − (α/2))TrendZSRt(n − 2, 1 − (α/2))Trend
Obregon City5.8772.001Increase3.502.009Decrease
Morelos Dam5.2842.018Increase0.9062.018No trend
Mexicali4.8092.009Increase2.2942.009Decrease
Las Vegas1.0882.009No trend4.7932.009Increase
Phoenix2.7212.009Increase6.2112.009Increase
Tucson3.3902.009Increase3.4072.009Increase
Table 2. Results of Spearman’s rho test for September at a significance level of α = 0.05.
CityMaximum TemperaturesAverage Temperatures
ZSRt(n − 2, 1 − (α/2))TrendZSRt(n − 2, 1 − (α/2))Trend
Obregon City5.8772.001Increase3.502.009Decrease
Morelos Dam5.2842.018Increase0.7862.018No trend
Mexicali4.8092.009Increase1.1012.009No trend
Las Vegas1.0882.009No trend4.4462.009Increase
Phoenix2.7212.009Increase7.5282.009Increase
Tucson3.3902.009Increase4.042.009Increase

