
Use of Combined Observational- and Model-Derived Photochemical Indicators to Assess the O3-NOx-VOC System Sensitivity in Urban Areas


Abstract
:1. Introduction
2. Methods
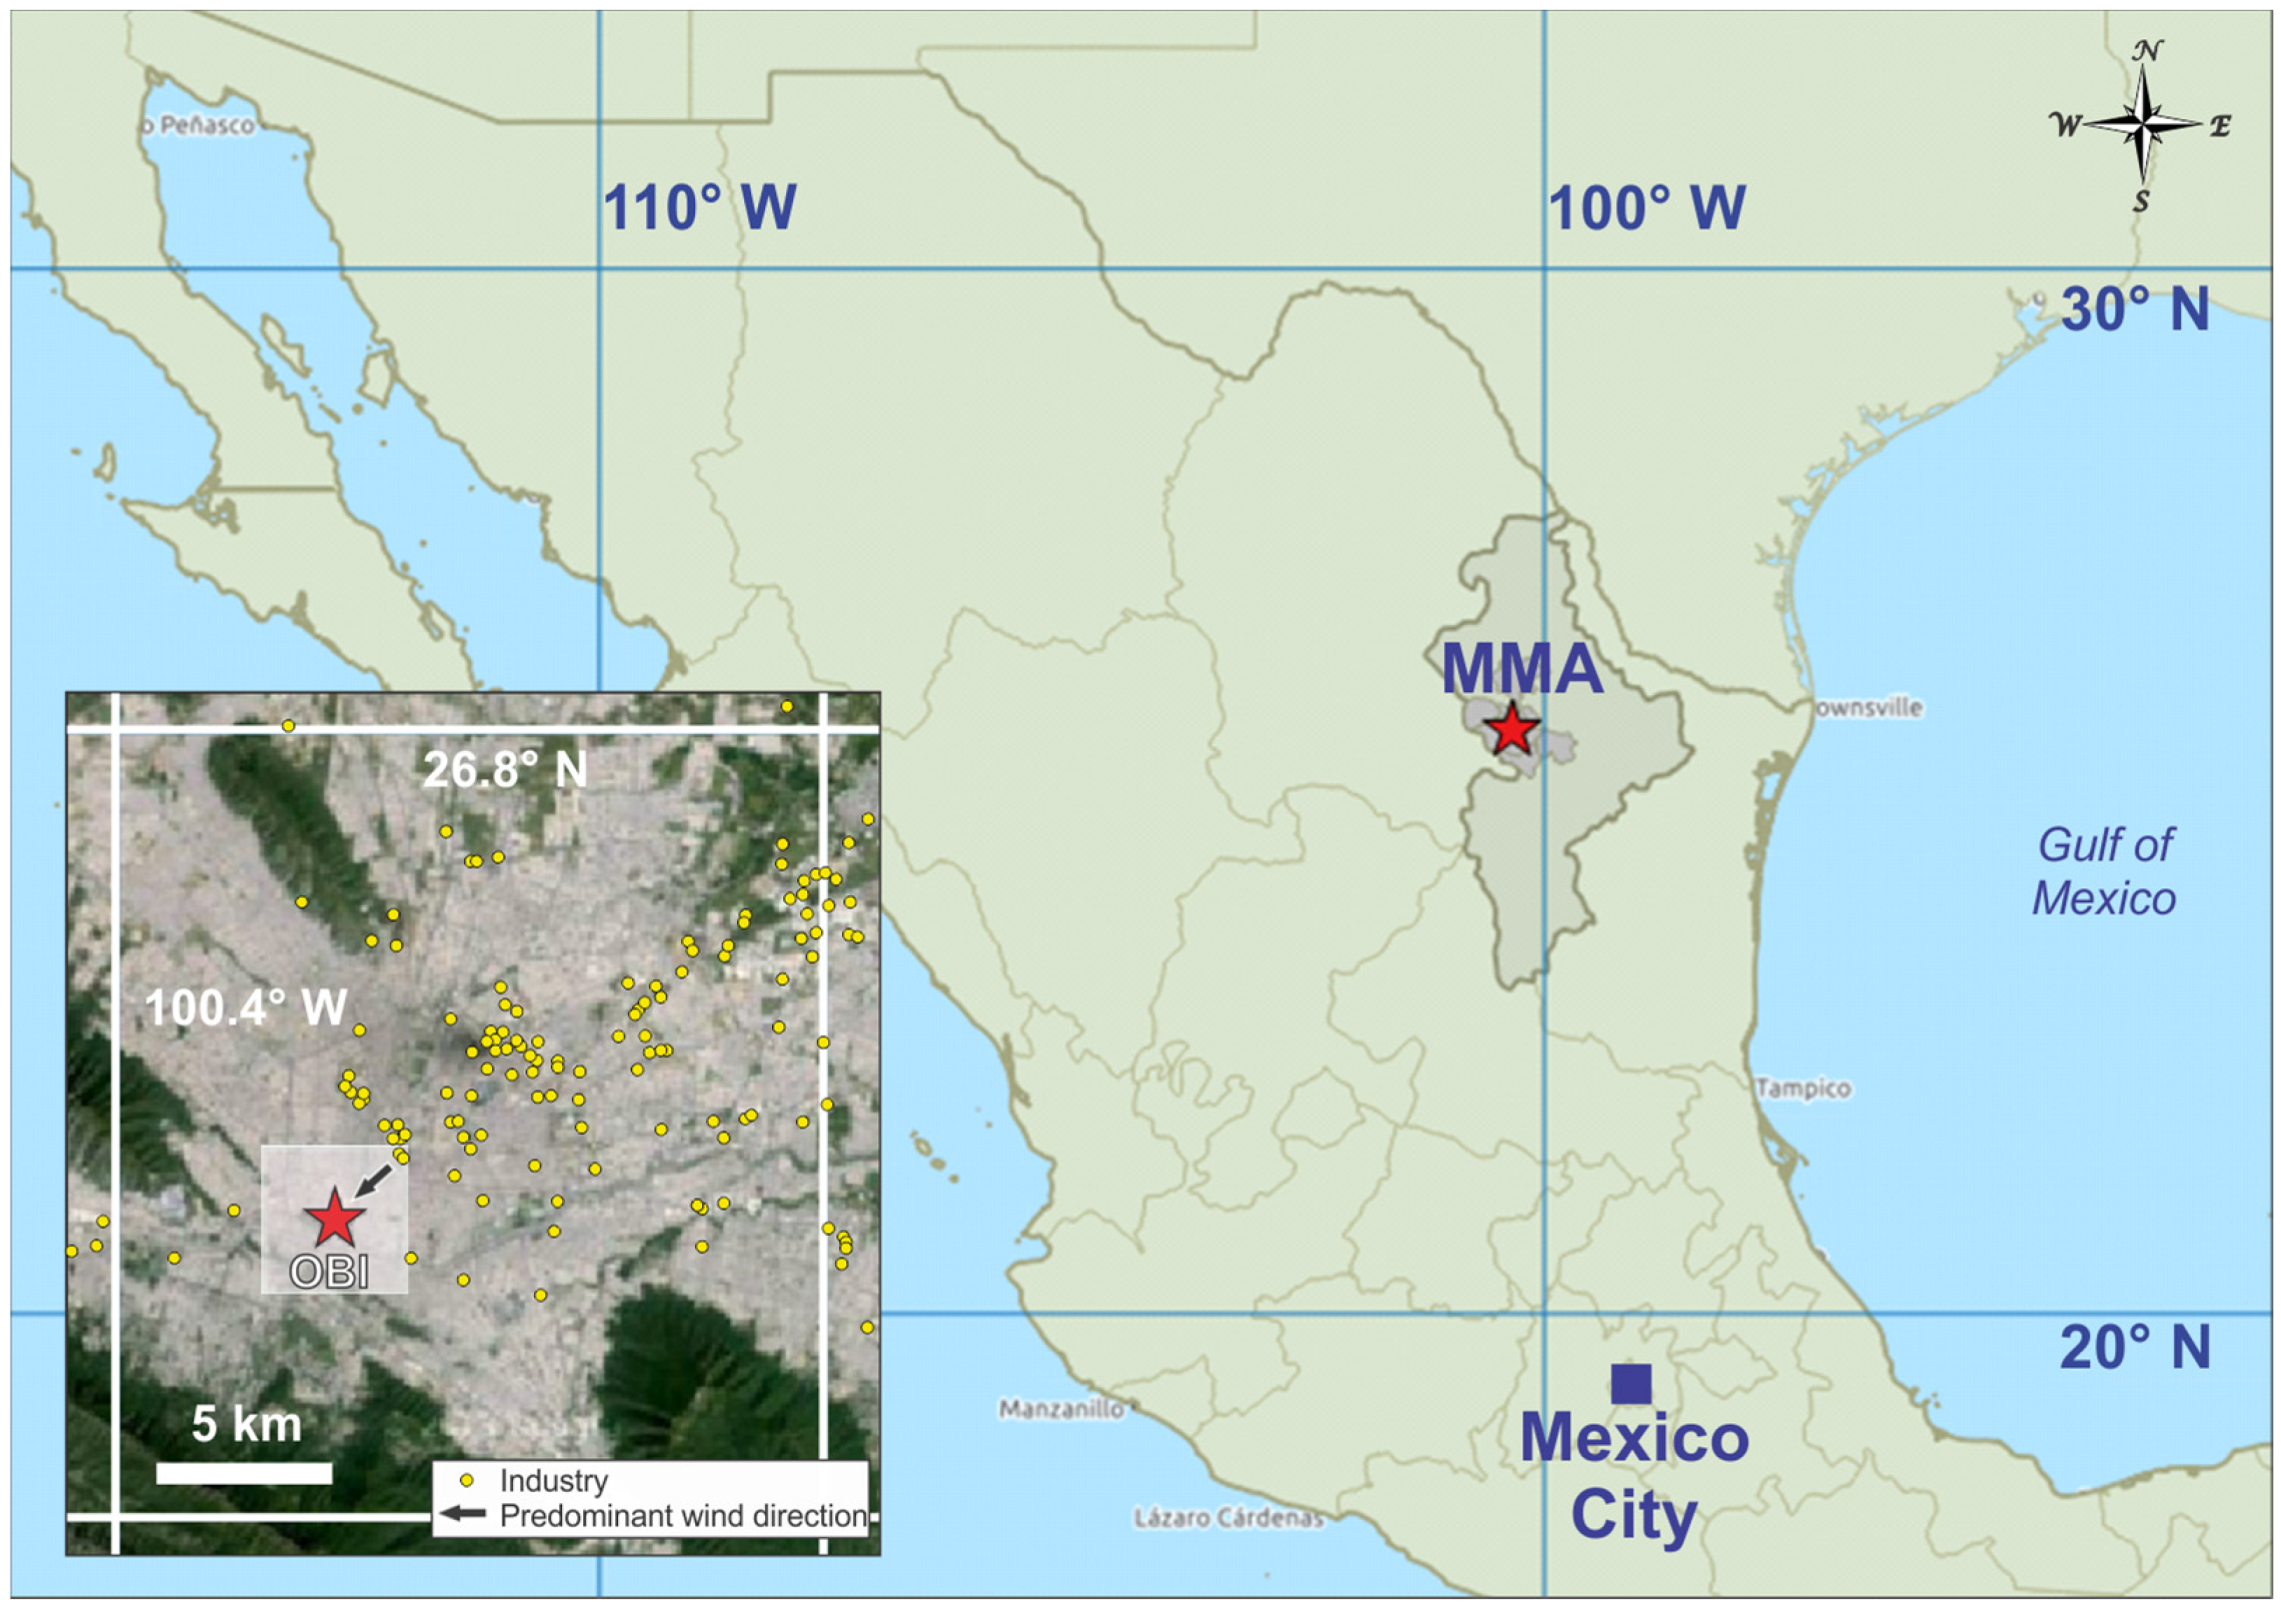
2.1. Study Site Description and Air Pollutant Monitoring
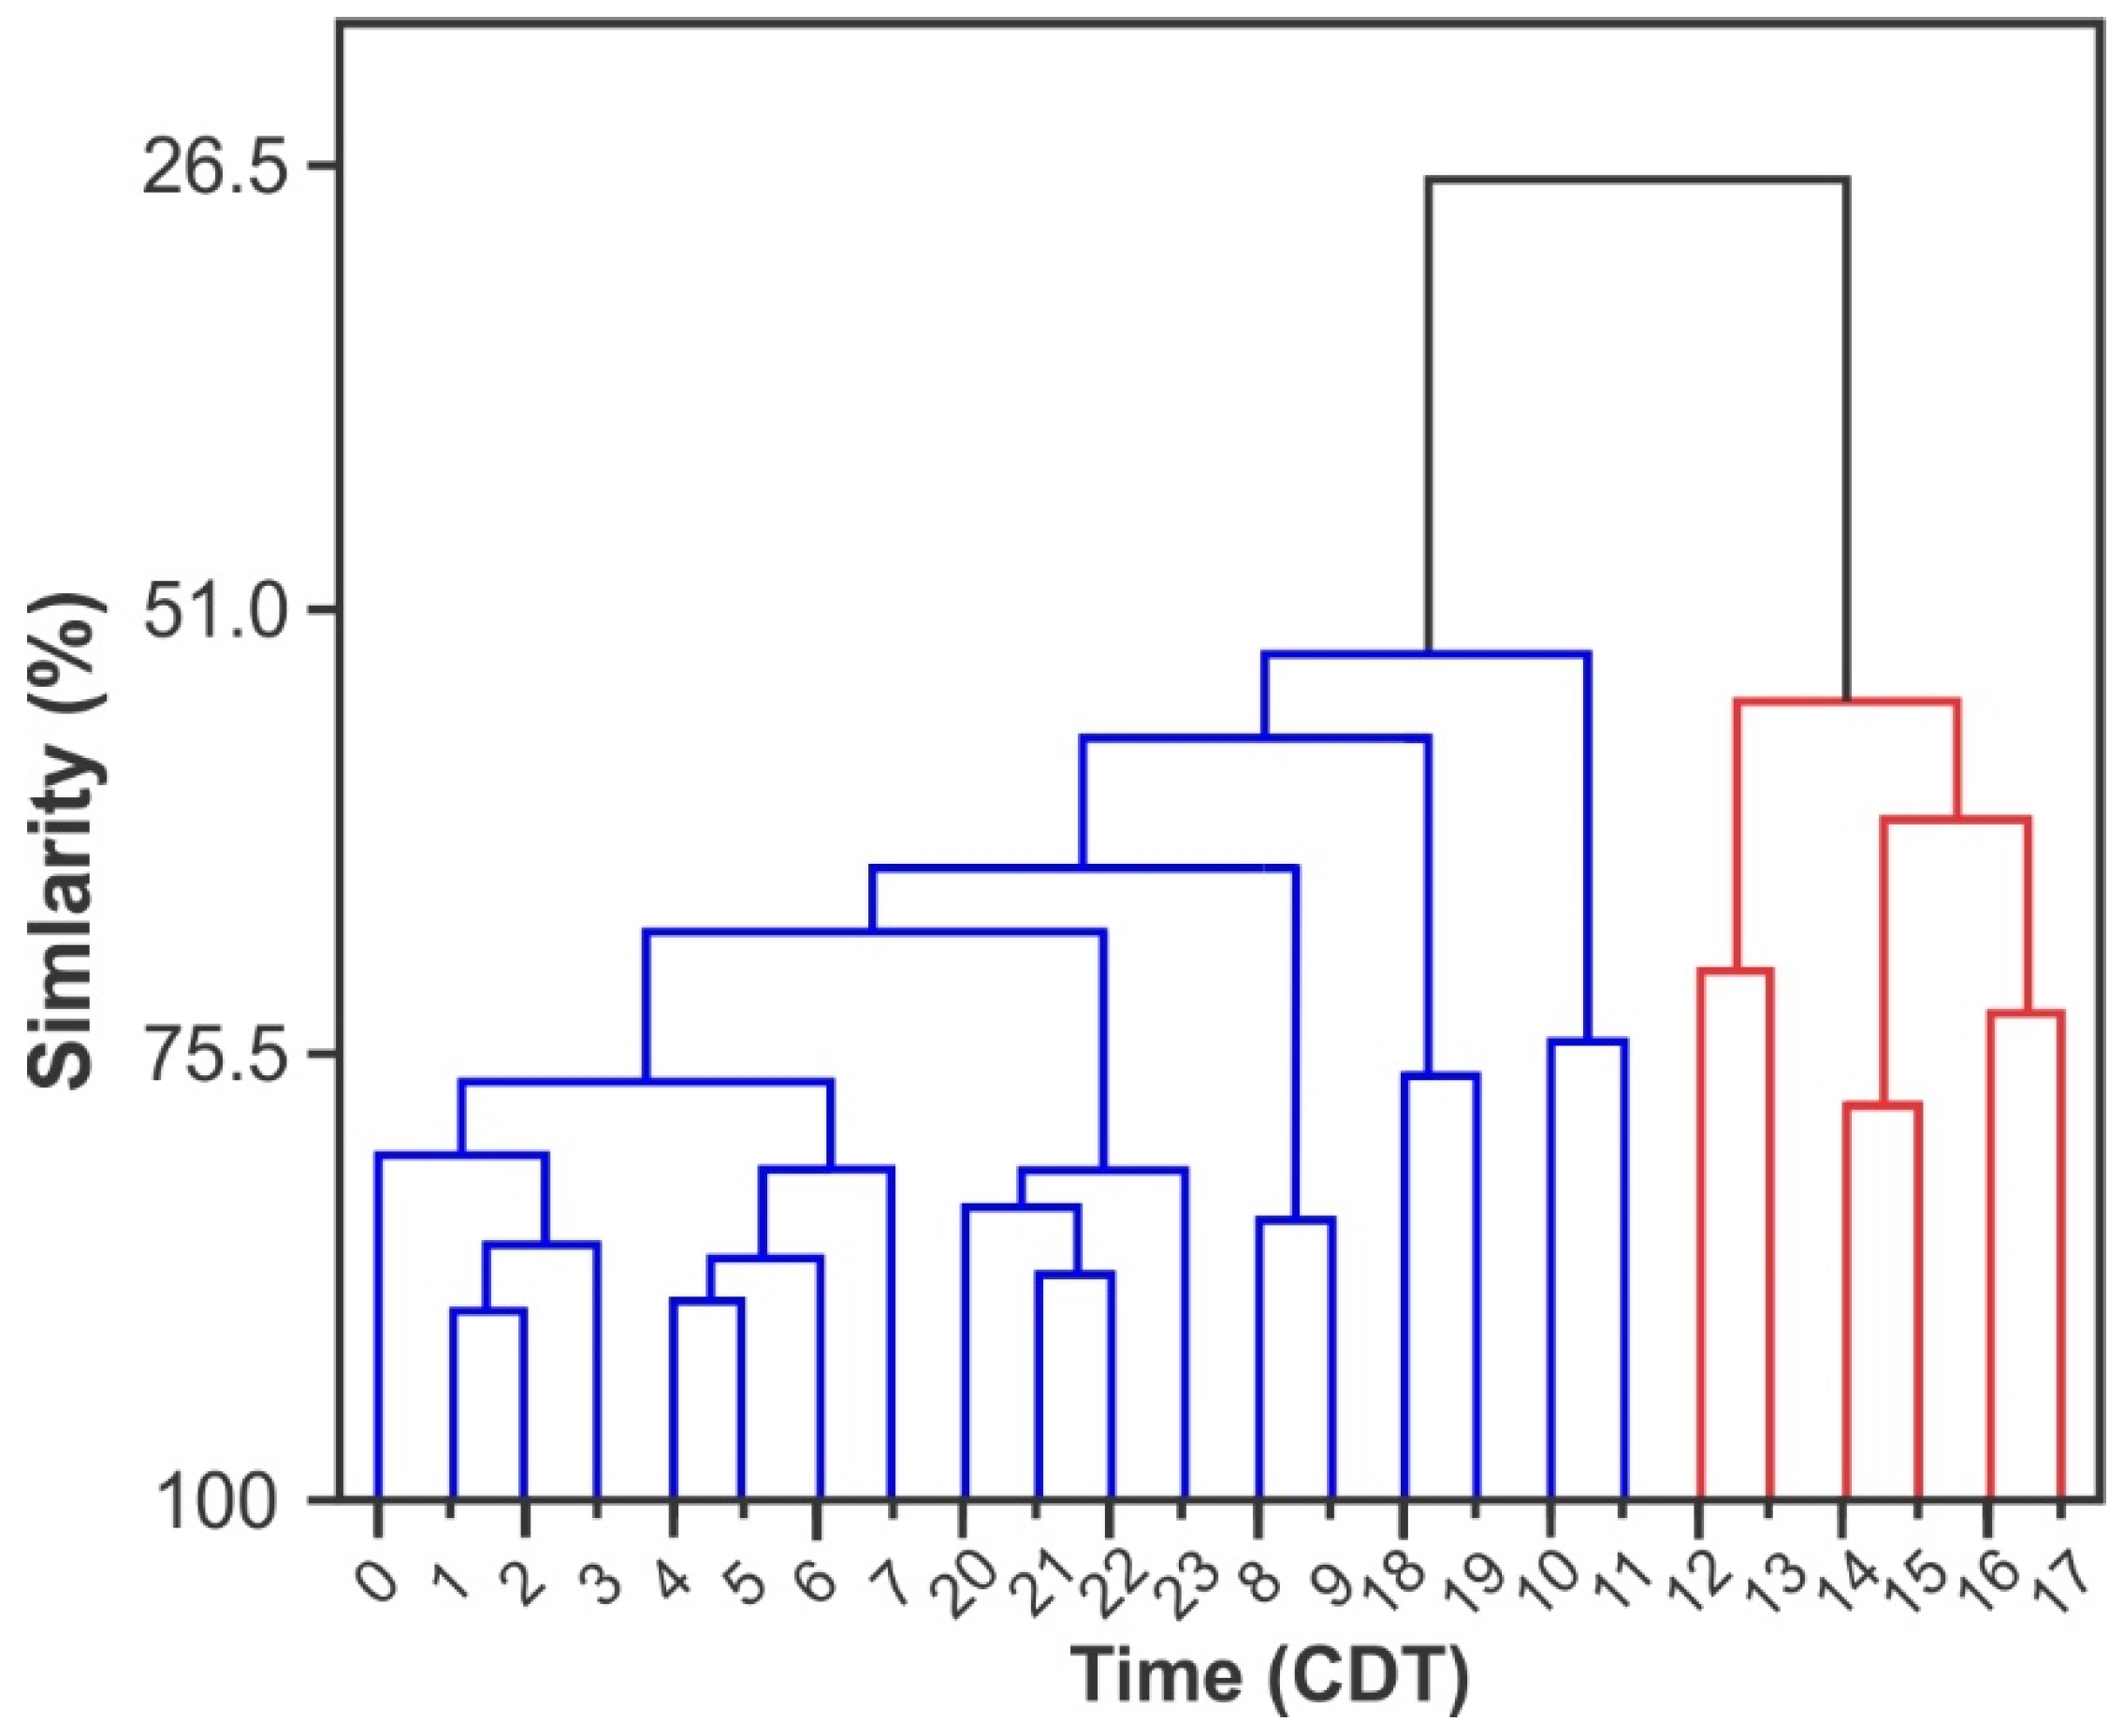
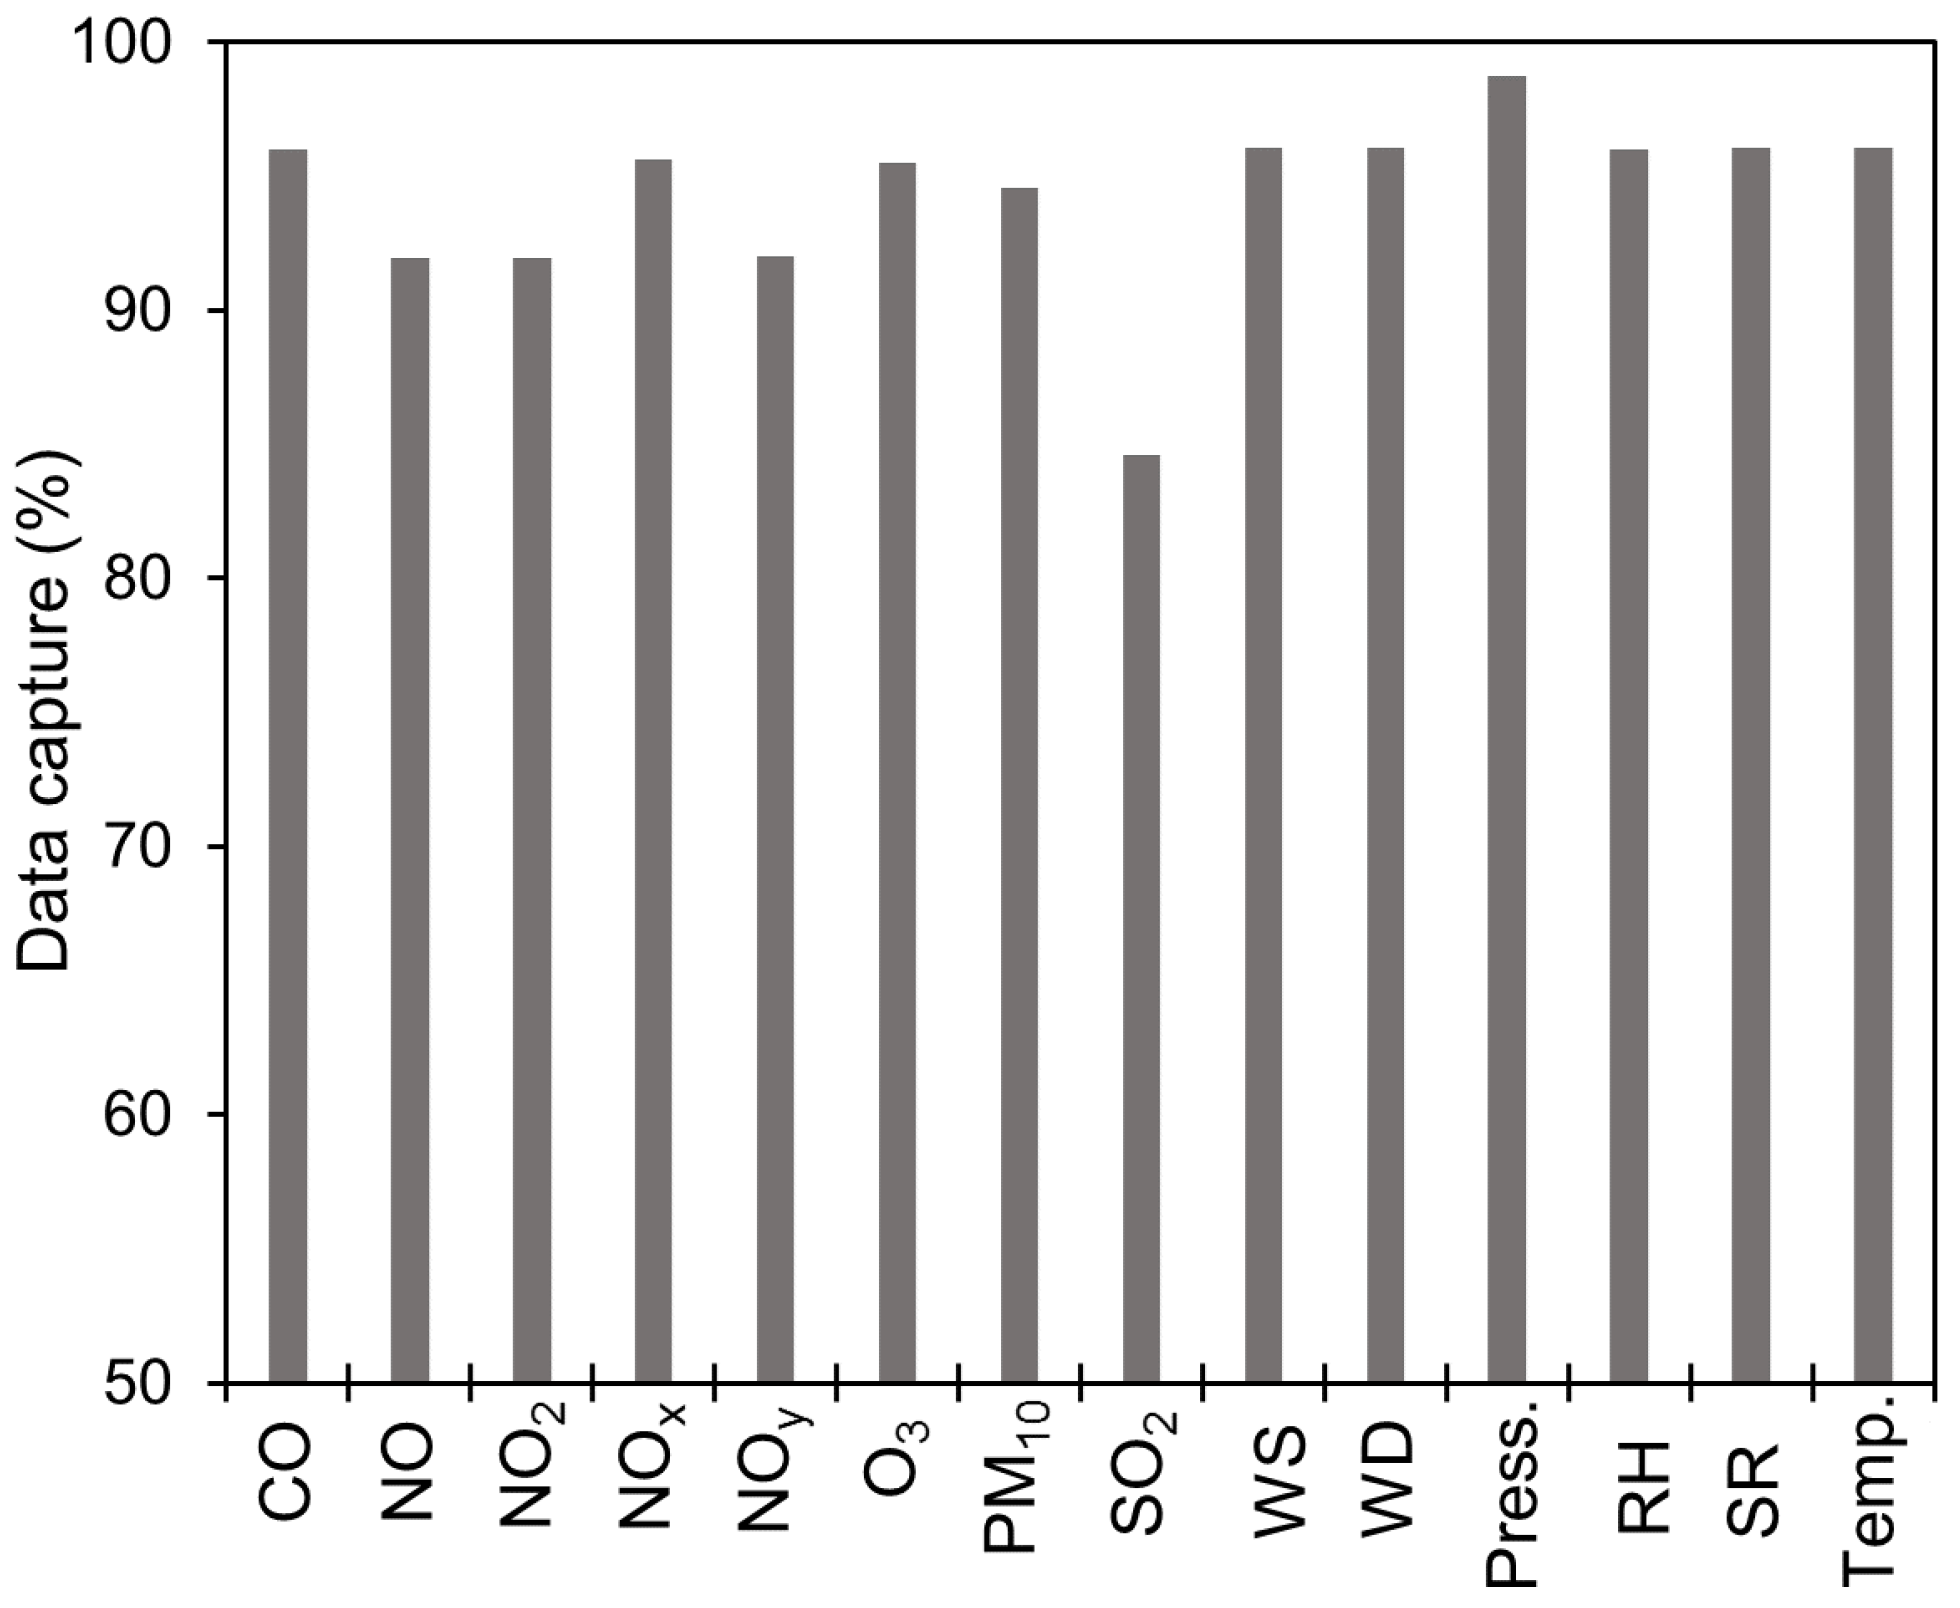
2.2. Capture Rate and Seasonal and Wind Sector Analyses
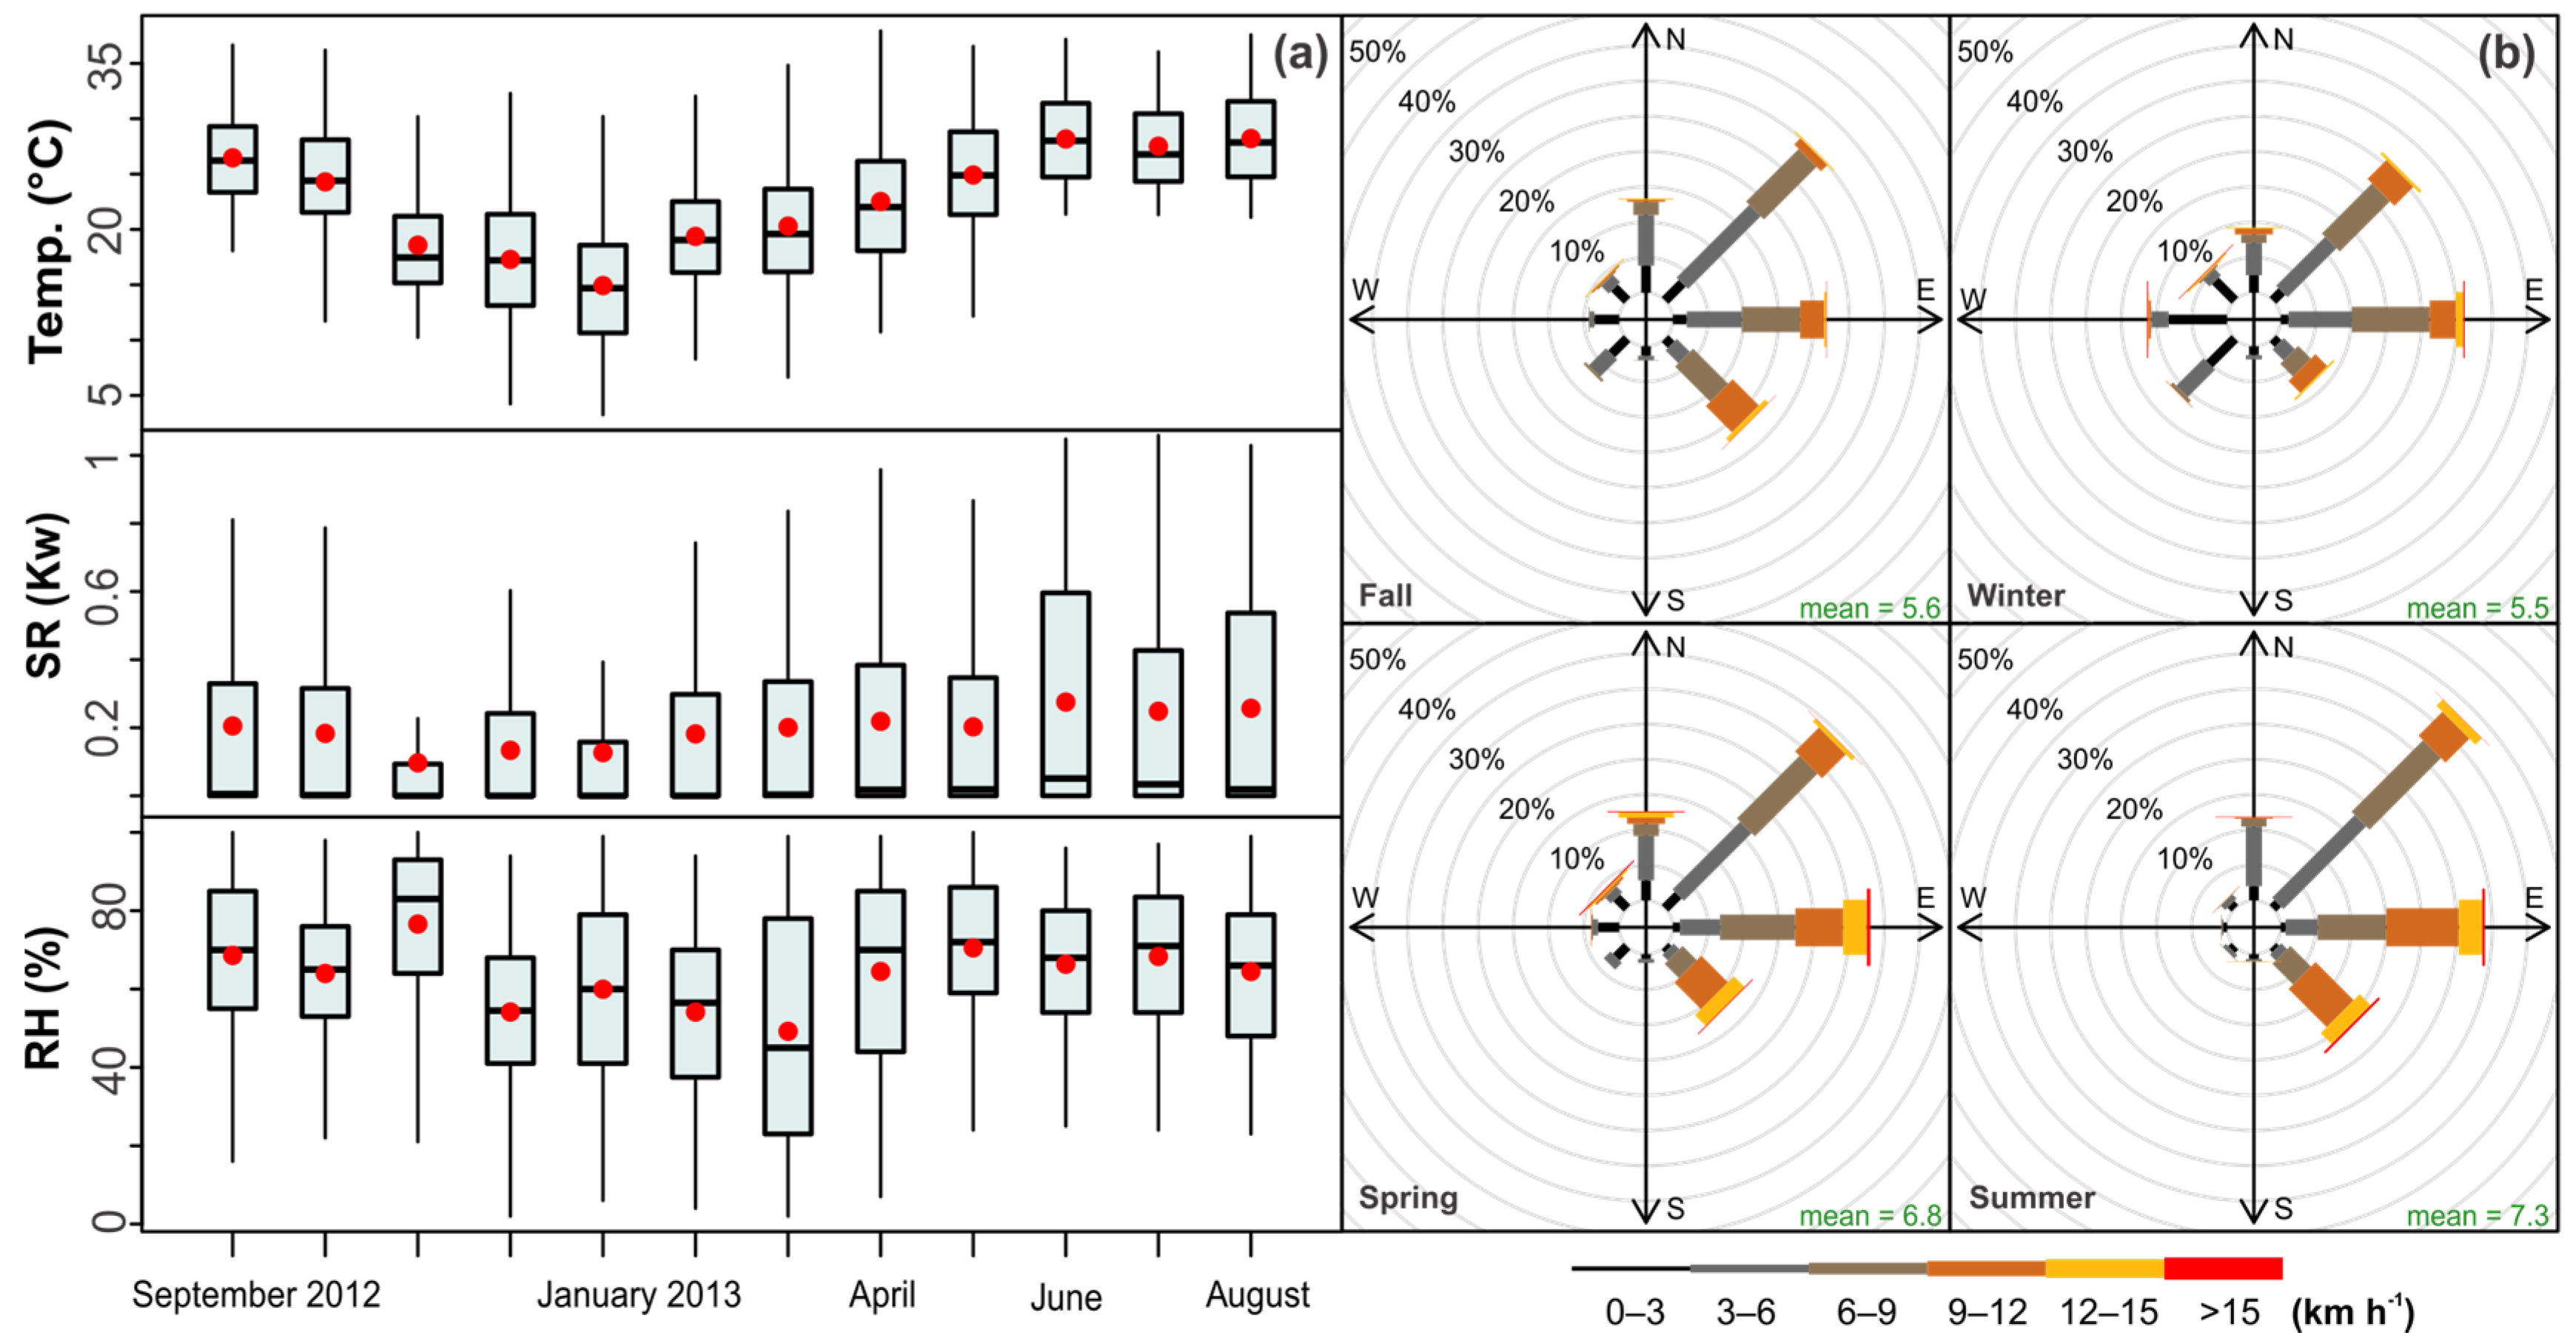
2.3. Meteorology at the MMA
2.4. Statistical Analyses
2.5. Box Model Description and Simulations
3. Results and Discussion
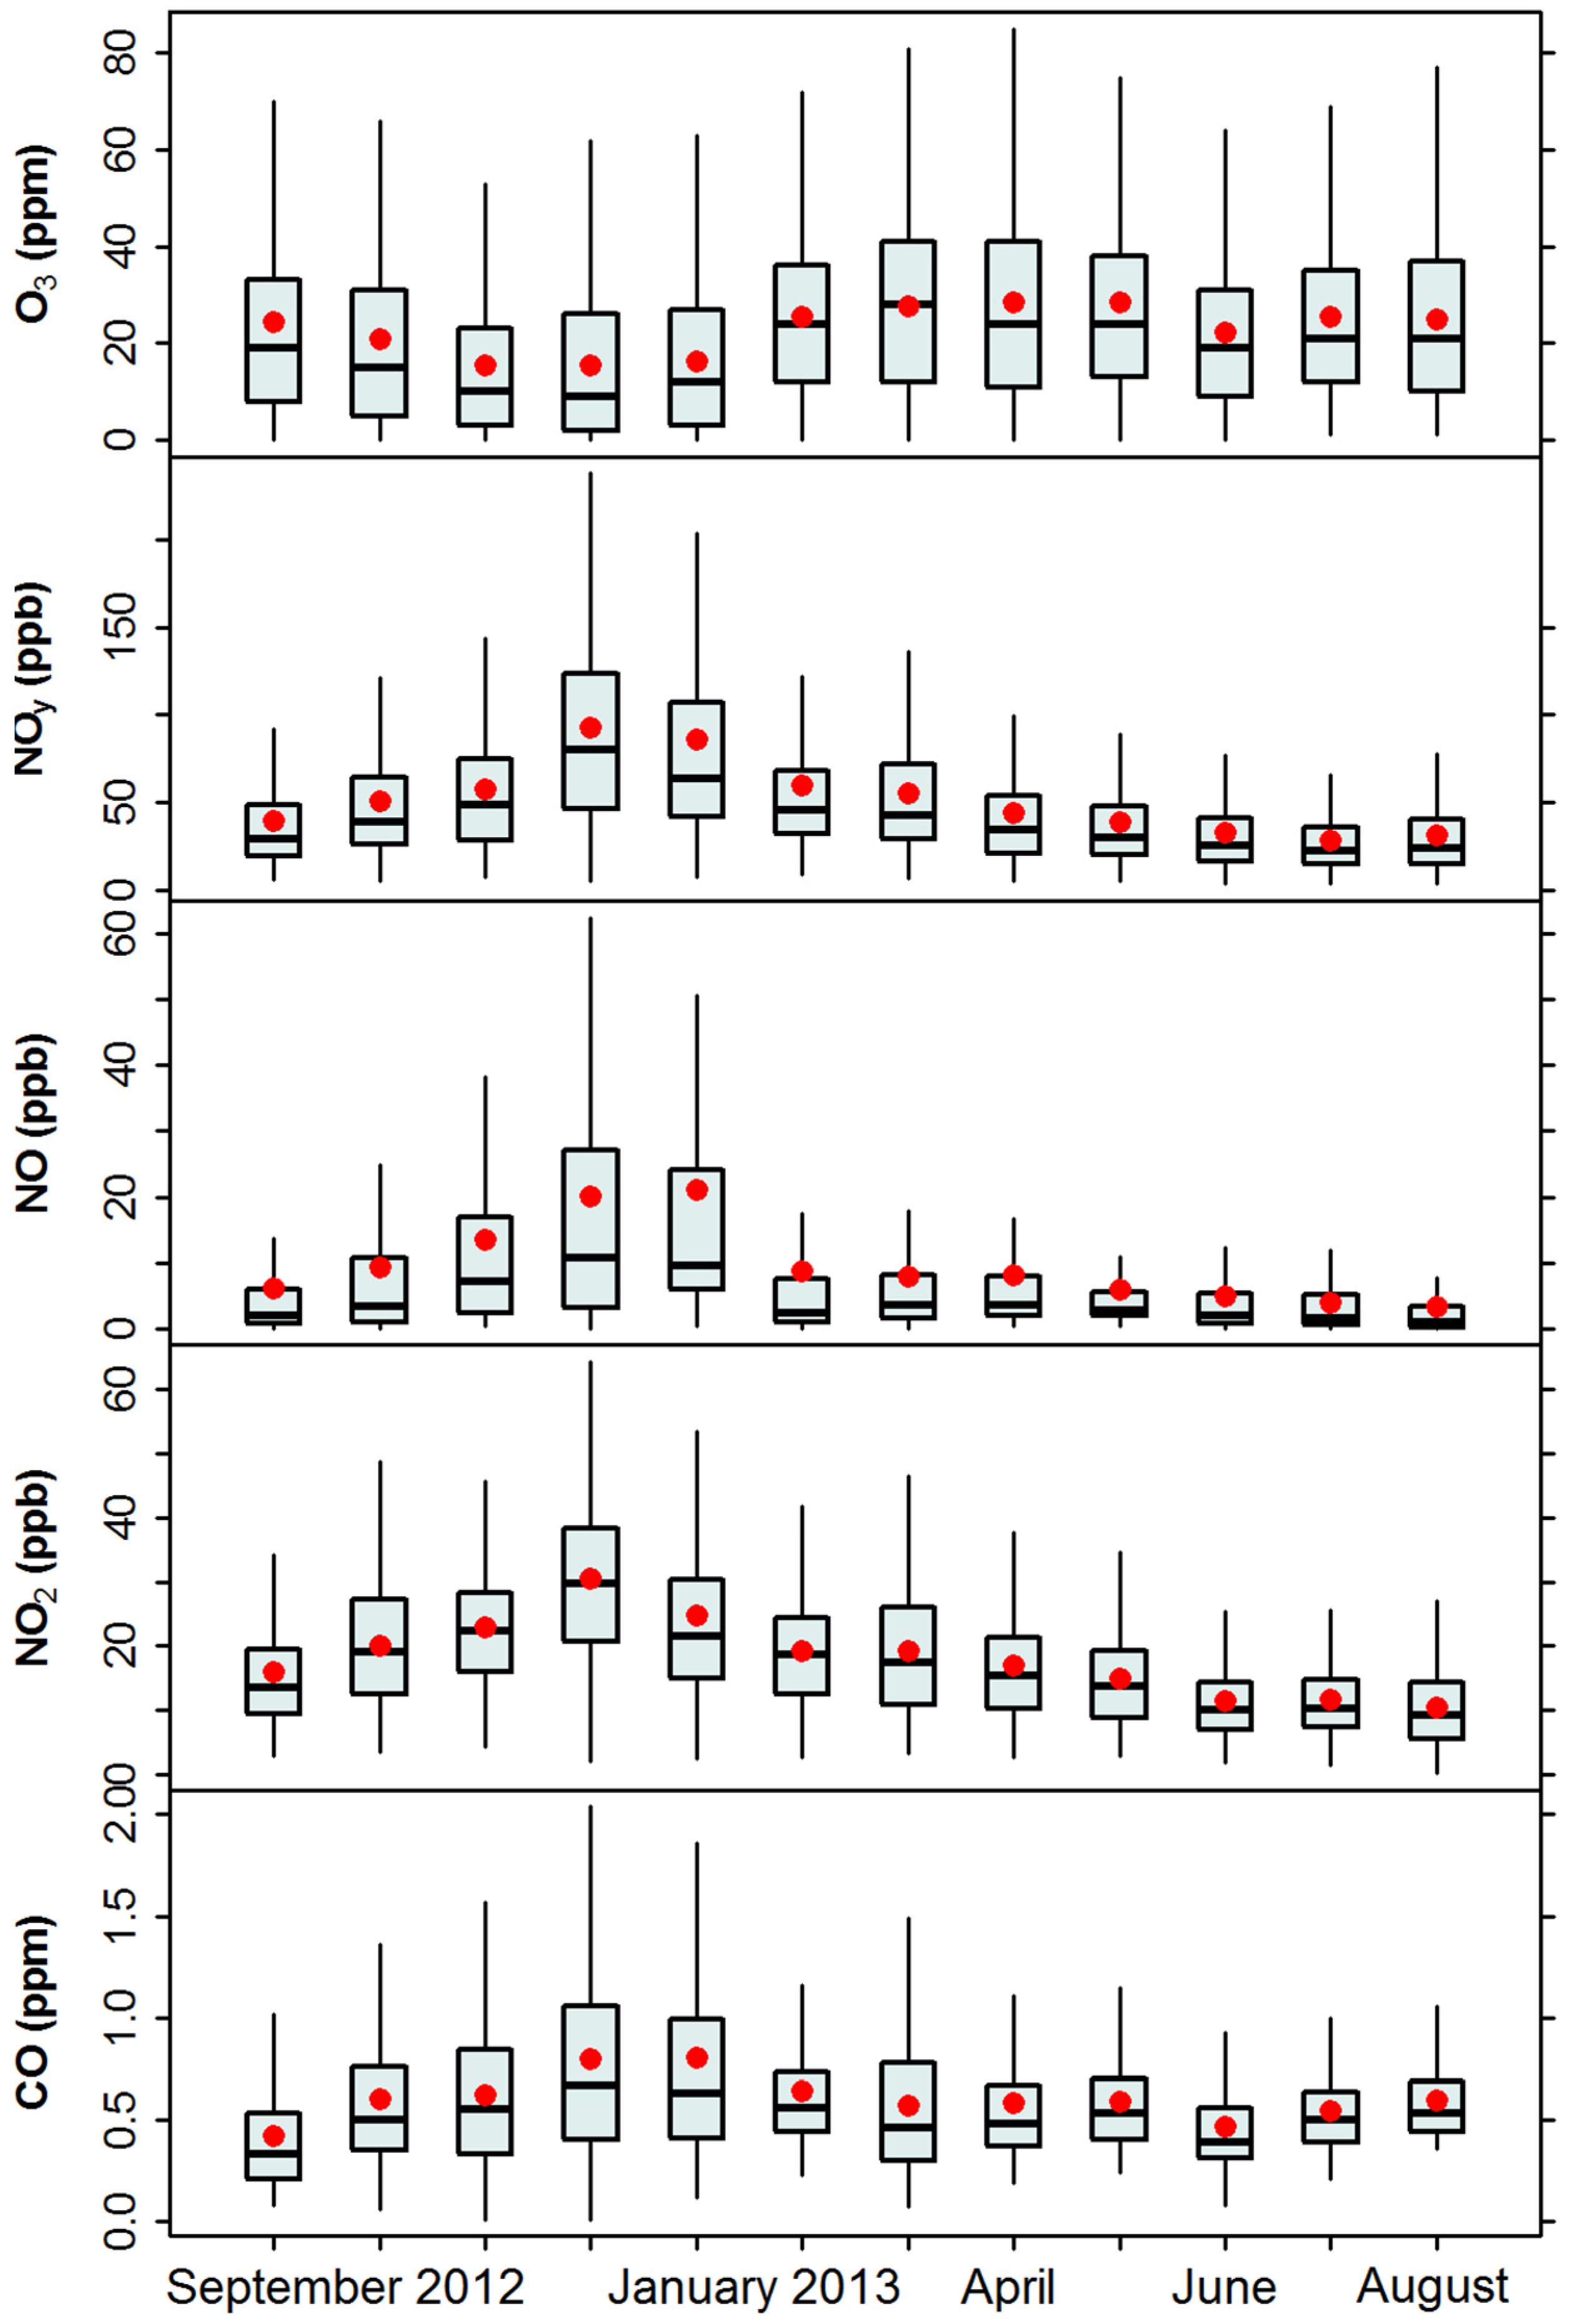
3.1. Air Pollutants Annual Profiles
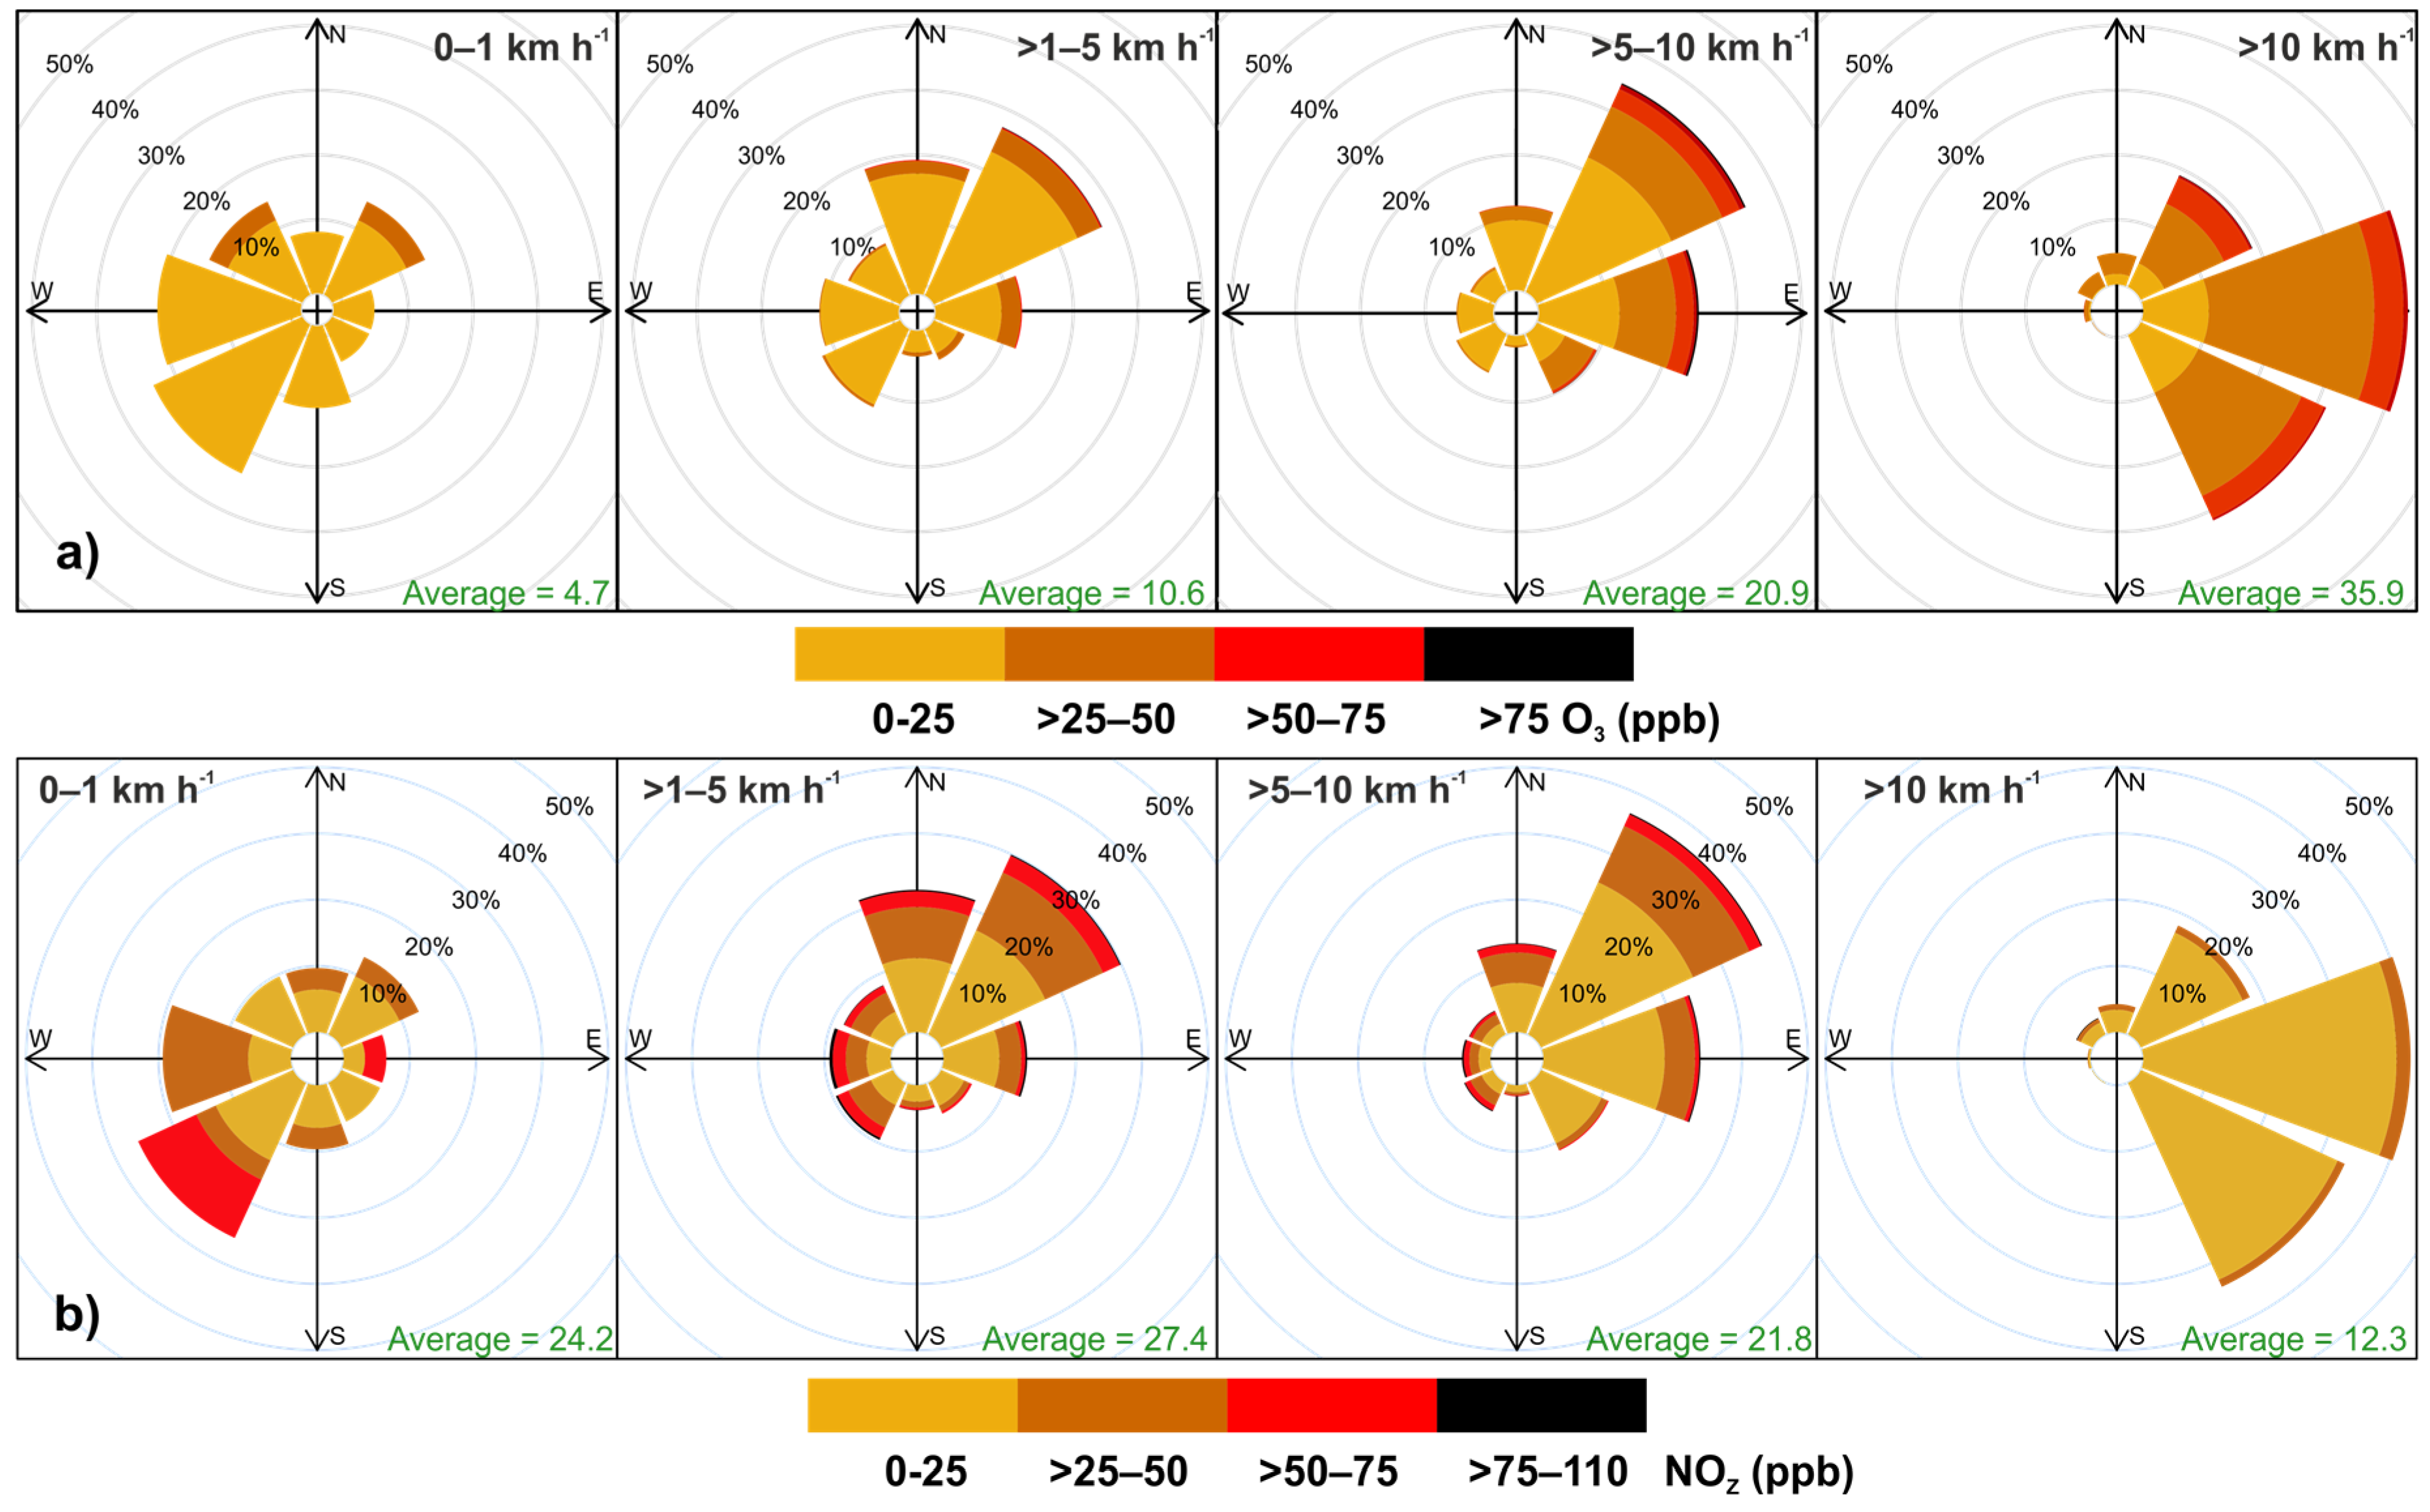
3.2. Wind Sector Analysis
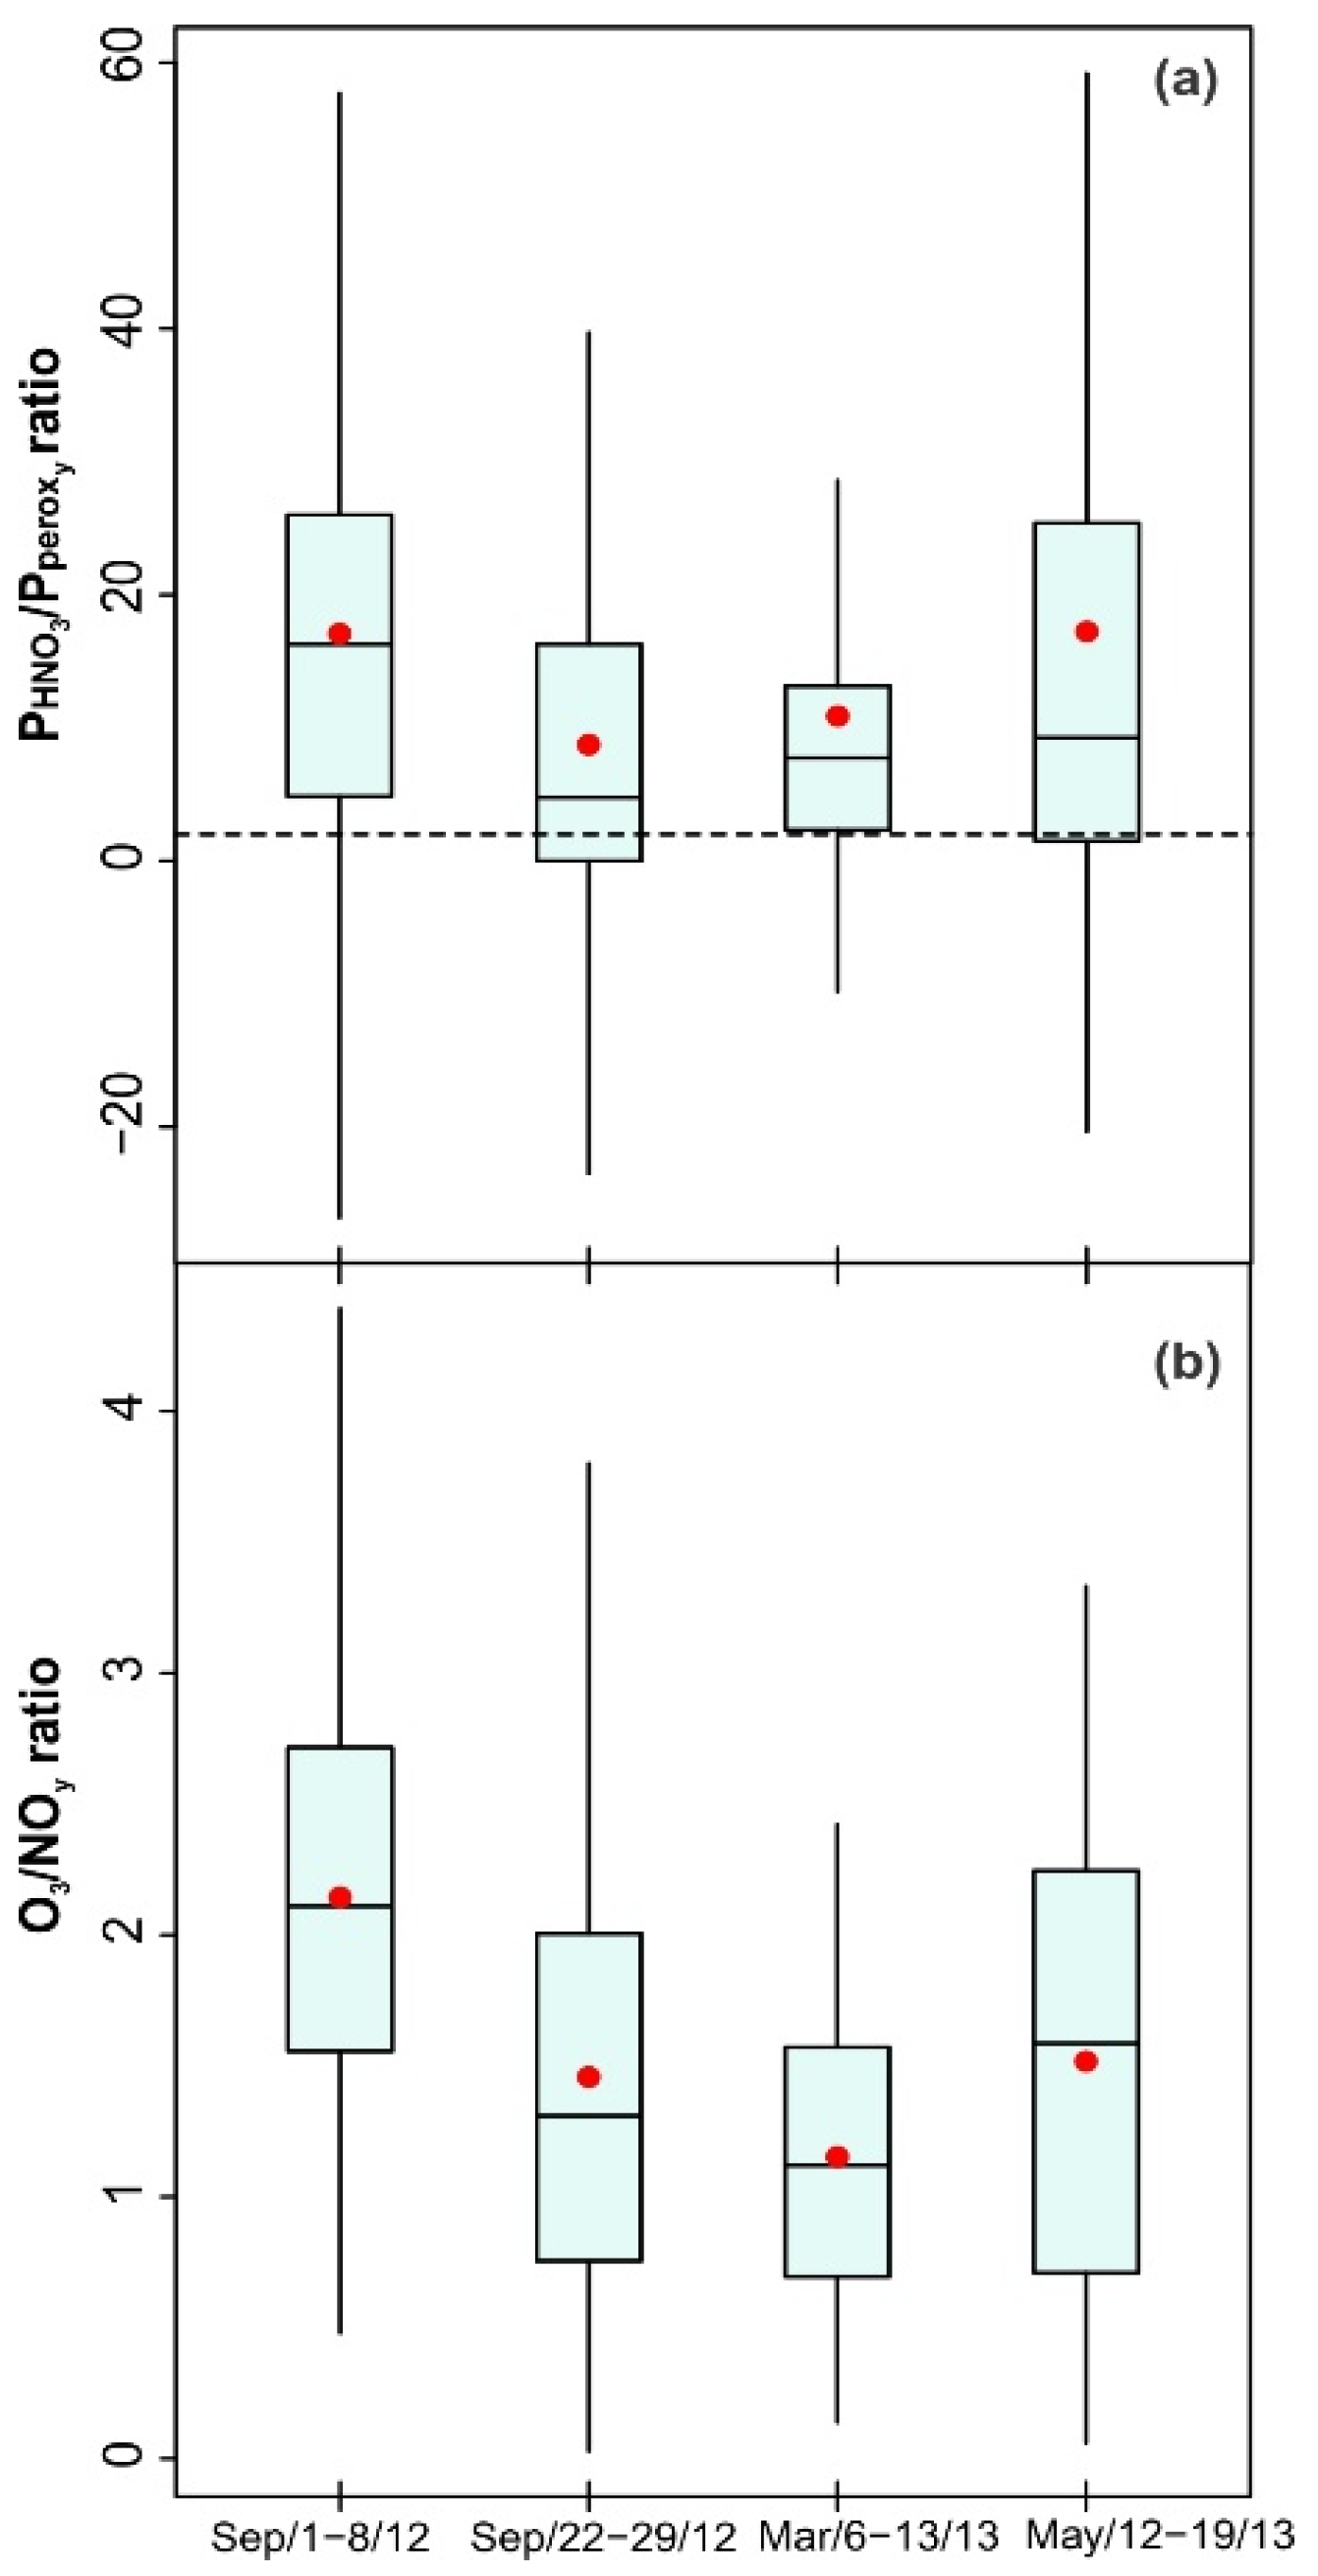
3.3. The Enhanced Photochemical Period
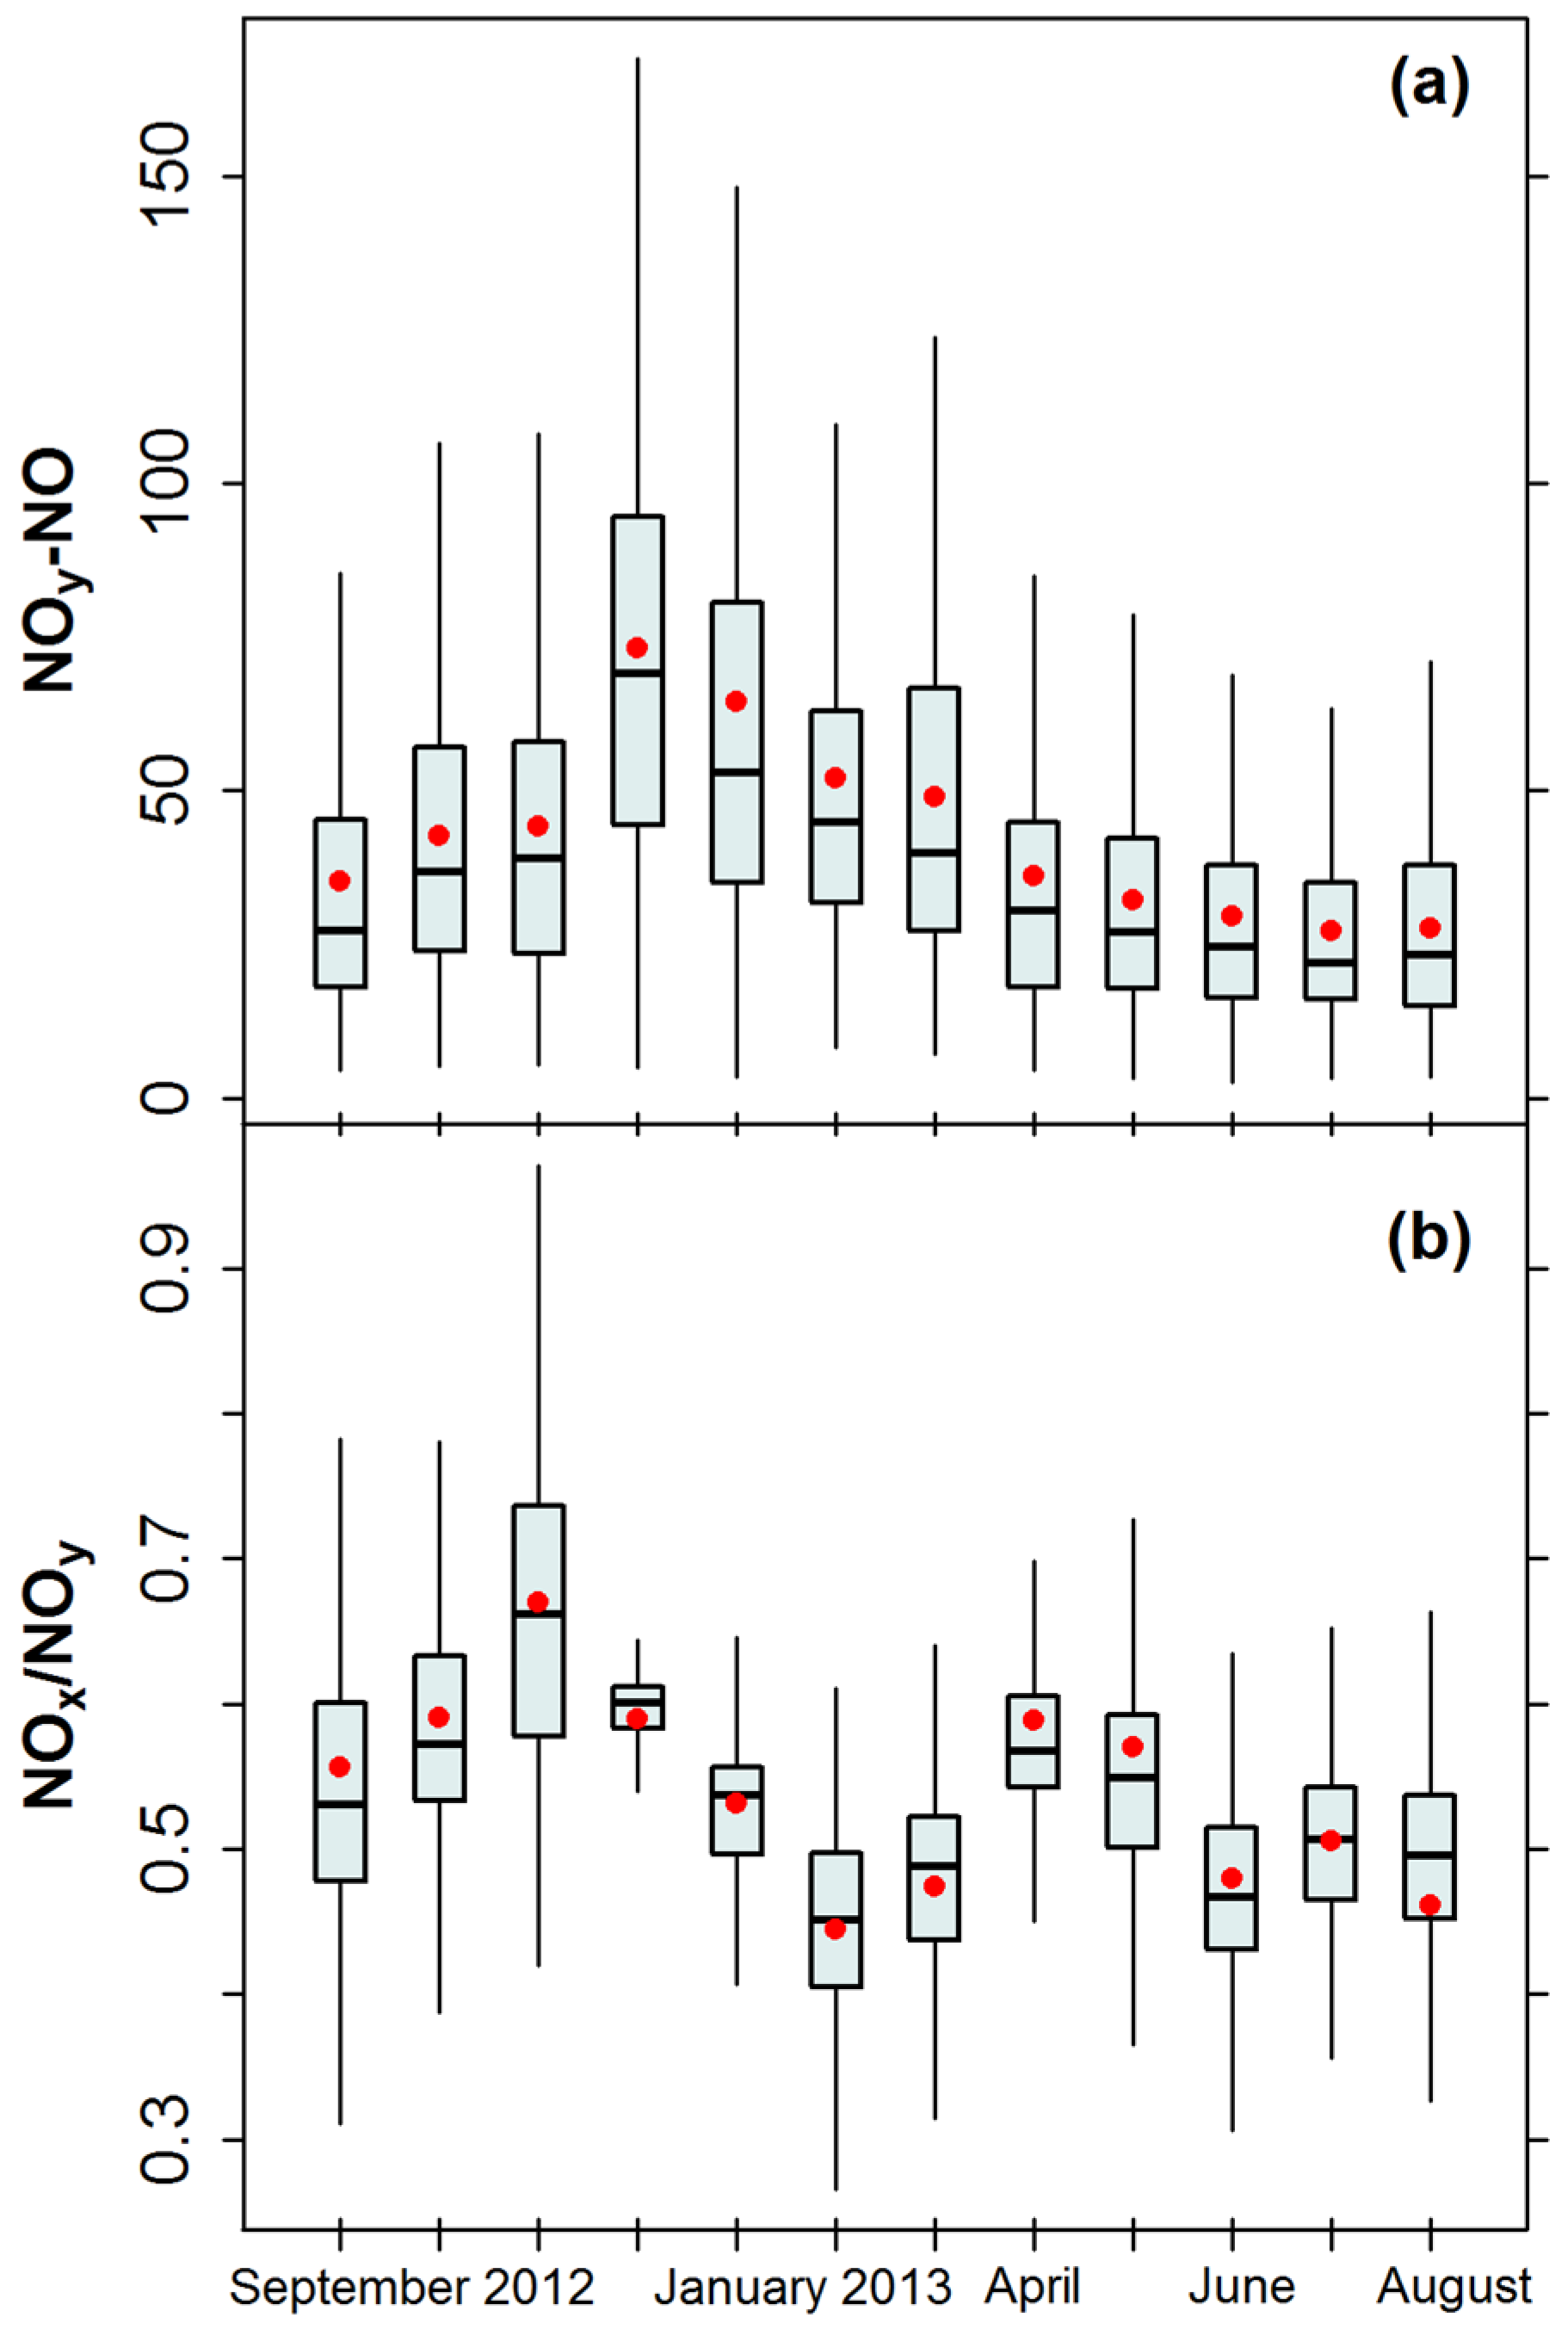
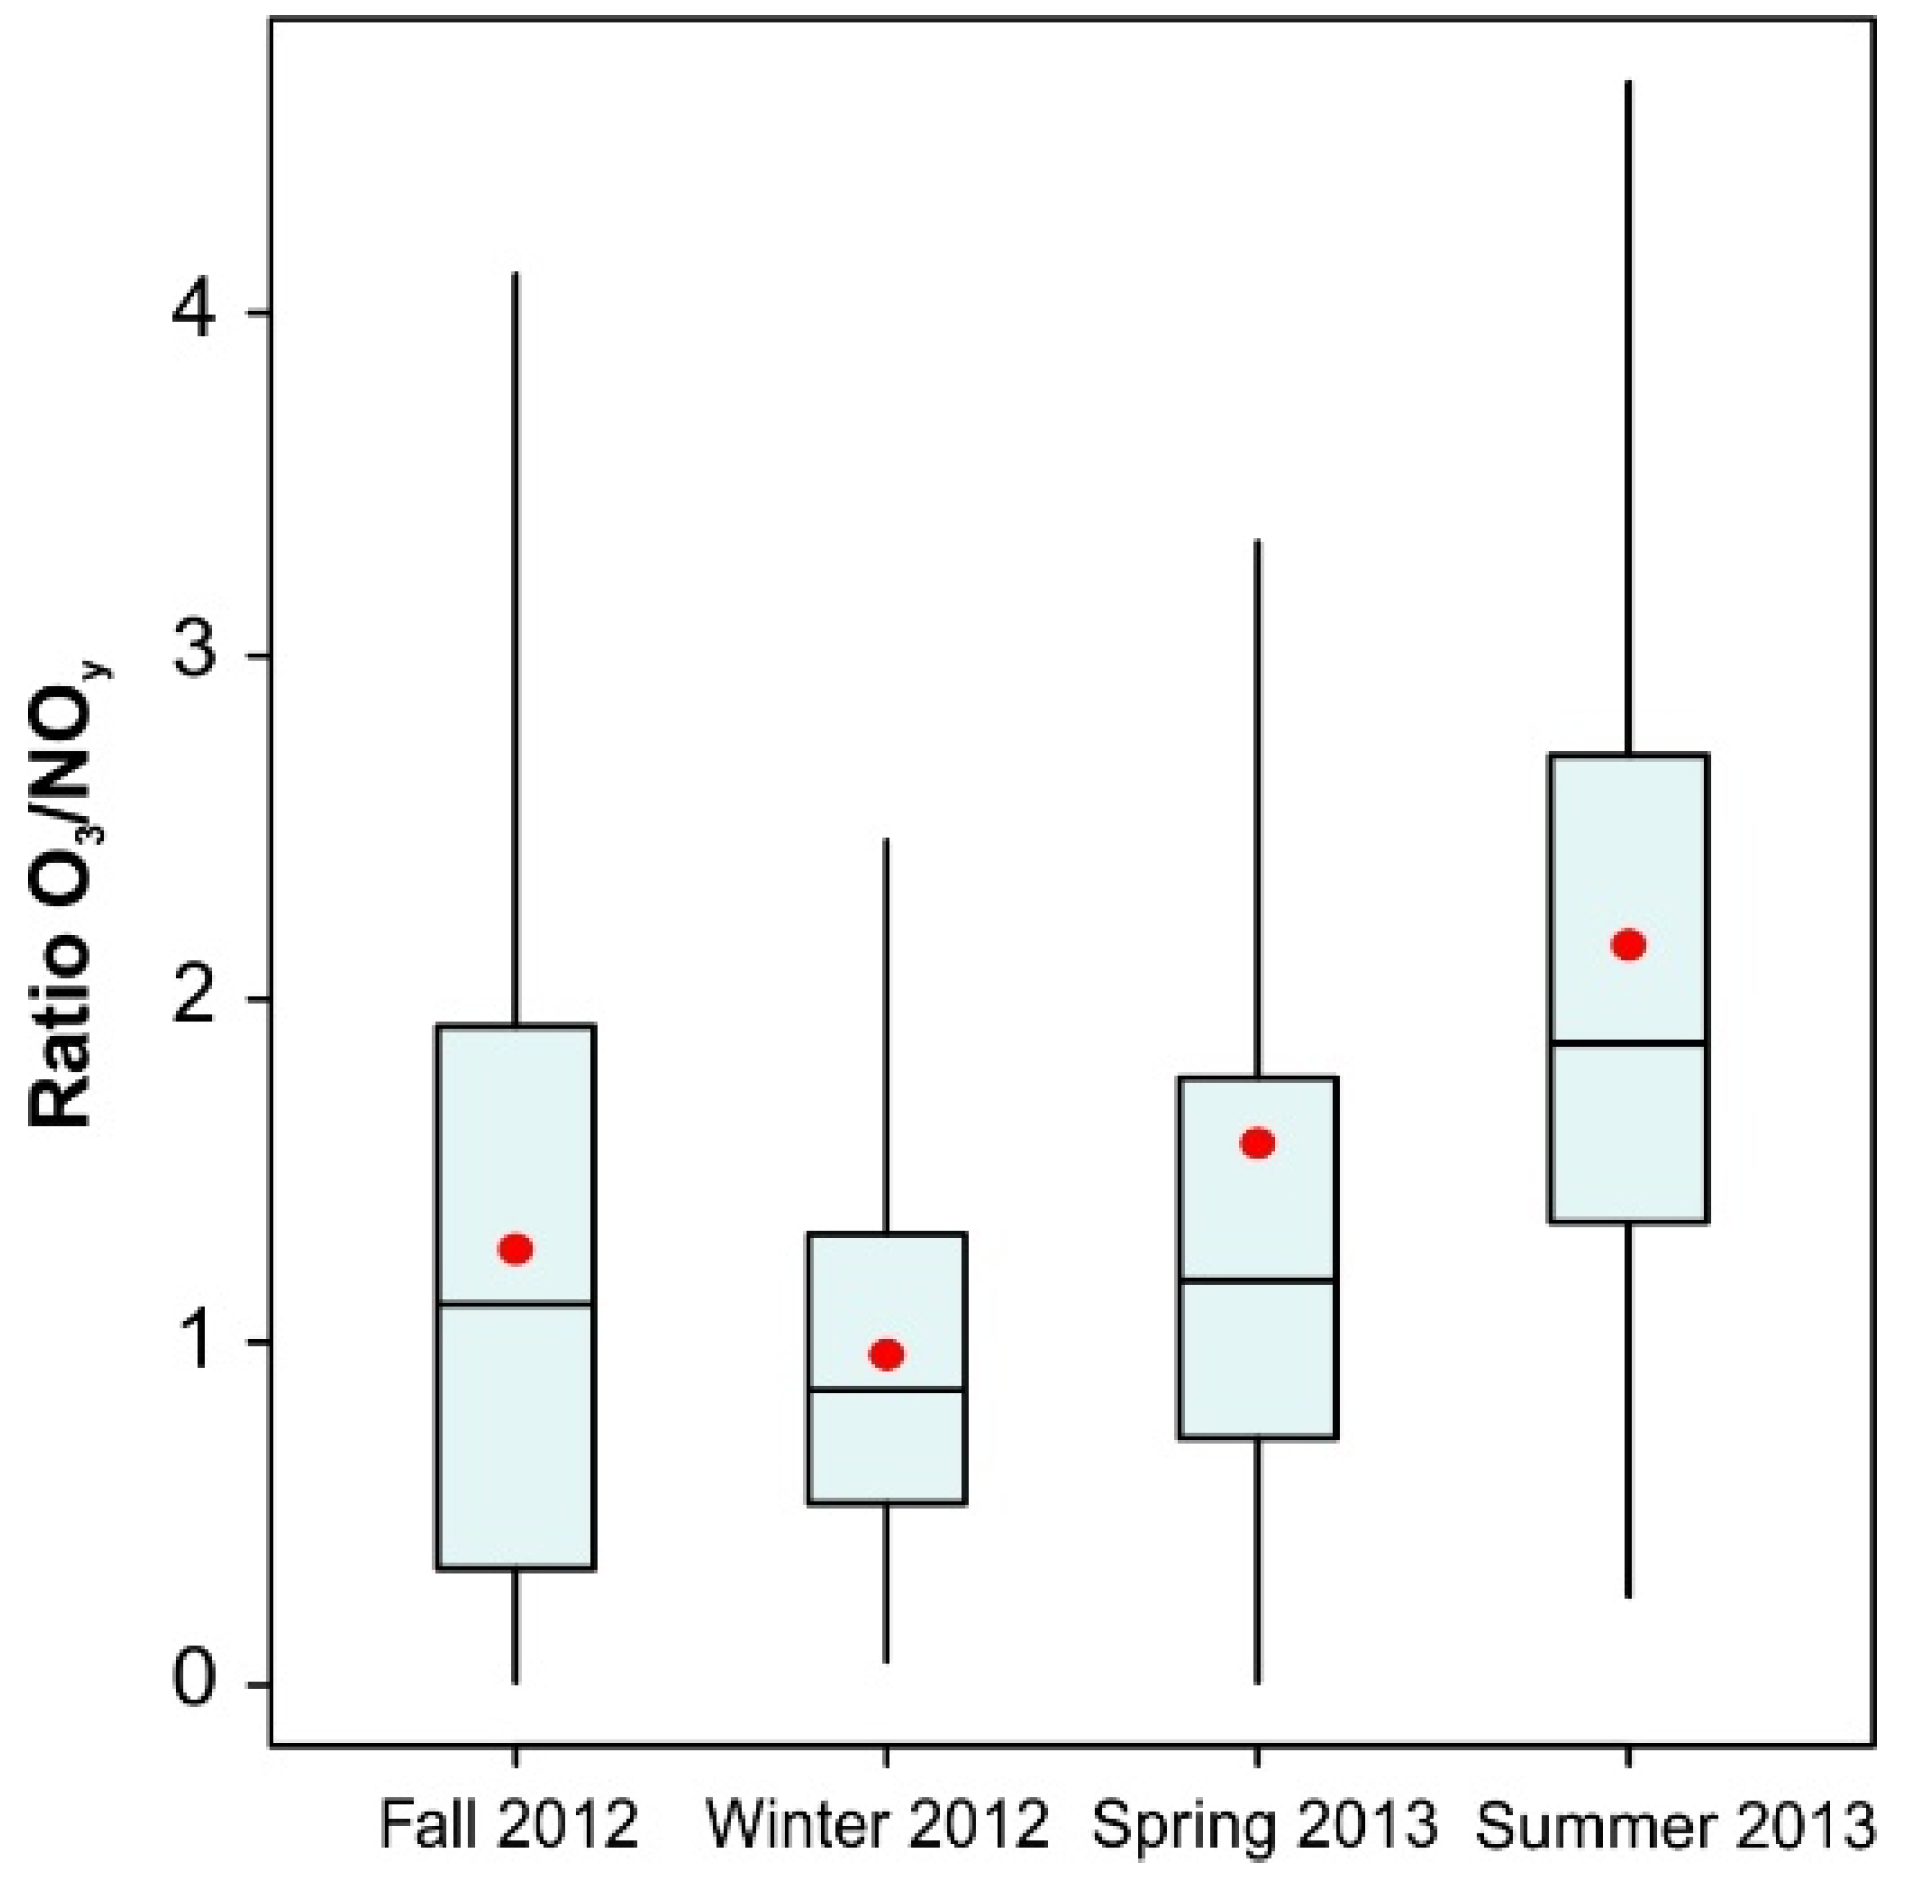
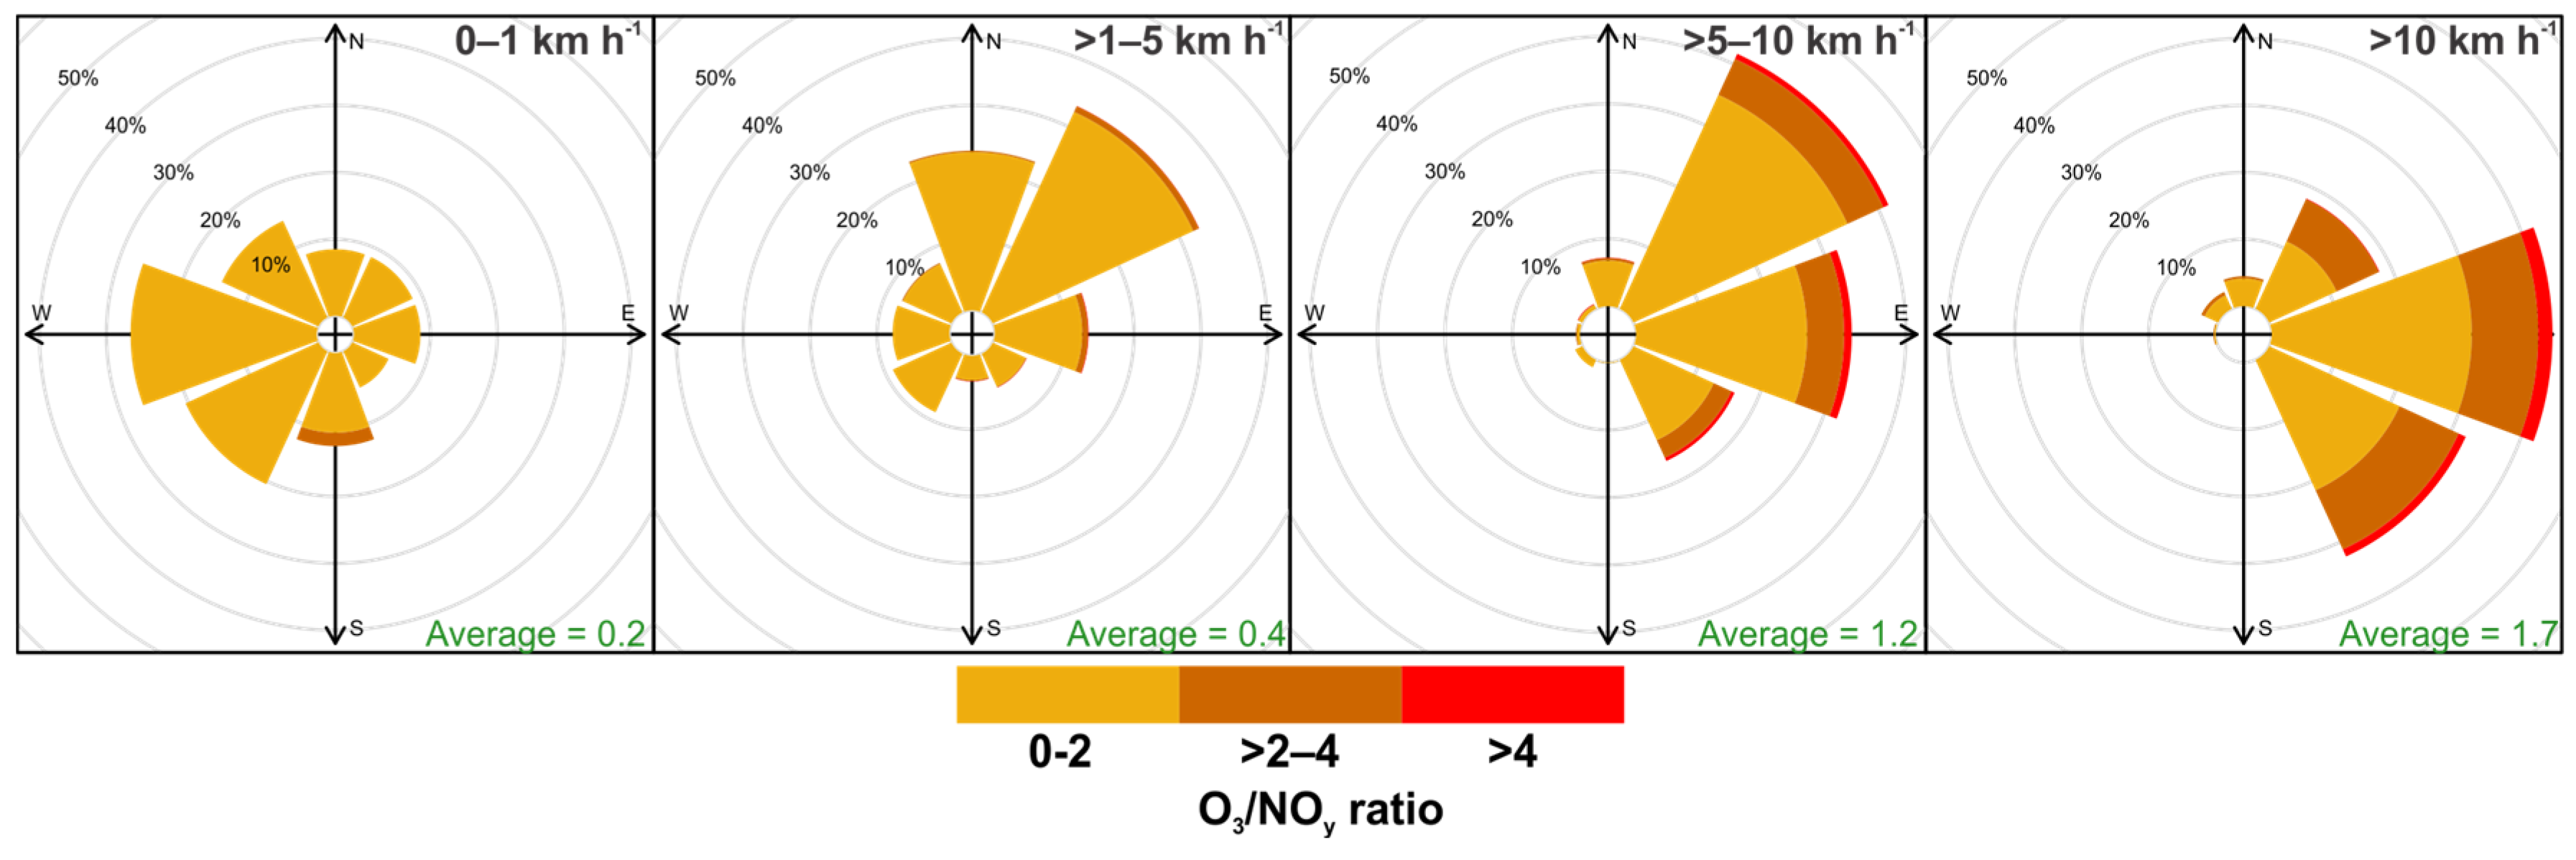
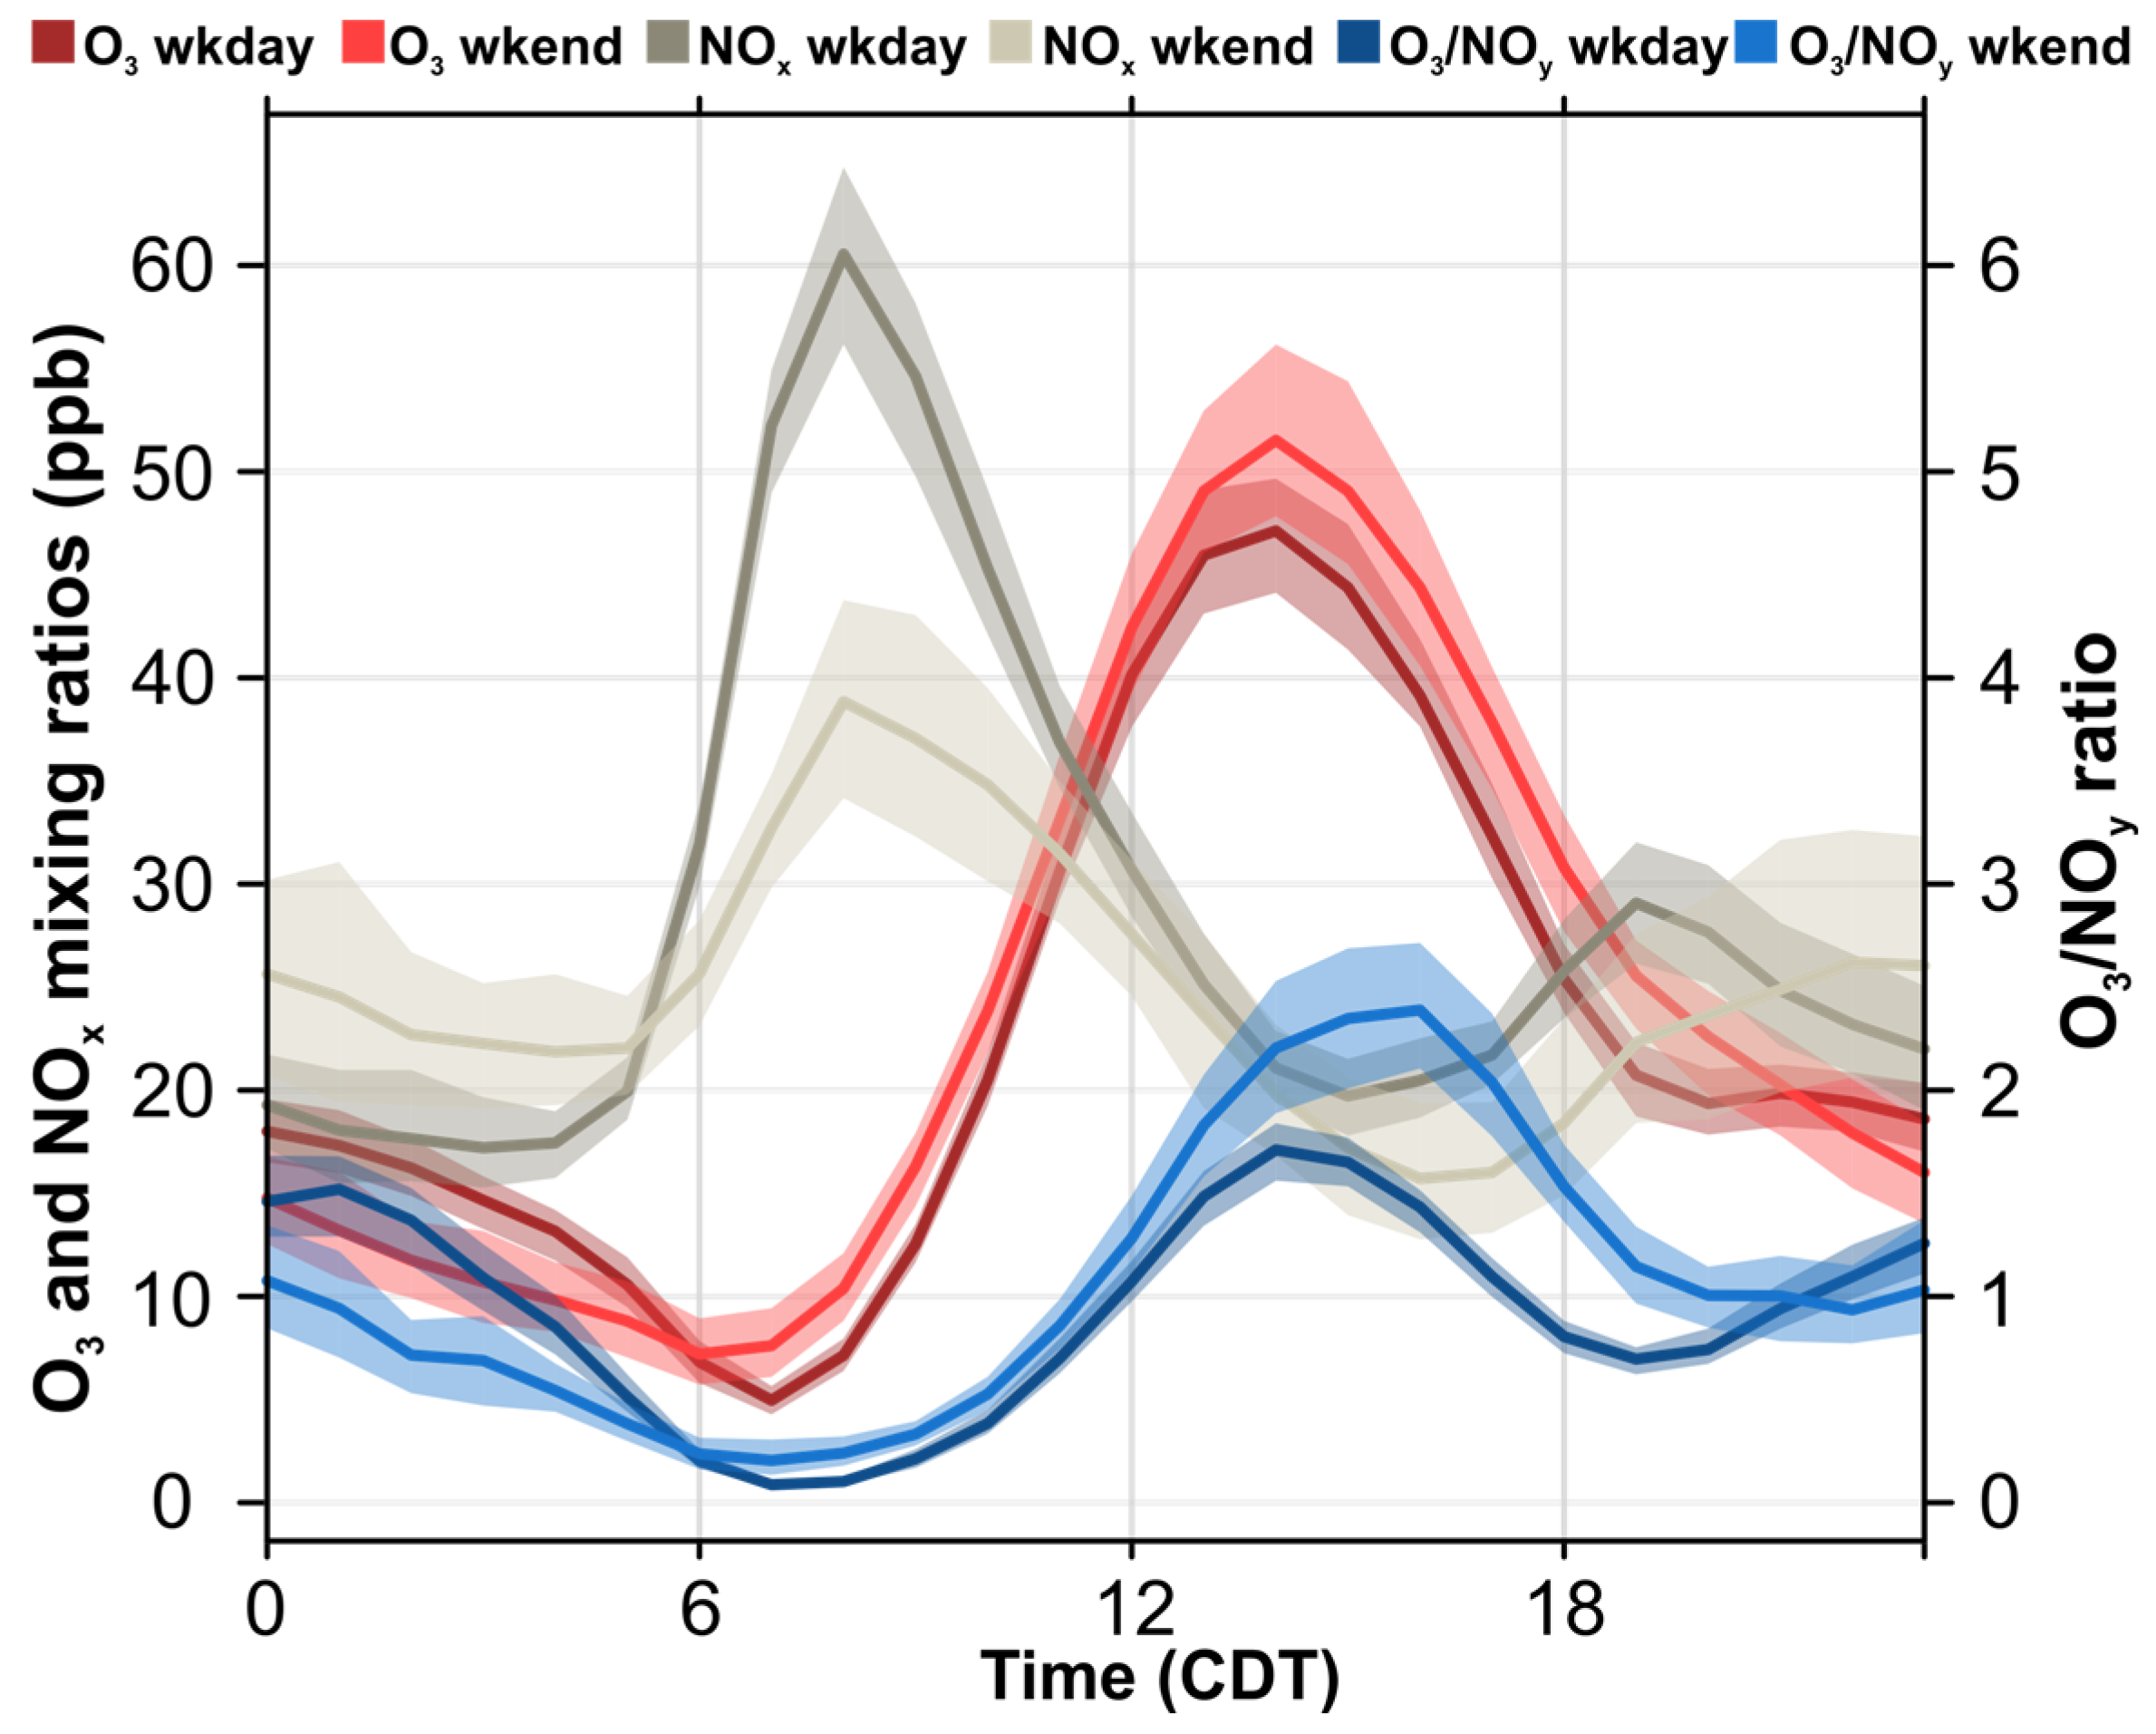
3.4. Use of the O3/NOy Photochemical Indicator
3.5. Box Modeling
4. Conclusions
Acknowledgments
Author Contributions
Conflicts of Interest
References
- Kampa, M.; Castanas, E. Human health effects of air pollution. Environ. Pollut. 2008, 151, 362–367. [Google Scholar] [CrossRef] [PubMed]
- Ainsworth, E.A.; Yendrek, C.R.; Sitch, S.; Collins, W.J.; Emberson, L.D. The Effects of Tropospheric Ozone on Net Primary Productivity and Implications for Climate Change. Annu. Rev. Plant Biol. 2012, 63, 637–661. [Google Scholar] [CrossRef] [PubMed]
- Monks, P.S.; Archibald, A.T.; Colette, A.; Cooper, O.; Coyle, M.; Derwent, R.; Fowler, D.; Granier, C.; Law, K.S.; Mills, G.E.; et al. Tropospheric ozone and its precursors from the urban to the global scale from air quality to short-lived climate forcer. Atmos. Chem. Phys. 2015, 15, 8889–8973. [Google Scholar] [CrossRef]
- National Research Council. Rethinking the Ozone Problem in Urban and Regional Air Pollution; The National Academies Press: Washington, DC, USA, 1991. [Google Scholar]
- Sillman, S. The relation between ozone, NOx and hydrocarbons in urban and polluted rural environments. Atmos. Environ. 1999, 33, 1821–1845. [Google Scholar] [CrossRef]
- Trail, M.; Tsimpidi, A.P.; Liu, P.; Tsigaridis, K.; Rudokas, J.; Miller, P.; Nenes, A.; Hu, Y.; Russell, A.G. Sensitivity of air quality to potential future climate change and emissions in the United States and major cities. Atmos. Environ. 2014, 94, 552–563. [Google Scholar] [CrossRef]
- Geng, F.; Tie, X.; Xu, J.; Zhou, G.; Peng, L.; Gao, W.; Tang, X.; Zhao, C. Characterizations of ozone, NOx, and VOCs measured in Shanghai, China. Atmos. Environ. 2008, 42, 6873–6883. [Google Scholar] [CrossRef]
- Chou, C.C.K.; Tsai, C.Y.; Chang, C.C.; Lin, P.H.; Liu, S.C.; Zhu, T. Photochemical production of ozone in Beijing during the 2008 Olympic Games. Atmos. Chem. Phys. 2011, 11, 9825–9837. [Google Scholar] [CrossRef]
- Pires, J.C.M. Ozone Weekend Effect Analysis in Three European Urban Areas. CLEAN—Soil Air Water 2012, 40, 790–797. [Google Scholar] [CrossRef]
- Pusede, S.E.; Cohen, R.C. On the observed response of ozone to NOx and VOC reactivity reductions in San Joaquin Valley California 1995–present. Atmos. Chem. Phys. 2012, 12, 8323–8339. [Google Scholar] [CrossRef]
- Wałaszek, K.; Kryza, M.; Werner, M.; Ojrzyńska, H. Sensitivity of Ground-Level Ozone to NOx Emission During a High Ozone Episode in SW Poland. In Air Pollution Modeling and Its Application XXIV; Steyn, G.D., Chaumerliac, N., Eds.; Springer International Publishing: Cham, Switzerland, 2016; pp. 339–343. [Google Scholar]
- Torres-Jardón, R.; García-Reynoso, J.A.; Jazcilevich, A.; Ruiz-Suárez, L.G.; Keener, T.C. Assessment of the Ozone-Nitrogen Oxide-Volatile Organic Compound Sensitivity of Mexico City through an Indicator-Based Approach: Measurements and Numerical Simulations Comparison. J. Air Waste Manag. Assoc. 2009, 59, 1155–1172. [Google Scholar] [CrossRef] [PubMed]
- Cai, C.; Kelly, J.T.; Avise, J.C.; Kaduwela, A.P.; Stockwell, W.R. Photochemical Modeling in California with Two Chemical Mechanisms: Model Intercomparison and Response to Emission Reductions. J. Air Waste Manag. Assoc. 2011, 61, 559–572. [Google Scholar] [CrossRef] [PubMed]
- Hammer, M.U.; Vogel, B.; Vogel, H. Findings on H2O2/HNO3 as an indicator of ozone sensitivity in Baden-Württemberg, Berlin-Brandenburg, and the Po valley based on numerical simulations. J. Geophys. Res. 2002, 107. [Google Scholar] [CrossRef]
- Shon, Z.H.; Lee, G.; Song, S.K.; Lee, M.; Han, J.; Lee, D. Characteristics of reactive nitrogen compounds and other relevant trace gases in the atmosphere at urban and rural areas of Korea during May–June, 2004. J. Atmos. Chem. 2007, 58, 203–218. [Google Scholar] [CrossRef]
- Kondo, Y.; Morino, Y.; Fukuda, M.; Kanaya, Y.; Miyazaki, Y.; Takegawa, N.; Tanimoto, H.; McKenzie, R.; Johnston, P.; Blake, D.R.; et al. Formation and transport of oxidized reactive nitrogen, ozone, and secondary organic aerosol in Tokyo. J. Geophys. Res. 2008, 113. [Google Scholar] [CrossRef]
- Chou, C.C.K.; Tsai, C.-Y.; Shiu, C.-J.; Liu, S.C.; Zhu, T. Measurement of NOy during Campaign of Air Quality Research in Beijing 2006 (CAREBeijing-2006): Implications for the ozone production efficiency of NOx. J. Geophys. Res. 2009, 114. [Google Scholar] [CrossRef]
- Peng, Y.P.; Chen, K.S.; Wang, H.K.; Lai, C.H. In Situ Measurements of Hydrogen Peroxide, Nitric Acid and Reactive Nitrogen to Assess the Ozone Sensitivity in Pingtung County, Taiwan. Aerosol Air Qual. Res. 2011, 11, 59–69. [Google Scholar] [CrossRef]
- Sierra, A.; Vanoye, A.Y.; Mendoza, A. Ozone sensitivity to its precursor emissions in northeastern Mexico for a summer air pollution episode. J. Air Waste Manag. Assoc. 2013, 63, 1221–1233. [Google Scholar] [CrossRef] [PubMed]
- Peng, Y.P.; Chen, K.S.; Lai, C.H.; Lu, P.J.; Kao, J.H. Concentrations of H2O2 and HNO3 and O3-VOC-NOx sensitivity in ambient air in southern Taiwan. Atmos. Environ. 2006, 40, 6741–6751. [Google Scholar] [CrossRef]
- Castell, N.; Stein, A.F.; Mantilla, E.; Salvador, R.; Millán, M. Evaluation of the use of photochemical indicators to assess ozone—NOx-VOC sensitivity in the Southwestern Iberian Peninsula. J. Atmos. Chem. 2009, 63, 73–91. [Google Scholar] [CrossRef]
- Ge, B.Z.; Xu, X.B.; Lin, W.L.; Lie, J.; Wang, Z.F. Impact of the regional transport of urban Beijing pollutants on downwind areas in summer: Ozone production efficiency analysis. Tellus B 2012, 64, 17348. [Google Scholar] [CrossRef]
- Trainer, M.; Parrish, D.D.; Buhr, M.P.; Norton, R.B.; Fehsenfeld, F.C.; Anlauf, K.G.; Bottenheim, J.W.; Tang, Y.Z.; Wiebe, H.A.; Roberts, J.M.; et al. Correlation of ozone with NOy in photochemically aged air. J. Geophys. Res. 1993, 98, 2917–2925. [Google Scholar] [CrossRef]
- Milford, J.B.; Gao, D.; Sillman, S.; Blossey, P.; Russell, A.G. Total reactive nitrogen (NOy) as an indicator of the sensitivity of ozone to reductions in hydrocarbon and NOx emissions. J. Geophys. Res. 1994, 99, 3533–3542. [Google Scholar] [CrossRef]
- Sillman, S.; He, D. Some theoretical results concerning O3-NOx-VOC chemistry and NOx-VOC indicators. J. Geophys. Res. 2002, 107. [Google Scholar] [CrossRef]
- Miñarro, M.D.; Castell-Balaguer, N.; Téllez, L.; Mantilla, E. The use of experimental data and their uncertainty for assessing ozone photochemistry in the Eastern Iberian Peninsula. Chemosphere 2012, 89, 796–804. [Google Scholar] [CrossRef] [PubMed]
- SEMARNAT. Informe Nacional de la Calidad del Aire 2013, Mexico. Available online: http://www.inecc.gob.mx/descargas/calaire/2014_inf_nal_calaire_mex.pdf (accessed on 20 September 2016).
- National Institute of Information, Statistics and Geography. México en Cifras. Available online: http://www3.inegi.org.mx/sistemas/mexicocifras/default.aspx?e=19 (accessed on 22 May 2016).
- Servicio Meteorologico Nacional. Available online: http://smn.cna.gob.mx/es (accessed on 21 May 2016).
- Carslaw, D.C.; Ropkins, K. Openair—An R package for air quality data analysis. Environ. Model. Softw. 2012, 27–28, 52–61. [Google Scholar] [CrossRef]
- R Core Team. R: A language and Environment for Statistical Computing. Available online: http://www.R-project.org/ (accessed on 15 February 2015).
- Harley, R.A.; Russell, A.G.; McRae, G.J.; Cass, G.R.; Seinfeld, J.H. Photochemical modeling of the Southern California air quality study. Environ. Sci. Technol. 1993, 27, 378–388. [Google Scholar] [CrossRef]
- Sánchez-Ccoyllo, O.R.; Ynoue, R.Y.; Martins, L.D.; de Fátima Andrade, M. Impacts of ozone precursor limitation and meteorological variables on ozone concentration in São Paulo, Brazil. Atmos. Environ. 2006, 40, 552–562. [Google Scholar] [CrossRef]
- Ying, Q.; Lu, J.; Kleeman, M. Modeling air quality during the California Regional PM10/PM2.5 Air Quality Study (CPRAQS) using the UCD/CIT source-oriented air quality model—Part III. Regional source apportionment of secondary and total airborne particulate matter. Atmos. Environ. 2009, 43, 419–430. [Google Scholar] [CrossRef]
- Young, A.T.; Betterton, E.A.; De Rueda, L.S. Photochemical box model for Mexico City. Atmósfera 1997, 10, 161–178. [Google Scholar]
- Carter, W.P.L. A detailed mechanism for the gas-phase atmospheric reactions of organic compounds. Atmos. Environ. Part A Gen. Top. 1990, 24, 481–518. [Google Scholar] [CrossRef]
- SEMARNAT. National Emissions Inventory 2005-Inventario Nacional de Emisiones 2005 (NEI). Available online: http://sinea.semarnat.gob.mx/sinae.php?process=UkVQT1JURUFET1I=&categ=1 (accessed on 22 May 2016).
- Mendoza, A.; García, M.R. Aplicación de un modelo de calidad del aire de segunda generación a la zona metropolitana de Guadalajara, México. Rev. Int. Contam. Ambient. 2009, 25, 73–85. [Google Scholar]
- Hsu, Y.; Strait, R.; Roe, S.; Holoman, D. SPECIATE 4.0 Speciation Database Development Documentation: Final Report; EPA/6007R-06/161; US Environmental Protection Agency: Research Triangle Park, NC, USA, 2006.
- Menchaca-Torre, H.L.; Mercado-Hernández, R.; Mendoza-Domínguez, A. Diurnal and seasonal variation of volatile organic compounds in the atmosphere of Monterrey, Mexico. Atmos. Pollut. Res. 2015, 6, 1073–1081. [Google Scholar] [CrossRef]
- Menchaca-Torre, H.L.; Mercado-Hernández, R.; Rodríguez-Rodríguez, J.; Mendoza-Domínguez, A. Diurnal and seasonal variations of carbonyls and their effect on ozone concentrations in the atmosphere of Monterrey, Mexico. J. Air Waste Manag. Assoc. 2015, 65, 500–510. [Google Scholar] [CrossRef] [PubMed]
- Luecken, D.J.; Tonnesen, G.S.; Sickles, I.J.E. Differences in NOy speciation predicted by three photochemical mechanisms. Atmos. Environ. 1999, 33, 1073–1084. [Google Scholar] [CrossRef]
- Luke, W.T.; Kelley, P.; Lefer, B.L.; Flynn, J.; Rappenglück, B.; Leuchner, M.; Dibb, J.E.; Ziemba, L.D.; Anderson, C.H.; Buhr, M. Measurements of primary trace gases and NOy composition in Houston, Texas. Atmos. Environ. 2010, 44, 4068–4080. [Google Scholar] [CrossRef]
- Atkinson, R. Atmospheric chemistry of VOCs and NOx. Atmos. Environ. 2000, 34, 2063–2101. [Google Scholar] [CrossRef]
- Cerón-Bretón, J.G.; Cerón-Bretón, R.M.; Kahl, J.D.W.; Ramírez-Lara, E.; Guarnaccia, C.; Aguilar-Ucán, C.A.; Montalvo-Romero, C.; Anguebes-Franseschi, F.; López-Chuken, U. Diurnal and seasonal variation of BTEX in the air of Monterrey, Mexico: Preliminary study of sources and photochemical ozone pollution. Air Qual. Atmos. Health 2015, 8, 469–482. [Google Scholar] [CrossRef]
- Slowik, J.G.; Brook, J.; Chang, R.Y.W.; Evans, G.J.; Hayden, K.; Jeong, C.H.; Li, S.M.; Liggio, J.; Liu, P.S.K.; McGuire, M.; et al. Photochemical processing of organic aerosol at nearby continental sites: Contrast between urban plumes and regional aerosol. Atmos. Chem. Phys. 2011, 11, 2991–3006. [Google Scholar] [CrossRef]
- Hernández Paniagua, I.Y.; Clemitshaw, K.C.; Mendoza, A. Impact of emissions of VOCs and NOx on trends of ground-level O3 in Mexico during 1993–2014: Comparison of Monterrey with Mexico City and Guadalajara. Atmos. Chem. Phys. Discuss. 2016, 2016, 1–36. [Google Scholar] [CrossRef]
- Song, J.; Lei, W.; Bei, N.; Zavala, M.; de Foy, B.; Volkamer, R.; Cardenas, B.; Zheng, J.; Zhang, R.; Molina, L.T. Ozone response to emission changes: A modeling study during the MCMA-2006/MILAGRO Campaign. Atmos. Chem. Phys. 2010, 10, 3827–3846. [Google Scholar] [CrossRef]
- Stephens, S.; Madronich, S.; Wu, F.; Olson, J.B.; Ramos, R.; Retama, A.; Muñoz, R. Weekly patterns of México City’s surface concentrations of CO, NOx, PM10 and O3 during 1986–2007. Atmos. Chem. Phys. 2008, 8, 5313–5325. [Google Scholar] [CrossRef]
- US Energy Information Administration. Technically Recoverable Shale Oil and Shale Gas. Resources: Mexico; United States Department of Energy: Washington, DC, USA, 2015.
- Pacsi, A.P.; Kimura, Y.; McGaughey, G.; McDonald-Buller, E.C.; Allen, D.T. Regional Ozone Impacts of Increased Natural Gas Use in the Texas Power Sector and Development in the Eagle Ford Shale. Environ. Sci. Technol. 2015, 49, 3966–3973. [Google Scholar] [CrossRef] [PubMed]


| Reference | Location | Altitude (m a.s.l.) | Methodology | Chemical Species | Period | Photochemical Regime |
|---|---|---|---|---|---|---|
| [14] | Baden-Württemberg and Berlin-Brandenburg, Germany; Po Valley, Italy | ~245; ~34 | Modeling | O3, H2O2, HNO3, NOx, VOC, and NOy | May 1998 | Berlin-Brandenburg and Po Valley: VOC-sensitive. Baden-Württemberg: NOx sensitive |
| [15] | Seoul and Gyeonggi, Korea | 44 | Observations | NOx, NOy, H2O2, O3, CO, HCHO, and PAN * | 1 May–30 June 2004; 15 May–17 June 2004 | VOC sensitive |
| [16] | Tokyo, Japan | 37 | Observations | NOy and NOy, and PM10 | 24 July–13 August 2003; 1–15 October 2003 | NOx-sensitive regime during 12–14 August |
| [17] | Beijing, China | 44 | Observations | NO, NOx, and NOy | 1 August–9 September 2006 | VOC sensitive |
| [18] | Pingtung, Chao-Chou, Kenting, Taiwan | ~17 | Modeling and observations | H2O2, HNO3, and NOy | 5-day period by season during 2003–2004 | Pingtung, Chao-Chou: both regimes. Kenting: NOx sensitive |
| [19] | Monterrey, México | 540 | Modeling | O3 and NOy | 22–27 August 2005 | VOC sensitive |
| Parameter | Instrument Model | Detector | EPA Equivalent Method Number | Stated Precision (±) |
|---|---|---|---|---|
| O3 | Thermo Environmental 49C | UV photometry | EQOA-0880-047 | 1 ppb |
| NO-NO2-NOx | Thermo Environmental 42C | Chemiluminescence | RFNA-1289-074 | 0.4 ppb |
| NO-DIF-NOy | Thermo Environmental 42i NOy | Chemiluminescence | RFNA-1289-074 | 50 ppb |
| PM10 | Met One BAM 1020 | Beta attenuation | EQPM-0798-122 | 5 µg·m−3 |
| CO | Thermo Environmental 48C | Non-dispersive IR | RFCA-0981-054 | 1 ppm |
| SO2 | Thermo Environmental 43C | Fluorescence | EQSA-0486-060 | 1 ppb |
| WS | Met One 010C | Anemometer | n.a. | 1% |
| WD | Met One 020C | Potentiometer | n.a. | 3° |
| Temperature | Met One 060A | Multi-stage thermistor | n.a. | 0.5 °C |
| Pressure | Met One 090D | Barometric sensor | n.a. | 1.35 mbar |
| RH | Met One 083E | Capacitance sensor | n.a. | 2% |
| SR | Met One 095 | Pyranometer | n.a. | 1% |
| Period | Date | Season |
|---|---|---|
| 1 | 1–8 September 2012 | Fall |
| 2 | 22–29 September 2012 | Fall |
| 3 | 6–13 March 2013 | Spring |
| 4 | 12–19 March 2013 | Spring |
| Parameter | Fall 2012 | Winter 2012 | Spring 2013 | Summer 2013 |
|---|---|---|---|---|
| O3 (ppb) | 0.106 | 0.151 | 0.065 | 0.070 |
| NO2 (ppb) | 0.676 | 0.819 | 0.411 | 0.783 |
| NO (ppb) | 0.610 | 0.661 | 0.275 | 0.615 |
| CO (ppm) | 0.420 | 0.664 | 0.227 | 0.712 |
| Solar radiation (kW·m−2) | 0.001 * | 0.004 | 0.001 * | 0.009 |
| Temperature (°C) | 0.024 | 0.022 | 0.005 | 0.063 |
| Wind speed (km·h−1) | 0.247 | 0.203 | 0.112 | 0.225 |
| Component | PC1 | PC2 | PC3 |
|---|---|---|---|
| NOy | 0.481 | 0.055 | −0.009 |
| NO2 | 0.387 | 0.087 | −0.123 |
| NO | 0.375 | 0.029 | 0.151 |
| O3 | −0.226 | 0.447 | 0.075 |
| CO | 0.400 | 0.110 | 0.081 |
| SO2 | 0.206 | 0.339 | −0.348 |
| PM10 | 0.230 | 0.354 | −0.062 |
| PM2.5 | 0.261 | 0.234 | 0.129 |
| SR | −0.090 | 0.497 | 0.031 |
| Temperature | −0.197 | 0.370 | 0.411 |
| WS | −0.288 | 0.276 | 0.084 |
| WD | 0.175 | 0.339 | 0.794 |
| Cumulative variance (%) | 39.5 | 59.5 | 67.2 |
| Season | O3/NOy * | |
|---|---|---|
| Weekdays | Weekends | |
| Fall 2012 | 1.31 ± 1.07 | 1.81 ± 1.45 |
| Winter 2012 | 1.17 ± 0.67 | 1.29 ± 0.85 |
| Spring 2013 | 1.41 ± 1.25 | 1.77 ± 1.08 |
| Summer 2013 | 2.13 ± 1.16 | 2.85 ± 1.65 |
| Period | PHNO3/Pperox * | O3/NOy * |
|---|---|---|
| Weekdays | 13.14 ± 21.59 | 1.33 ± 0.78 |
| Weekends | 14.38 ± 19.52 | 2.01 ± 0.95 |
© 2017 by the authors. Licensee MDPI, Basel, Switzerland. This article is an open access article distributed under the terms and conditions of the Creative Commons Attribution (CC BY) license ( http://creativecommons.org/licenses/by/4.0/).
Share and Cite
Carrillo-Torres, E.R.; Hernández-Paniagua, I.Y.; Mendoza, A. Use of Combined Observational- and Model-Derived Photochemical Indicators to Assess the O3-NOx-VOC System Sensitivity in Urban Areas. Atmosphere 2017, 8, 22. https://doi.org/10.3390/atmos8020022
Carrillo-Torres ER, Hernández-Paniagua IY, Mendoza A. Use of Combined Observational- and Model-Derived Photochemical Indicators to Assess the O3-NOx-VOC System Sensitivity in Urban Areas. Atmosphere. 2017; 8(2):22. https://doi.org/10.3390/atmos8020022
Chicago/Turabian StyleCarrillo-Torres, Edson R., Iván Y. Hernández-Paniagua, and Alberto Mendoza. 2017. "Use of Combined Observational- and Model-Derived Photochemical Indicators to Assess the O3-NOx-VOC System Sensitivity in Urban Areas" Atmosphere 8, no. 2: 22. https://doi.org/10.3390/atmos8020022
APA StyleCarrillo-Torres, E. R., Hernández-Paniagua, I. Y., & Mendoza, A. (2017). Use of Combined Observational- and Model-Derived Photochemical Indicators to Assess the O3-NOx-VOC System Sensitivity in Urban Areas. Atmosphere, 8(2), 22. https://doi.org/10.3390/atmos8020022