1. Introduction
Research-grade and storm-scaled operational numerical weather prediction (NWP) models have been regularly used for simulation with horizontal grid spacings as fine as 1 km over urban areas. For accurate weather forecasts in urban meteorology, topographic and land-use data are important input elements for numerical models, and high-resolution terrain data are required for the expression of complex characteristics of various regions. It has been known that for model forecasting the effect of multi-scale terrain data is more important than the model resolutions [
1]. The topographic properties of an area affect the regional circulation, and thus play an important role in a numerical model in altering the rainfall, air flow, and temperature distribution. Thus, the land use data play a significant role in altering the local and regional climate by affecting the energy and water balances between the surface and atmosphere [
2,
3].
Although a number of studies have been conducted to improve the prediction performance of numerical models by using high-resolution data on topographic properties, there has been a lack of research involving topographic altitude and complex land use data of urban areas based on resolution and on analysis of the vertical structure of the atmosphere. To improve the prediction performance of a numerical model, it is essential to understand the effect of resolution by simultaneously using topographic altitude and land use data with various resolutions.
In previous literature, Lin et al. [
4] and Grossman-Clarke et al. [
5] analyzed the extent to which the application of high-resolution land use data affected the Weather Research and Forecasting (WRF) model in its ability to predict the temperature of the lower atmosphere in Phoenix, USA, and in the northern region of Taiwan. De Meij and Vinuesa [
6] conducted an experiment involving the WRF model wherein high-resolution topographic and land use data were applied to the northern region of Italia. The simulation results from this study showed that the wind speed and the temperature became lower and higher, respectively, due to the influences of large frictional forces and long roughness length in the city. Zhang et al. [
7] conducted simulation experiments involving the WRF model for Hong Kong by using topographic data of different resolutions and found that the temperature and relative humidity values were similar to the observed values when high-resolution topographic data were used, indicating that high-resolution topographic data should be applied to simulate the weather of a region using a numerical model.
Furthermore, Zhang et al. [
7] found that finer-scale models were more sensitive to the resolution of digital elevation model (DEM) data than coarser-scale numerical models and that improved expression of topography was not sufficient to improve the weather process simulation of high-resolution models. Additionally, they suggested that scale matching between the data and the model was an important factor for high-resolution models. Also, new observing network allowed researchers to have more high-resolution terrain data, but limited computational power restricted them to configure high-resolution models. Therefore, in this study, the objective was to evaluate the effect of topographical data, which have resolutions higher than numerical model resolutions, on model performance. Specifically, the terrain data-set with different resolutions for Seoul, a megacity in South Korea, was applied to generate topographical input data for the numerical model. Both analysis of the effective resolution on the precipitation forecast and a comparison with the actual ground observation data were conducted to analyze the weather characteristics.
The rest of this paper is organized as follows. In
Section 2, the configuration of the numerical model used in this research and the topographical data such as altitude and land use data, along with their statistical properties, are presented. In
Section 3, the numerical results are compared to the ground data and are analyzed depending on resolution.
Section 4 provides a summary of the research and remarks.
2. Model and Topographic Data
Korea receives heavy precipitation during the rainy season from the end of June to the end of July due to the East Asian monsoon and from the July through September due to typhoons. Heavy rain systems related the East Asian monsoon over the Korean Peninsula are classified into four categories: isolated thunderstorms, convective bands, cloud clusters, and squall lines [
8]. During the rainy period, warm, moist air moves off the Yellow Sea and meets drier air to the north, resulting in rain over Korea. Seoul, the capital city of Korea, receives an average of 380 mm of precipitation during July.
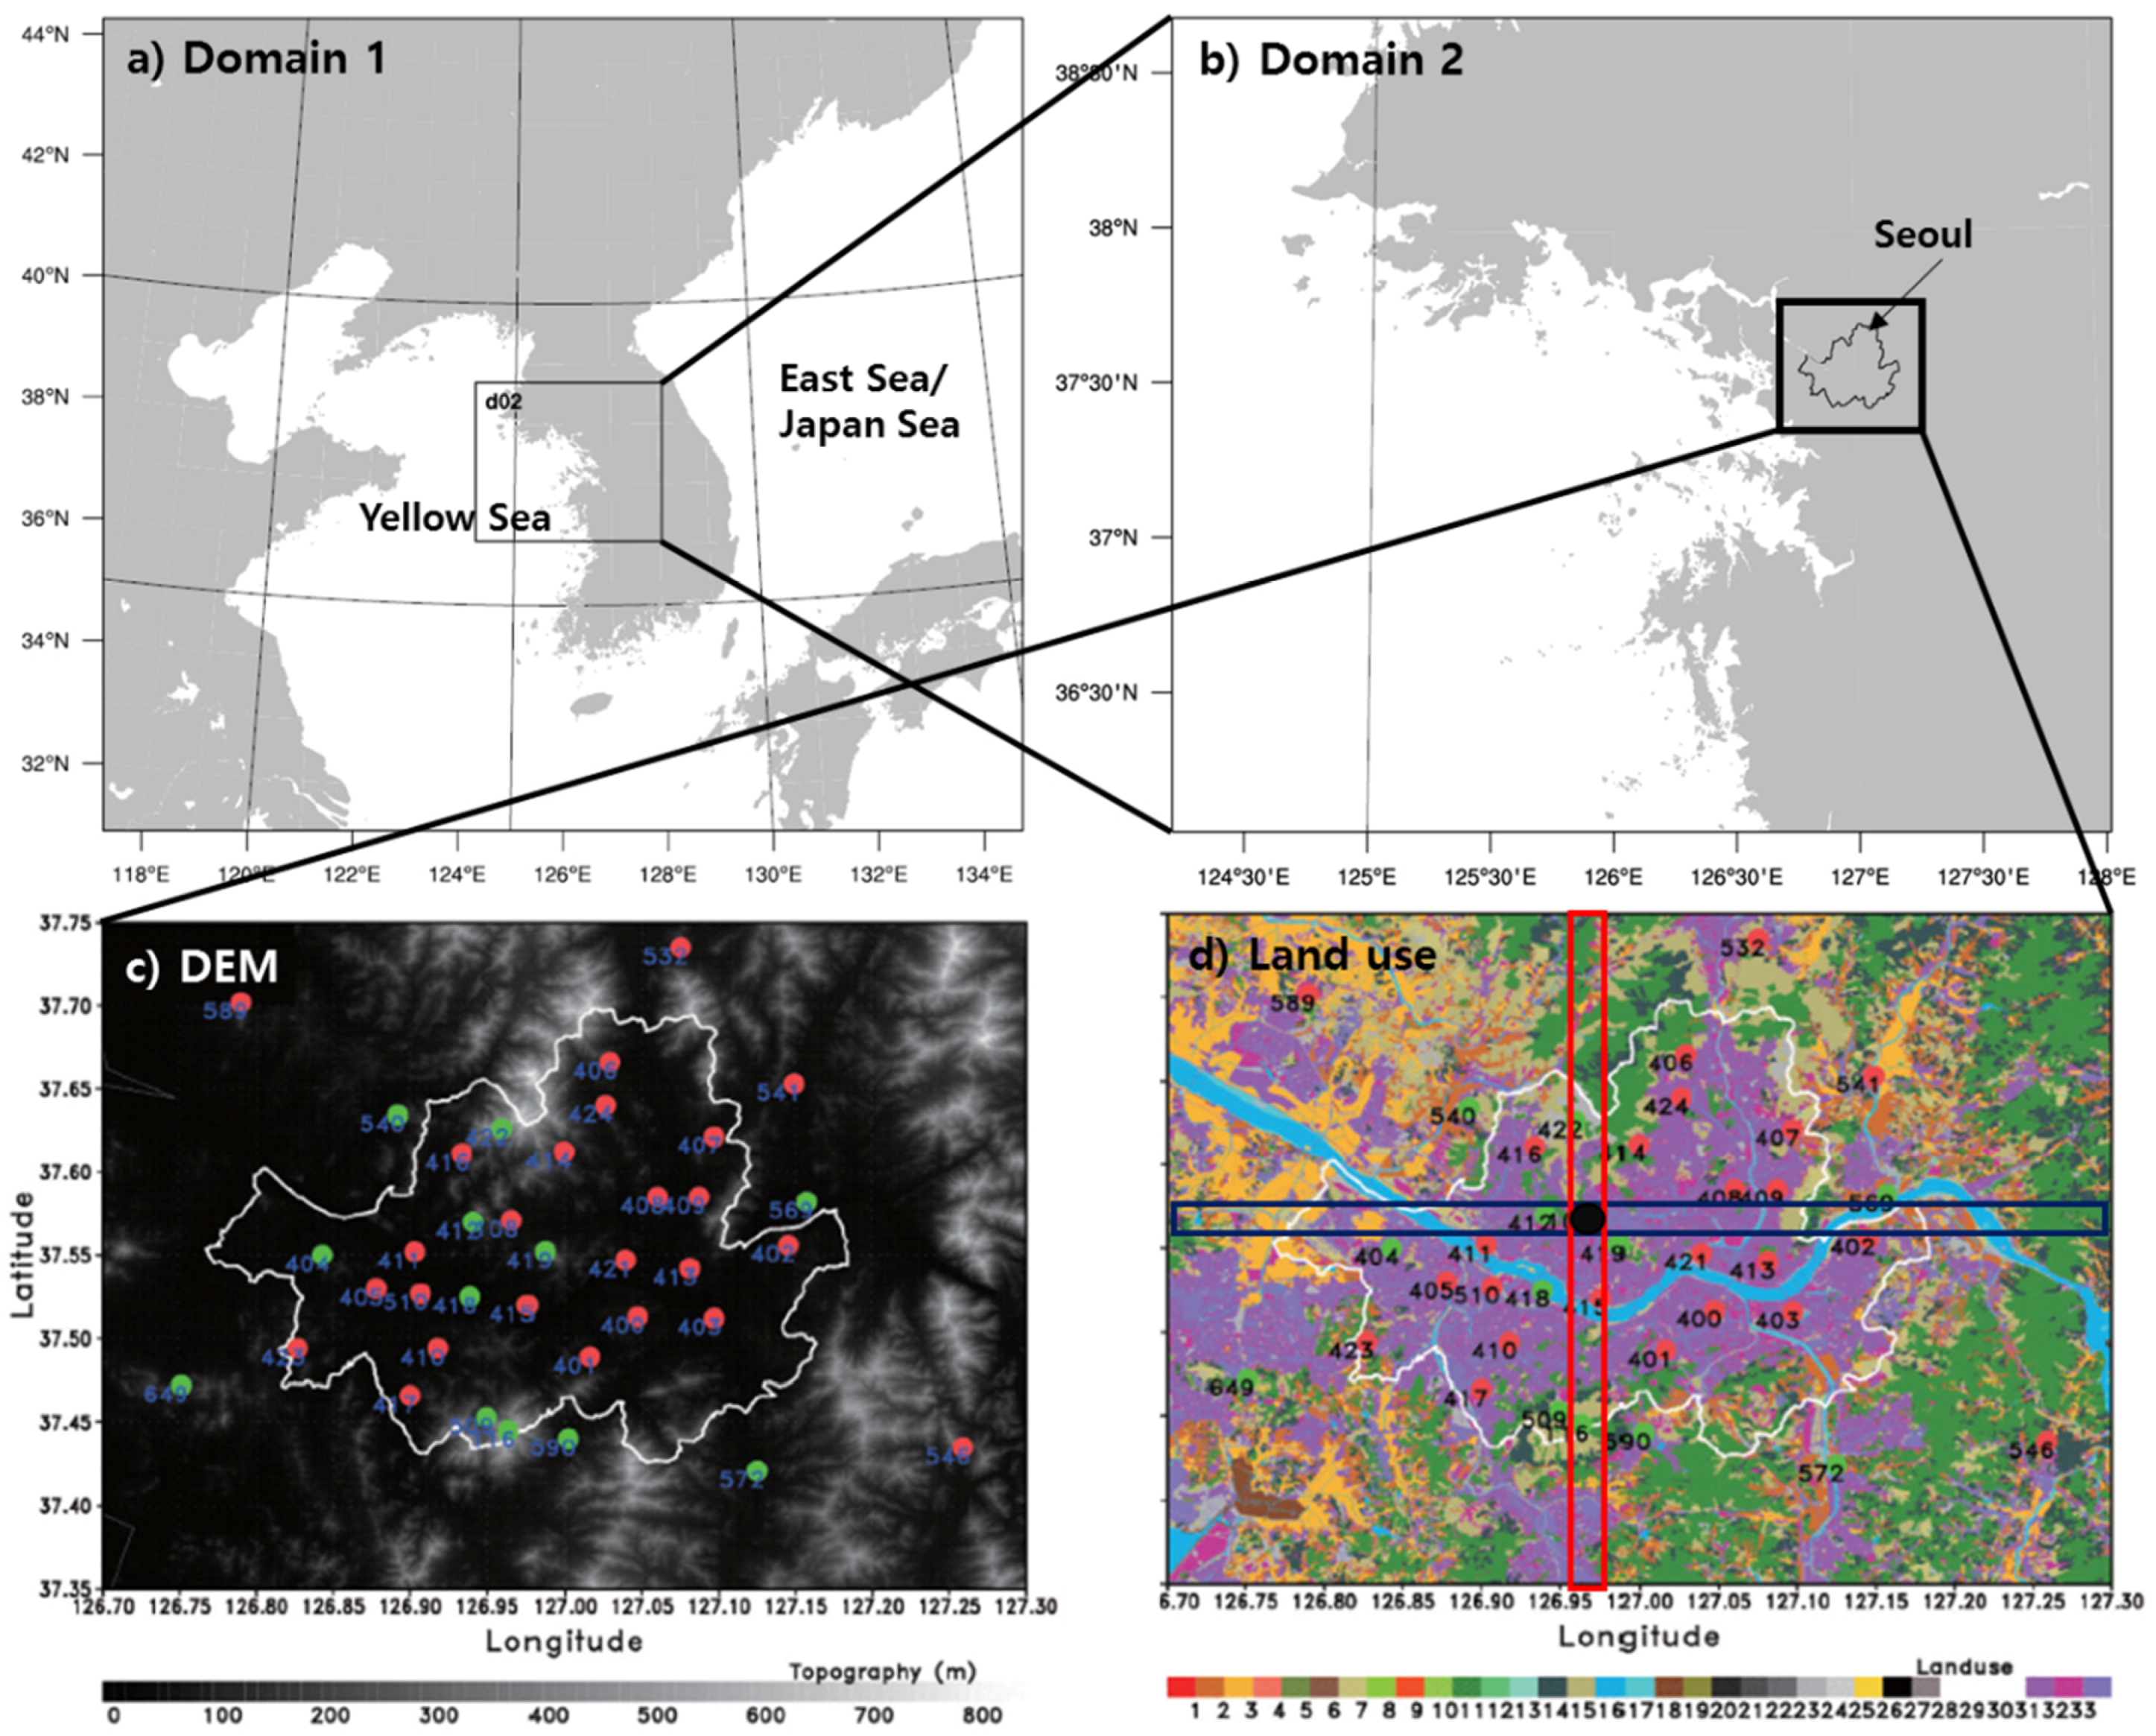
The city of Seoul is located half way along the Korean Peninsula and near the west coast, which is a shallow-sea and tide-dominated area with complex coastal shape and many islands (
Figure 1a). Around and within Seoul (
Figure 1b), mountains are located in the southern and northern regions (
Figure 1c). The capital city is divided by the Han River, the lifeline of Korea, and metropolitan areas surround the city (
Figure 1d). Since the 1960s, Seoul has experienced a destruction of natural resources and the heat island phenomenon due to its high concentration of human population and urbanization. The city includes various land use types depending on the degree of development and the distribution characteristics of green areas. In the following, the surface data are classified depending on the resolution of the topographic altitude and land use data, and statistical properties are analyzed.
2.1. Model Configuration
To represent mesoscale and microscale phenomena and to predict numerical weather information of a 12-h time period, the WRF model, V3.6.1, which is a mesoscale model developed by the National Center for Atmospheric Research (NCAR) in the United States, was used in this study [
9]. The WRF is a non-static model that appropriately simulates microscale and mesoscale weather phenomena. The model consists of a nested domain configuration defined in the Lambert conformal map projection with central latitude of 38°N and longitude of 126°E (
Figure 1a). Two numerical domains with one-way nesting were used with 50 vertical levels with a maximum height of 50 hPa, and the horizontal resolutions for the outer and the inner domains were 5 km with 332 × 293 grids and 1 km with 336 × 286 grids, respectively. For the outer domain, the Unified Model (UM) regional model forecast field from the Korea Meteorological Administration (KMA) provided the lateral boundary every three hours and the initial condition at the initial time. For the inner domain, a hot start was used for the initial condition at model initialization such that observations available from radar, satellite, automated versions of the traditional weather stations (AWS), and so forth via KMA were assimilated into the initial field of the outer domain [
10,
11]. One-way nesting allowed the model with inner domain to obtain the later boundary directly from the model results of the outer domain at every integration time. The integration times were 30 and 6 s, respectively.
The inner domain covered the metropolitan area including suburban areas around Seoul, and the outer domain was configured to prevent numerical instabilities around borders as well as propagation of numerical artifacts into the inner domain (
Figure 1b). For the initial input and boundary data, a UM regional model prediction field of 12 km from the KMA, OSTIA sea surface temperature of 5 km from the MET office, and soil moisture and soil-temperature of 100 km from the NCEP FNL were used. The physical parameterization included the YSU scheme for planetary boundary layers (PBL) [
12], WDM6 microphysics [
13], the Unified Noah land surface model [
14], and the New Goddard scheme [
15] for longwave and shortwave radiations. Note that the cumulus parameterization scheme was only applied for the outer domain of 5 km.
Table 1 provides a summary of the physical parameterization and model configuration, along with terrain data for both domains.
In order to understand the various resolution effects for the topographic altitude and land use data on the performance of the high-resolution model forecasting, we first constructed both topographic height and land use with different resolutions and applied these for the inner domain of 1 km. By using the land surface data based on the various resolutions, the model input for the topographic height and land use index for the inner domain were generated by the WRF preprocessing system (WRF-WPS). That is, the terrain data are remapped on the model resolution via WRF-WPS to generate the topographical input data.
It is worth noting that during the construction of the topographic height on model grids from the source data in the WRF-WPS, the preprocessing system included subgrid-scale averaging of the data, grid-scale spatial interpolation, and so forth [
16]. Also, the WRF-WPS constructed the land use on the model grid by choosing the nearest data to the model grids. These preprocessing smoothing effects are necessary in many circumstances, but sometimes the generated topographic height does not well represent the measured data at the order of tens to hundreds of meters [
17,
18]. Such discrepancies may produce significant error in simulated low level wind fields [
19,
20,
21]. Along with such an oversimplification of the measured data, Nunalee et al., [
22] also showed that uncertainty in the measured data can be significant enough to produce fundamental differences in simulated orographic flow mechanics, and this illustrates that the sensitivity of NWP models can be more complex than first-order biases [
23].
2.2. Construction of Topographical Data
To find the resolution effects of the terrain data of topographic height and land use on the model forecasting results over the inner domain, the topographic and land use data were categorized, depending on the resolution of the data, into four groups, such as Control, 75S, 03S, and 01S (
Table 2). The data resolution for the control run was 900 m. Experiment 75S had a resolution of 225 m, the 03S data had a resolution of 90 m, and the 01S data had a resolution of 30 m. For the control, the DEM data developed by the United States Geological Survey (USGS) were used, and the default data set was generally used for many community models, such as the WRF model. For the resolution of 225 m, the DEM data were constructed from a combination of USGS and National Geographic Information Institute (NGII) data. For experiments 03S and 01S, the Shuttle Radar Topography Mission (SRTM) data [
24] from the National Aeronautics and Space Administration and the medium-scale NGII data were used, respectively.
Additionally, land use data developed by the USGS were used and classified into 33 items according to the USGS classification systems for the use of the control [
25], and these data are also the default data set that is generally used for the WRF model. The land use data for the resolution of 225 m were reconstructed for Korea Land Cover, and these data were the Moderate Resolution Imaging Spectroradiometer (MODIS) land use data redistributed into 33 classification categories [
26,
27]. For experiment 03S with a resolution of 90 m, the land use data from the large-scale NGII were used. Lastly, the land use data used for 01S were the medium-scale NGII data.
Figure 1c,d show the topographic altitude and land use with a resolution of 30 m over Seoul and its surrounding areas. The land use data are classified into 33 items. Among the 33 land use types, types 31, 32, and 33 represent the urban area and show 32.5% coverage. Types 31 and 32 are urban residential areas with a high density of buildings in the city. The areas that fall into type 33 are industrial or commercial areas that are newly developed towns or industrial centers. The parts classified below 30 include forests, and open areas or rivers, indicating incomplete urbanization areas [
28]. The KMA has deployed a high-density AWS network of 680 stations over South Korea to collect real-time observations of surface parameters, including rainfall. There are 37 stations located inside Seoul. Among these, 25 observational stations, indicated with red points, are located in the urban area, and 12, shown with green points, are located in the rural areas (
Figure 1c,d). In the subsequent sections, statistical properties are analyzed with respect to the AWS located in Seoul.
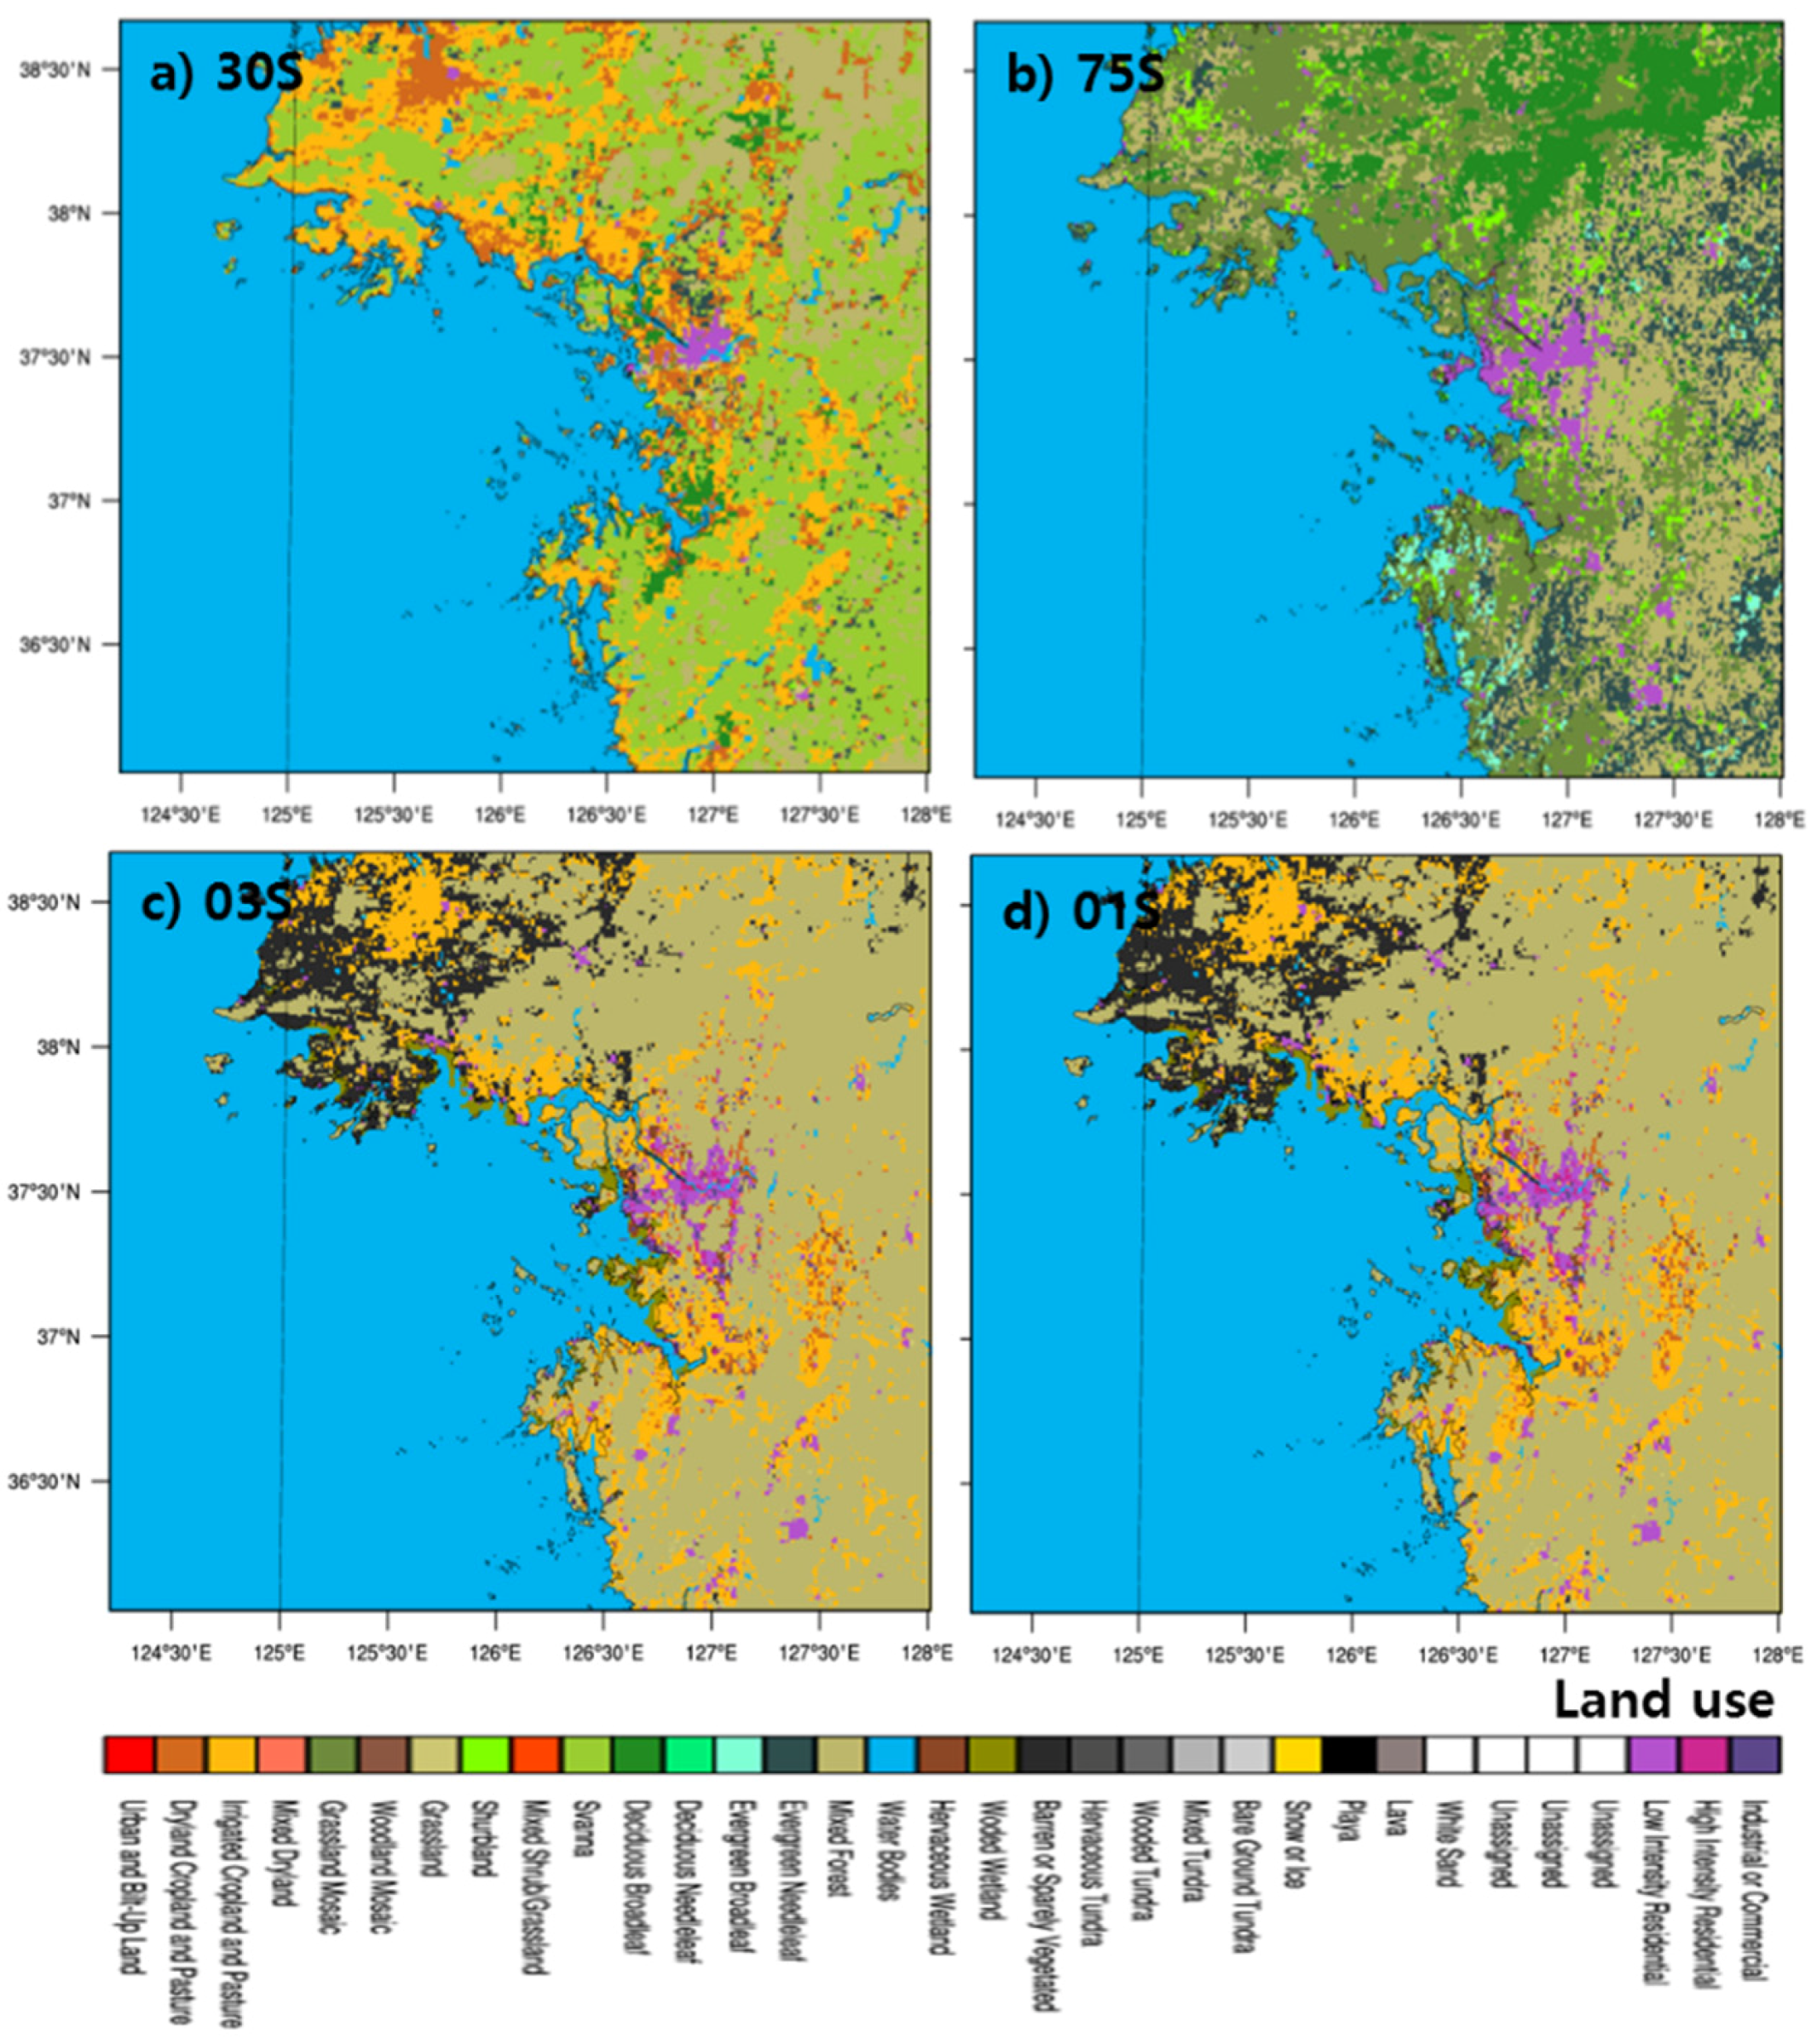
2.3. Topographic Height and Land Use Input Data
The topographic elevations and land surface utilization, after preprocessing the source data via the WRF-WPS, are shown in
Figure 2 and
Figure 3, respectively. The surface heights were calculated by the WRF-WPS, which utilizes its 16 surrounding data and averages them to generate height data, and are consistent with each other and well represented for all resolutions (
Figure 2). However, the distributions of land surface utilization are different from each other (
Figure 3). That is, those for the low-resolution data, i.e., Control and 75S that was produced from USGS data, are different from those for the high-resolution data. Korea is mistakenly classified as a savanna climate, and the metropolitan areas, including Seoul, are currently not keeping up with the development region. However, the high-resolution data of 03S and 01S are classified similar to the current land surface data. This difference arises because the WRF-WPS employs the nearest method to assign land use values on the model grid, and more realistic land use data are obtained from high-resolution data compared with coarser-resolution data.
Furthermore, some parts of the Han River are represented by a land type instead of water type in Control and 75S, but 03S and 01S clearly represent the river well.
Figure 4 shows cross-sectional views of the land surface utilization and the topographical height in west–east and south–north directions around the center of Seoul (37.55°N, 126.97°E). The cross sections are indicated with rectangular boxes with red (south–north direction) and black (west–east direction) colors in
Figure 1d. For the west-east cross section in
Figure 4a, the Han River is located at three different places, which are indicated by the blue box regions. For the coarser resolution data of Control and 75S, the land use does not indicate the water, but it clearly appeared in the higher resolution data of 03S and 01S. This circumstance is the same in the south–north section (
Figure 4b). Note that the topographical heights are the same for all resolutions.
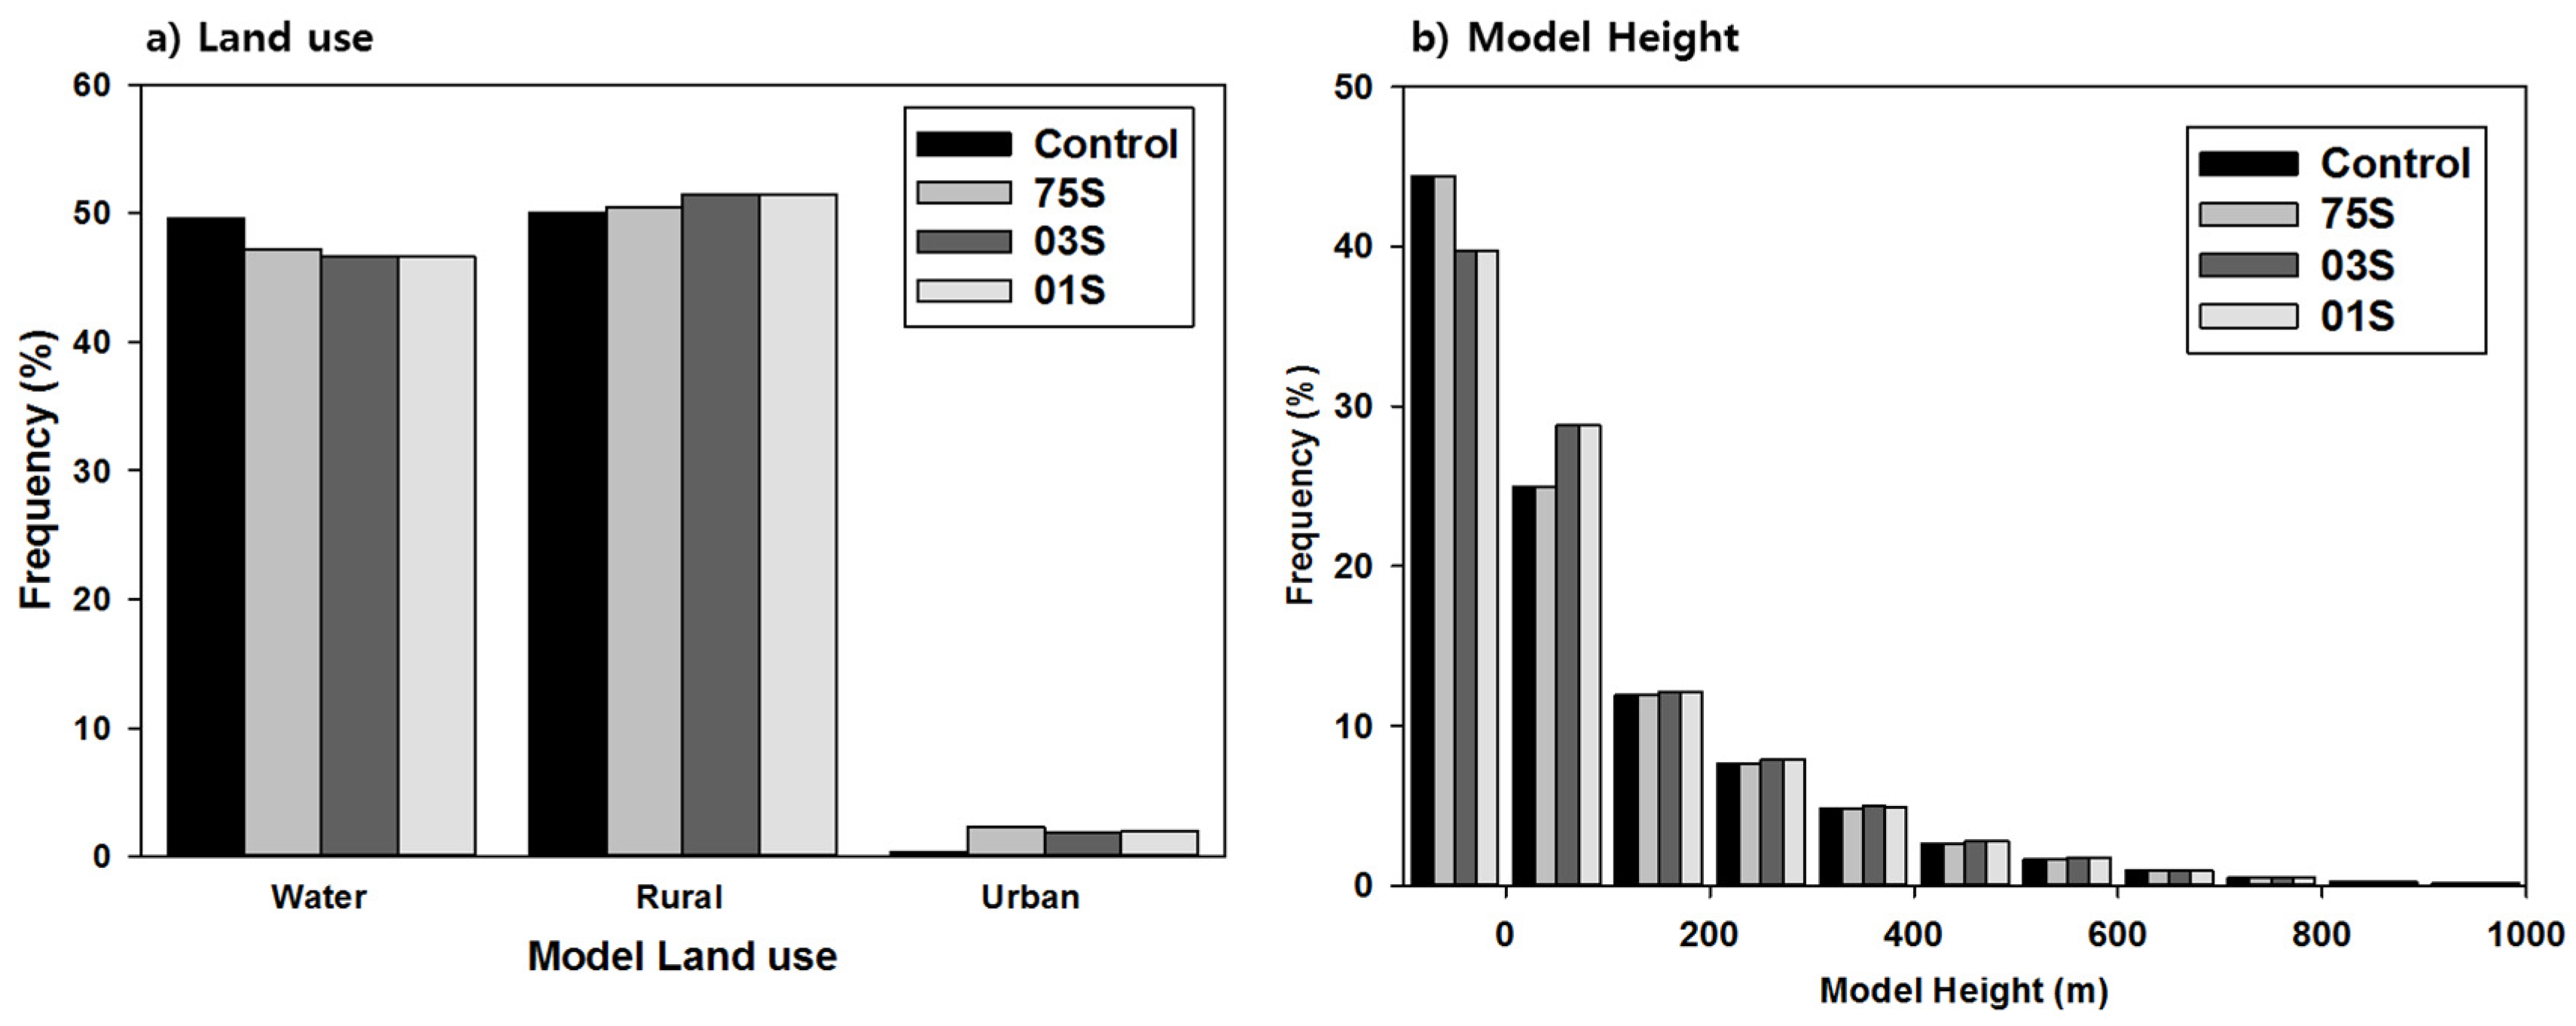
Frequency distributions for the land surface type and topographic altitude are shown in
Figure 5. In the case of Control and 75S, the ratio of region classified as containing water (river and sea) was high, and the ratios of urban and rural regions were low. In particular, the urban area in the low-resolution data turned out to be 5 times less than that in the high-resolution data when using the latest data as compared to the Control data (
Figure 5a). Additionally, the frequency for the altitude of 0 m, corresponding to the ocean level, was 4% or higher compared with those of the high-resolution data used for 03S and 01S. However, for altitudes lower than 100 m, the frequencies of 03S and 01S were 4% larger than those of Control and 75S. Furthermore, the frequencies of 03S and 01S for regions with high altitudes were found to be relatively high (
Figure 5b).
2.4. Statistical Properties
To compare observation with the topographical database constructed previously, the AWS was used for statistical analysis (
Figure 1c,d). For the statistics, the correlation coefficient (CC), deviation (BIAS), and root mean squared error (RMSE) were calculated with respect to the AWS located in Seoul [
29].
Table 3 shows the statistical results for the topographic altitudes of the 37 AWS points and for different altitudes and land surface utilization. The high-resolutions of 03S and 01S showed relatively high CC, low BIAS, and low RMSE. These favorable statistical results are due to the proper representation in the high resolution data of topographic altitudes of less than 100 m, including water, relative to the coarser resolution data. The overall topographic altitude of the model showed a negative deviation of less than approximately 22 m when compared to the altitude of the observatory, and the RMSE was less than 90 m.
Table 4 shows the statistical calculations for land use, and a double contingency table for urban and rural areas was applied to calculate the threat score (TS) and the proportion correct (PC). The TS ranges from zero at the poor end to one at the good end, and PC ranges from zero for no correct forecasts to one when all forecasts are correct [
30]. Similar to the result for topographic altitude, the conformity was high when the land surface utilization was generated using high-resolution data. Hence, when conducting a simulation for a city using previously prepared USGS 30S data, the data need to be verified by using the latest high-resolution land surface data. Overall, when high-resolution data were used, more realistic surface data could be reflected, and the effect of using high-resolution land surface property data had a clear influence on each model input variable, as expected.
3. Experimental Results
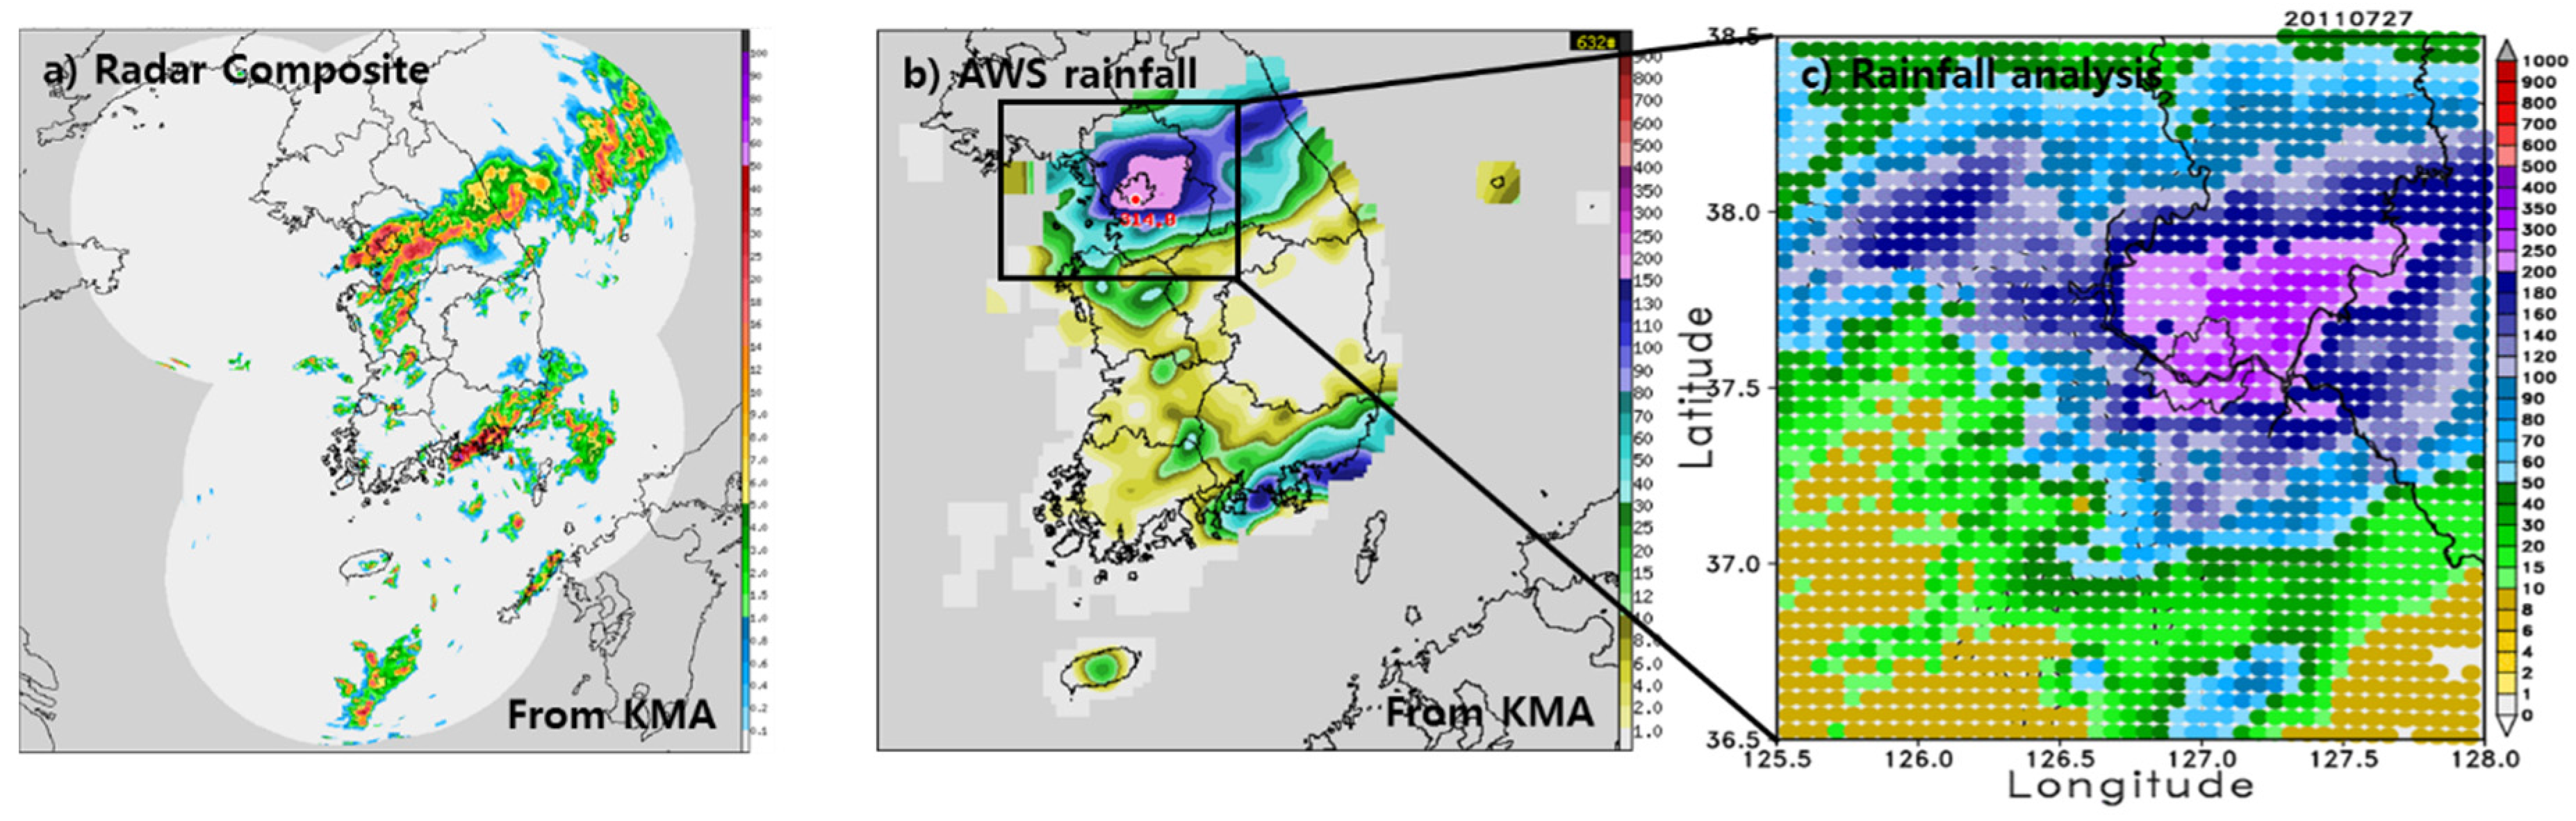
To investigate the effect of meteorological variables such as temperature, wind, and precipitation on forecasting results by the model depending on the topographic height and land use data according to their resolutions in the metropolitan area, a localized torrential rainfall event was selected for numerical simulations. The heavy rainfall event occurred over Seoul, the capital city of Korea, in the mid-western part of the Korean Peninsula, from 26 July 2011 to 29 July 2011 (
Figure 6). Most of the rainfall occurred during the 24-h period from 1200UTC 26 July to 1200UTC 27 July 2011, and produced the maximum rainfall of more than 400 mm per day over Seoul in July. This rainfall led to flash floods and mountain landslides, resulting in heavy casualties and property loss [
31]. In this study, to prevent a possible spin-up problem due to imbalance of the initial condition, the model integration was initiated at 00UTC 26 July 2011, which is 6 h prior to the onset of heavy rainfall. Note that at the time of model initialization, the simulation employed a hot start, such that observations available from KMA including data from radar, AWS, satellite, and so forth were assimilated for the initial condition [
10,
11]. Although the experiment was performed for the 72-h period, the study mostly considers results of the evaluation of the initial 12-h period to reveal the topographic resolution effect for the short forecasting time of 12 h.
3.1. Model Performance
Figure 7 shows the daily accumulated rainfall in the inner domain from 0000UTC 26 July to 0000UTC 27 July 2011. The observation in
Figure 5c shows that the core of the heavy rainfall was located over Seoul and its northwestern areas, and the heavy rainfall cores for all experiments with different resolutions show results that are shifted southeastward. This result is similar to the result of Jang and Hong [
32], in which a core of heavy rainfall was shifted slightly to a different location and the magnitude of precipitation was underestimated. This difference is partly because of the effects of the initial condition, which are significant for short-range forecasts. Higher forecast skill could be achieved either by generating an initial condition via data assimilation schemes or by expanding the region used for the outer domain. Because this study focused only on the high-resolution model forecasting effects of topographical data and the improved results of the forecasting skill are not changed qualitatively in the analysis below, we will pursue improvement in forecast skill in a subsequent study.
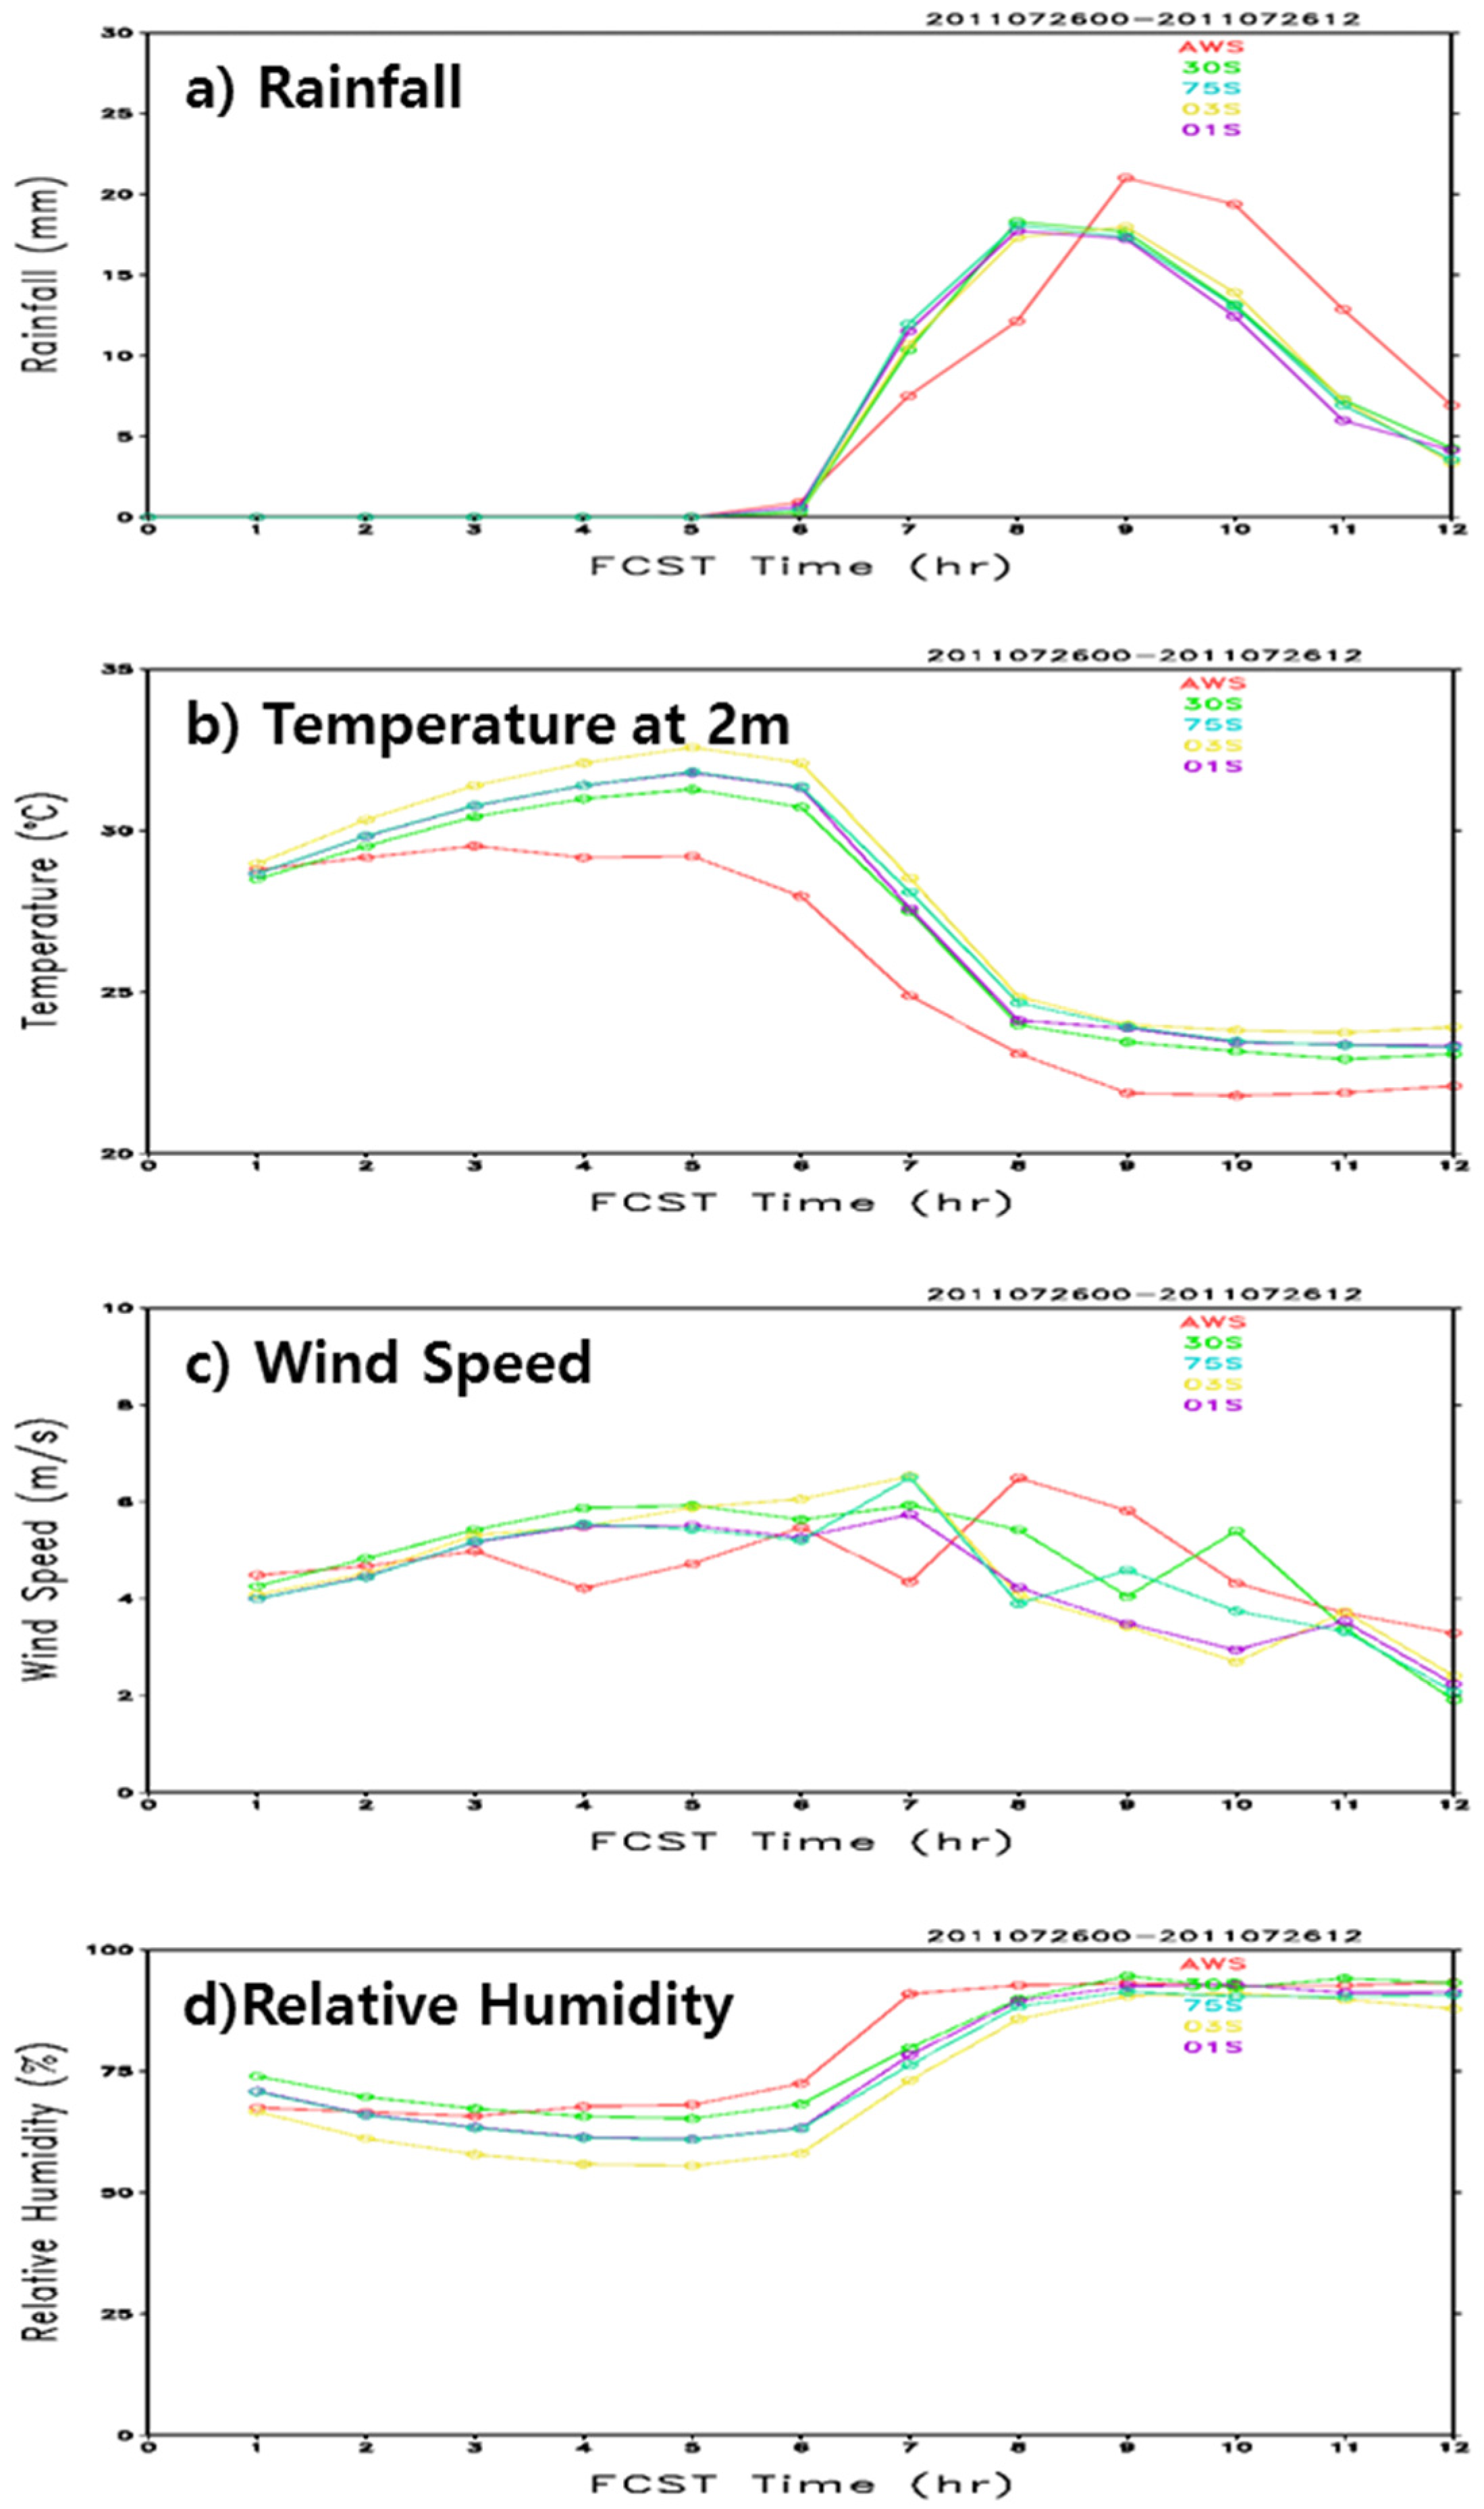
Figure 8 shows time series of 1-h accumulated rainfall, 2-m temperature, 10-m wind speed, and 2-m relative humidity for the model results with various resolutions and also shows time series for the observation of the 37 AWS stations in the metropolitan area, as shown in
Figure 1c. In the figure, the time evolution of the simulated results for all resolutions averaged over the core region (37.3°N–37.8°N, 126.7°E–127.3°E) is compared to the observations (red lines in
Figure 8). It is well known that global models overestimate light precipitation and underestimate heavy rainfall due to the low horizontal resolution compared to the scale of the precipitation core [
32,
33]. Additionally, for better performance of high-resolution models, efforts are being made in the field of physical parameterization.
For all experiments with different resolutions of topographical data, the precipitation amounts were similar to the observation, which demonstrates that the initial rainfall over the core region was well represented. However, in all experiments, the major peak was still underestimated and the rainfall at the later times showed a reduction of magnitude. The effect of the data resolutions on model precipitation seems very small. The model predictions of temperature and relative humidity clearly showed high correlation of no less than 0.95 with the observation, and these results are similar to those described in Zhang et al. [
7]. Compared to the observation, the model wind speed was overestimated during the initial simulation time and then underestimated during later times, which led to low correlation coefficients of at most 0.47. The model results for 03S and 01S with high-resolutions were relatively lower than those for Control and 75S. Overall, the temporal evolution of the model results for all resolutions was comparable to the real observations.
It is notable that the result showed that the model temperature was overestimated by about 3 °C, and that the model relative humidity was underestimated with a maximum difference of 20%. For high-resolution data, Grossman-Clarke et al. [
5] showed no obvious tendency for overestimation or underestimation of temperature, whereas Paiva et al. [
34] showed underestimated temperature compared to observation. The performance of the high-dimensional models was more sensitive than that of the coarser resolution model, and this was due partly to the well-represented topographical relief data in the high-resolution models. However, further investigation is needed.
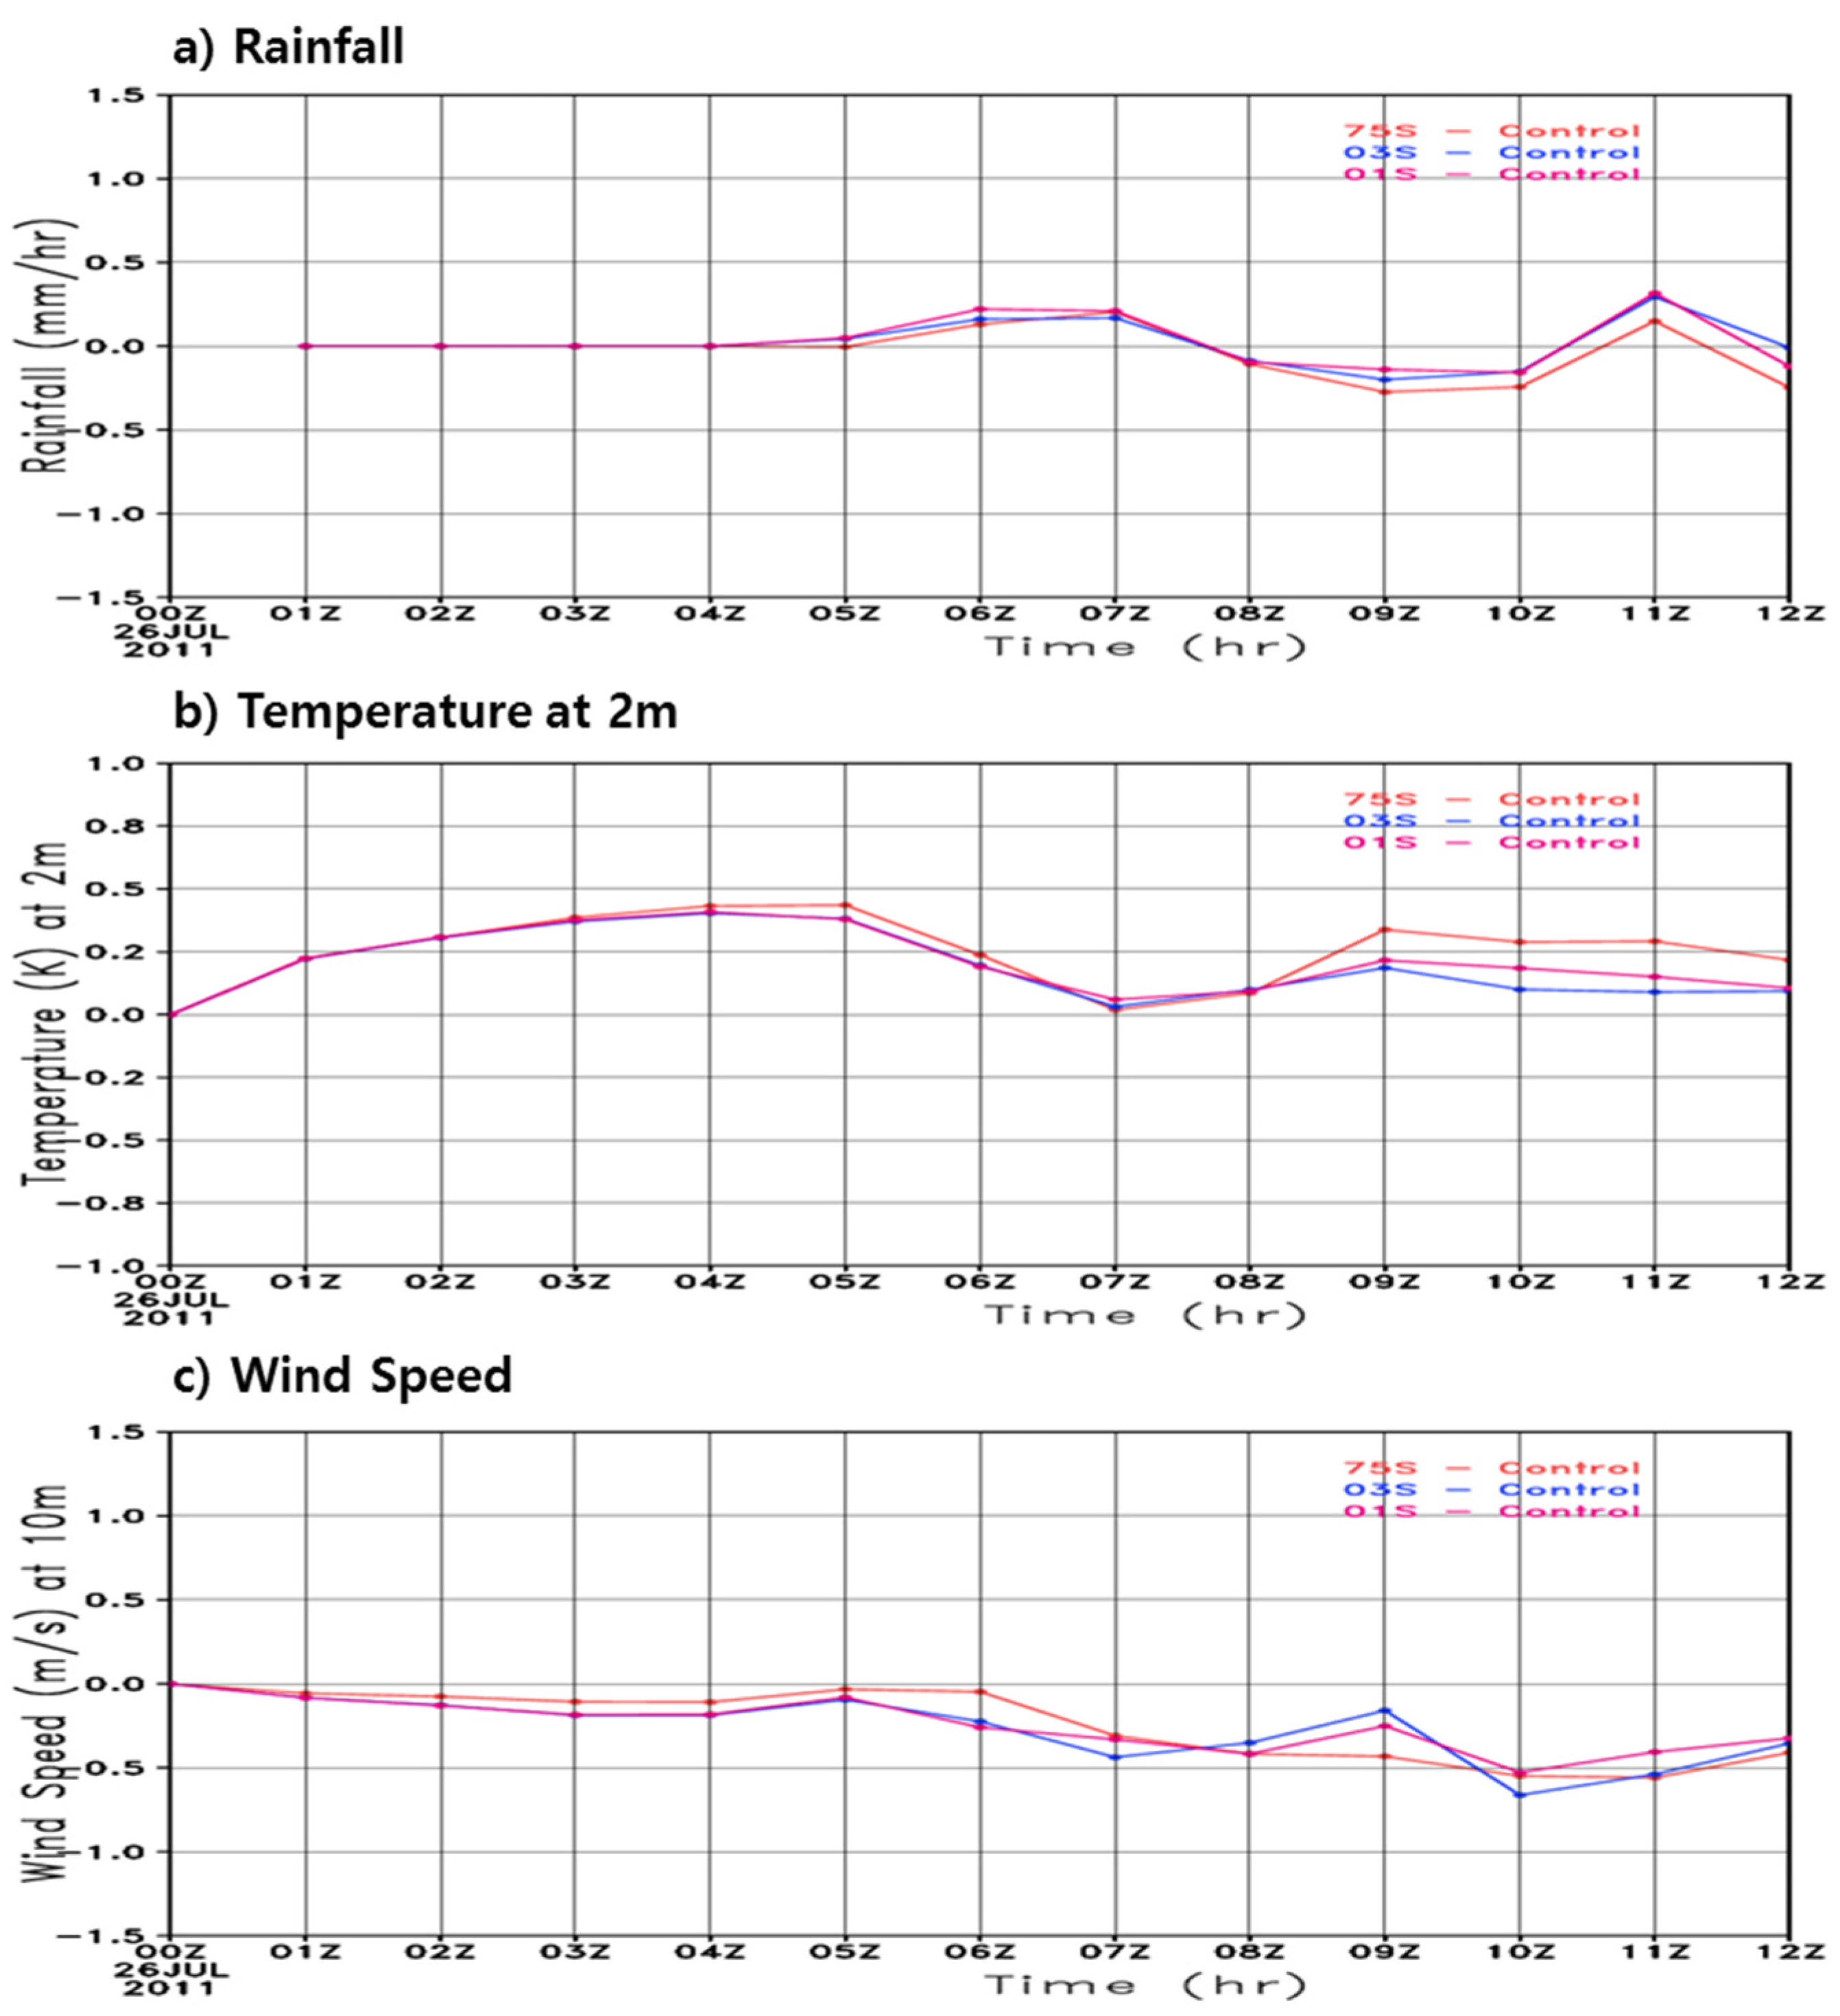
3.2. Topographical Effects
The model performance with the high resolution source data was generally more sensitive to the resolution of the source data than with the coarse-scale models [
7] and the different resolutions of the source data affected the model performance. To investigate the relative model performance with respect to resolutions of source data, time series of difference fields relative to Control were calculated over the high precipitation region (37.3°N–37.8°N, 126.5°E–127.5°E) in Seoul and are shown in
Figure 9. For rainfall, the correlation for the higher resolutions was relatively low compared to those of the other variables, and the maximum difference was within 2.5 mm/h (
Figure 9a). Additionally, the maximum difference of the temperature values was less than 1 °C, and the deviation was large during the day and small at night (
Figure 9b). The wind speed was mostly under-simulated relative to Control (
Figure 9c). Overall, the differences of the model forecasting results were not as obvious as the effect of the difference of the source data. In
Figure 5, however, the ratio of the model input data against the source data shows a difference of about 4%, and thus the spatially averaged results did not imply that there was not significant improvement for the surface variables. The greatest difference between the high-resolution and coarser-resolution data appeared in the representation of the Han River. To identify the effect of the data resolution, we investigate the vertical section in the following
Section 3.3.
3.3. Vertical Profiles
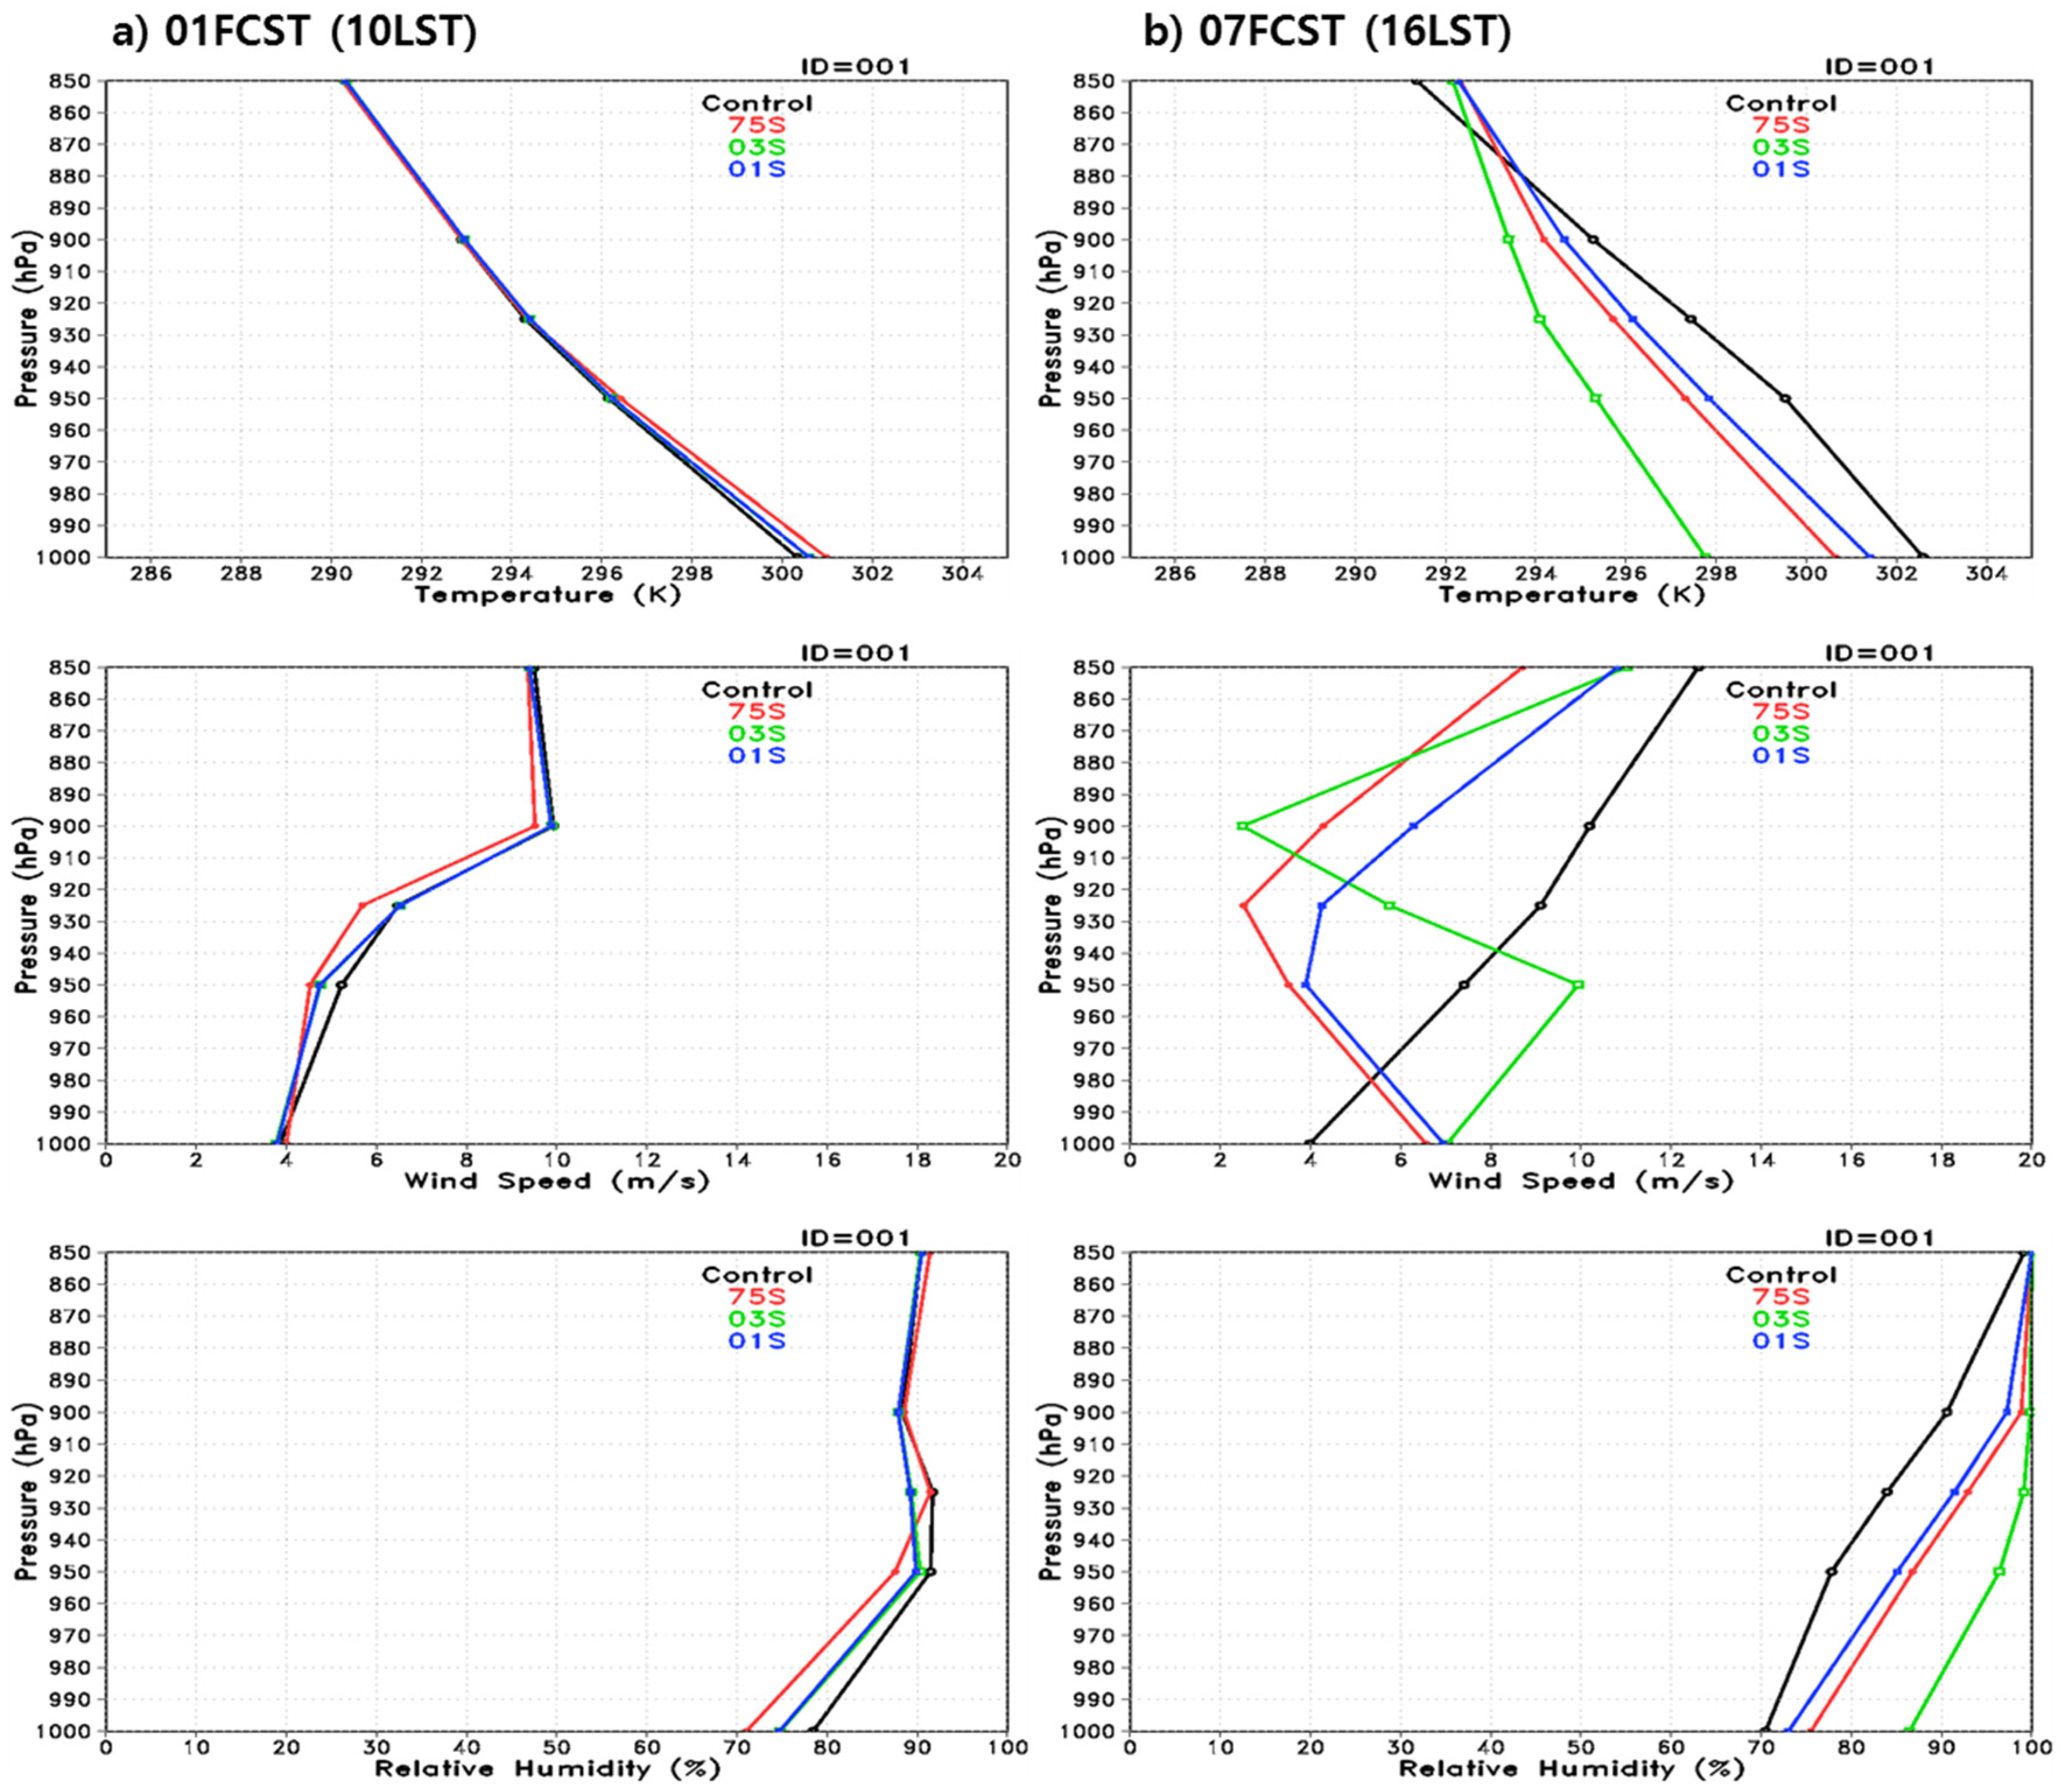
To reveal the effect of the topographical effects, the profiles for temperature, wind speed and relative humidity were investigated at the location of the Han River, where the type of land use was assigned differently among the simulations.
Figure 10 shows the vertical profiles of temperature, wind speed, and relative humidity at 0100UTC and 0700UTC for the Han River at the location of 37.521°N, 126.954°E. The weather variables seemed similar during the initial simulation time, but as the forecasting time became longer, the numerical model performances depending on the topographical data showed different results. All simulations except for simulation 03S showed a linear pattern so that the vertical profiles for the weather variables showed parallel shifting as the resolutions increased. Simulation 03S seemed to not follow the pattern. In particular, its profile of wind speed was not consistent with those of the other simulations. This demonstrates the complexity of scale matching for better model performance when combining high-resolution topographical data with the numerical model. The results are similar to those of other studies [
35,
36,
37,
38].
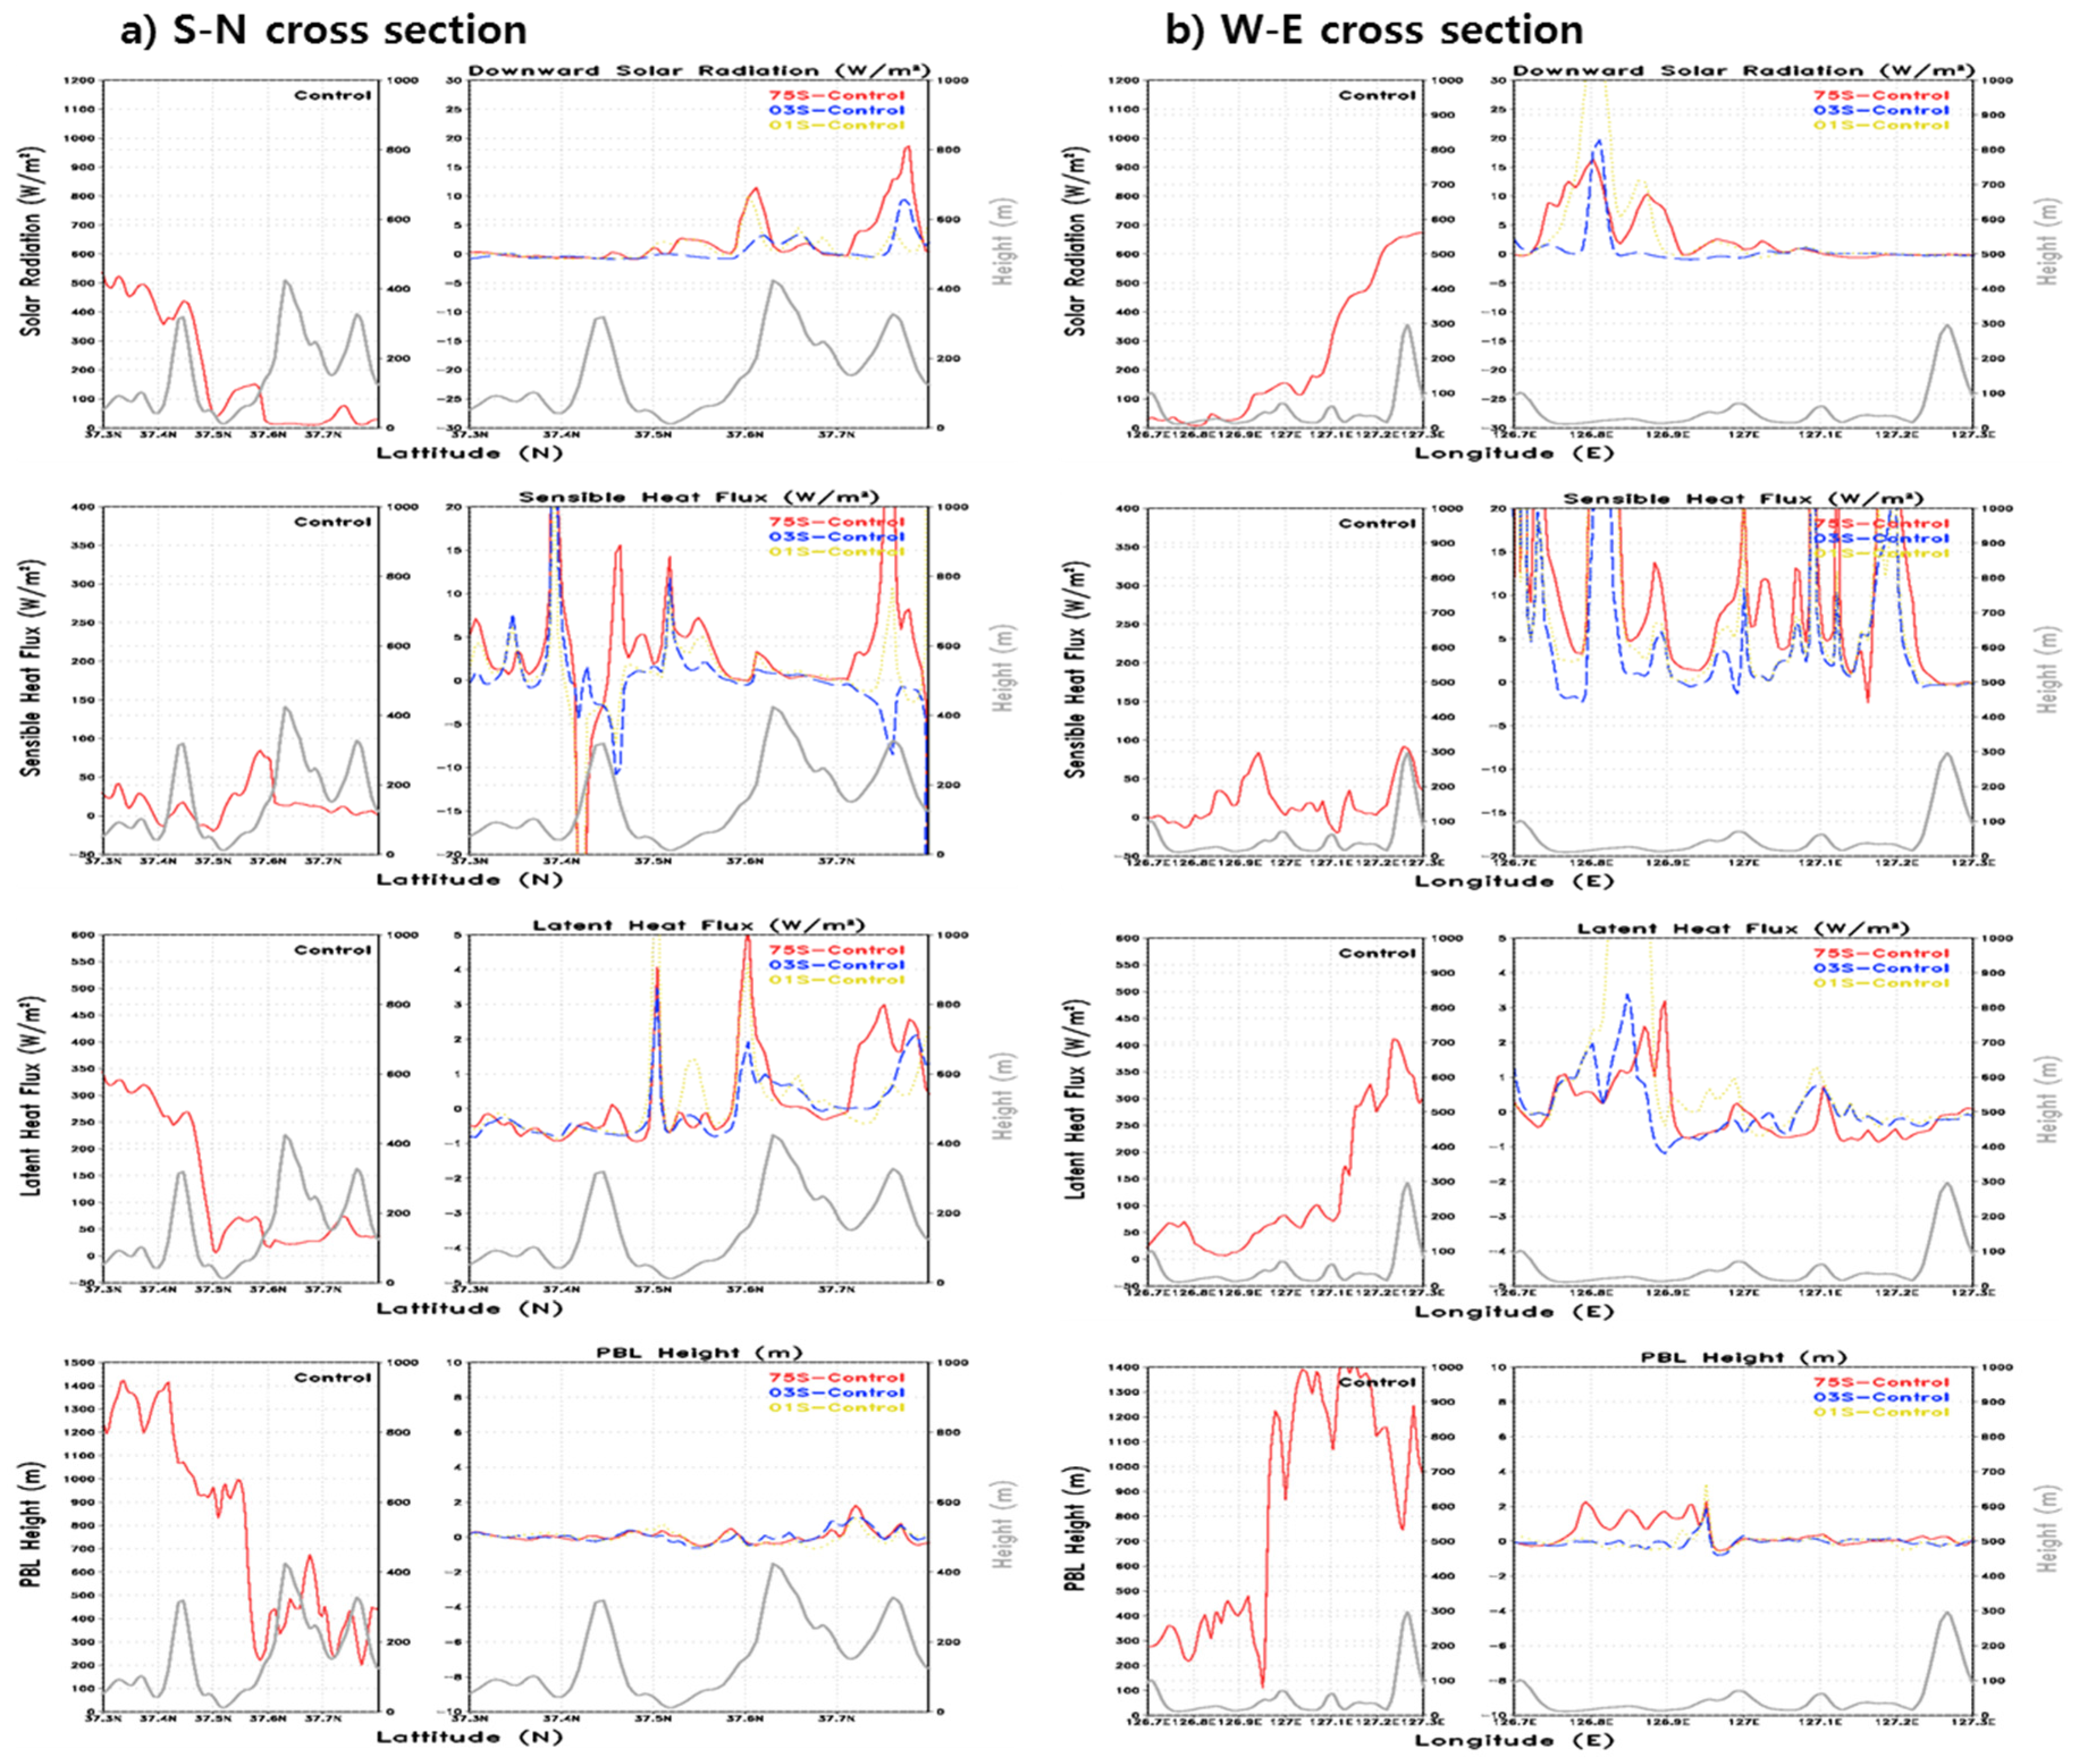
In order to observe changes in the weather variable according to each land surface property in more detail, the changes in the weather variables in the east–west and north–south directions (rectangles in
Figure 1d) were examined.
Figure 11 shows the relative differences for solar radiation, sensible heat flux, latent heat flux, and PBL height at 0700UTC. For both directions, the same result was obtained for the vertical distribution. For the high-resolution data of 03S and 01S, which were similar to the actual topography, changes in sensible heat flux and latent heat flux were clearly visible in the Han River region, showing changes in 2 m temperature and wind speed. As complex topography and urban area approached reality, the complex properties were clearly reflected in the temperature and wind speed. In the region over the river, the heating affecting the temperature and wind speed was weakened. With regard to the temperature of the land surface, the energy was transferred in the form of sensible heat and latent heat to the adjacent atmosphere, and the temperature, humidity, and wind speed near the land surface changed; these changes eventually affected the boundary layer altitude [
3,
6,
39]. That is, the analysis of solar-radiant energy reaching the land surface, land surface temperature, sensible heat flux, latent heat flux, temperature, humidity, wind speed, and boundary layer altitude, which are variables having large influence according to the horizontal topographic properties in the east–west and north–south directions, showed that these variables had a clearer influence in the morning and the afternoon than at midday. It is notable that due to the change in temperature and wind speed, the boundary layer altitude changed, which affected rainfall, but the influence is deemed insignificant. This is consistent with the results of precipitation shown in
Figure 8a.
3.4. Additional Sensitivity Analysis
Previous studies have shown that high resolution numerical models are more sensitive to high resolutions of DEM data than coarse-scale numerical models [
5,
7,
35]. In this study, when the numerical model had the high resolution of 1 km, the model forecasting results with the higher resolution DEM data showed a similar pattern. The better topographical expression was not sufficient to improve model forecasting simulation for the surface, but there was a clear positive effect in model results in the vertical profiles. Because the results should not be overly sensitive to the event, an additional sensitivity study was carried out in order to test this inference. For the sensitivity study, a regional torrential rainfall event from 22 July to 24 July 2015 was investigated. According to the KMA weather chart, the day of 22 July 2015 was clear, but on 23 July, damp air moved by wind from the southeast constantly moved in, causing the precipitation belt to move from the Yellow Sea toward the northeast and heavy regional rainfall to occur over and around Seoul. In the observations, there was an approximately 50 mm 12-h accumulated rainfall in the metropolitan area on this day.
The model predicted regional rainfall, but the amount of rain was too large. Wind speed also showed a tendency for the overestimation, as observed in the previous event. For 2-m relative humidity, the model tended to be relatively dry. Thus, the predicted relative humidity was about 60%, whereas the observation was about 75%. The 2-m temperature was similar to the observations, but the minimum temperature was simulated more than 5 °C lower than that of the observation, which is an opposite trend compared to the previous case. As mentioned previously in
Section 3.1, to make a practical contribution to meteorological simulation, this sensitivity study along with other literature [
5,
7,
35] illustrated the significance of scale matching between topographical data and numerical model. For the model variables of wind speed and relative humidity, the difference depending on the topographic data was not large, as in the previous event. The statistics shown in
Table 5 indicate that the overall tendency was similar to that of the event of 26 July 2011, i.e., the model results from the finer resolutions of 03S and 01S showed statistically better performances than those from the coarser resolutions of Control and 75S. However, the tendency to use finer-scale topographical data seems to not be deterministic, and the best model performance always depends on the optimal combination of the scale effect and the mechanisms of numerical models [
7].
4. Summary and Remarks
In this study, 12-h numerical simulation experiments were conducted for 26 July 2011 and 22 July 2015 from 0000 UTC, and the sensitivity of the WRF model according to topographic resolution and land surface utilization in the metropolitan area, including Seoul, was analyzed. As a result of analyzing the topography data and land surface utilization, it was clearly shown that as the resolution increased, the actual topography and land surface utilization data became similar to the actual metropolitan properties. In particular, by comparing the topographic altitude and land surface utilization from 37 AWS observatory points, it was confirmed that the conformity of the high-resolution data was high. Additionally, it was confirmed that by using the latest data, a detailed classification of the residential, industrial, and commercial areas within the city could be applied to configure the numerical model.
Based on the numerical simulation experiment, it was found that the prediction result at each resolution generally indicated that the difference from the topographic effect on rainfall was small. In the sensitivity experiment in which the rainfall was mild, data for the temperature and wind speed variables were confirmed to be similar to the AWS observation data based on the change in topographic property data. However, analysis showed that the degree of the direct impact on rainfall and relative humidity caused by the topographic effect was low. The sensitivity according to the topographic data was analyzed by using temperature and wind speed, and the time variability of these was similar to the observation data. With regard to the changes in vertical temperature and wind speed in Seoul, the point of ground observation, the analysis showed that the changes in temperature and wind speed were clear when data with higher resolution were used; however, in the case of 75S, which was established from MODIS data, the effects were not consistent because of the synthesis of the data.
Recently, a high-resolution database for numerical models has been expected, but it has been difficult to collect and establish global data. In this research, the topographic property data of the model were established based on GIS data collected by national institutions and were applied to the numerical model. It is common sense that the more detailed the topographical data produced, the more rigorous the expression of topographical features, which generally leads to the more accurate forecasting skill of the models [
7,
40,
41,
42]. That is, in general, it is believed that more accurate input data generate better numerical results, and many studies show improved model performances with more accurate input data. This study showed that the topographical terrain data with resolution higher than the model resolution result in significant improvement in representation of the topographical heights and land use. It is because WRF-WPS utilized its 16 surrounding data and averaged them to generate the height data. Thus, the input data for topographical height are approximately averaged over 120 m
2, 360 m
2, 900 m
2, and 3600 m
2 for the terrain data of 01S, 03S, 75S, and Control, respectively. Also, WRF-WPS employs the nearest method for land use, which assigns a model grid with the closest land use value to the given grid. Hence, the more accurate terrain data generated, the more accurate the topographical input data. Therefore, it is natural to expect improved model performance. However, even if there are some improvements in model performance, the numerical results do not indicate a significant difference. This is still needed for further experiments in order to achieve better model performance.
This study was focused on evaluating the effect of topographical data, which had resolutions higher than the numerical model resolution, on model performance. Additionally, this study showed that the high-resolution models were more sensitive to variation in the terrain database. Furthermore, terrain data are more accurate with higher resolution due to new observing networks. For example, SK planet data (automated Weather Stations) in Seoul have a 1-km spatial resolution on average. Meanwhile, high-resolution models are run more or less at 1 km due to the computation cost. It is thus important to evaluate what terrain data are better for the model performances. However, it was difficult to determine the direct relationship of spatial resolutions between the topographical data and the forecasting models, and it is also obvious that the relationship is not simply linear [
7]. Although the results of this study may inconclusively support that high-resolution of topographical data is advantageous, the best model performance can be obtained by scale-matching of the data and the model.


