Article

Influence of Trans-Boundary Air Pollution on the Urban Atmosphere in Fukuoka, Japan

1
Center for Regional Environmental Research, National Institute for Environmental Studies, Ibaraki 305-8506, Japan
2
National Institute of Advanced Industrial Science and Technology, Ibaraki 305-8569, Japan
3
Institute of Agriculture, Tokyo University of Agriculture and Technology, Tokyo 183-8509, Japan
4
Department of Earth System Sciences, Fukuoka University, Fukuoka 814-0180, Japan
*
Author to whom correspondence should be addressed.
Atmosphere 2016, 7(4), 51; https://doi.org/10.3390/atmos7040051
Submission received: 9 February 2016 / Revised: 11 March 2016 / Accepted: 24 March 2016 / Published: 30 March 2016
(This article belongs to the Special Issue Air Pollution in the Asia-Pacific Region)

Abstract

:
To understand the influence of trans-boundary air pollution on the air quality of Fukuoka, the mass concentration and chemical composition of fine particulate matter (PM) were observed at urban (Fukuoka) and rural (Fukue Island) sites in the northern Kyushu area in Japan. Chemical composition was measured using an aerosol mass spectrometer. Organic aerosol (OA) data were analyzed by the positive matrix factorization (PMF) method. Sulfate and low-volatile oxygenated OA (LV-OOA) were dominant for all of the PM2.5 mass variations on Fukue Island, where the trans-boundary air pollution is dominant in the winter-spring season. In Fukuoka, however, sulfate accounted for the largest fraction of total chemical species under high PM2.5 mass concentrations (>35 µg·m−3), while organics and nitrate made up a large fraction under low PM2.5 (<10 µg·m−3). Under the high PM2.5 condition, LV-OOA was also dominant. This indicates that high PM2.5 mass concentrations were attributed to the long-range transport of air pollution. Although the trans-boundary air pollution prevails in the winter-spring season, high sulfate concentrations were observed in the summer of 2012. In addition to the volcanic activities and photochemical reactions, long-range, trans-boundary air pollutions are influential factors not only in winter-spring but also in summer.

1. Introduction

Air pollution emissions from East Asia have increased in recent years in connection to rapid economic growth. Kurokawa et al. [1] reported that emission of air pollutants in East Asia significantly increased from 2000 to 2008. These air pollutants mainly consist of sulfur dioxide (SO2), nitrogen oxides (NOx), carbon monoxide (CO), volatile organic compounds (VOCs), and their emissions in 2008 (growth rate between from 2000 to 2008) were increasing 56.9 Tg (+34%), 53.9 Tg (+54%), 359.5 Tg (+34%), and 68.5 Tg (+46%), respectively. China contributed to the Asian emissions for largest fraction in Asian countries because of continuous increase in its energy consumption, and their emissions of each species are 33.5 Tg (+46%), 27.0 Tg (89%), 202.0 Tg (+42%), and 27.1 Tg (+71%), respectively [1]. It is reported that SO2 emissions in China decreased after 2006 [2]; however, emissions of these air pollutants in China still increased monotonically [1]. It is well known that these air pollutants are transported throughout the continent from China to Japan with seasonal monsoons in winter and spring [3,4,5,6,7,8,9]. Many recent studies reported that atmospheric aerosol was transported from mainland China to the northern part of the Kyushu area and Okinawa, which face the East China Sea in Japan [3,4,5,6,7,8,9]. In these studies, high concentrations of particulate matter (PM2.5), which were noted to be over environmental quality standards in Japan for 24 h of 35 µg·m−3, were observed. We observed chemical composition of atmospheric aerosol by using an aerosol mass spectrometer and a filter sampling method at Cape Hedo in Okinawa, and on Fukue Island, Nagasaki, in Japan in previous studies. Both sites are located on the windward side of the seasonal monsoons in winter and spring. High concentrations of sulfate were observed when the air mass was transported from mainland China to these sites [3,4,8,9,10,11,12].These high values were considered to be due to trans-boundary air pollution [3,4,8,9,10,11,12]. It is, therefore, important to understand the transport of air pollutants including PM.
Fukuoka, one of the largest cities in Japan, is located in the northern part of the Kyushu area in the western part of Japan. The population of Fukuoka is about 1.5 million and there are numerous commercial, residential, and industrial areas. Therefore, local emission in Fukuoka is expected to be high. Since Fukuoka is influenced by both local emissions and long-range transported air pollution, the city’s exposure to air pollution is expected to be high [9]. In order to improve Fukuoka’s air quality, it is necessary to assess the contributions from both local and transported air pollutants.
PM mass concentrations and chemical composition were observed on Fukue Island, which is in a rural area located in the East China Sea, approximately 180 km west of Fukuoka. Although Fukue Island is mostly influenced by transported air pollutants, a similar level of PM2.5 mass concentrations were observed in both Fukuoka and Fukue Island, despite a large difference in local emissions [6,7]. This indicates that air pollution transported from mainland China, spreads over a very wide area, which includes both Fukuoka and Fukue Island.
PM mass concentration and chemical composition were measured both in Fukuoka and on Fukue Island in order to assess the contributions from both local and transported air pollutants. The chemical composition of PM reflects their transport process [9]. Thus, we measured PM mass and chemical composition and classified the chemical composition with respect to PM2.5 mass concentration. A positive matrix factorization (PMF) method was applied to analyze the organic composition, which is also considered to reflect their transport process.

2. Experiments

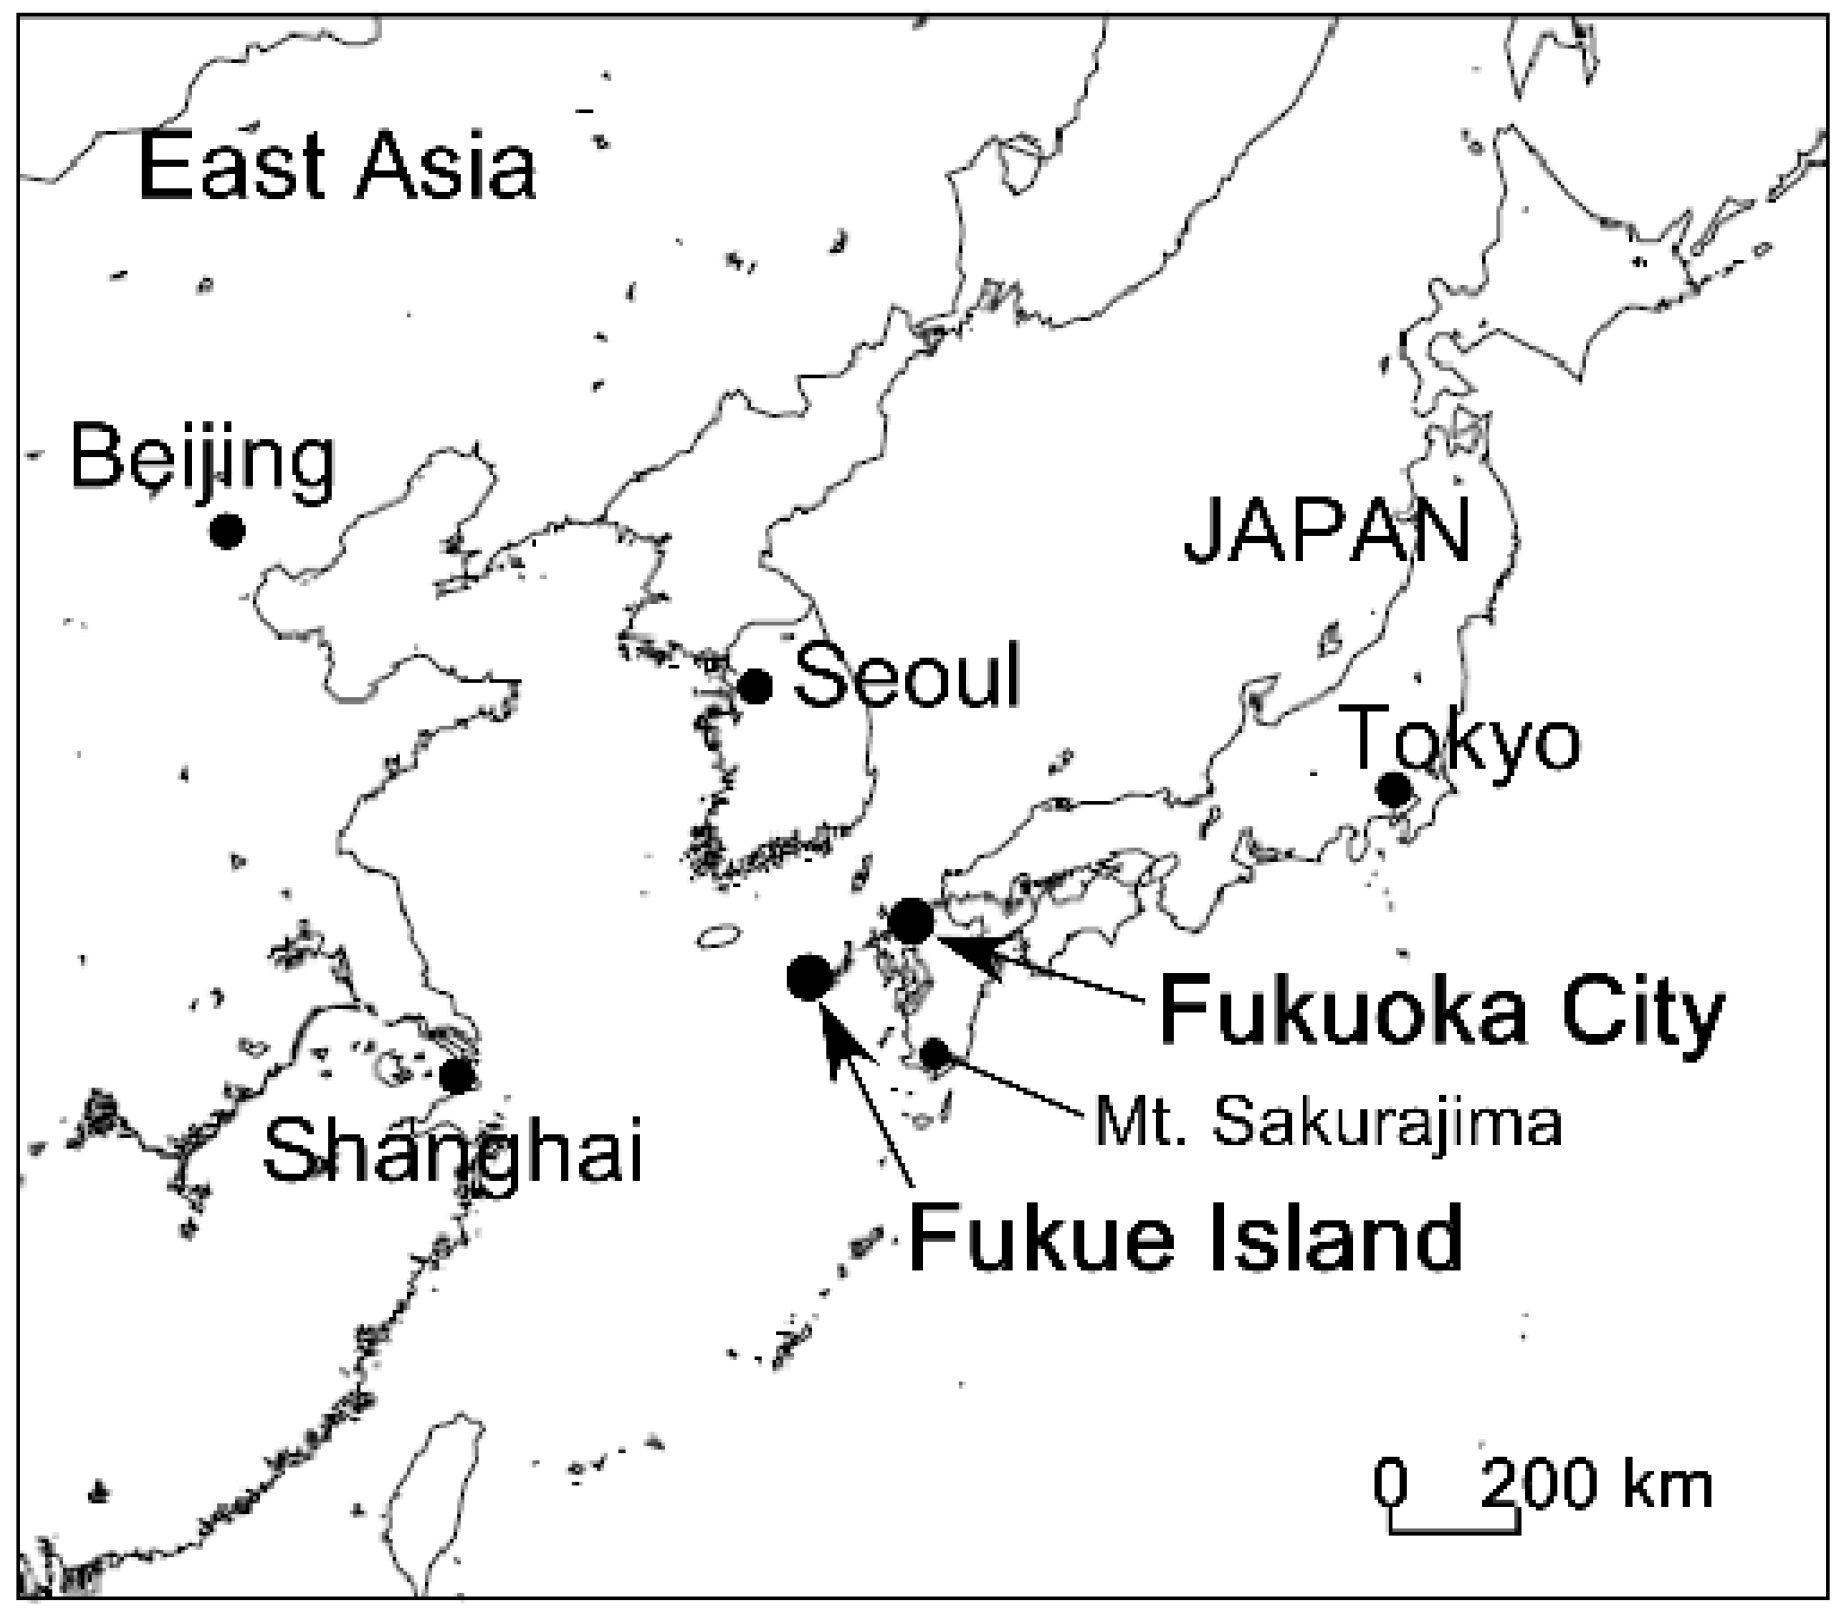
2.1. Locations and Periods

The chemical composition and mass concentration of atmospheric fine aerosol, i.e., particulate matter (PM), were observed in two sites in 2012 (Figure 1). The first was an urban site: Fukuoka, Fukuoka prefecture (33.55°N, 130.36°E). The observation was carried out at the Fukuoka University, which is located 5 km away from the downtown area and the city highway is about several hundred meters away. Fukuoka is one of the largest cities in Japan with a population around 1.5 million. There is a large network of transportation infrastructure including railways, highways, and the airport [6,7,9]. The second observation site was rural: Fukue Island, Nagasaki prefecture (32.75°N, 128.68°E). The population is approximately 40,000 and it is generally considered to have few emission sources [3,5,6,7]. Observations were conducted throughout 2012, with the exception of summer (from June to September) on Fukue Island.

2.2. Instruments

The chemical composition of fine aerosol (PM1) in Fukuoka City was observed by using a quadrupole-type aerosol mass spectrometer (Q-AMS, Aerodyne Research Inc., Billerica, MA, USA. An aerosol inlet with PM2.5 cut cyclone (URG-2000-30ED, URG Co., Chapel Hill, NC, USA) was set on a window of the fourth floor of the Faculty of Science Building (about 20 m from the ground) at Fukuoka University. The cyclone removed coarse particles. Sample air was introduced through an o.d. 3.18 mm stainless steel tube (main sampling line with o.d. 12.7 mm connected to the inlet tube for the implementation of isokinetic sampling), 0.1 mm pore size orifice, and an aerodynamic lens into the Q-AMS with the flow rate at 0.1 L·min−1. The sample air was separated into gases and aerosols by the aerodynamic lens and particle beam formed. The particle beam hit the vaporizer, with a temperature set to 873 K (600 °C), and where non-refractory species in the aerosol were vaporized. The vaporized molecules were ionized by the electron impact method with 70 eV. The ions were analyzed using a quadrupole type mass spectrometer. The particle mass was calibrated using ammonium nitrate (NH4NO3) particles with a 350 nm diameter, and the ionization efficiency (IE) and the relative ionization efficiency (RIE) were determined. The averaged IE for NO3 was 7.50 × 10⁻⁷, RIE for NH4+ was 3.36. The collection efficiency (CE) for all the measured species was 1.0. Sulfate, nitrate, ammonium, and chloride were calculated from the fragment signals of the mass spectra. Organics were calculated by subtracting the known inorganic and gaseous species, such as sulfate, nitrate, nitrogen, oxygen, and argon from the total mass. The details of the Q-AMS and calibration procedures are described in the literature [3,4,13,14,15,16,17]. For measuring PM2.5 mass concentrations, an air pollution monitoring station using beta-ray absorption technique was set up at Kashii which belongs to municipal government offices of Fukuoka City.
On Fukue Island, aerosol chemical composition was measured using a quadrupole-type aerosol chemical speciation monitor (Q-ACSM, Aerodyne Research Inc., Billerica, MA, USA). The Q-ACSM is a simplified version of Q-AMS, and the principle of the measurement is also the same. The averaged IE for NO3 was 2.82 × 10⁻¹¹, RIE for NH4+ was 6.03. The CE for all the measured species was 0.5. The sampling inlet with cyclone was set to the rooftop of the building at the Observatory of Atmospheric Environment on Fukue Island (about 3 m from the ground). Mass concentrations of PM2.5 were measured using a tapered element oscillating microbalance (TEOM, Model 1400a, R&P Co. Inc., East Greenbush, NY, USA).

2.3. Analysis

Organic data obtained by Q-AMS and Q-ACSM were analyzed by the PMF method, originally invented by Paatero [18,19]. The analysis was carried out using the PMF evaluation tool for the aerosol mass spectrometer developed by Ulbrich et al. [20]. PMF is a receptor-only factorization method. PMF method processes multiple environmental data and calculates factor profiles and contributions. All of the values in the profiles and contributions are constrained to be positive. Since we measured the aerosol chemical composition only in the receptor area (Fukuoka City and Fukue Island), we adopted the PMF method to analyze our Q-AMS and Q-ACSM organic data. The factor profiles and contributions can provide sources of organic aerosol measured by Q-AMS and Q-ACSM.
Backward trajectories were calculated using the National Oceanic and Atmospheric Administration (NOAA) Hybrid Single Particle Lagrangian Integrated Trajectory Model (HYSPLIT) [21,22] to track the pathway of air mass (NOAA Air Resouces Laboratory, College Park, MD, USA). Starting altitude and calculation time were set to be 500 m and 48 h, respectively. The spatial distribution of sulfate was also investigated using Chemical Weather Forecasting System (CFORS) numerical simulations [23,24].

3. Results

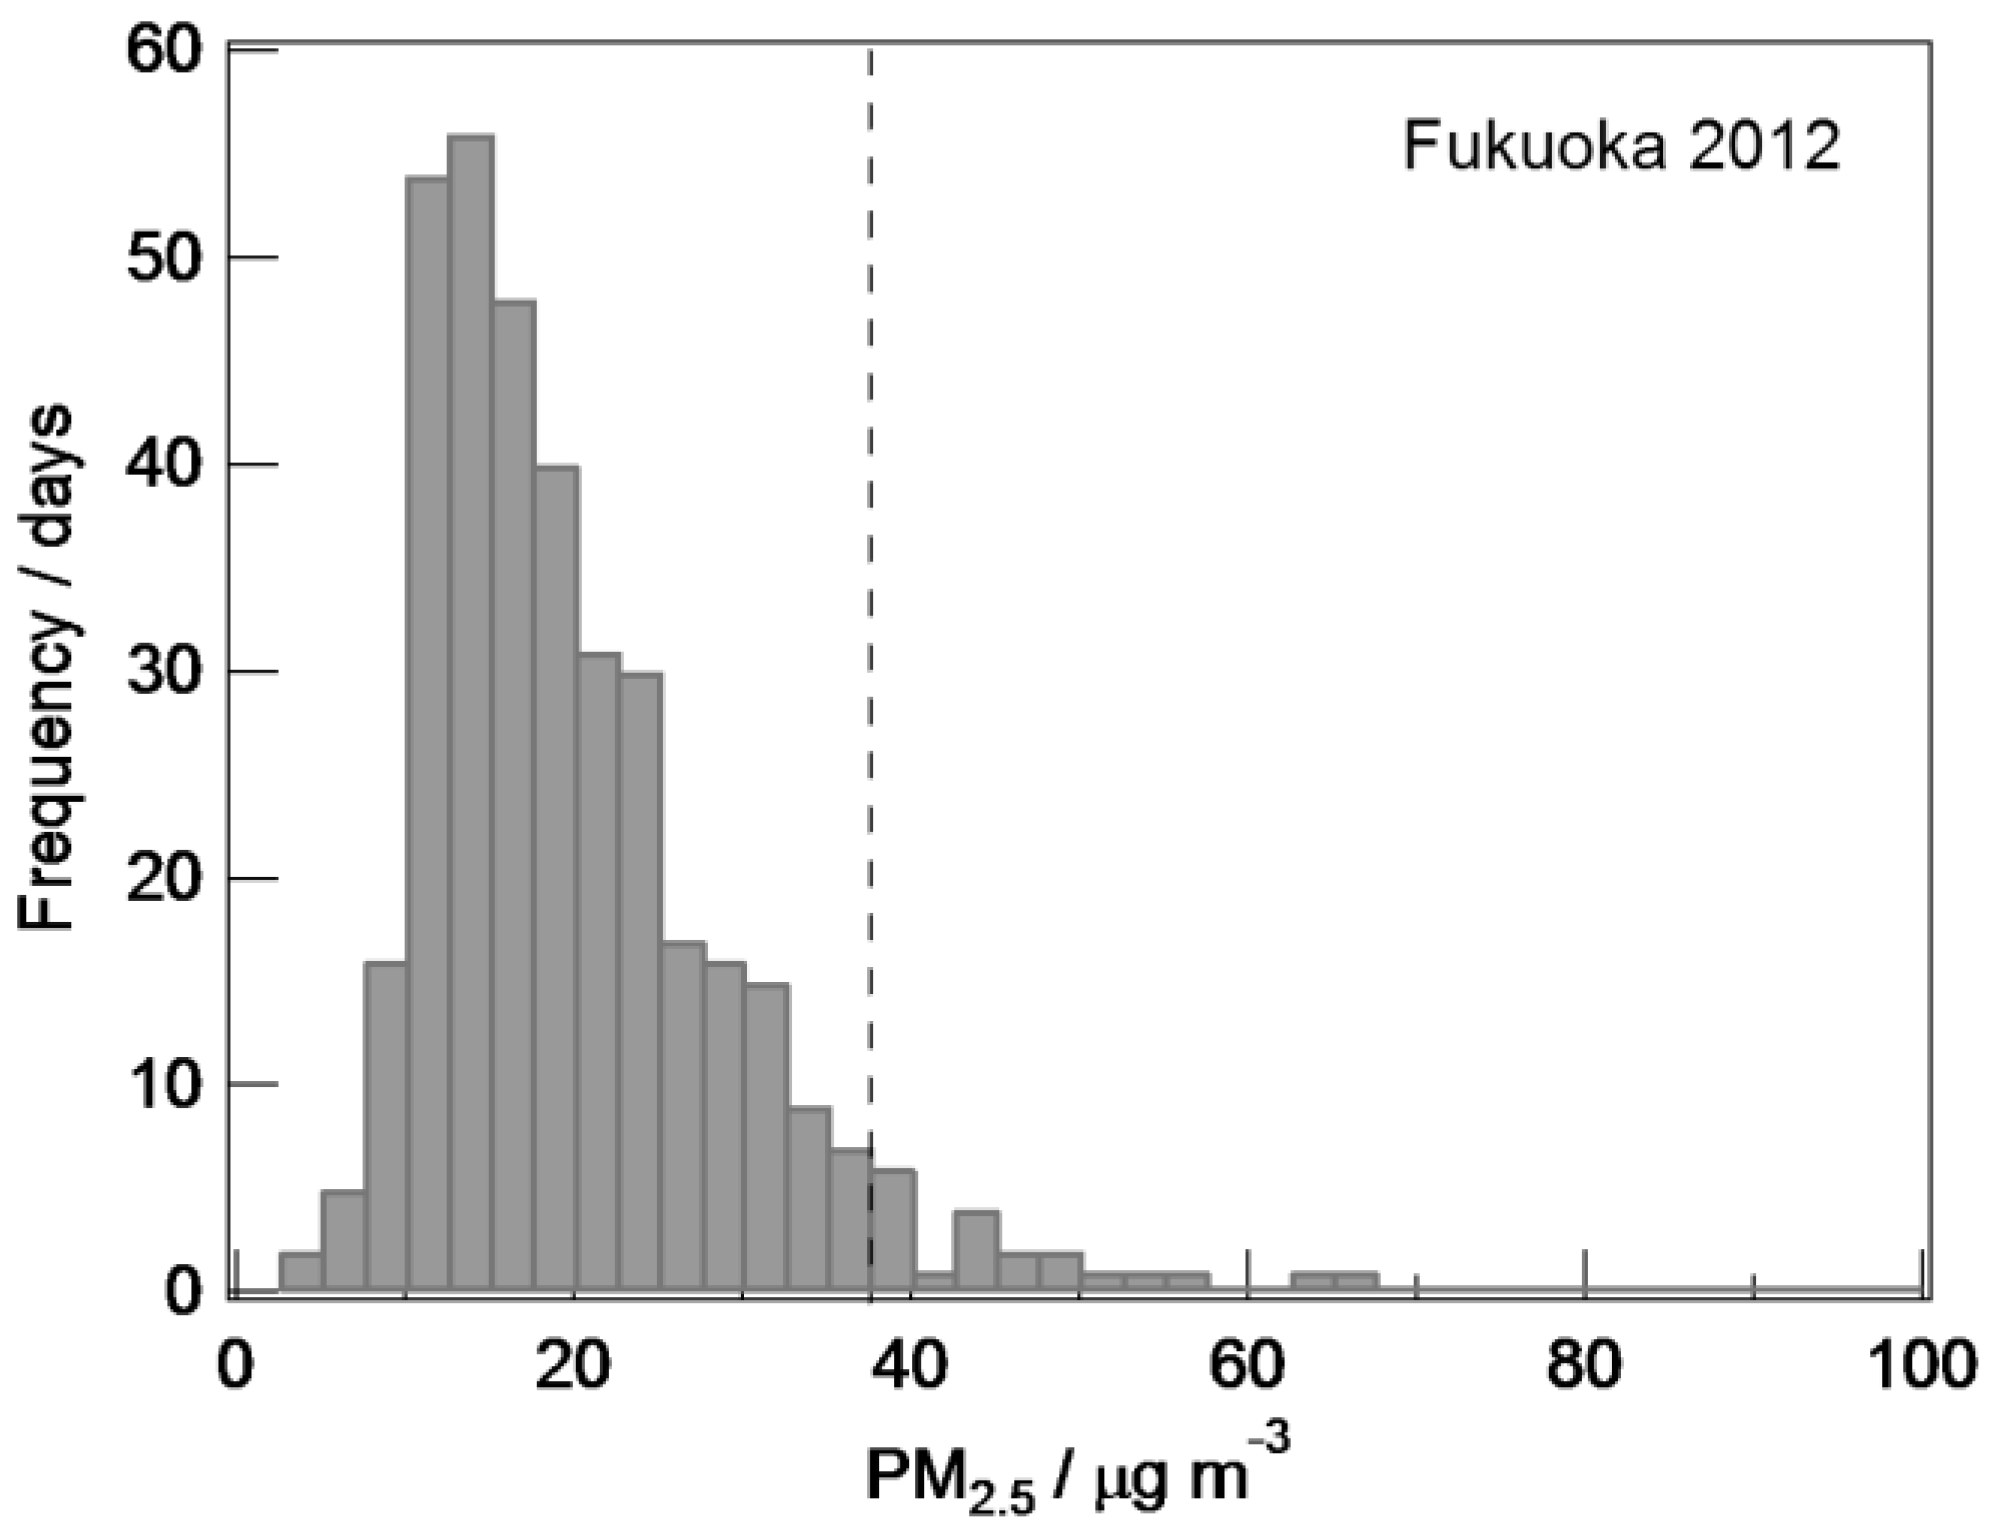
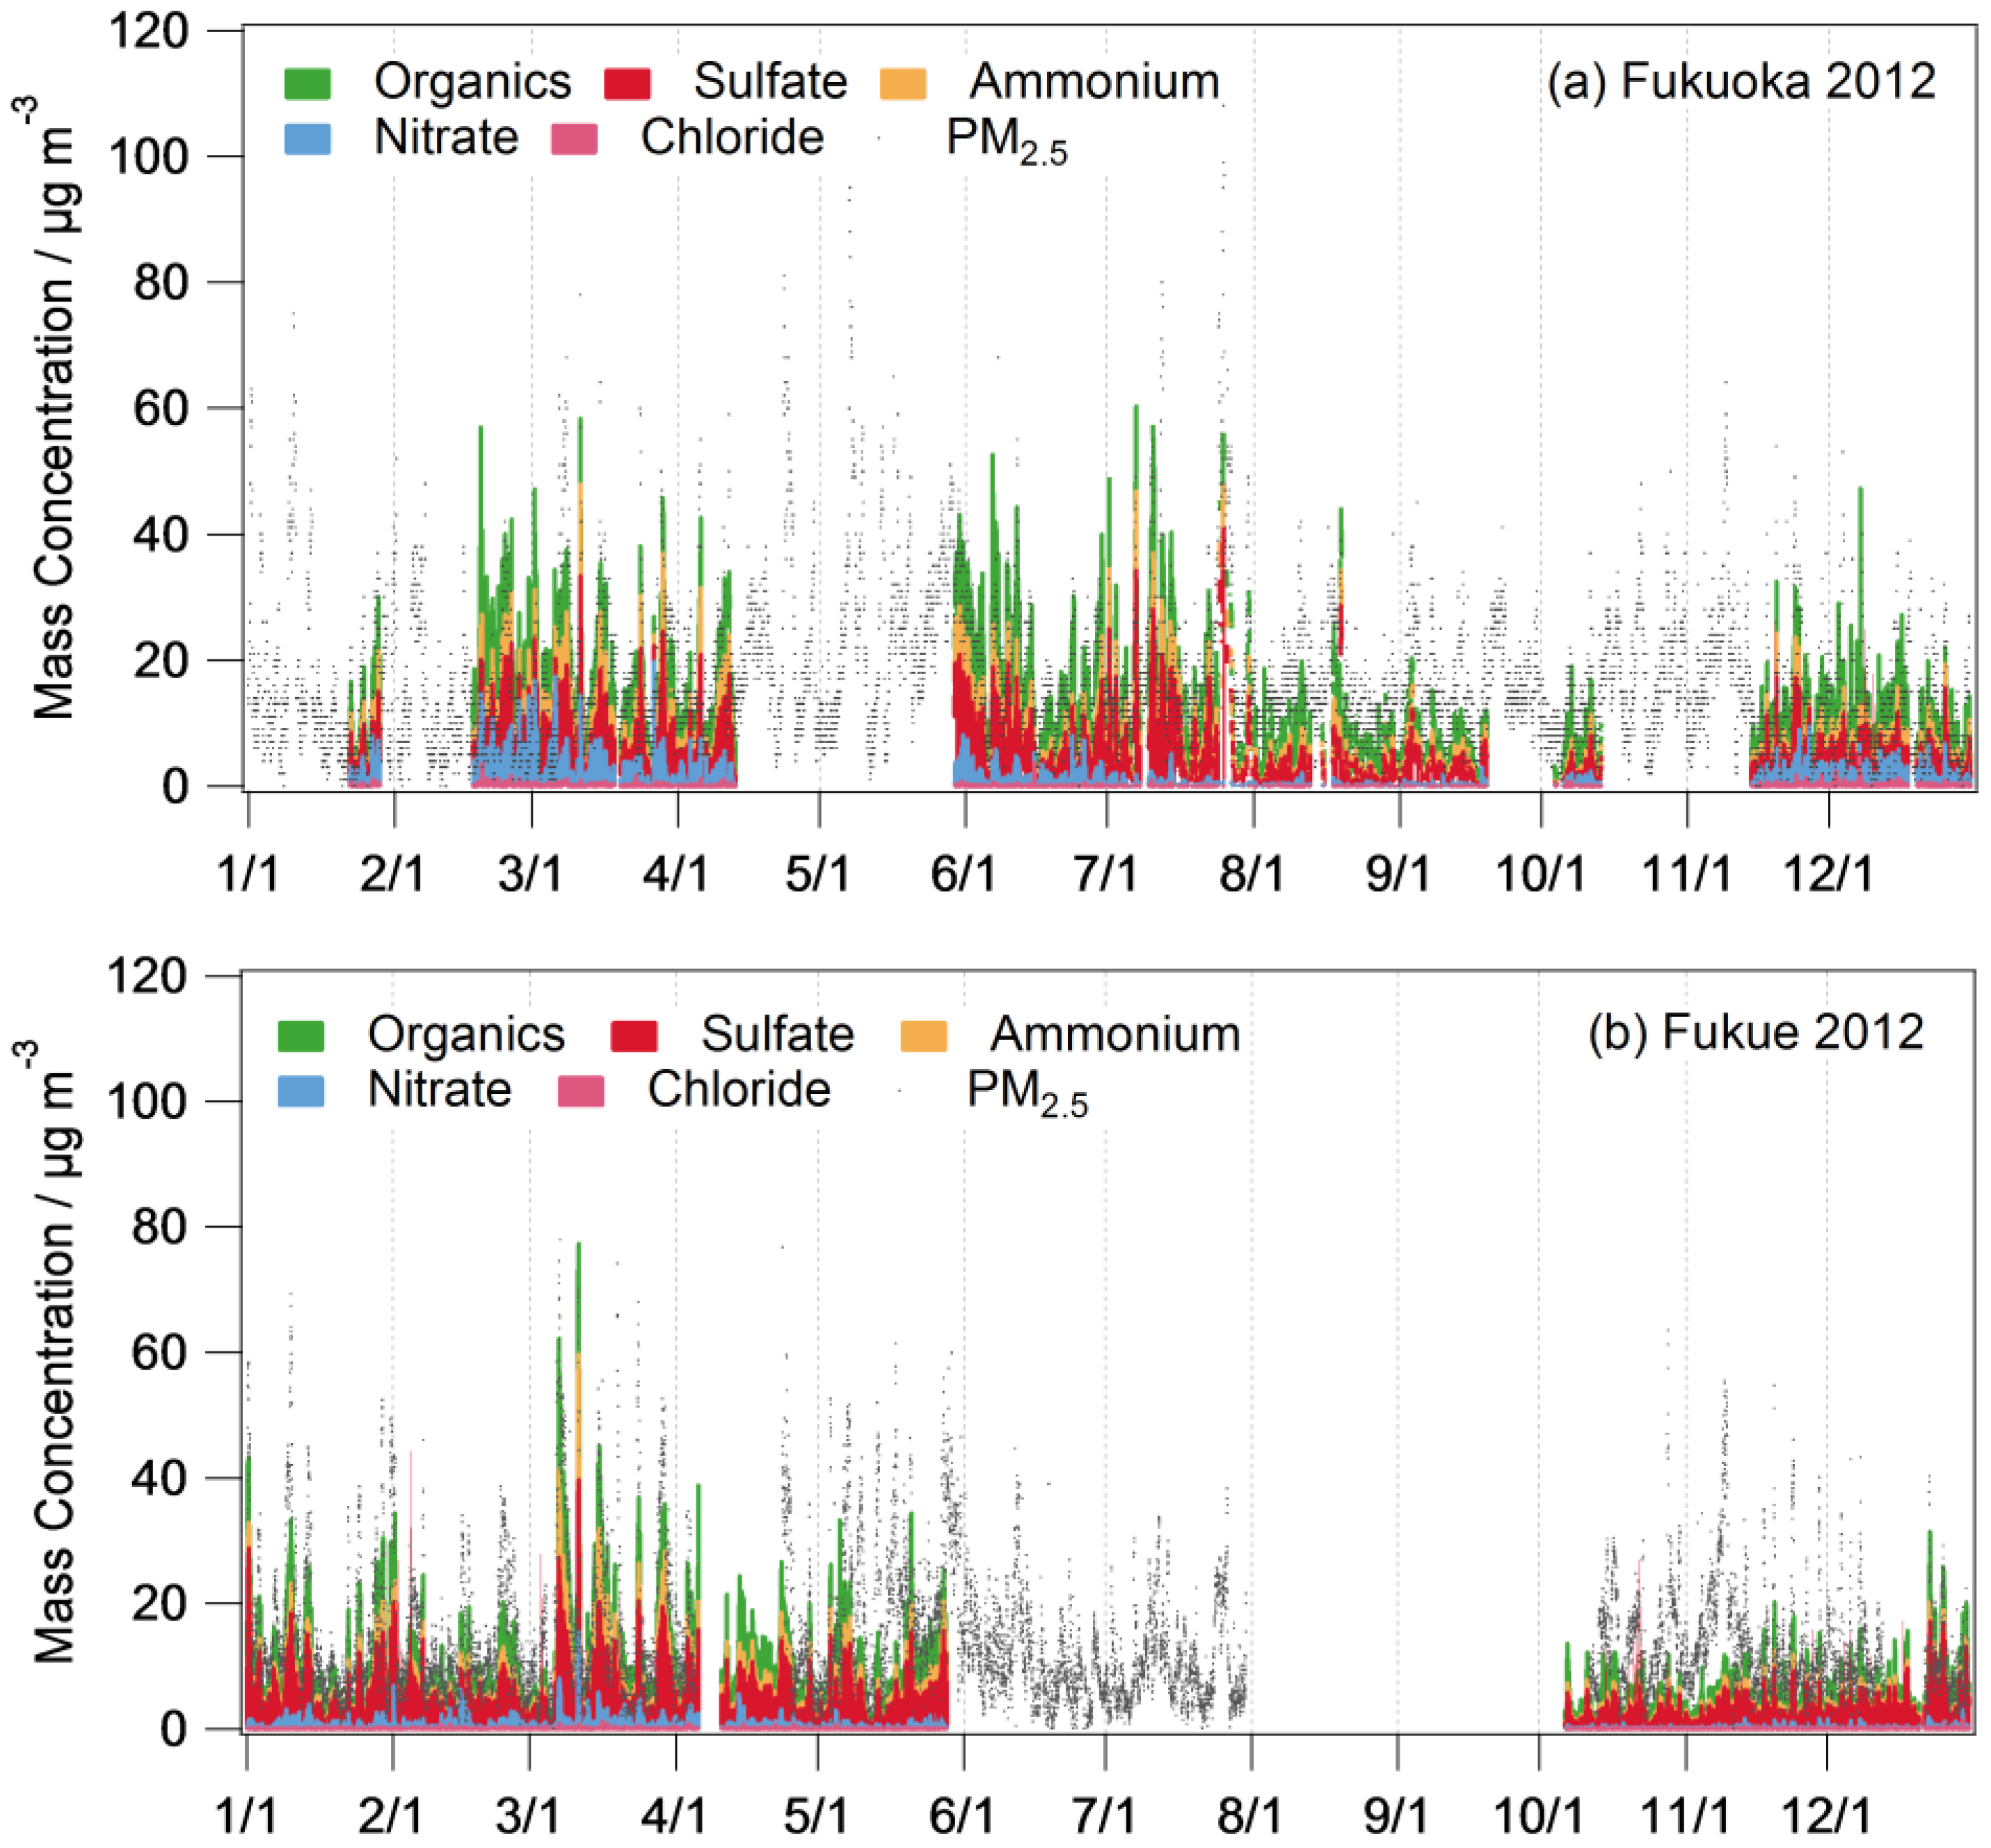
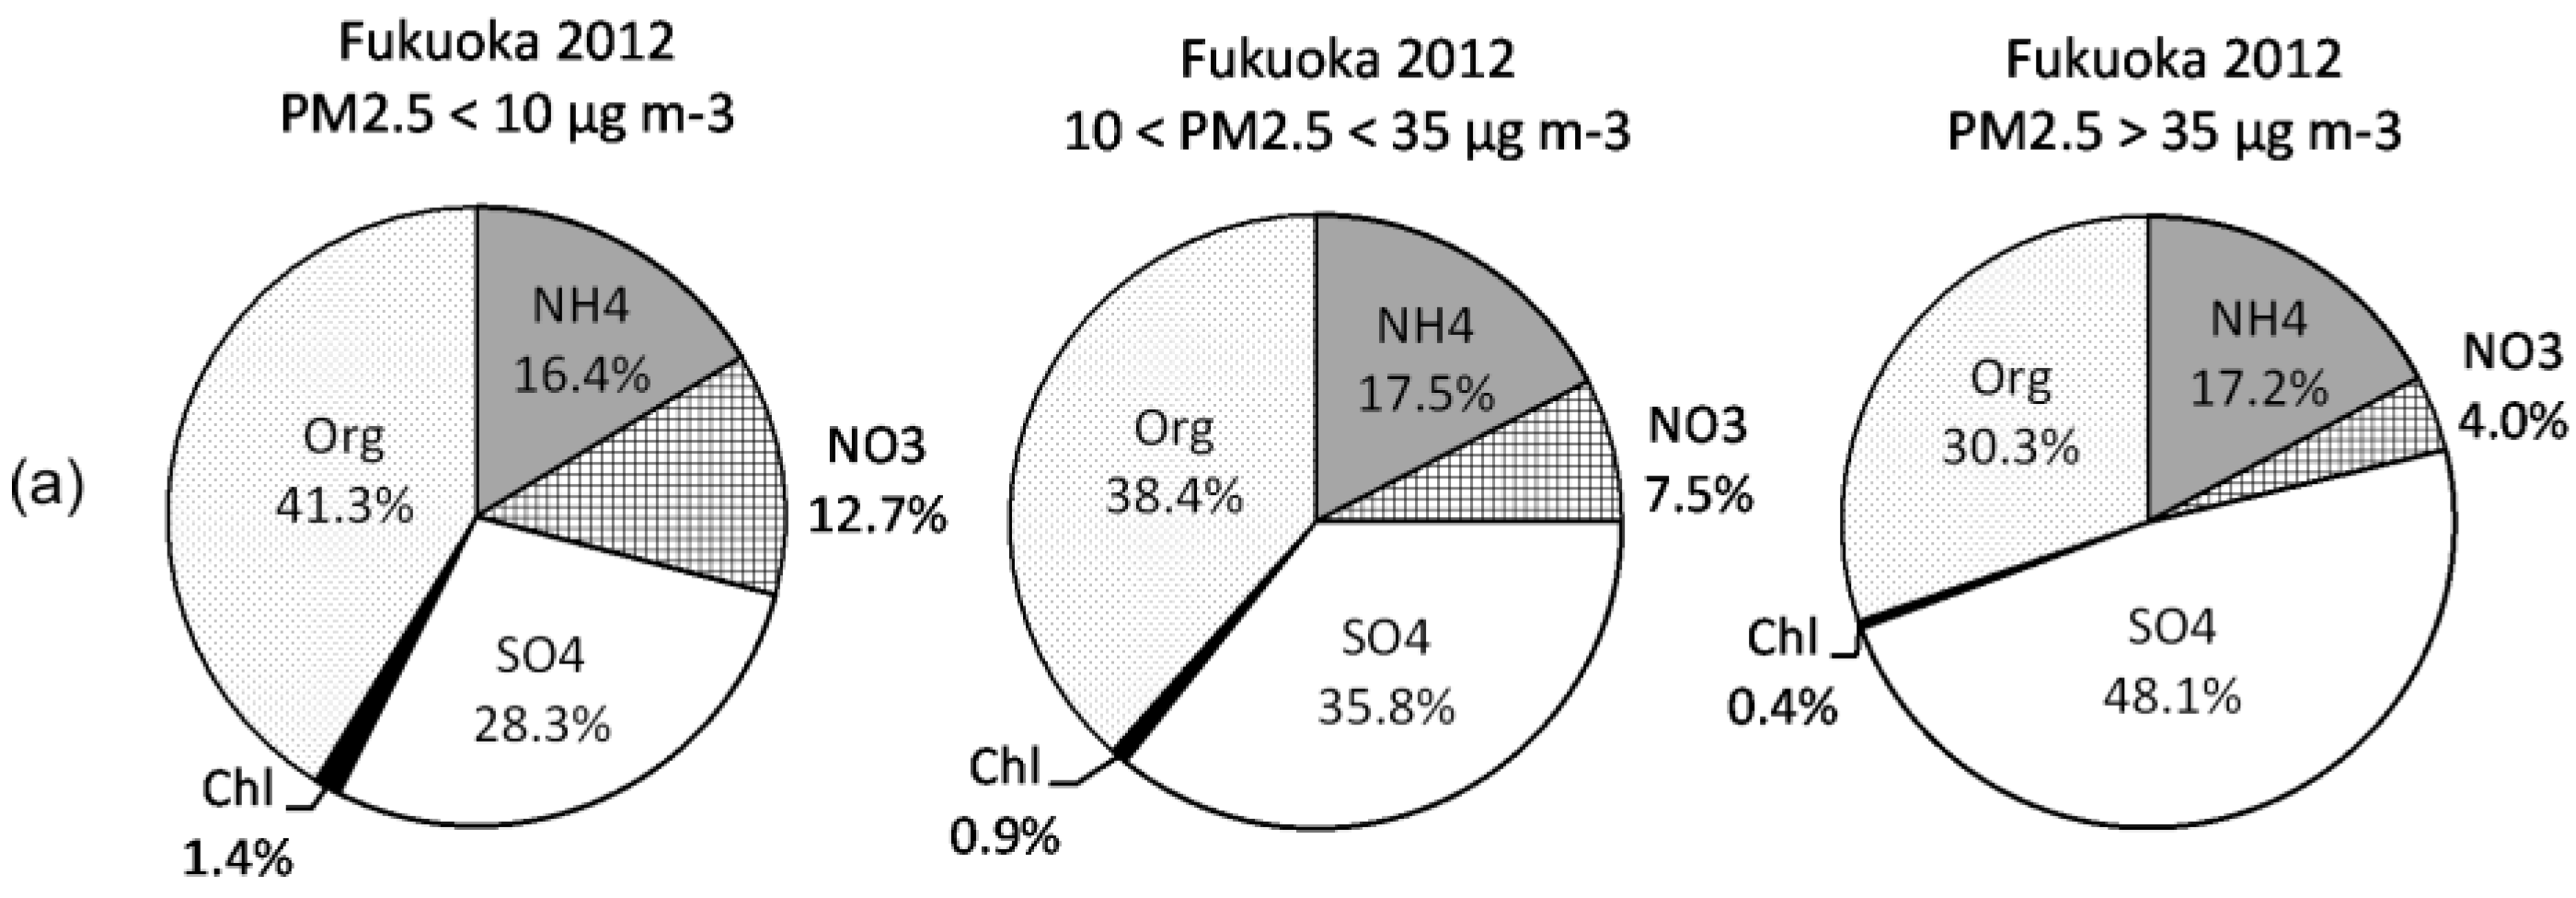
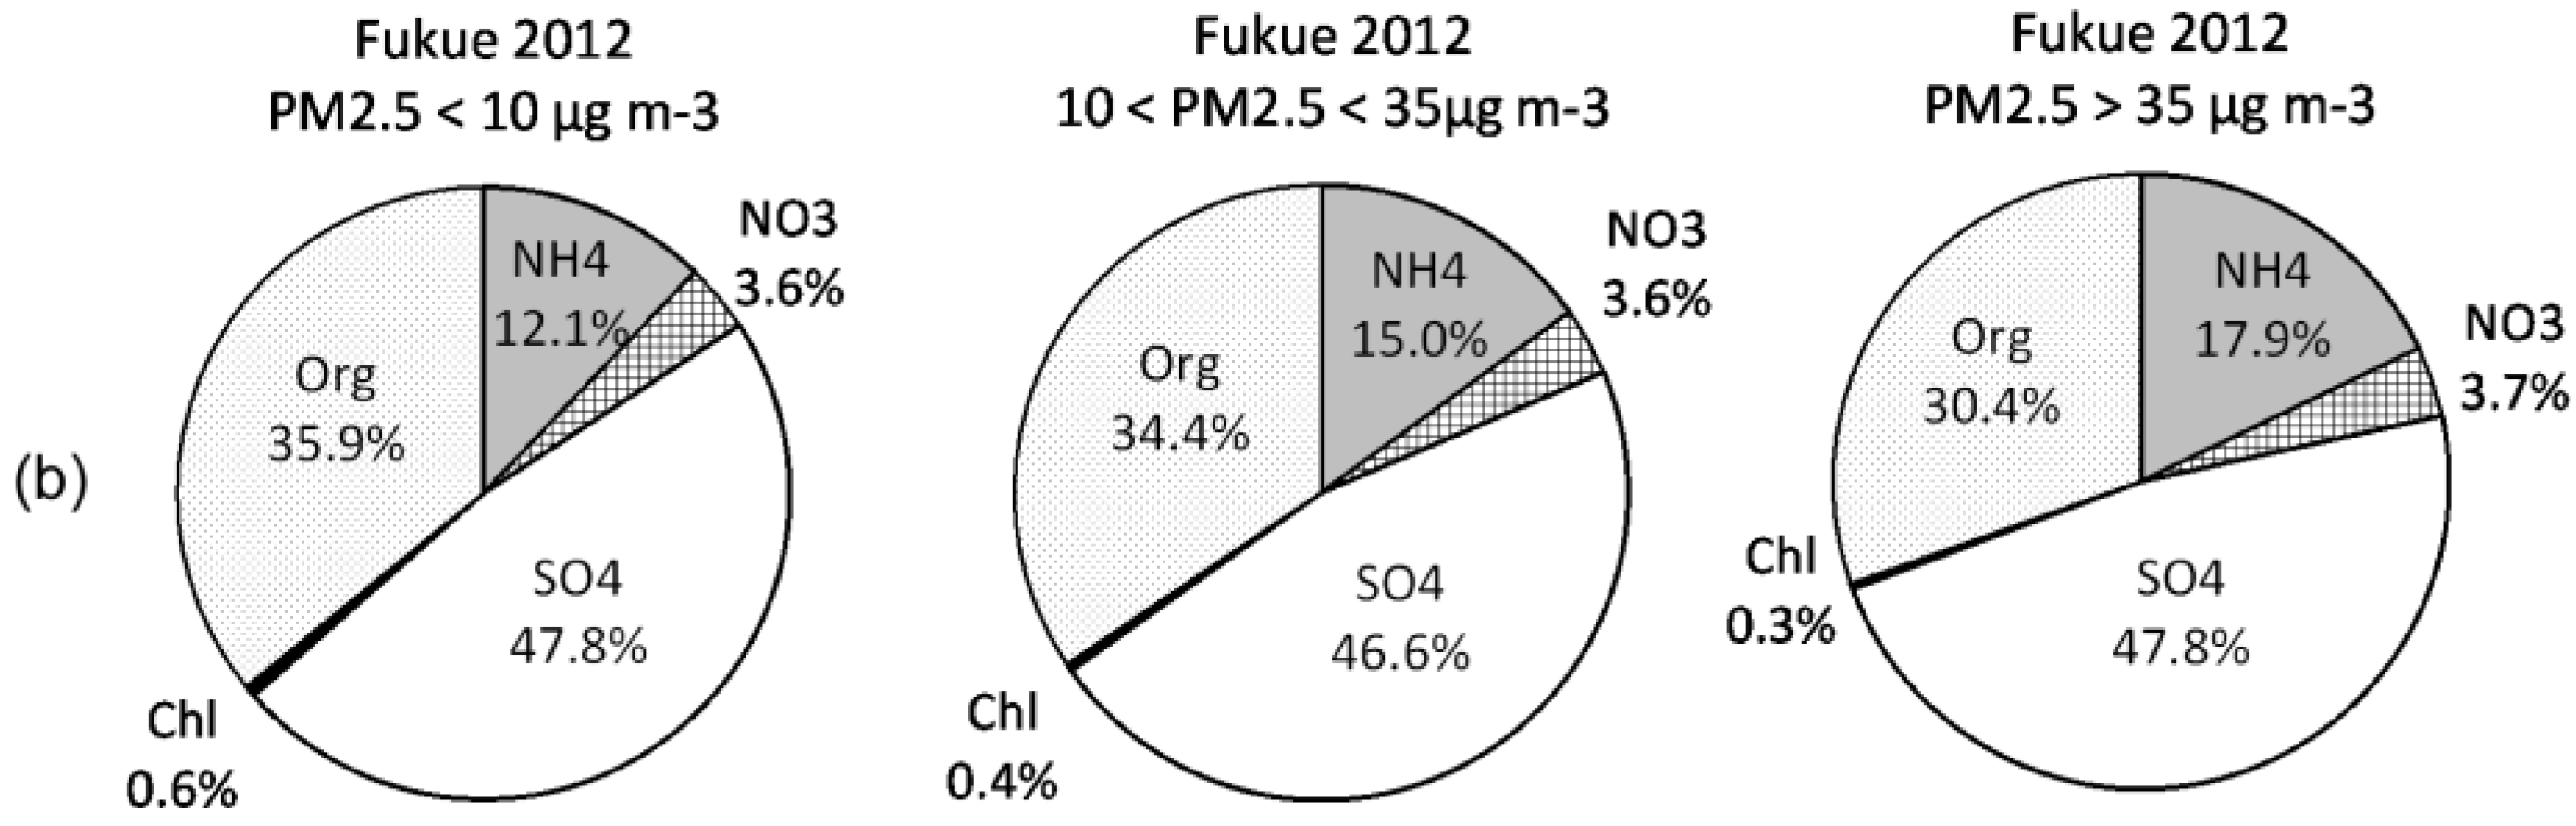
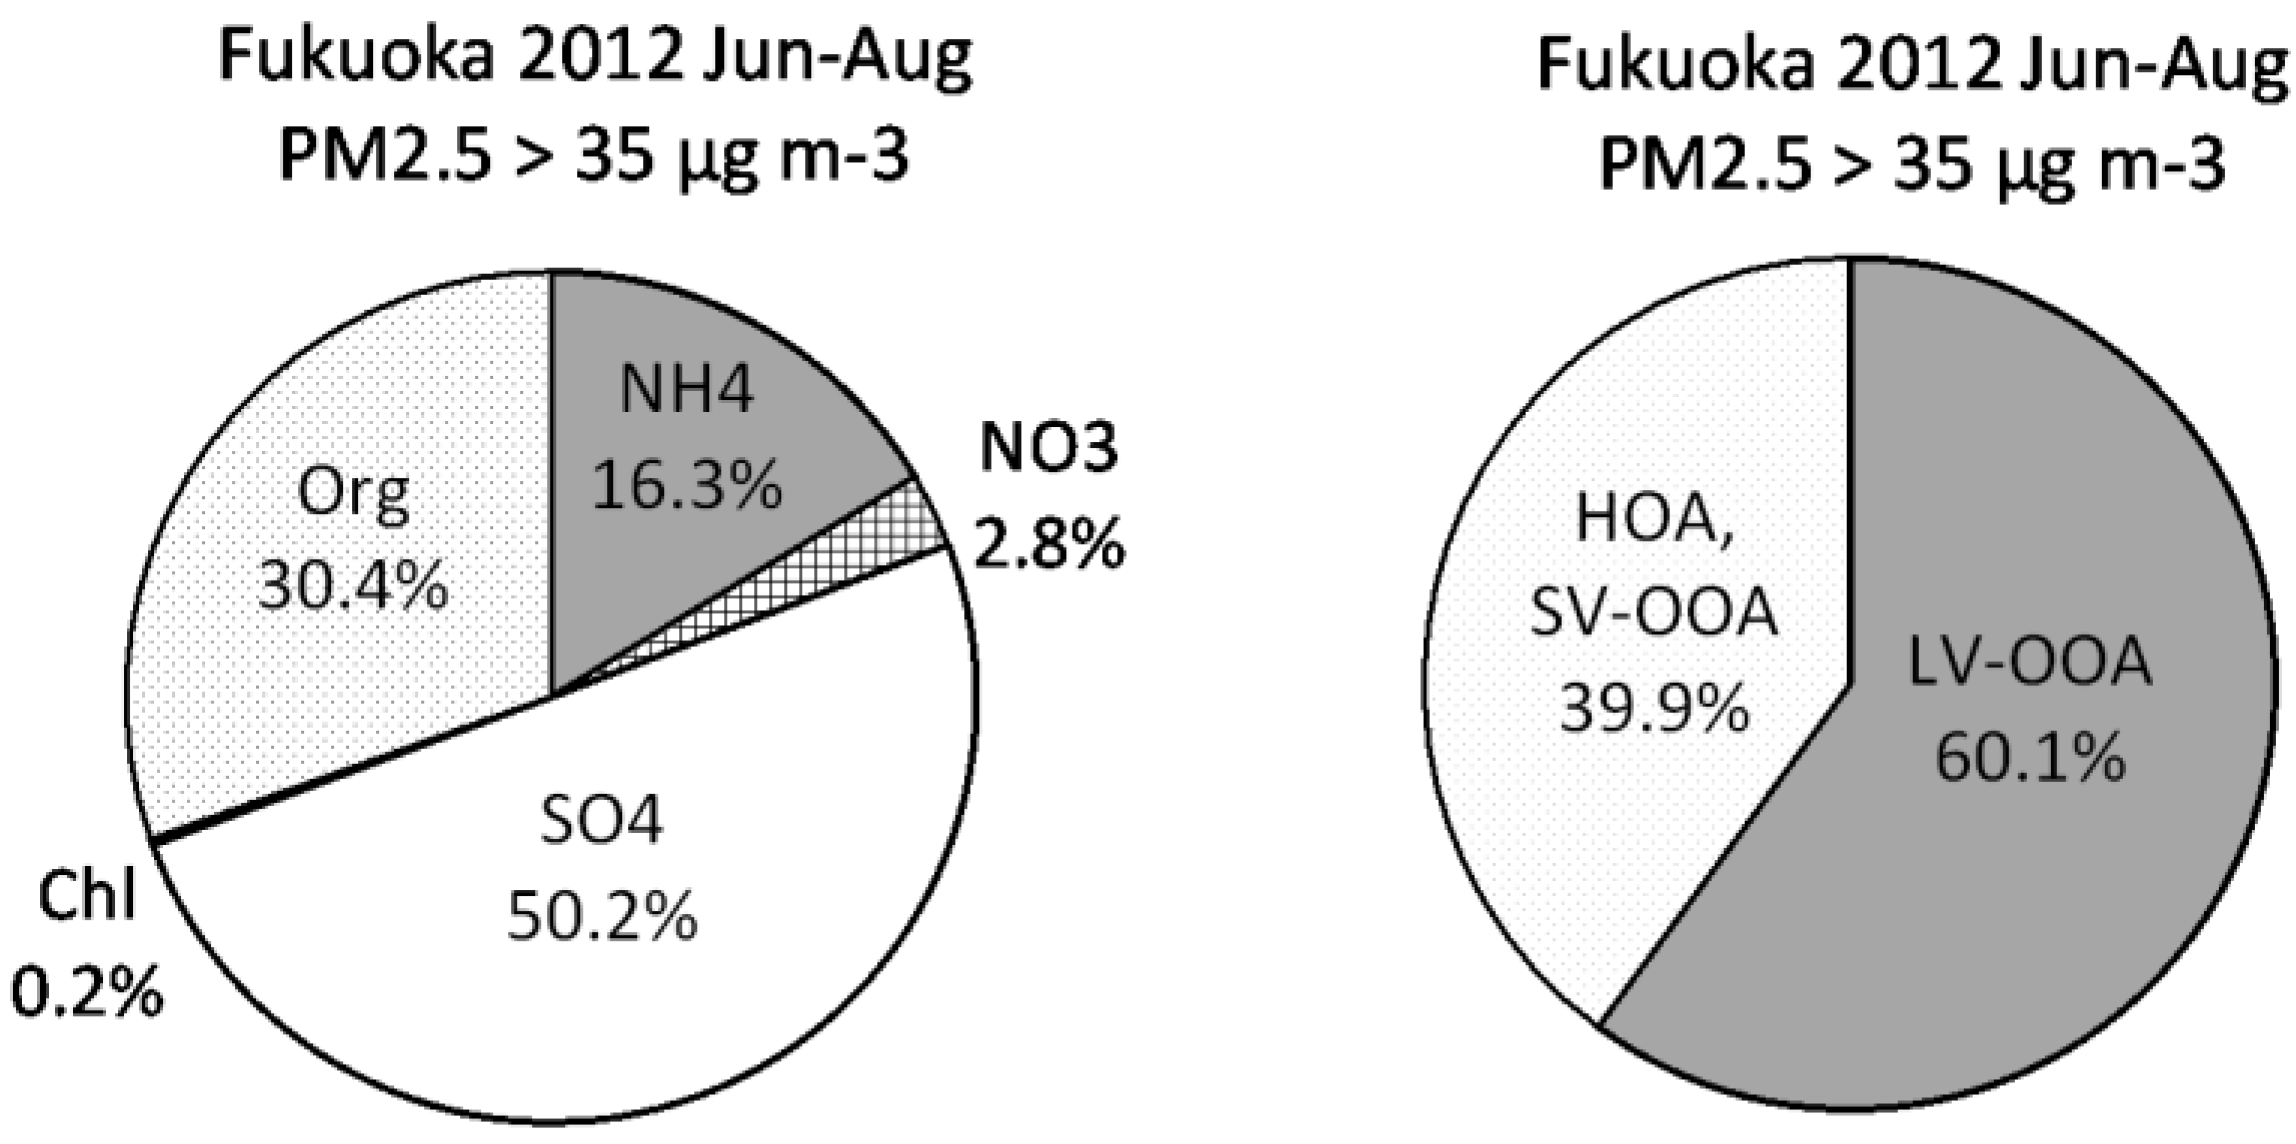
3.1. Chemical Composition
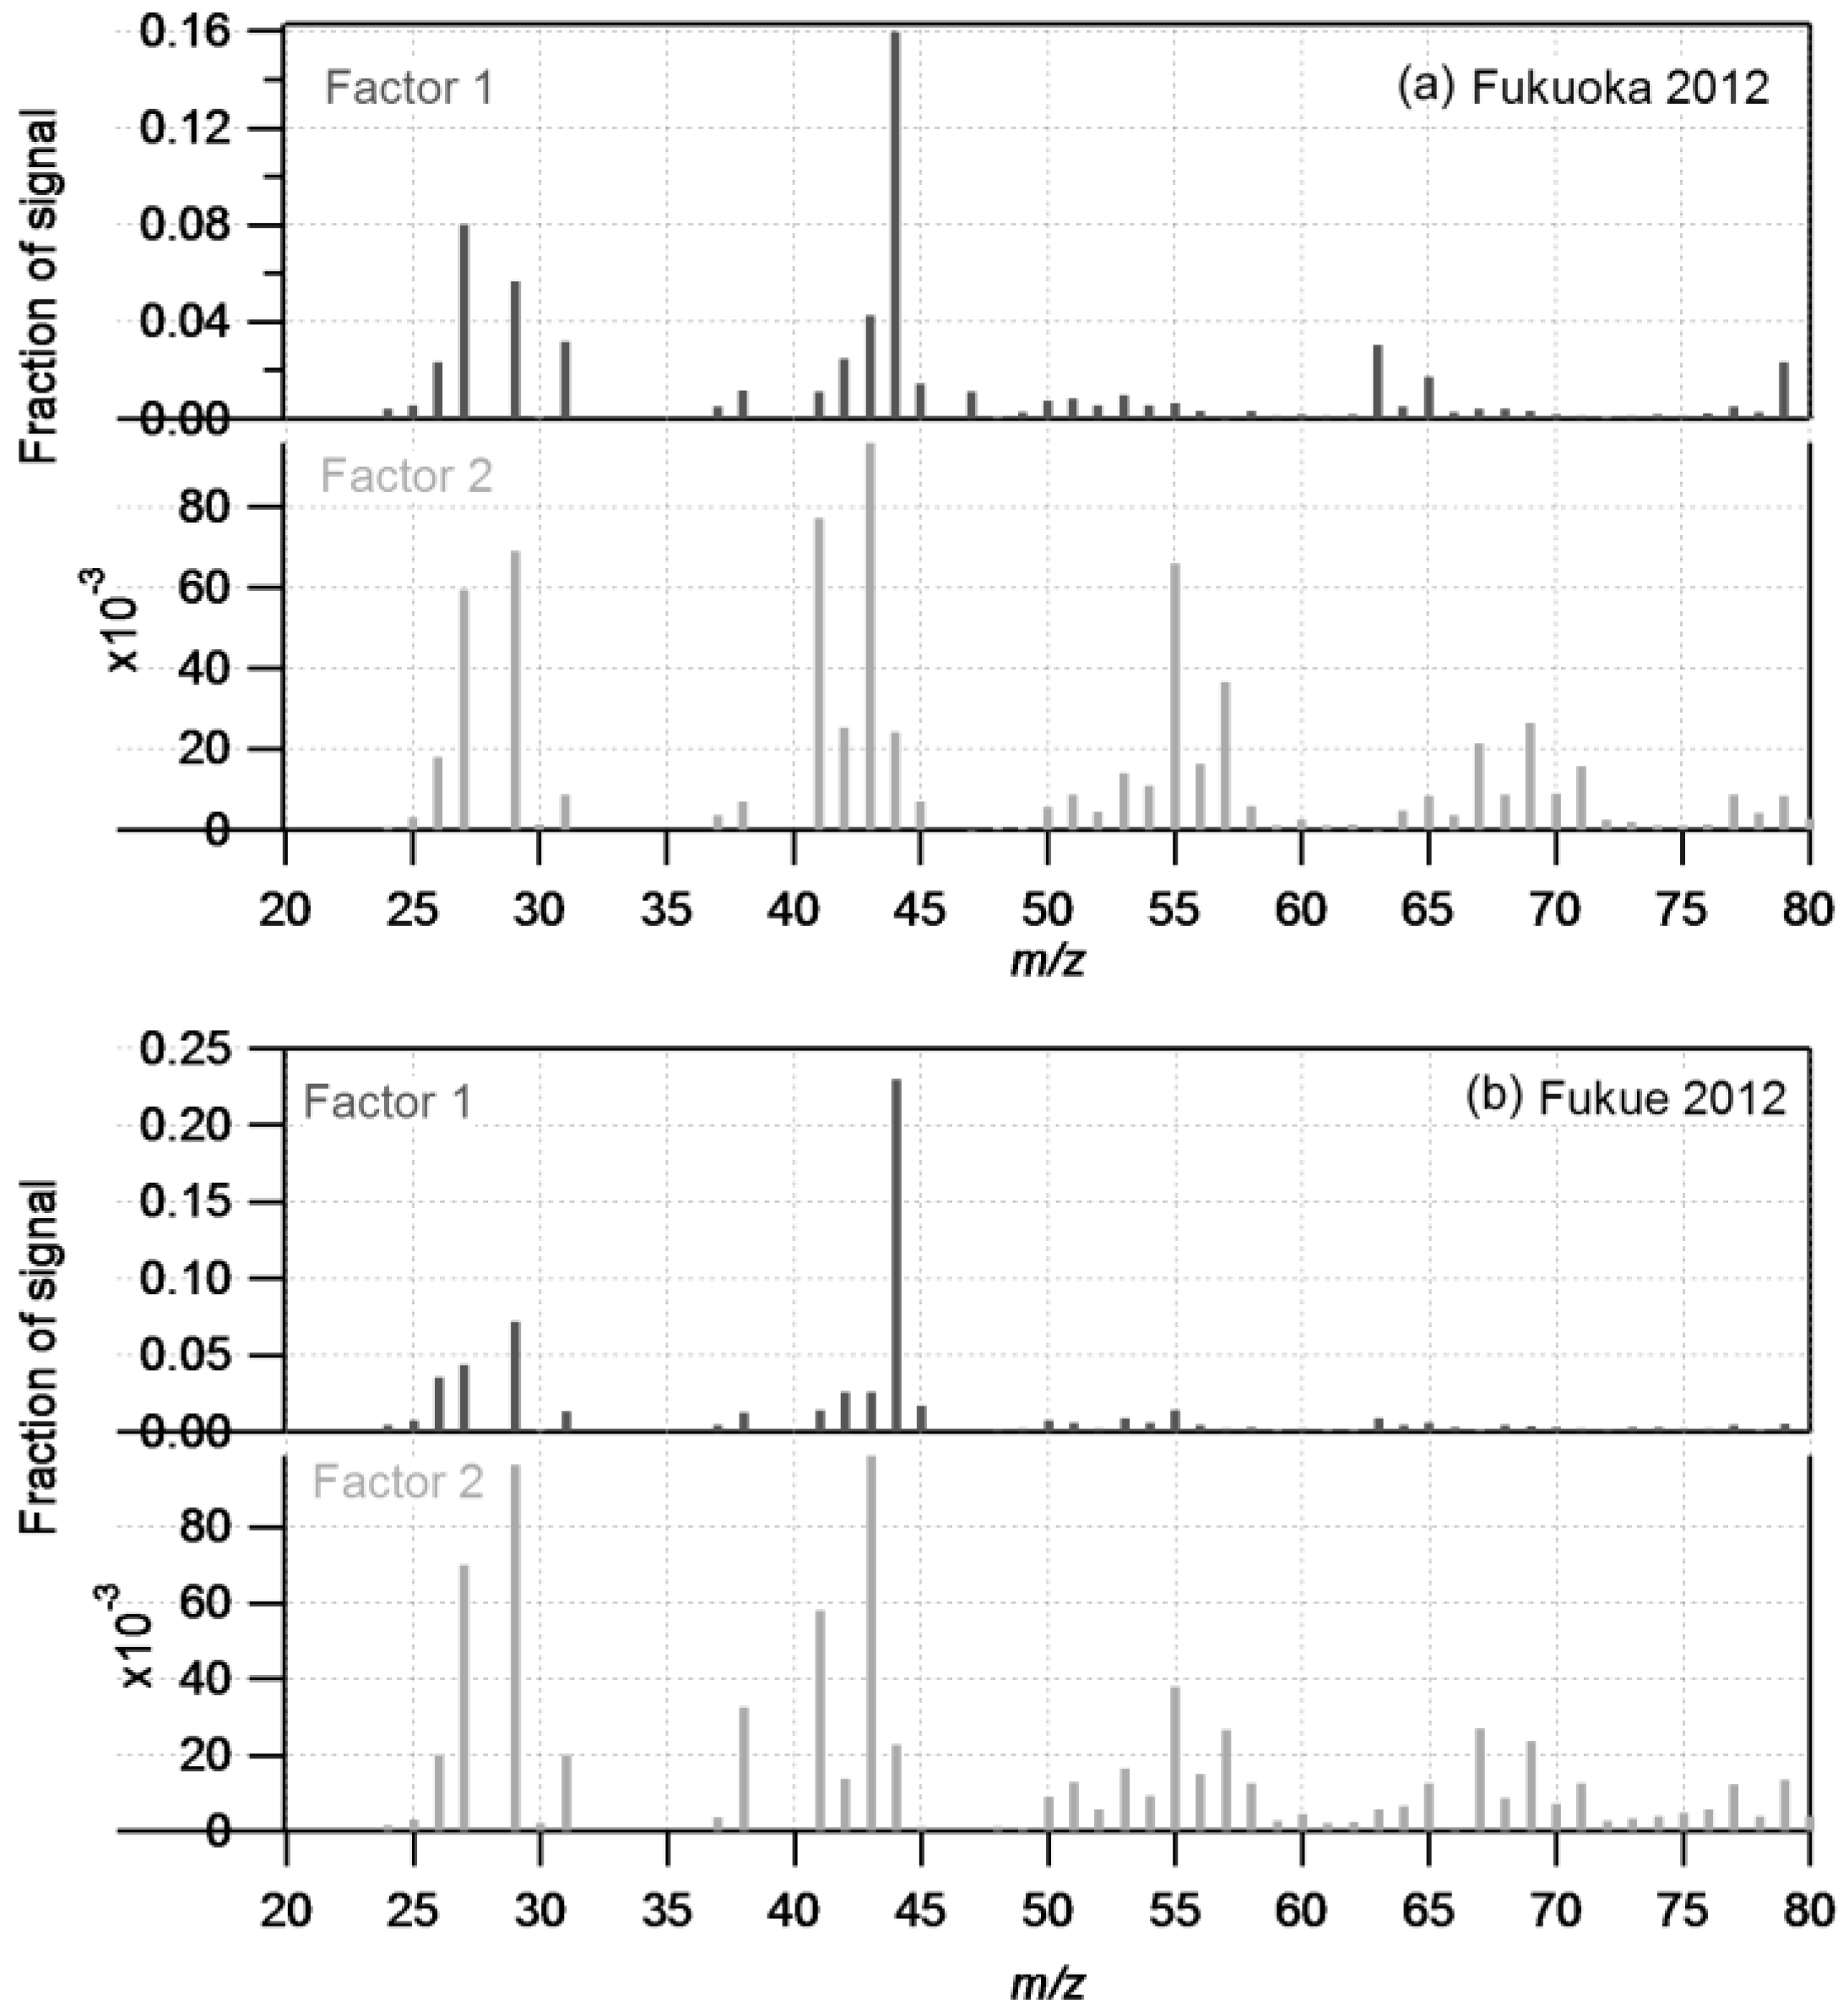
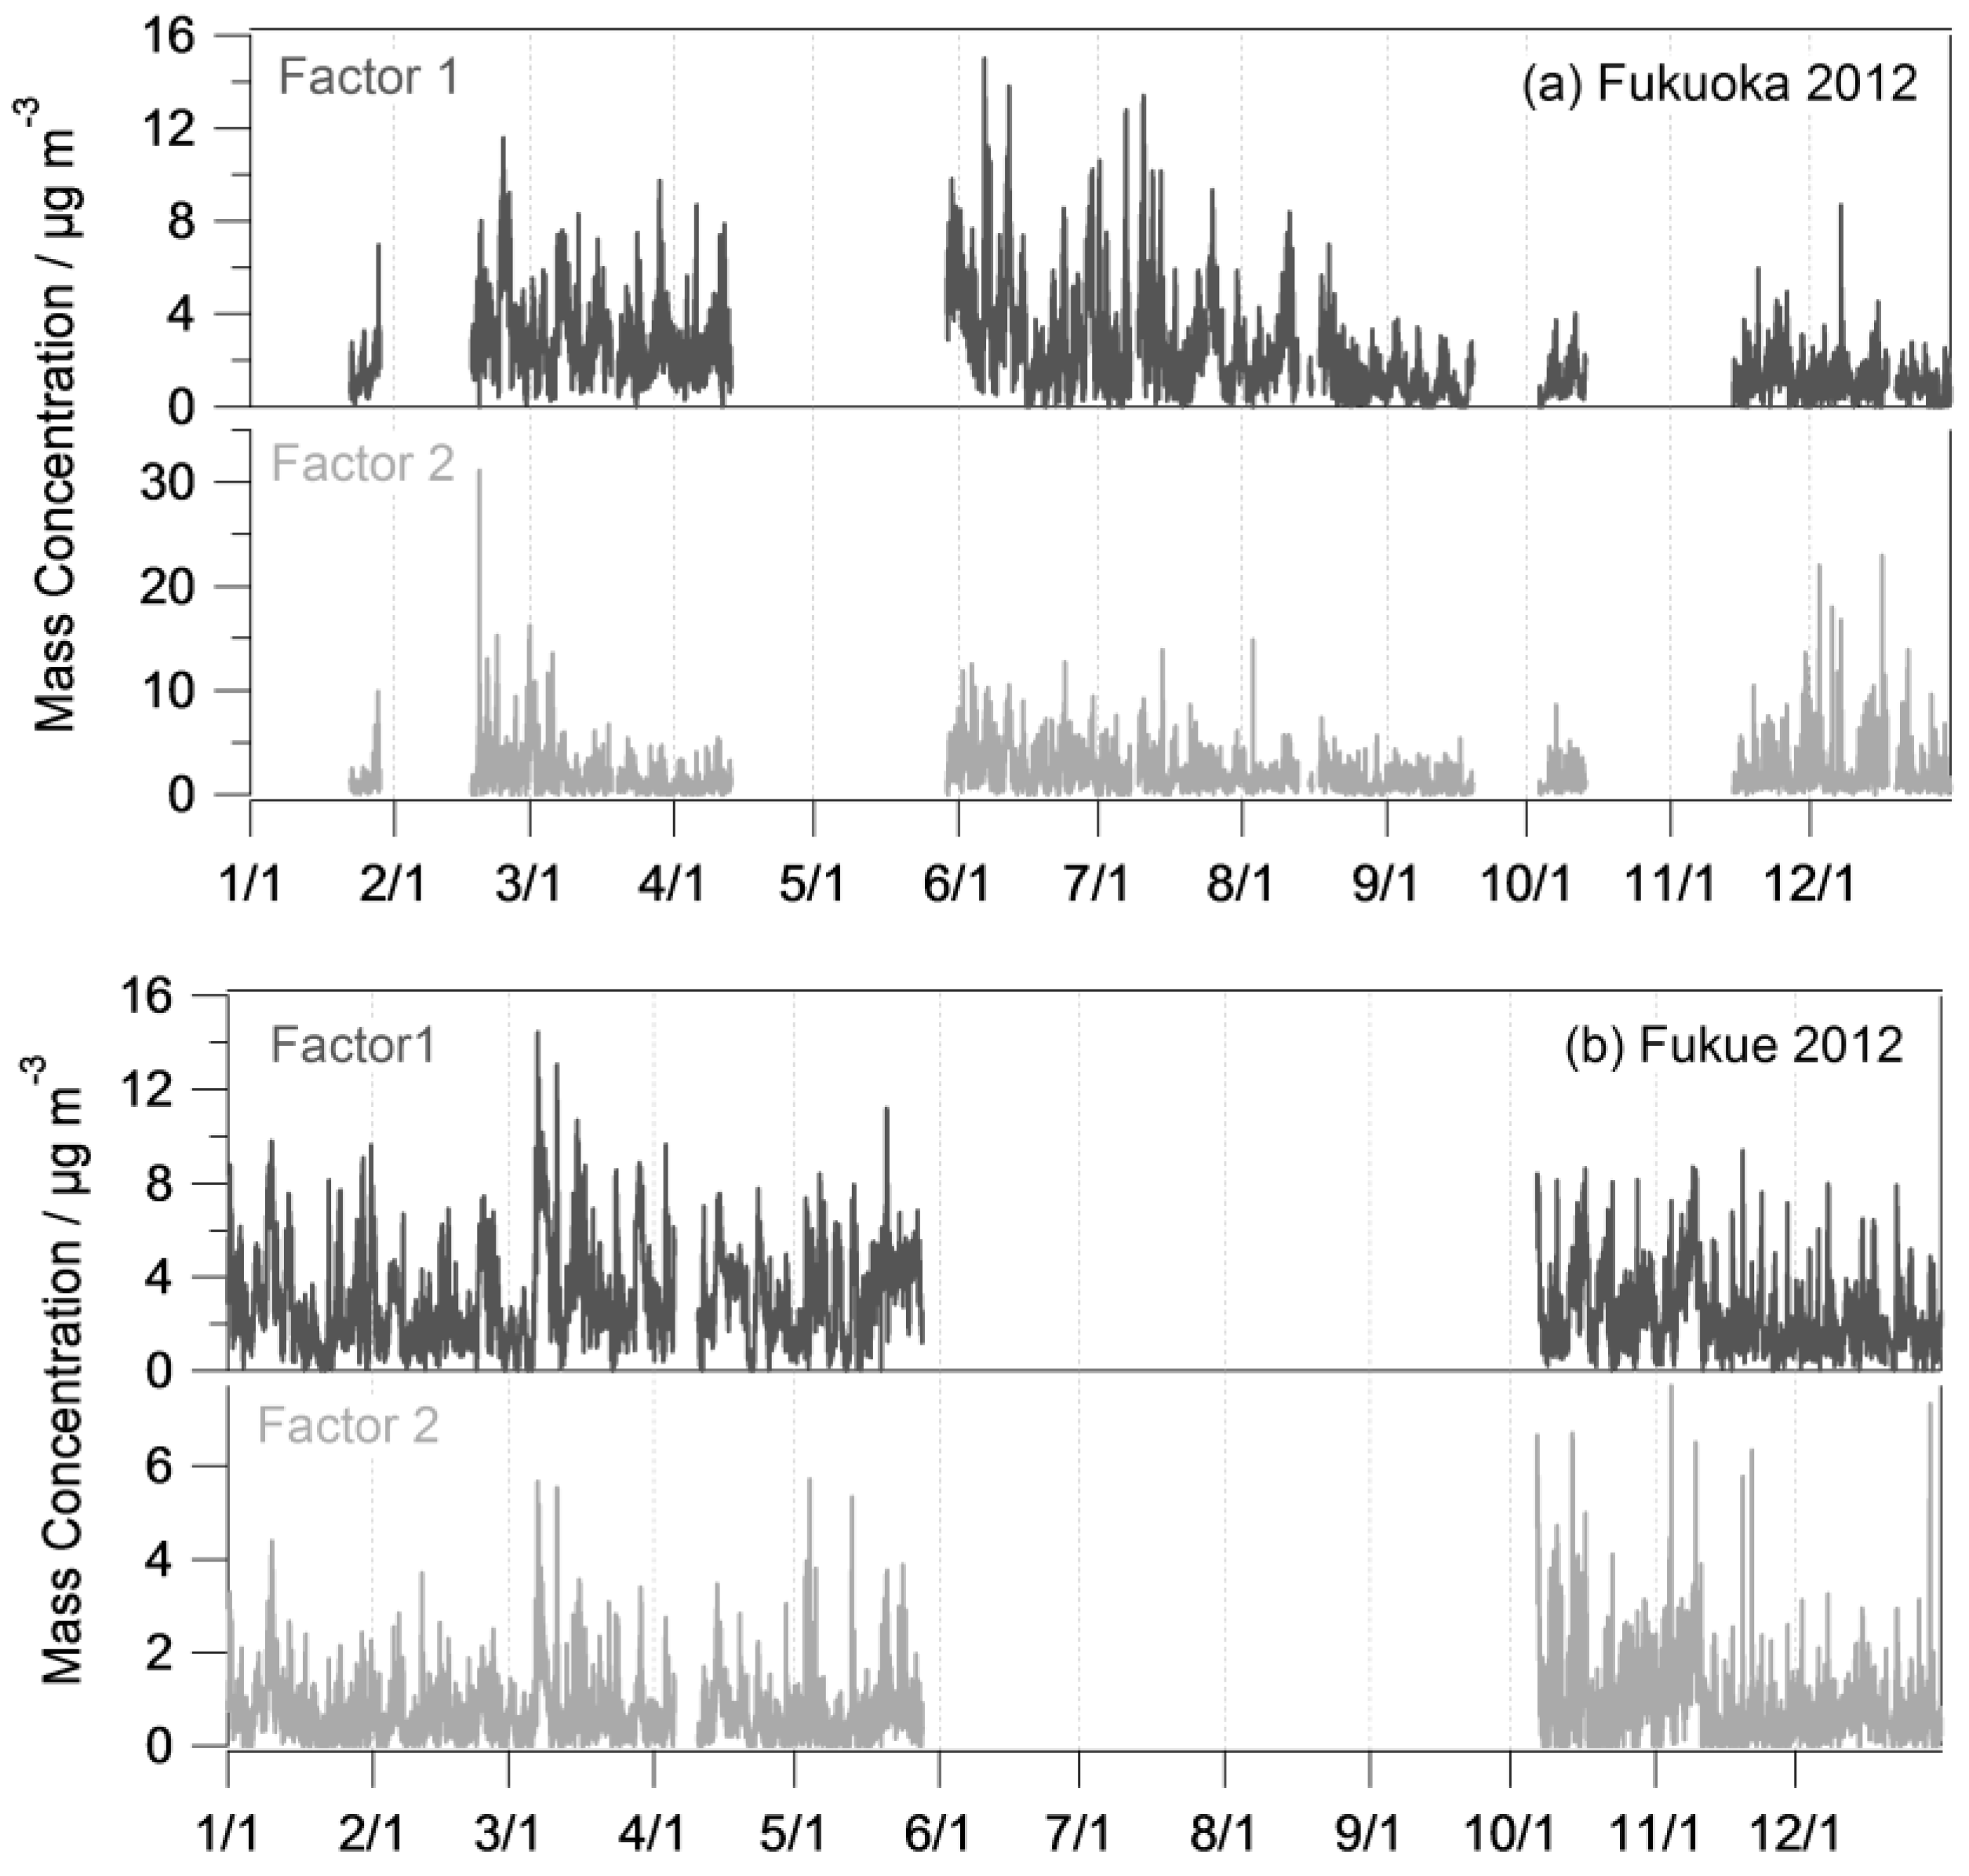
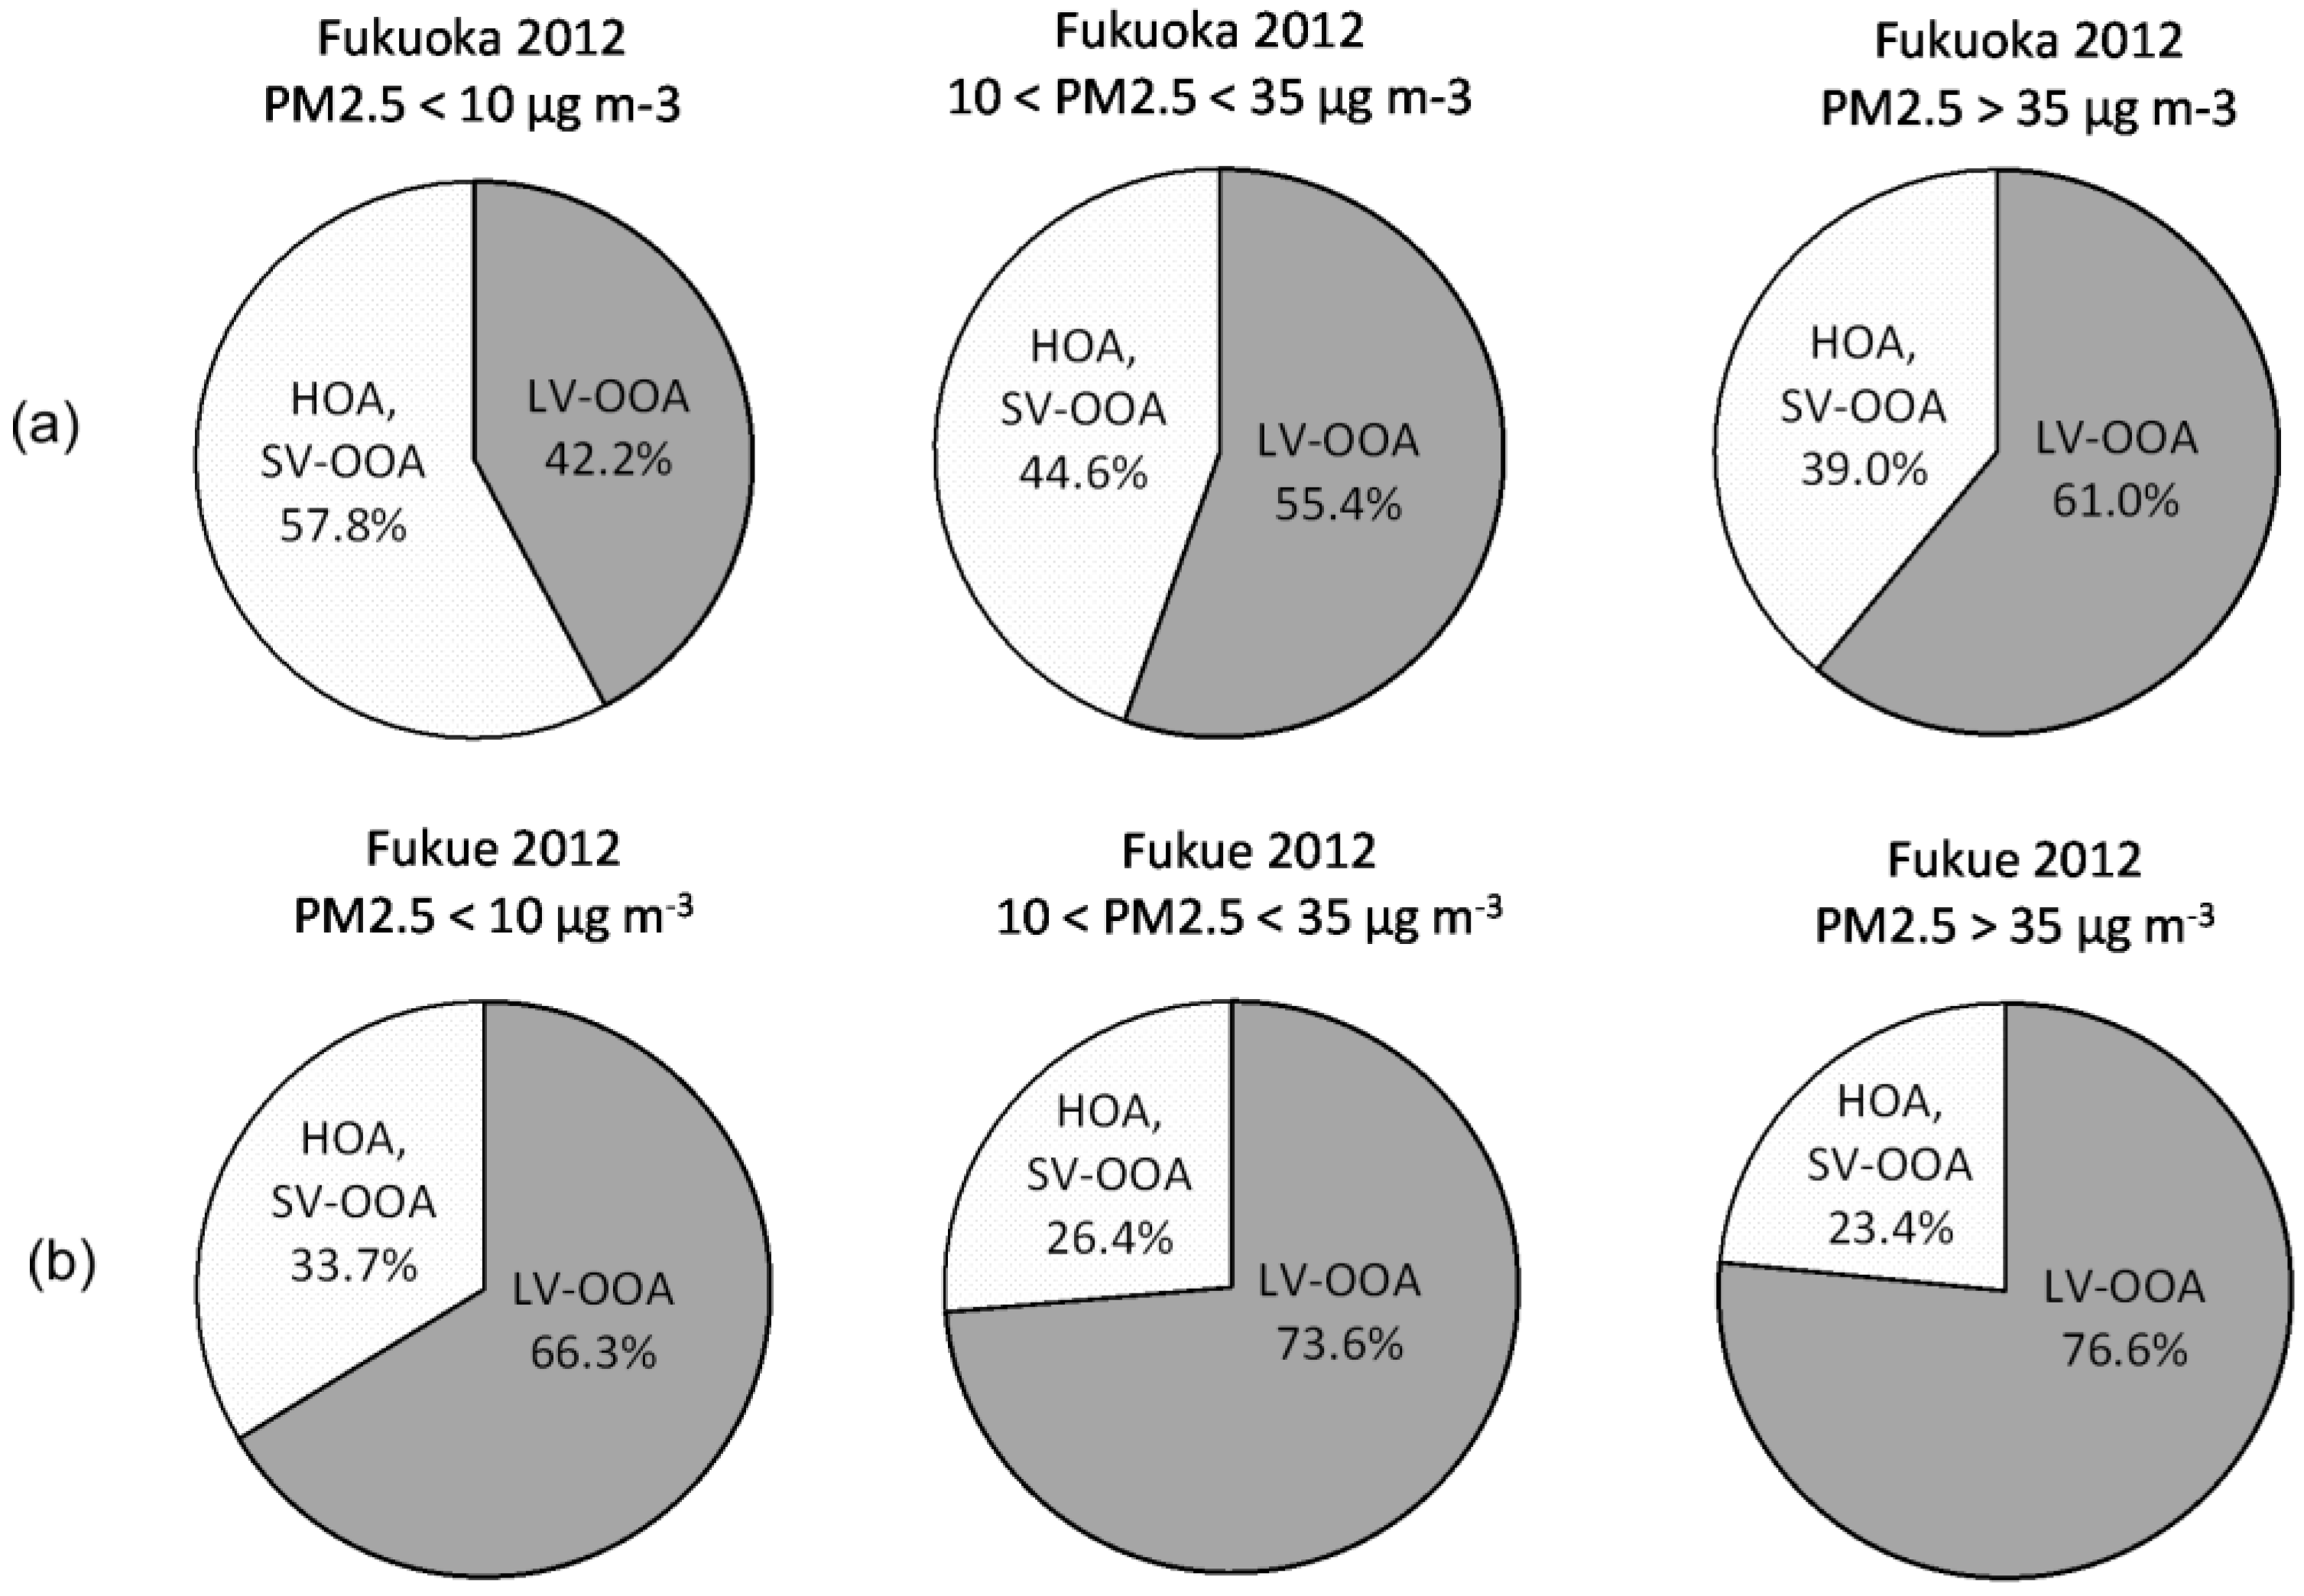
Figure 2a,b shows variations in the PM mass concentrations and chemical composition measured in Fukuoka City and Fukue Island. Monthly averages of each of these values is listed in Table 1. For Fukuoka, there are several periods when data were missing due to the Q-AMS pump trouble. Because the main focus was on trans-boundary air pollution from mainland China, data for Fukue Island were measured only from January to May and then from October to December to correspond to the pollution’s winter-spring season. Total mass concentrations of chemical components (stack on graph) show a similar variation with that of PM2.5 mass concentrations. While sulfate and organics are major components in both sites, nitrate is more significant in Fukuoka City than that on Fukue Island. High PM2.5 and sulfate events were observed several times in both sites in spring and summer.
Figure 3a,b show the breakdown of the chemical composition of PM measured in Fukuoka City and Fukue Island under high (>35 µg·m−3), middle (10–35 µg·m−3), and low (<10 µg·m−3) PM2.5 mass concentrations for 2012. On Fukue Island, sulfate accounted for approximately 50%, which is the largest fraction of total PM, and nitrate was minor in every case. The fraction of each chemical component did not change with PM2.5 mass variation. In contrast, in the case of high PM2.5 concentrations in Fukuoka City during the observation period, sulfate accounted for the largest fraction of total PM measured by Q-AMS for the event of highest PM2.5 concentration, while organics and nitrate made up a large fraction under low PM2.5 concentrations. High levels of sulfate within high PM2.5 concentrations are similar to the results for Fukue Island.

3.2. PMF Analysis

The organic spectra of Q-AMS and Q-ACSM were analyzed using the PMF method. They were analyzed with two factors given that the focus was only on air pollution from long-range transport or from local emissions. Figure 4a and Figure 5a show the mass spectra and variations of mass concentrations of each factor in Fukuoka City. The mass spectra for factor 1 show a distinctive signal of m/z = 44 (COO+ fragment), this is low-volatile oxygenated organic aerosol (LV-OOA) corresponding to well-aged organics [17,20,25,26,27]. The mass spectra of factor 2 contain m/z = 41, 43, 55, 57. As for m/z = 43 (partially aldehydes fragment), they are semi-volatile oxygenated organic aerosols (SV-OOA) corresponding to partially aged organics [17,20,25,26,27]. As for m/z = 41 (C3H5+), 43 (CH2CHO+, C3H7+), 55 (C4H7+), 57 (C4H9+), which are mainly normal alkanes, they are hydrocarbon-like organic aerosols (HOA) corresponding to fresh organics [17,20,25,26,27]. For the Q-AMS system, m/z = 43 cannot be separated into aldehyde (CH2CHO+) and normal alkane (C3H7+). Thus, two factors are used: one of them is LV-OOA and the other consists of a mixture of SV-OOA and HOA. Figure 4b and Figure 5b show the result of mass spectra and variation of mass concentrations of each factor on Fukue Island. Similar mass spectra are observed as in Fukuoka City. The signal of m/z = 44 is large and m/z = 55, 57 are small. For both sites, there were no significant diurnal variations of each factor.
The fractions of each PMF factor were classified with PM2.5 mass concentrations as in the case with aerosol chemical composition (Figure 6a,b). In Fukuoka City, factor 2 (SV-OOA and HOA) is dominant under low PM2.5 concentrations, where fractions account for approximately 60% of total mass concentrations. Factor 1 (LV-OOA) made up a large fraction with increasing PM2.5 concentrations. On Fukue Island, factor 1 is dominant under all conditions and the fractions reached approximately 70%.

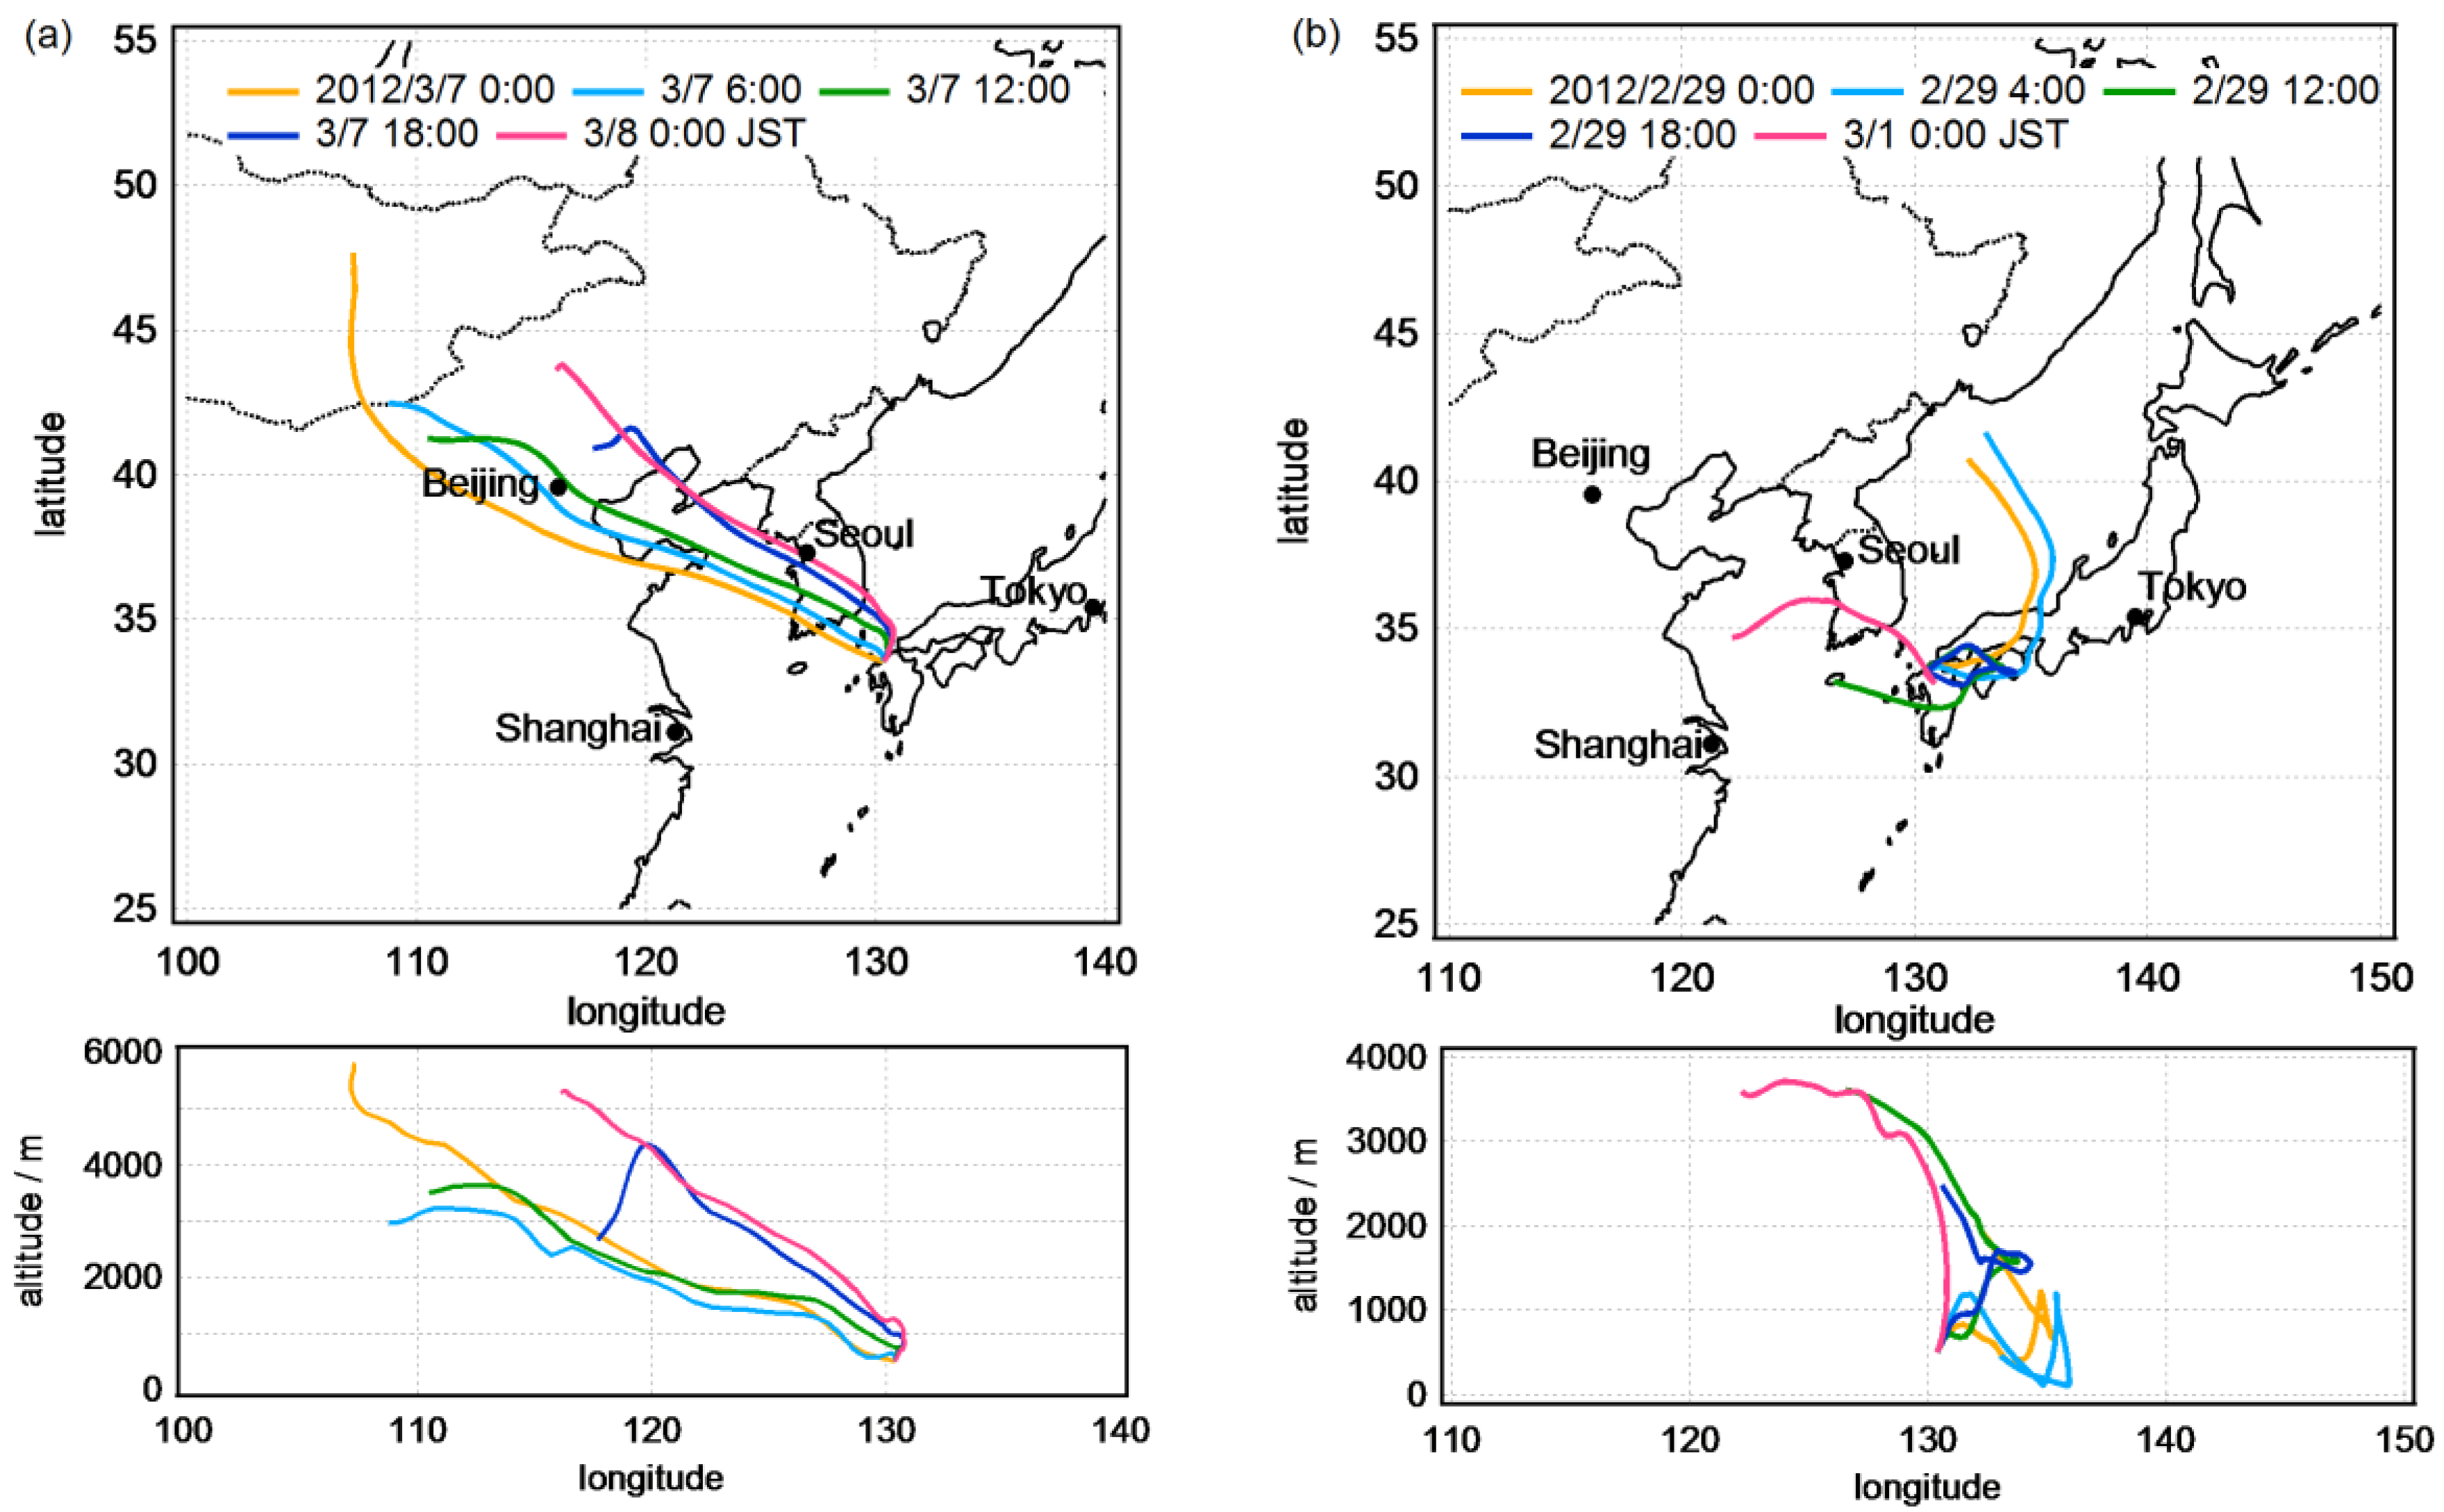
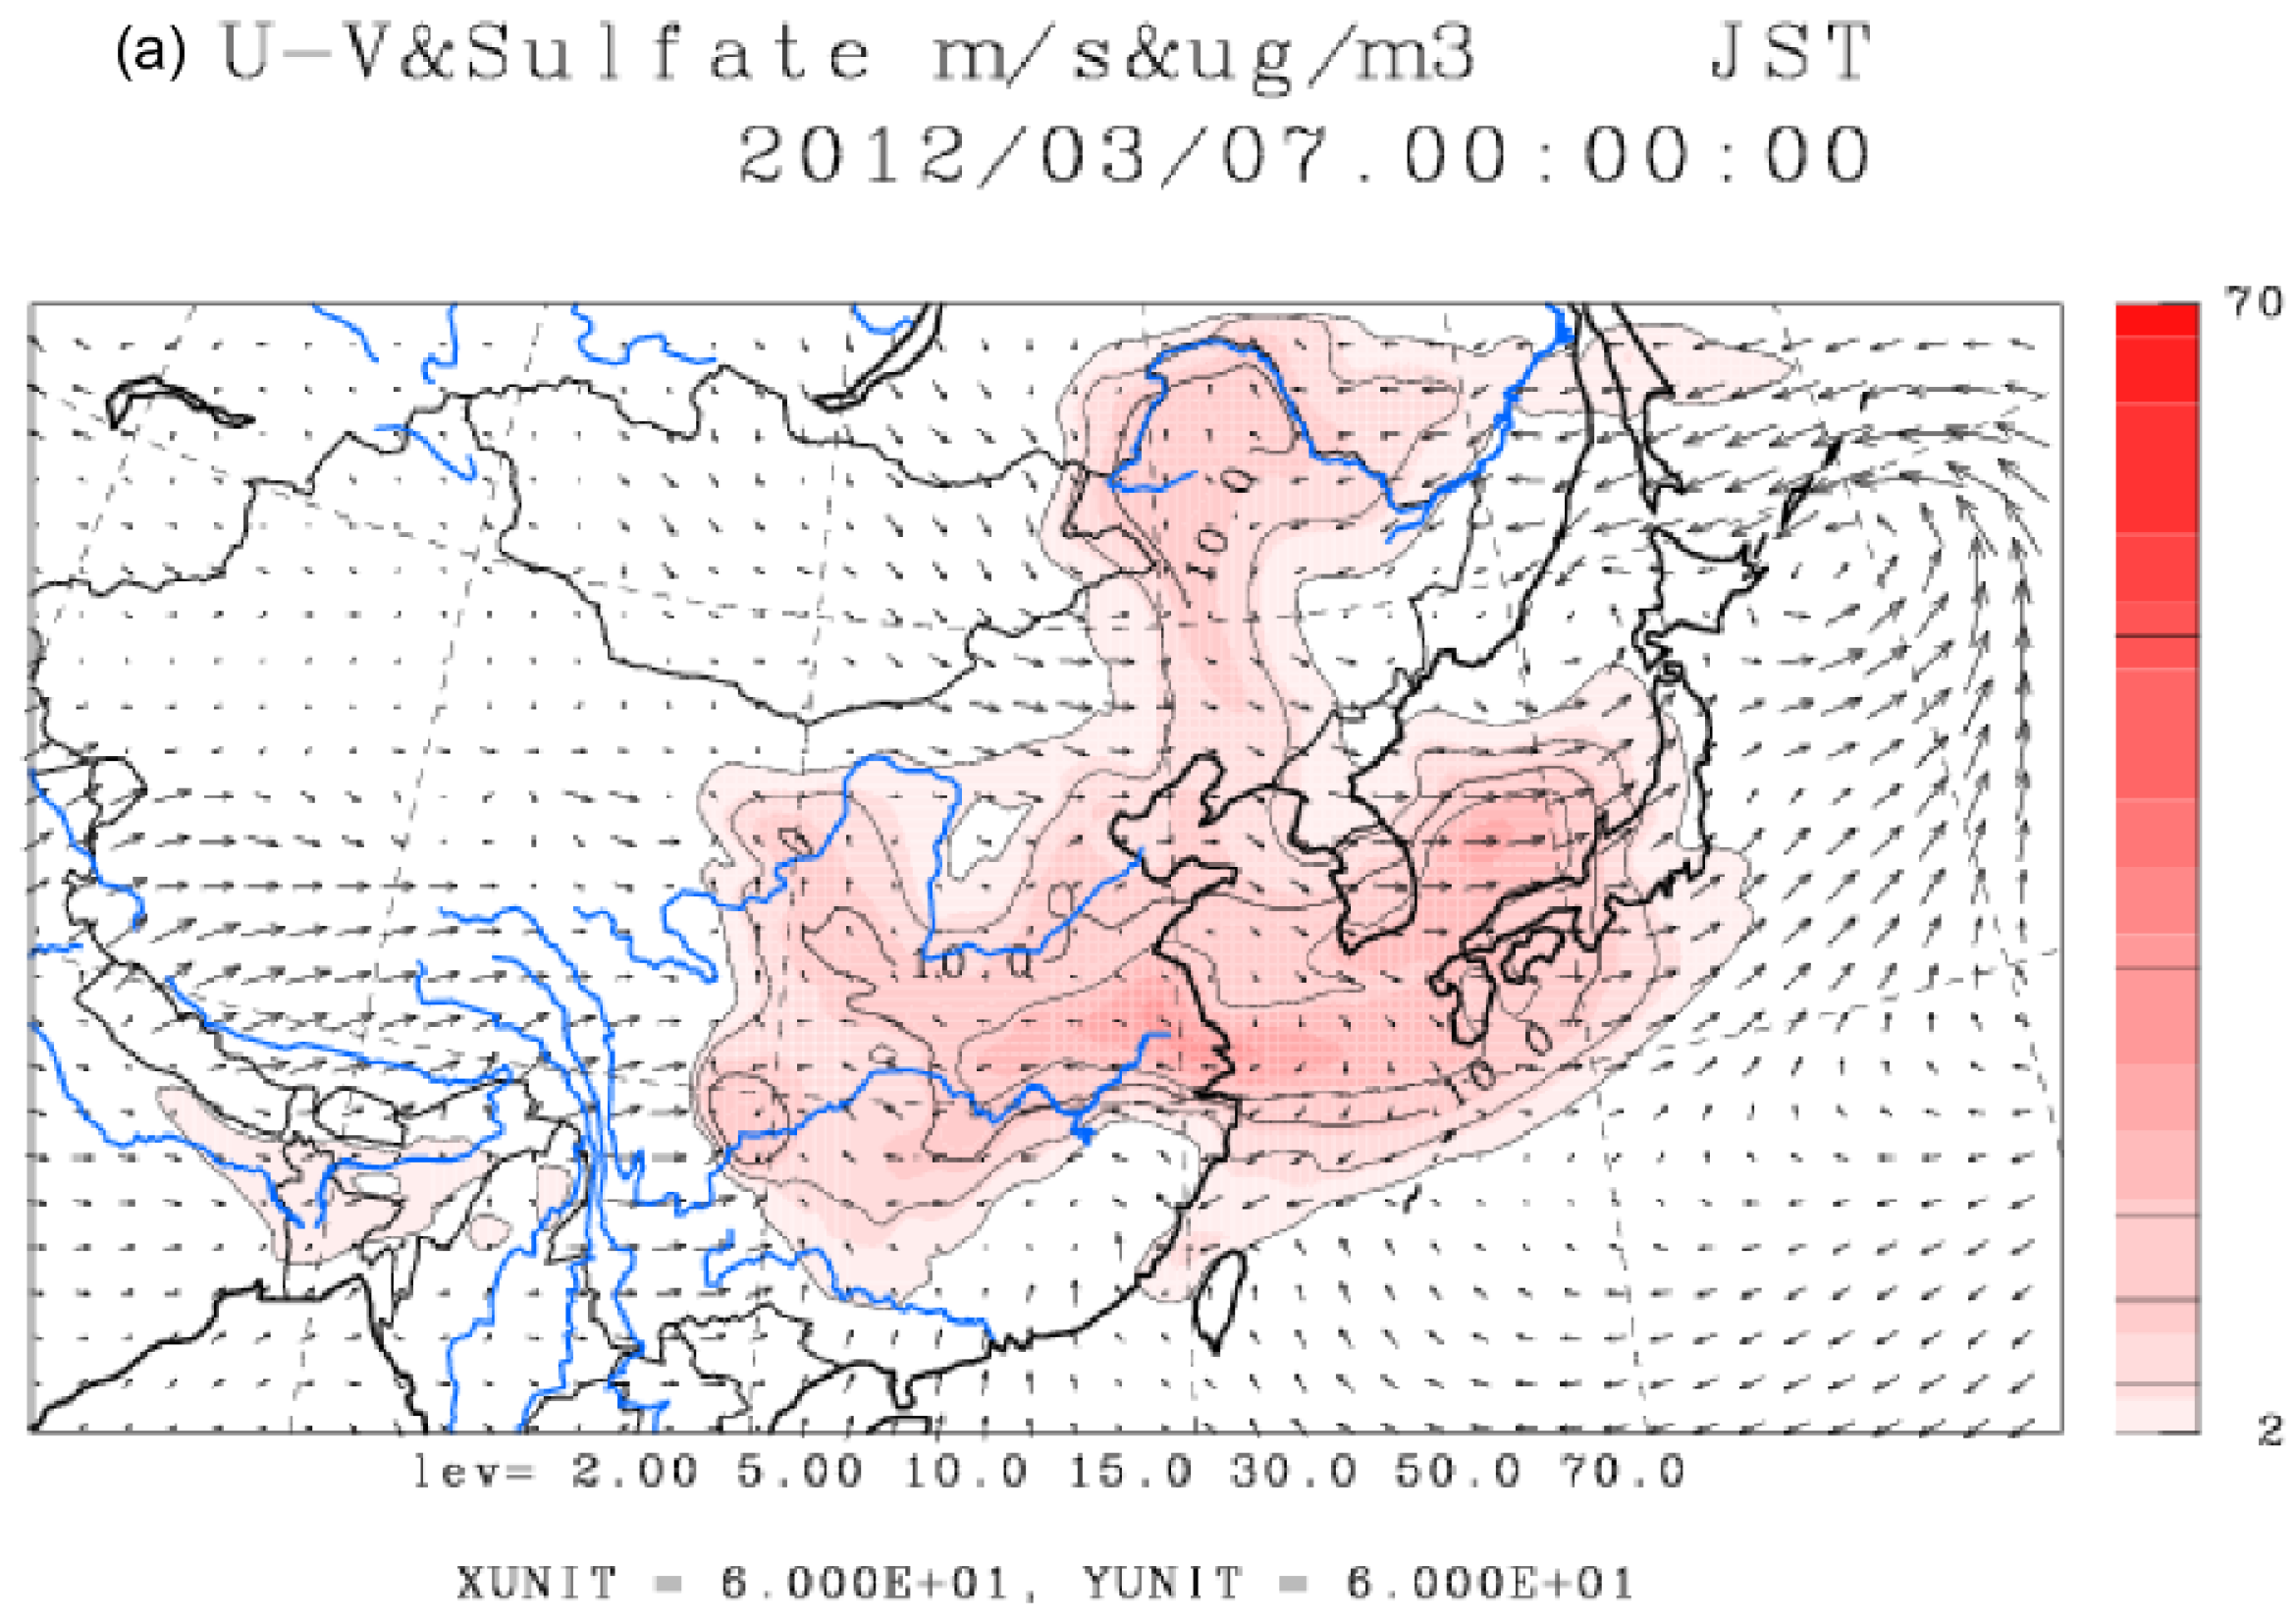
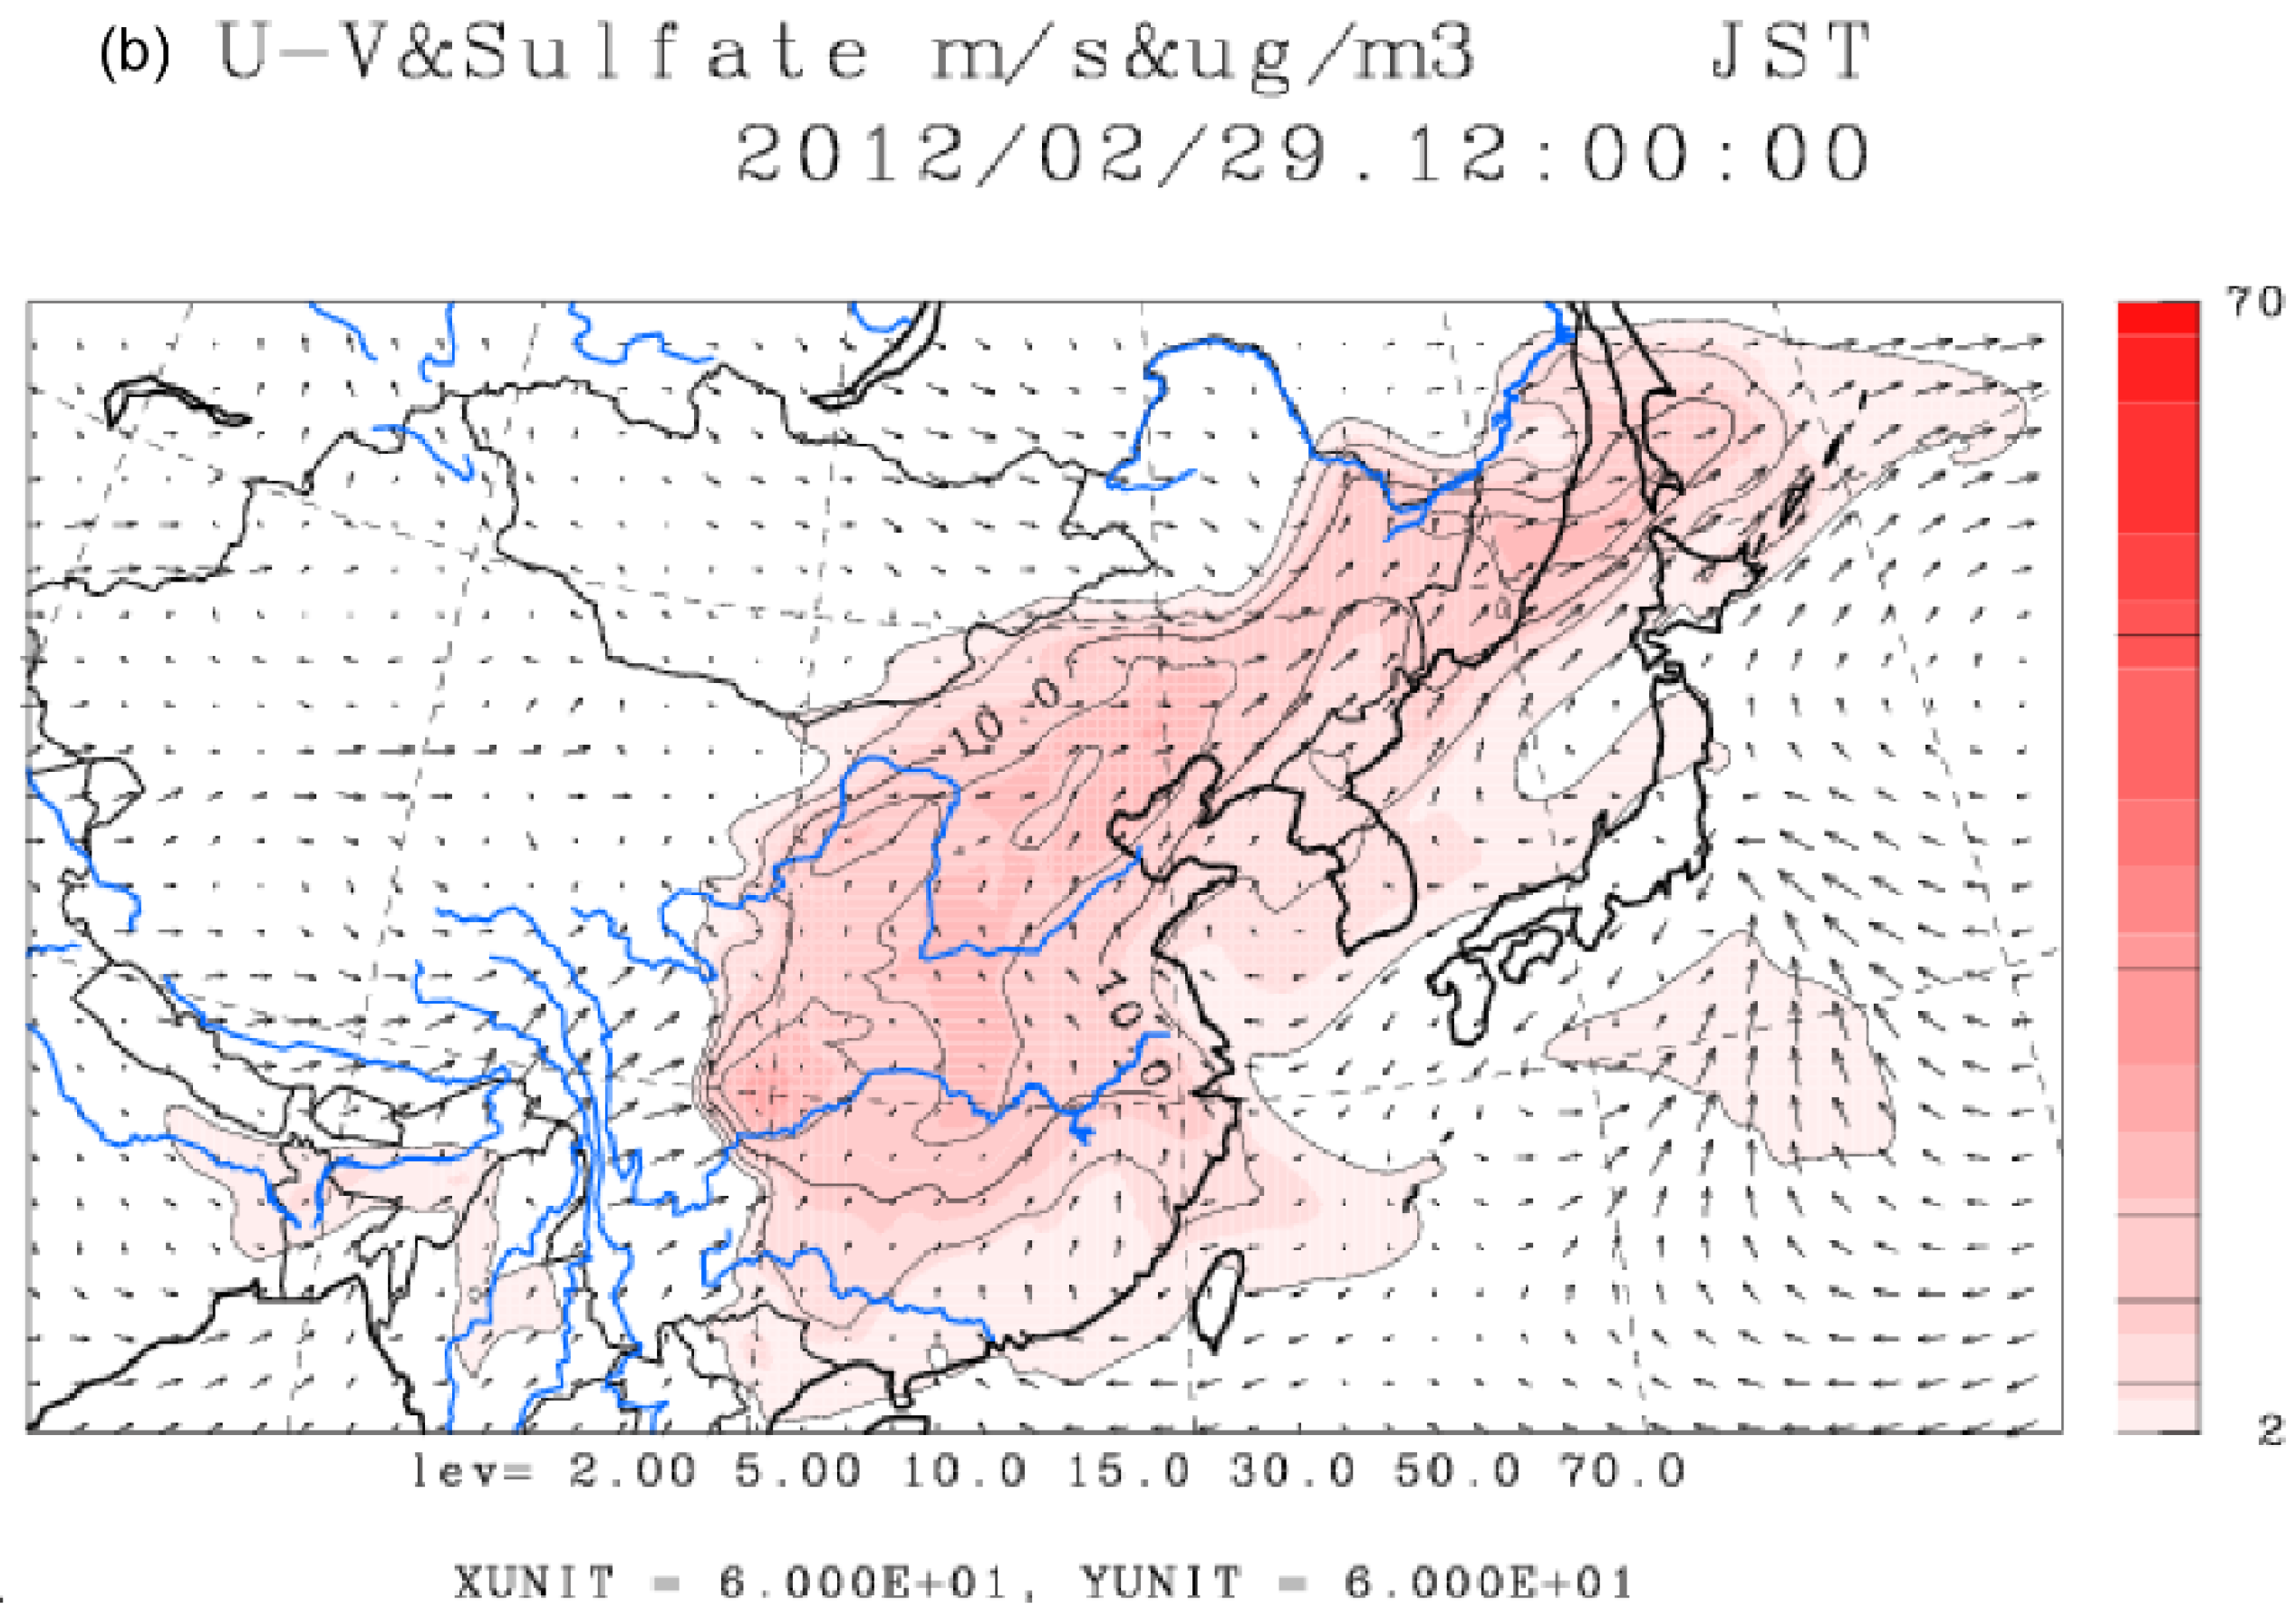
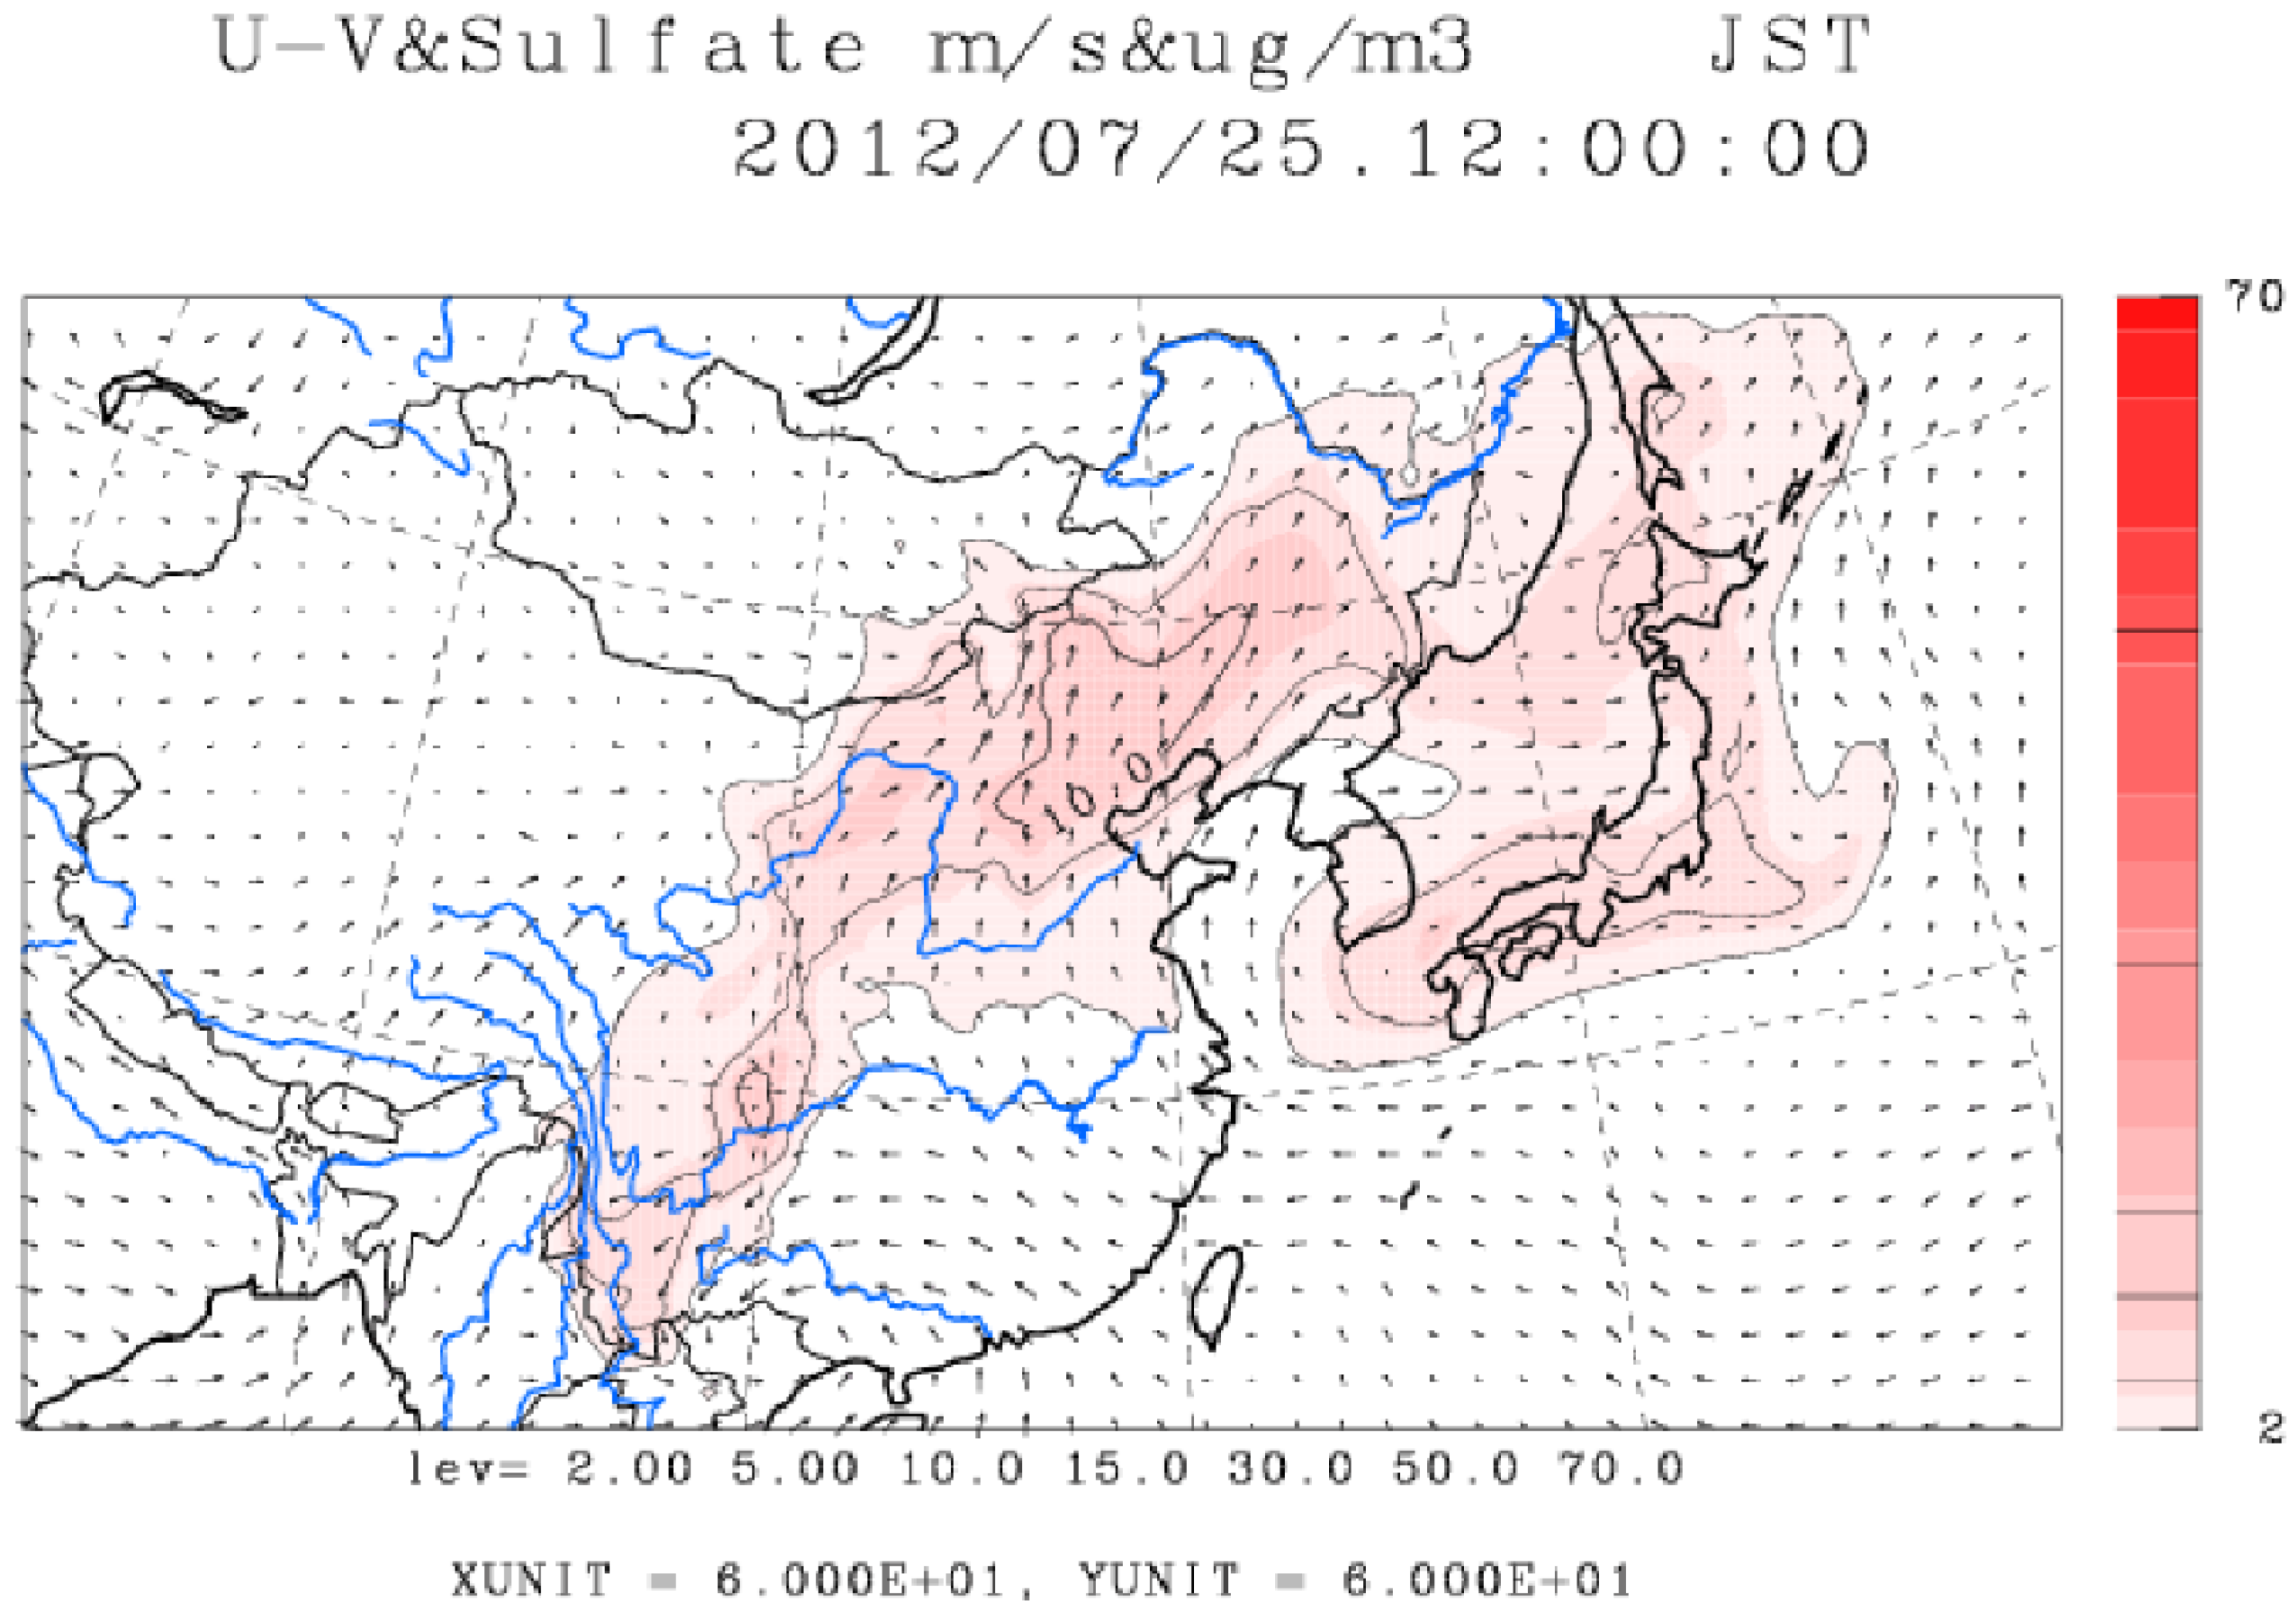
3.3. Simulation Results

Figure 7 and Figure 8 show the typical backward trajectories in Fukuoka City and sulfate space distributions in East Asia when sulfate and PM2.5 concentrations are high (7 March) and low (29 February) in spring. In Figure 7a, most of the trajectories end up in mainland China via the East China Sea when PM2.5 mass concentrations are high. In Figure 8a, high sulfate levels cover the region of mainland China all the way to western Japan under high PM2.5 concentrations. These simulations indicate that high sulfate and PM2.5 levels were due to the air pollution transported from mainland China.

4. Discussion

4.1. Air Quality in Fukuoka City-Local vs. Trans-Boundary Air Pollution

Fukue Island’s population of approximately 40,000 relies heavily on the main industries of fishing and tourism. Therefore, local emissions on Fukue Island are expected to be very low compared to Fukuoka City. Chemical composition shows that sulfate levels are high on Fukue Island, regardless of PM2.5 mass concentrations. The PMF results show that factor 1 (LV-OOA) is dominant. This indicates that the air quality on Fukue Island is mainly influenced by long-range transport of air pollution from mainland China. This is consistent with previous reports [3,5,6,7,8].
In Fukuoka City, the results are different from those observed on Fukue Island. The chemical composition varies according to PM2.5 concentrations. High sulfate levels were observed under high PM2.5 concentrations. In this case, factor 1 (LV-OOA) in the PMF analysis is dominant. Under low PM2.5 concentrations, however, nitrate and organic fractions are more prevalent. In addition, factor 2 (SV-OOA and HOA) in the PMF analysis is larger than factor 1 (LV-OOA).
Based on these results, it is considered that the air quality in Fukuoka City is mainly influenced by the long-range transport of air pollution from mainland China when PM2.5 mass concentrations are high (>35 µg·m−3). In contrast, when PM2.5 mass concentrations are low (<10 µg·m−3), the air quality in the Fukuoka is mainly influenced by local air pollution in and around the Fukuoka. The backward trajectories and the CFORS simulations support these results. As aforementioned, most of the trajectories reach mainland China via the East China Sea, and high sulfate regions cover China to western Japan under high PM2.5 concentrations (Figure 7a and Figure 8a). With low PM2.5 concentrations, the trajectories either reach from the Japanese side or Pacific Ocean, and high sulfate regions are not covering western Japan (Figure 7b and Figure 8b). These results are also consistent with the previous report [9].
Air pollution in Fukuoka consists of two parts. The first is local emissions. At low PM2.5 concentrations, the fractions of nitrate and fresh organics (HOA) are relatively large, indicating that combustion is a major contributor to emissions affecting local air quality [17,25,26,27]. The source of this combustion could be any of the several highways, the Fukuoka airport, the Fukuoka shipyard, and numerous commercial areas in Fukuoka City. Therefore, it can be concluded that local emissions influence the local air quality. The other part is air pollution from China. Sulfur dioxide (SO2) and nitrogen oxides (NOx) in China are still a large component of emissions [1,2,28]. In 2008, SO2 emissions for China and Japan were 33.5 Tg and 0.8 Tg, respectively: SO2 levels were more than 40 times higher in China than in Japan. Although it is considered that SO2 emissions in China have been decreasing since 2006, the SO2 concentration has been still high in China. It is reasonable that sulfate is found to be high when the trans-boundary air pollution is dominant under high PM2.5 concentration.
Nitrate was not found in PM1 measured using Q-AMS when PM2.5 concentrations were high. In 2008, NOx emissions for China and Japan were 27.0 Tg and 2.2 Tg, respectively: NOx levels were about 13 times higher in China than in Japan. Although NOx emissions are much higher in China compared to the NOx emission in Japan, the nitrate is usually found in coarse particles after the long-range transport [12]. In contrast, sulfate remains in the fine particles. Therefore, sulfate is found to be the major chemical component of fine particulate matter (PM1) when the trans-boundary air pollution is dominant.
Figure 9 shows the frequency of daily PM2.5 mass concentrations throughout 2012 for Fukuoka. There were a total of 20 days when PM2.5 mass concentrations exceeded environmental quality standard (>35 µg·m−3), which are 5.5% per year and 11% in spring time (10 days between March–May). The air quality in Fukuoka, which is in the western part of Japan, is largely affected by trans-boundary, long-range transported air pollution from mainland China.

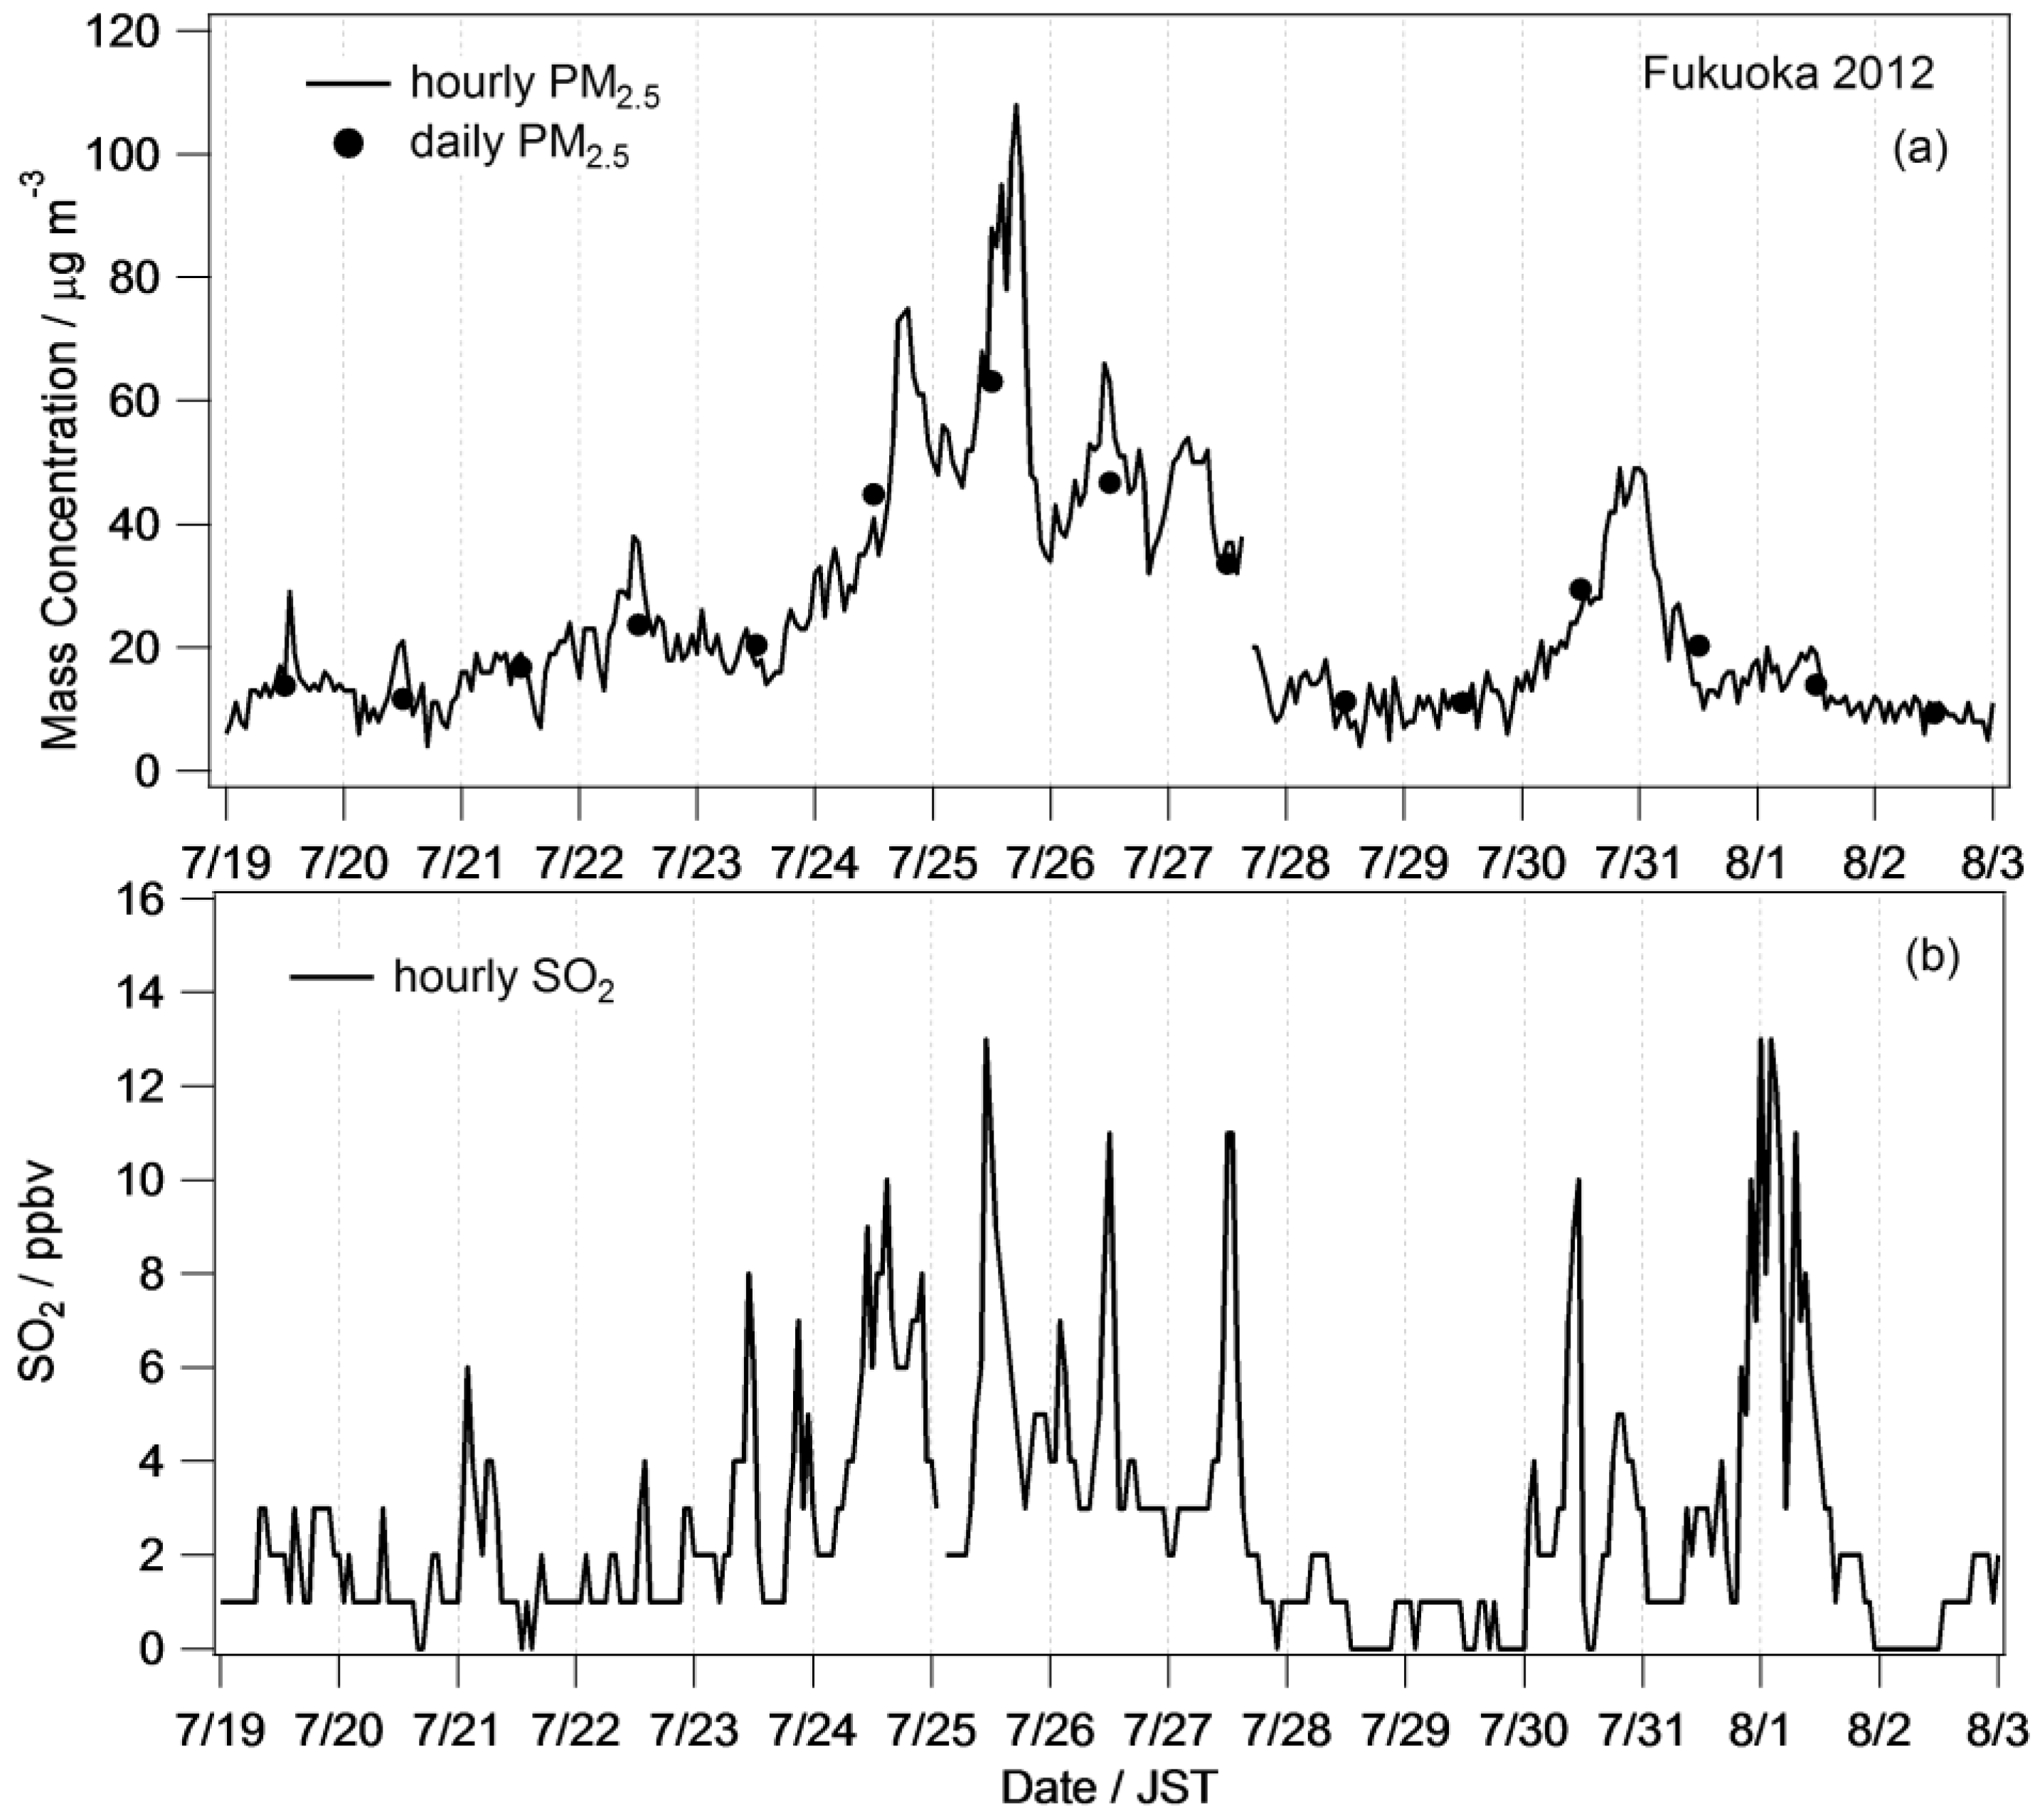
4.2. High PM2.5 Event in Summer

It was considered that trans-boundary air pollution was often observed in the winter-spring season. In 2012, high PM2.5 concentrations were observed during summer time. There were several days when the daily PM2.5 concentrations were over 35 µg·m−3. Figure 10a shows hourly and daily averaged PM2.5 concentrations from 19 July to 2 August. The maximum daily PM2.5 concentration was 63.1 µg·m−3 on 25 July. That day, a high PM2.5 concentration was also observed in Osaka [29]. The chemical and organic compositions are shown in Figure 11. The fraction of sulfate and factor 1 (LV-OOA) is about 50% and 60%, respectively. There are several reasons for this high sulfate event. The first one is volcanic activities. There is an active volcano called Mt. Sakurajima in Kagoshima, which is about 300 km south to Fukuoka City (31.34°N, 130.39°E). Explosive eruption have been occurring continuously since 1955. Mt. Sakurajima was active in summer 2012 and volcanic eruption occurred several times. During the high PM2.5 period shown in Figure 10b, high concentration peaks of SO2, measured at Fukuoka City Hall, were observed several times. The biggest eruption occurred at 19:15 on 24 July [30], and high sulfate and SO2 were observed on 25 July. Therefore, one of the reasons can be attributed to the volcanic activities. The second reason is photochemical reaction in the atmosphere. The fraction of factor 1 (LV-OOA) is about 60%, which is not as high as that on Fukue Island during winter-spring season and similar to the average values of urban OOA [31]. Therefore, the aged and oxygenated organic compounds in urban area certainly contributed the factor 1 (LV-OOA). The third one is trans-boundary air pollution. The CFORS simulation for 25 July shows that the high sulfate area covers the northern Kyushu region shown in Figure 12. The high sulfate area originally covered in the mainland China on 20 July, and the area moved to the northern part of China and the Korean peninsula. Then, a part of high sulfate area moved down to the southern area and covered some part of Japan. A simulation called SPRINTARS also shows that the high sulfate region averaged in July 2012 covered the northern part of Kyushu and the west Japanese region facing the Japan Sea [29]. This high sulfate region moved from China to Japan during this high PM2.5 concentration period (from 20 to 28 July). Although we do not know if summer levels in 2012 were unique, this high PM2.5 concentration event shows that trans-boundary air pollution occurs not only in winter-spring but also in summer and plays a significant role in air quality for Fukuoka City.

5. Conclusions

This study observed PM mass concentrations and chemical compositions in Fukuoka and Fukue Island in the northern part of Kyushu, Japan in 2012. Based on the chemical analysis, air quality in Fukuoka City was influenced by trans-boundary air pollution when the PM2.5 concentrations were high. It was found that sulfate and LV-OOA were dominant under high PM2.5 concentrations (>35 µg·m−3), and the air mass was transported from China according to backward trajectories and CFORS simulations. It is considered that local emissions influence the air quality in Fukuoka City when PM2.5 concentrations are low. The fractions of nitrate and organics of non-LV-OOA were large under low PM2.5 concentration (<10 µg·m−3), and the air mass passed around the Pacific Ocean and Japanese side.
There were a total of 20 days when the PM2.5 mass concentrations exceeded environmental quality standards (>35 µg·m−3) in Fukuoka. High PM2.5 concentrations were observed in summer 2012. Three reasons are considered, which are volcanic activities, photochemical reaction and trans-boundary air pollution. Although previous studies have shown that trans-boundary air pollution prevails in the winter-spring season, it occurs not only in winter-spring but also in summer and has a significant impact on the air quality of Fukuoka.

Acknowledgments

This work was supported by The Ministry of Education, Culture, Sports, Science and Technology, Grants-in-Aid for Scientific Research (Grant-in-Aid for Scientific Research on Innovative Areas No. 4003), Japan Society for the Promotion of Science, Grants-in-Aid for Scientific Research (Grant No. 24310024), and the Ministry of Environment, Environment Research and Technology Development Fund, Japan (Grant No. 5-1452, 2-1403, S-12). We thank Satoshi Irei for his support of our observation.

Author Contributions

Ayako Yoshino and Akinori Takami conceived and designed the experiments and performed the AMS and ACSM experiments; Naoki Kaneyasu performed the TEOM experiments; Atsushi Shimizu performed the CFORS simulations; Ayako Yoshino analyzed the data; Kei Sato, Shiro Hatakeyama, Keiichiro Hara, and Masahiko Hayashi contributed experiments and analysis tools; Ayako Yoshino and Akinori Takami wrote the paper.

Conflicts of Interest

The authors declare no conflict of interest.

Abbreviations

The following abbreviations are used in this manuscript:
PM
Particulate matter
Q-AMS
Quadrupole-type aerosol mass spectrometer
Q-ACSM
Quadrupole-type aerosol chemical speciation monitor
TEOM
Tapered element oscillating microbalance
PMF
Positive matrix factorization
CFORS
Chemical weather forecasting system
OA
Organic aerosol
LV-OOA
Low-volatile oxygenated OA
SV-OOA
Semi- volatile oxygenated OA
HOA
Hydrocarbon-like OA

References

  1. Kurokawa, J.; Ohara, T.; Morikawa, T.; Hanayama, S.; Janssens-Maenhout, G.; Fukui, T.; Kawashima, K.; Akimoto, H. Emissions of air pollutants and greenhouse gases over Asian regions during 2000–2008: Regional Emission Inventory in ASia (REAS) Version 2. Atmos. Chem. Phys. 2013, 13, 11019–11058. [Google Scholar] [CrossRef]
  2. Lu, Z.; Streets, D.G.; Zhang, Q.; Wang, S.; Carmichael, G.R.; Cheng, Y.F.; Wei, C.; Chin, M.; Diehl, T.; Tan, Q. Sulfur dioxide emissions in China and sulfur trends in East Asia since 2000. Atmos. Chem. Phys. 2010, 10, 6311–6331. [Google Scholar] [CrossRef]
  3. Takami, A.; Miyoshi, T.; Shimono, A.; Hatakeyama, S. Chemical composition of fine aerosol measured by AMS at Fukue Island, Japan during APEX Period. Atmos. Environ. 2005, 39, 4913–4924. [Google Scholar] [CrossRef]
  4. Takami, A.; Miyoshi, T.; Shimono, A.; Kaneyasu, N.; Kato, S.; Kajii, Y.; Hatakeyama, S. Transport of anthropogenic aerosols from Asia and subsequent chemical transformation. J. Geophys. Res. 2007, 112, D22S31. [Google Scholar] [CrossRef]
  5. Kanaya, Y.; Taketani, F.; Irie, H.; Komazaki, Y.; Takashima, H.; Uno, I. PM2.5 mass concentrations observed at Fukue island, Kyushu, Japan: Exceeding the atmospheric environmental standard. J. Jpn. Soc. Atmos. Environ. 2010, 45, 289–292. (In Japanese) [Google Scholar]
  6. Kaneyasu, N.; Takami, A.; Sato, K.; Hatakeyama, S.; Hayashi, M.; Hara, K.; Lim-Serok, C.; Joon-Young, A. Long-range transport of PM2.5 in northern Kyushu area in spring. J. Jpn. Soc. Atmos. Environ. 2010, 45, 227–234. (In Japanese) [Google Scholar]
  7. Kaneyasu, N.; Takami, A.; Sato, K.; Hatakeyama, S.; Hayashi, M.; Hara, T.; Kawamoto, K.; Yamamoto, S. Year-round behavior of PM2.5 in a remote island and urban sites in northern Kyushu area, Japan. J. Jpn. Soc. Atmos. Environ. 2011, 46, 111–118. (In Japanese) [Google Scholar]
  8. Takami, A.; Mayama, N.; Sakamoto, T.; Ohishi, K.; Irei, S.; Yoshino, A.; Hatakeyama, S.; Murano, K.; Sadanaga, Y.; Bandow, H.; et al. Structural analysis of aerosol particles by microscopic observation using a time-of-flight secondary ion mass spectrometer. J. Geophys. Res. 2013, 118, 6726–6737. [Google Scholar] [CrossRef]
  9. Takami, A.; Miyoshi, T.; Irei, S.; Yoshino, A.; Sato, K.; Shimizu, A.; Hayashi, M.; Hara, K.; Kaneyasu, N.; Hatakeyama, S. Analysis of organic aerosol in Fukuoka, Japan using a PMF method. Aerosol Air Qual. Res. 2016, 16, 314–322. [Google Scholar] [CrossRef]
  10. Murano, K.; Mukai, H.; Hatakeyama, S.; Jang, E.S.; Uno, I. Trans-boundary air pollution over remote islands in Japan: Observed data and estimates from a numerical model. Atmos. Environ. 2000, 34, 5139–5149. [Google Scholar] [CrossRef]
  11. Shimohara, T.; Oishi, O.; Utsunomiya, A.; Mukai, H.; Hatakeyama, S.; Jang, E.-S.; Uno, I.; Murano, K. Characterization of atmospheric air pollutants at two sites in northern Kyushu, Japan—Chemical form, and chemical reaction. Atmos. Environ. 2001, 35, 667–681. [Google Scholar] [CrossRef]
  12. Takiguchi, Y.; Takami, A.; Sadanaga, Y.; Lun, A.; Shimizu, A.; Matsui, I.; Sugimoto, N.; Wang, W.; Bandow, H.; Hatakeyama, S. Transport and transformation of total reactive nitrogen over the East China Sea. J. Geophys. Res. 2008, 113, D10306. [Google Scholar] [CrossRef]
  13. Jayne, J.T.; Leard, D.C.; Zhang, X.; Davidovits, P.; Smith, K.A.; Kolb, C.E.; Worsnop, D.R. Development of an Aerosol mass spectrometer for size and composition analysis of submicron particles. Aerosol Sci. Technol. 2000, 33, 49–70. [Google Scholar] [CrossRef]
  14. Allan, J.D.; Jimenez, J.L.; Coe, H.; Bower, K.N.; Williams, P.I.; Worsnop, D.R. Quantitative sampling using an Aerodyne aerosol mass spectrometer: Part 1. techniques of data interpretation and error analysis. J. Geophys. Res. 2003, 108. [Google Scholar] [CrossRef]
  15. Allan, J.D.; Alfarra, M.R.; Bower, K.N.; Williams, P.I.; Gallagher, M.W.; Jimenez, J.L.; McDonald, A.G.; Nemitz, E.; Canagaratna, M.R.; Jayne, J.T.; et al. Quantitative sampling using an Aerodyne aerosol mass spectrometer: Part 2. Measurements of fine particulate chemical composition in two U.K. cities. J. Geophys. Res. 2003, 108. [Google Scholar] [CrossRef]
  16. Jimenez, J.L.; Jayne, J.T.; Shi, Q.; Kolb, C.E.; Worsnop, D.R.; Yourshaw, I.; Seinfeld, J.H.; Flagan, R.C.; Zhang, X.; Smith, K.A.; et al. Ambient aerosol sampling using the Aerodyne aerosol mass spectrometer. J. Geophys. Res. 2003, 108. [Google Scholar] [CrossRef]
  17. Canagaratna, M.R.; Jayne, J.T.; Jimenez, J.L.; Allan, J.D.; Alfarra, M.R.; Zhang, Q.; Onasch, T.B.; Drewnick, F.; Coe, H.; et al. Chemical and microphysical characterization of ambient aerosols with the Aerodyne aerosol mass spectrometer. Mass Spect. Rev. 2007, 26, 185–222. [Google Scholar] [CrossRef] [PubMed]
  18. Paatero, P.; Tapper, U. Positive matrix factorization: A non negative factor model with ; Weimer, S. Optimal utilization of error estimates of data values. Environmetrics 1994, 5, 111–126. [Google Scholar] [CrossRef]
  19. Paatero, P. Least squares formulation of robust non-negative factor analysis. Chem. Intell. Lab. Syst. 1997, 37, 23–35. [Google Scholar] [CrossRef]
  20. Ulbrich, I.M.; Canagaratna, M.R.; Zhang, Q.; Worsnop, D.R.; Jimenez, J.L. Interpretation of organic components from positive matrix factorization of aerosol mass spectrometric data. Atmos. Chem. Phys. 2009, 9, 2891–2918. [Google Scholar] [CrossRef]
  21. Draxler, R.R.; Rolph, G.D. HYSPLIT (HYbrid Single-Particle Lagrangian Integrated Trajectory) Model. Available online: http://ready.arl.noaa.gov/HYSPLIT.php (accessed on 1 February 2016).
  22. Rolph, G.D. Real-time Environmental Applications and Display sYstem (READY). Available online: http://ready.arl.noaa.gov (accessed on 1 February 2016).
  23. Uno, I.; Carmichael, G.R.; Streets, D.G.; Tang, Y.; Yienger, J.J.; Satake, S.; Wang, Z.; Woo, J.H.; Guttikunda, S.; Uematsu, M.; et al. Regional chemical weather forecasting system CFORS: Model descriptions and analysis of surface observations at Japanese island stations during the ACE-Asia experiment. J. Geophys. Res. 2003, 108, 8668. [Google Scholar] [CrossRef]
  24. CFORS (Chemical Weather FORecasting System). Available online: http://www-cfors. nies.go.jp/~cfors/ (accessed on 1 February 2016).
  25. Jimenez, J.L.; Canagaratna, M.R.; Donahue, N.M.; Prevot, A.S.H.; Zhang, Q.; Kroll, J.H.; DeCarlo, P.F.; Allan, J.D.; Coe, H.; Ng, N.L.; et al. Evolution of organic aerosols in the atmosphere. Science 2009, 326, 1525–1529. [Google Scholar] [CrossRef] [PubMed]
  26. Alfarra, M.R.; Coe, H.; Allan, J.D.; Bower, K.N.; Boudries, H.; Canagaratna, M.R.; Jimenez, J.L.; Jayne, J.T.; Garforth, A.A.; Li, S.-M.; et al. Characterization of urban and rural organic particulate in the Lower Fraser Vally using two Aerodyne Aerosol Mass Spectrometers. Atmos. Environ. 2004, 38, 5745–5758. [Google Scholar] [CrossRef]
  27. Zhang, Q.; Canagaratna, M.R.; Jayne, J.T.; Worsnop, D.R.; Jimenez, J.L. Time-and size-resolved chemical composition of submicron particles in Pittsburgh: Implications for organic aerosol sources and processes. J. Geophys. Res. 2005, 110, D07S09. [Google Scholar] [CrossRef]
  28. Ohara, T.; Akimoto, H.; Kurokawa, J.; Horii, N.; Yamaji, K.; Yan, X.; Hayasaka, T. An Asian emission inventory of anthropogenic emission sources for the period 1980–2020. Atmos. Chem. Phys. 2007, 7, 4419–4444. [Google Scholar] [CrossRef]
  29. Takami, A.; Irei, S.; Kimoto, T.; Takemura, T.; Hayashi, M.; Hara, K.; Miyoshi, T.; Ueda, K.; Sato, K.; Kaneyasu, N.; et al. An analysis of high sulfate ion events in Fukuoka and Osaka city in summer 2012. Earozoru. Kenkyu. 2013, 28, 281–286. (In Japanese) [Google Scholar]
  30. Watanabe, K.; Yamazaki, N.; Mizouchi, R.; Iwamoto, Y.; Matsuki, A.; Sadanaga, Y.; Bandow, H.; Iwasaka, Y. High concentrations of sulfur dioxide and sulfate particles observed in Suzu city, the Noto peninsula in late July 2012: On the influence of the smoke of Sakurajima. Tenki 2015, 62, 201–208. (In Japanese) [Google Scholar]
  31. Zhang, Q.; Jimenez, J.L.; Canagaratna, M.R.; Allan, J.D.; Coe, H.; Ulbrich, I.; Alfarra, M.R.; Takami, A.; Middlebrook, A.M.; Sun, Y.L.; et al. Ubiquity and dominance of oxygenated species in organic aerosols in anthropogenically-influenced Northern Hemisphere midlatitudes. Geophys. Res. Lett. 2007, 34, L13801. [Google Scholar] [CrossRef]
Figure 1. Location of Fukuoka City and Fukue Island in East Asia.
Atmosphere 07 00051 g001
Figure 2. Variations of mass concentrations of PM2.5 (dot) and chemical composition of PM1 during 2012. (a) Fukuoka City (b) Fukue Island.
Atmosphere 07 00051 g002
Figure 3. Breakdown of chemical composition of PM measured using Q-AMS. NH4: ammonium, NO3: nitrate, SO4: sulfate, Chl: chloride, Org: organics. (a) Fukuoka City (b) Fukue Island.
Atmosphere 07 00051 g003aAtmosphere 07 00051 g003b
Figure 4. Mass spectra of each factor produced by the PMF analysis. (a) Fukuoka City (b) Fukue Island.
Atmosphere 07 00051 g004
Figure 5. Variations of mass concentration of each factor produced by the PMF analysis. (a) Fukuoka City; (b) Fukue Island.
Atmosphere 07 00051 g005
Figure 6. Breakdown of each factor of PMF analysis. (a) Fukuoka City (b) Fukue Island.
Atmosphere 07 00051 g006
Figure 7. Typical backward trajectory calculations in Fukuoka City. Duration time of the calculations was 48 h. (a) under high PM2.5 concentrations (7 March 2012, daily average of PM2.5 was 41 µg·m−3); (b) under low PM2.5 concentrations (29 February 2012, daily average of PM2.5 was 6.0 µg·m−3).
Atmosphere 07 00051 g007
Figure 8. Typical CFORS simulations around East Asia. (a) under high PM2.5 concentrations (7 March 2012); (b) under low PM2.5 concentrations (29 February 2012).
Atmosphere 07 00051 g008aAtmosphere 07 00051 g008b
Figure 9. Frequency of daily PM2.5 mass concentrations throughout 2012 for Fukuoka City. Vertical dashed line is environmental quality standard in Japan for 24 h averaged PM2.5 mass concentrations.
Atmosphere 07 00051 g009
Figure 10. Variations of mass concentrations of PM2.5 and of mixing ratio of SO2 from 19 July to 2 August in Fukuoka City. (a) wolid line is hourly averaged PM2.5, closed circles are daily averaged PM2.5; (b) hourly averaged SO2.
Atmosphere 07 00051 g010
Figure 11. Breakdown of chemical composition measured using Q-AMS and each factor of PMF analysis from June to August of 2012 for Fukuoka City.
Atmosphere 07 00051 g011
Figure 12. CFORS simulations around East Asia on 25 July.
Atmosphere 07 00051 g012
Table 1. Monthly averaged mass concentrations of PM2.5 and chemical composition in Fukuoka City and on Fukue Island in 2012.
Fukuoka City/µg·m−3
MonthPM2.5AmmoniumNitrateSulfateChlorideOrganics
January161.31.02.50.12.7
February133.12.54.90.36.4
March192.71.74.40.14.6
April202.10.83.80.13.7
May26-----
June182.10.84.50.16.2
July232.60.47.20.04.8
August150.80.22.20.03.3
September161.10.22.50.02.3
October150.90.41.60.02.7
November161.51.02.70.13.4
December111.40.92.60.12.7
Fukue Island/µg·m−3
MonthPM2.5AmmoniumNitrateSulfateChlorideOrganics
January161.20.44.60.03.3
February130.90.33.60.02.5
March202.70.75.60.14.2
April141.30.44.00.13.4
May201.30.24.10.03.5
June14-----
July------
August------
September------
October140.50.11.90.01.6
November150.60.12.20.01.7
December110.60.13.50.02.0

