Article

Characteristics of PM10 Chemical Source Profiles for Geological Dust from the South-West Region of China

State Key Laboratory of Environmental Criteria and Risk Assessment, Chinese Research Academy of Environmental Sciences, Beijing 100012, China
*
Author to whom correspondence should be addressed.
Atmosphere 2016, 7(11), 146; https://doi.org/10.3390/atmos7110146
Submission received: 13 September 2016 / Revised: 14 November 2016 / Accepted: 15 November 2016 / Published: 19 November 2016

Abstract

:
Ninety-six particulate matter (PM10) chemical source profiles for geological sources in typical cities of southwest China were acquired from Source Profile Shared Service in China. Twenty-six elements (Na, Mg, Al, Si, K, Ca, Ti, V, Cr, Mn, Fe, Co, Ni, Cu, Zn, Ga, As, Se, Sr, Cd, Sn, Sb, Ba, Be, Tl and Pb), nine ions (F, Cl, SO42−, NO3, Na+, NH4+, K+, Mg2+ and Ca2+), and carbon-containing species (organic carbon and elemental carbon) were determined to construct these profiles. Individual source profiles were averaged and compared to quantify similarities and differences in chemical abundances using the profile-compositing method. Overall, the major components of PM10 in geological sources were crustal minerals and undefined fraction. Different chemical species could be used as tracers for various types of geological dust in the region that resulted from different anthropogenic influence. For example, elemental carbon, V and Zn could be used as tracers for urban paved road dust; Al, Si, K+ and NH4+ for agricultural soil; Al and Si for natural soil; and SO42− for urban resuspended dust. The enrichment factor analysis showed that Cu, Se, Sr and Ba were highly enriched by human activities in geological dust samples from south-west China. Elemental ratios were taken to highlight the features of geological dust from south-west China by comparing with northern urban fugitive dust, loess and desert samples. Low Si/Al and Fe/Al ratios can be used as markers to trace geological sources from southwestern China. High Pb/Al and Zn/Al ratios observed in urban areas demonstrated that urban geological dust was influenced seriously by non-crustal sources.

1. Introduction

Air pollution is of great concern in China, especially the high levels of particulate matter (PM) that occurred in the extremely heavy haze pollution of 2013 [1,2,3,4]. The challenges related to cleaning China’s air were extensively discussed by Zhang et al. [5]. The central government released the Atmospheric Pollution Prevention and Control Action Plan in September 2013, which aims to reduce PM2.5 levels by 25% relative to 2012 levels by 2017, and is backed by US $277 billion in investments from the government. Controlling emission sources is of particular importance in air pollution control [6].
One of the major contributors to urban PM is fugitive dust, which contributes 17%~32% of summer PM2.5 mass and 12%~34% of winter PM2.5 mass in 14 Chinese cities [7,8]. Geological dust is also a great concern in other parts of the world. For example, at an urban site in California, Chow et al. [9] found that 40%~60% of the ambient PM10 originated from geological sources. In Birmingham of UK and Delhi of India, as described by Pant et al. [10], elements of Ba, Si and Zn were used as markers to estimate the contributions of non-exhaust sources in road dust of PM10 to characterize the road dust emission. Alam et al. [11] in northern Pakistan observed that resuspended road/soil dust accounted for 35.9% of the total PM10 mass using positive matrix factorization (PMF) model.
Local and regional source profiles are essential for PM source-apportionment studies, and are used as input to receptor models [12], such as the chemical mass balance model (CMB), to quantify the correspondent source contributions. The SPECIATE database is currently the most comprehensive collection of source profiles available, containing over 3000 PM profiles from the literature [13]. Related source types include fugitive dust, motor vehicle exhaust, biomass burning, industrial boilers and residential coal burning. Detailed information, such as source categories, sampling and analytical methods and data quality assessment, is also recorded in the SPECIATE database. The SPECIEUROPE database of PM emission source profiles collected in Europe became accessible in 2015 [12]; in that paper, the authors explored the relationships between profiles from different sources using cluster analysis. Chemical profiles of geological sources were also reported in studies of cities in China and other countries [14,15,16,17,18,19,20,21]. However, the knowledge of geological dust source profiles is limited, especially at regional scales. Trace elements, such as Al, Si, Ca and Fe, have been used as markers for geological sources in many studies [14,22,23,24]. However, these commonly quantified compositions are often insufficient to distinguish between different geological dust profiles for its strong collinearity. Detailed regional and local source profiles are needed to better understand PM pollution and obtain reliable source-apportionment results.
China’s landcover categories may differ from other parts of the world in terms of chemical surface fluxes. As a result, imported source profiles from available overseas agencies may not represent the full emission profiles found in China. In the absence of national source profiles for emissions, researchers from the Chinese Research Academy of Environmental Science (CRAES) have been developing a Source Profile Shared Service in China (CSPSS, www.speciate.org.cn). CSPSS has collected comprehensive data from Chinese cities that reveal the profiles of different regions across the country. In southwest China, high dust loading attributed to local human activities was found but less aerosol researches have been done in this region [4,25,26]. In addition, the Asian dust events (ADEs) observed on 5~6 May 2005 and 9~14 March 2013 demonstrated that desert dust can be transported to this region, which had been considered to be nearly free of Asian dust incursions based on historical assumption [27,28]. In this study, we chose a range of PM10 source profiles of geological dust in cities of southwest China from CSPSS. Several performance measures were examined to evaluate similarities and differences among source profiles by grouping them in various ways to make composite profiles. The profile-compositing method, applied in geological dust analysis from San Joaquin Valley [9], can screen representative profiles of source categories.
Our research aims to: (1) document geological dust source profiles in southwestern cities of China acquired on the CSPSS; (2) examine similarities and differences among dust samples within and between different source types; (3) characterize the chemical composition; and (4) prepare source profiles for receptor modeling and to guide the pollution control efforts. These source profiles composites are intended to represent mass fractional abundances with their uncertainties as geological dust collected from southwest China.

2. Methods

Ninety-six geological dust profiles from four cities of southwest China were downloaded from CSPSS. Source types included: (1) paved road dust from urban areas; (2) agricultural soil from five different croplands—potato, corn, walnut, grape and orange; (3) natural soil from wetlands and mountains with little anthropogenic influences; and (4) urban resuspended dust from building platforms (roofs and windowsills) (see Table 1).
Totally, 32 dust samples were collected from 25 sites in June 2012, as shown in Table 1. The samples had been resuspended by filters, with three parallels for each. The filters were then chemically analyzed to obtain the 96 PM10 source profiles. For the analytical methods used in this study, refer to Ren et al. [29]. These data were uploaded to CSPSS for further research. Averages and standard deviations of the chemical abundances from subsets of the individual profile are intended to represent a larger source profile categories. The compositing approach is described in Figure 1.
Each successive level in Figure 1 represents a larger number of profiles in the group, but a lower commonality among the sampling locations and source categories. Level I showed similarities between surface and 20-cm-depth of soil profiles at the same location, while Level II tests for profile differences from different locations within subtypes. Level III compares profiles derived from different activities regardless of location among subtypes, and Level IV groups specific activities into four generalized emission inventory categories.
Statistical measures used in this study were described as follows: (1) the t-test determines whether the chemical abundances are distinct, with the p value threshold of 0.05; (2) the Pearson’s correlation coefficient (r) quantifies the strength of statistical relationship between profiles and we chose r > 0.8 as a good correlation according to previous studies [9,30,31]; and (3) the distribution of weighted differences [residual (R)/uncertainty (U) = (Fi1Fi2)/(σi12 + σi22)0.5] quantifies the differences between certain species from different profiles where Fij is fractions of total mass for species i from source j and σij is uncertainties of Fij. The normal probability function is used to evaluate the R/U ratios (68%, 95.5% and 99.7% for ±1σ, ±2σ and ±3σ, respectively). The number of species abundances within each range and >3σ is listed. When r > 0.8, p > 0.05 and 80% of the R/U ratios are within ±3σ, the two profiles are considered to be similar, as described by Chow et al. [9]. It is worth noting that artifacts such as sampling and analysis process may also give rise to large R/U ratio.

3. Results and Discussion

3.1. Features of Chemical Composition

3.1.1. Similarities and Differences

The profile-compositing scheme illustrated in Figure 1 is summarized in Table S1. Surface and 20-cm-depth soil samples were collected from the same location (Level I). All performance measures were applied to check the similarity of the profiles. This was the case for agricultural and natural fields. Correlation coefficients were exceeded 0.92 and p > 0.05. More than 95% of the R/U ratios showed differences between paired abundances within ±3σ. Soil samples collected from surface or 20-cm depth would have been sufficient to represent most chemical abundances from different soil crops. For comparison of paired orange soil profiles, R/U ratios exceeding 3 were Cl, organic carbon (OC) and NH4+. For Cl, the abundances were 0.37% ± 0.04% for surface soil and 0.21% ± 0.02% for 20-cm-depth. For OC, the abundances were 6.34% ± 0.65% and 3.73% ± 0.32%, respectively. Results show that the analytical uncertainty was better than the natural variability in abundances for these species. The largest R/U ratio was 15 for NH4+ with abundances of 0.11% ± 0.00% and 0.02% ± 0.01%, differing by nearly an order of magnitude. The variation in this result might have occurred because organic manure was not uniformly applied or mixed throughout the material. For grape lands, the R/U ratio of element As was 3.3, only slightly higher than the 3σ. The paired samples from natural soil have similar profiles with r value of 0.95 and 0.99, respectively. The fractions of differences within ±1σ were 93% and 85% for wetland and mountain soil, respectively. Averages of surface and depth sample profiles were used in subsequent comparison.
The comparison in level II was made for samples from different areas of subtype sources. Chemical abundances were expected to be more variable at different locations. Many species showed higher natural variabilities than analytical uncertainties as shown in Table S1. Overall, the fraction ratio of r > 0.8 declined from 100% for Level I to 85% for Level III. The differences of 93% species fell within ±3σ. There was substantial similarity between five main street dust profiles (r > 0.8), with differences over 80% of species falling within ±3σ, and no significant differences (p > 0.05). Chemical species with ratios of R/U > 3 were Na, Mg, V, Cu, Cr and elemental carbon (EC). Most of the differences between profile pairs occurred in different areas. Ga was detected at 0.01% ± 0.00% in PVRDM4, about an order of magnitude higher than that in other profiles. This indicates that Ga might be a good marker for main street #4 dust, but needs further research.
There were large differences among the four highway dust profiles (PVRDH1, -2, -3 and -4) from different areas; the correlation coefficient (r) was 0.58 for PVRDH1/PVRDH2 and 0.76 for PVRDH2/PVRDH3. Abundances of Mg, Si and Fe differed to a great level than their uncertainties in these profiles, which was partly due to different mineral contents in different areas of the soil. For example, Mg was 50% lower and Si was 60% higher in PVRDH2 than in PVRDH1, while Fe was 80% higher in PVRDH2 than in PVRDH3. Similar abundances were found among the four paved road dust profiles (PVRDB1, -2, -3 and -4), which were 30%~40% higher for Ca and 33%~80% lower for Mg in PVRDB1 than in the others. The dust profiles from the platform of buildings showed high correlations (r > 0.8). However, crustal species of URDW3 were lower than those from the other two paired profiles, i.e., 29%~37% for Mg, 20%~23% for Fe, 21%~34% for Na and 32%~48% for As. Only 40%~78% of the differences were within ±1σ, even though correlations (r > 0.95) were high for the three profiles.
The Level III composites accounted for different source subtypes as well as location-related differences. The 12 Level III profiles showed 92% of R/U ratios within ±3σ for paired comparisons. Even though the t-test results showed no statistical differences among profiles, only 40% of differences are within ±1σ overall. This is due to the larger uncertainties among the profiles. Correlations were similar to Level II, with 0.78 < r < 0.87 for three subtypes of urban paved road dust profiles, 0.82 < r < 0.97 for the five agricultural lands profiles, r = 0.96 for wetland soil (NSW) vs. mountain soil (NSM) and r = 0.78 for urban resuspended dust profiles. Due to the limited number of samples available, these subtypes of sources are further grouped into four type sources.
For the Level IV profiles that defined major emission inventory categories, the uncertainties of chemical abundances were the highest of the four levels, with most R/U ratios being <3. Most correlations were lower (0.23 < r < 0.69) than those for other levels. The lowest correlation (0.23) was found between paved road dust (PVRD) and agricultural soil (AS) profiles. All the Level IV t-test probabilities showed significant differences between the profiles.

3.1.2. Chemical Abundances

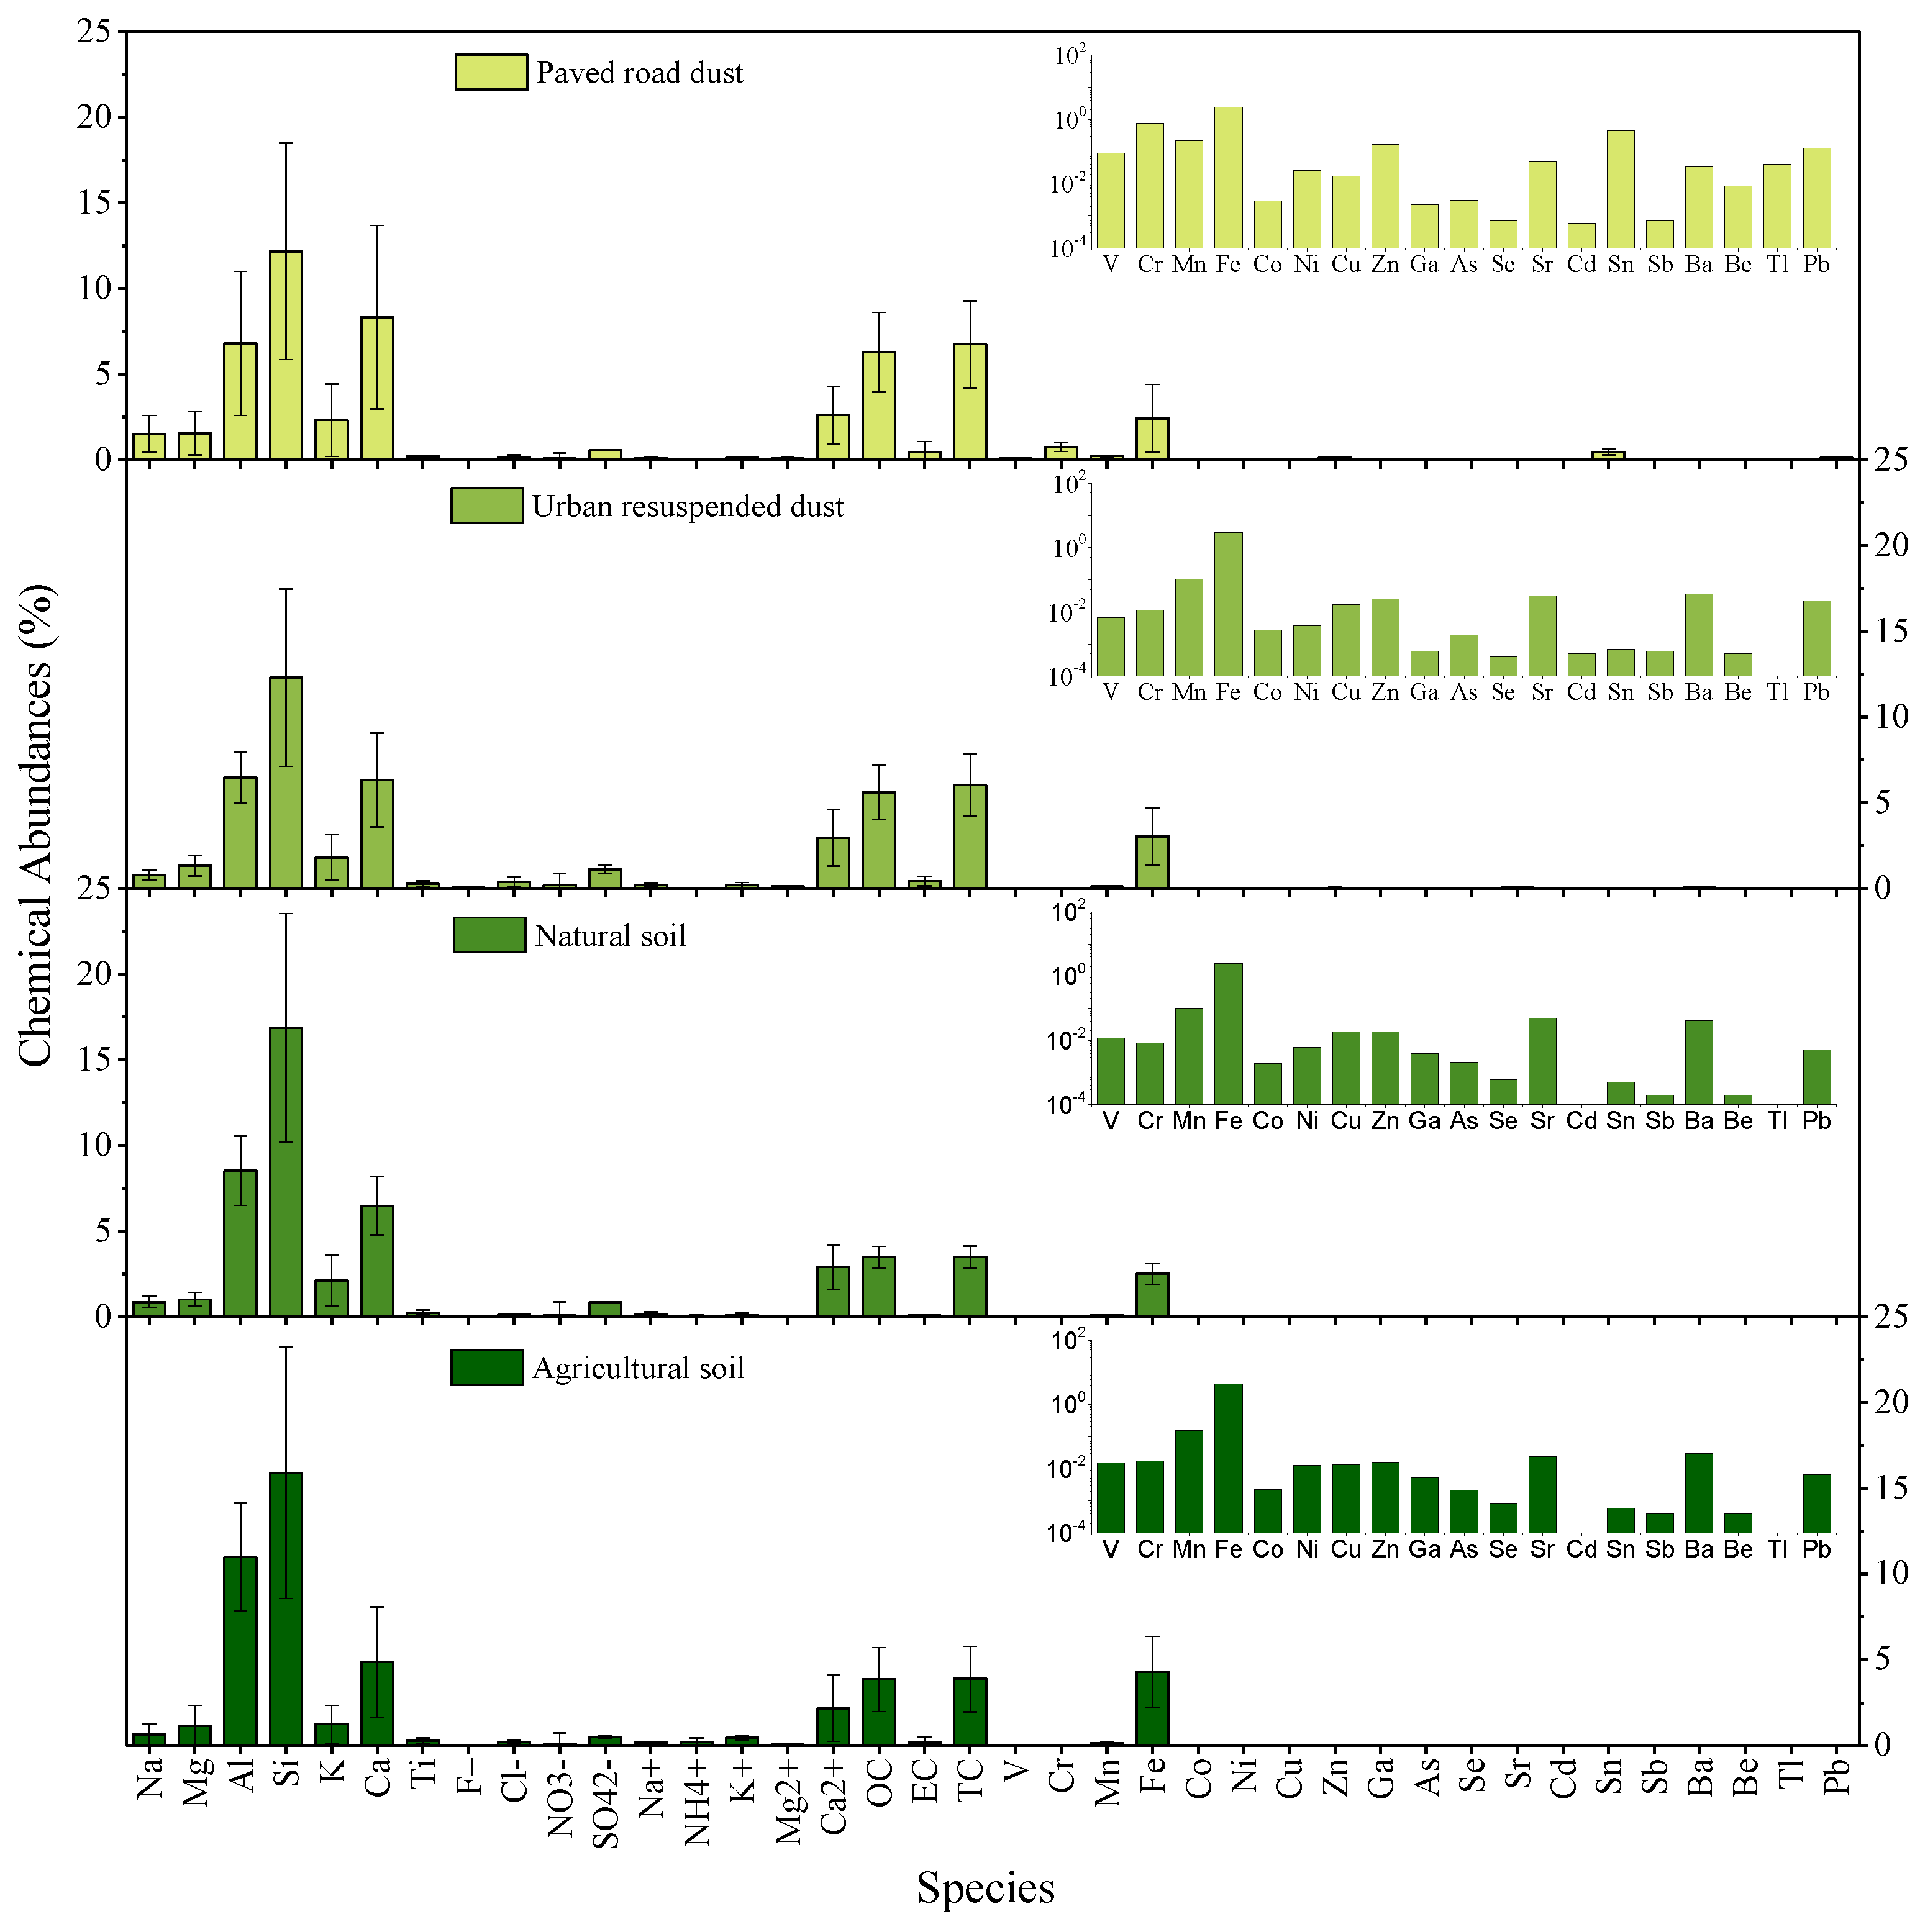
Table S2 summarizes the Level III and IV composite profiles, while Figure 2 illustrates the four Level IV source types.
The maximum-to-minimum (max/min) abundance ratios of 40 species in profiles are indicated in Figure 2. Substantial differences were found in level IV composite profiles, since the max/min ratios of many species exceeded 10. The highest abundances of EC, V, Cu, Zn, Pb and Sb were found in the urban paved road dust profile. The results are similar with other studies of road dust [10,19,21,32], which is attributed to the effect of motor vehicle contributions such as brake, tire wear and oil drips. Ho et al. [21] and Watson et al. [32] reported OC, EC and Pb as the most abundant constituents in paved road dust. The highest NH4+, K+ and Se abundances were in the agricultural soil profile; the highest NO3 was in the natural soil profile; and the highest SO42− and Cr were in the urban resuspended dust profile. Zhao et al. [33] found that Zn, Cu and Cr were enriched in urban resuspended dust in six cities of north China. The max/min ratios of OC (6.28% ± 2.33%) and EC (0.47% ± 0.61%) abundances in urban paved road dust were 3.3~7.2 and 2.3~18.1 times higher, respectively, than those in other profiles. Carbon fraction abundances were the highest in the paved road dust and lowest in the natural soil. OC/EC ratios ranged from 8 to 14 in the urban paved road dust and resuspended dust, while the ratios were 7–10 in paved road dust in San Joaquin Valley [9]. In six cities of north China, the values were 2~10 in urban resuspended dust profiles [33]. These ratios were 18–35 in the agricultural soil profile and 45~50 in the natural soil profile, while the values >100 were observed in other soil dust profiles around the world [18,19,34].
Trace elements, such as Zn, Ba, Cu, Sn and Sb, were 1.5~12 times higher in the urban paved road dust profile than those in other profiles. This might attribute to vehicle emissions from wear of tires, brakes, clutches and road surface. As, Sb, Cd, Pb, Cl and NH4+ were 1~3 times higher in agricultural soil than in the natural soil. Abundant geological species (Al and Si) were higher in the natural and agricultural soil than in the other two profiles. Ca abundances (4.89% ± 3.21%) in the agricultural soil were 33%~45% lower than other profiles. Leaching of water-soluble calcium carbonate by irrigation may increase or decrease Ca abundance in agricultural soil [9]. It was highly enriched (8.33% ± 5.36%) in the urban paved road dust, about twofold higher than those in other profiles. In general, the cation (Na+, K+, Mg2+ and Ca2+) abundances were lower than those in other regions of China [14,18,20]. This may be attributed to acid rain in southwest regions of China; soil acidification can neutralize the cation in soil [35]. Metals of Ti, V, Mn, Co, Sr and Tl were also the highest in the urban paved road dust. The profiles of urban resuspended dust were similar to those of paved road dust, except for lower Cr (0.01% ± 0.01%), V (0.01% ± 0.00%), Ni (0.004% ± 0.004%) and Zn (0.03% ± 0.03%). In addition, Cr, V and Ni exhibited a good correlation (r > 0.85) which was consistent with the findings of Cheng et al. [30], and likely related to vehicle exhaust emissions. Correlations among the crustal elements such as Al, Si, Ca and Ti were good, with 0.73 < r < 0.89 across the four source types. Mn and Fe were also observed to have good correlations with crustal elements (Al, Si and K), which indicates that Mn and Fe have mainly crustal origin. It is worth noting that Pb is still persistent in urban paved road and resuspended dust although direct emissions of Pb from vehicles have been forbidden since 2003 in China. This may be attributed to deposits of emissions from earlier vehicle exhaust and coal burning as Shen et al. [14] reported in 14 northern Chinese cities.

3.2. Contributions of the Major Components

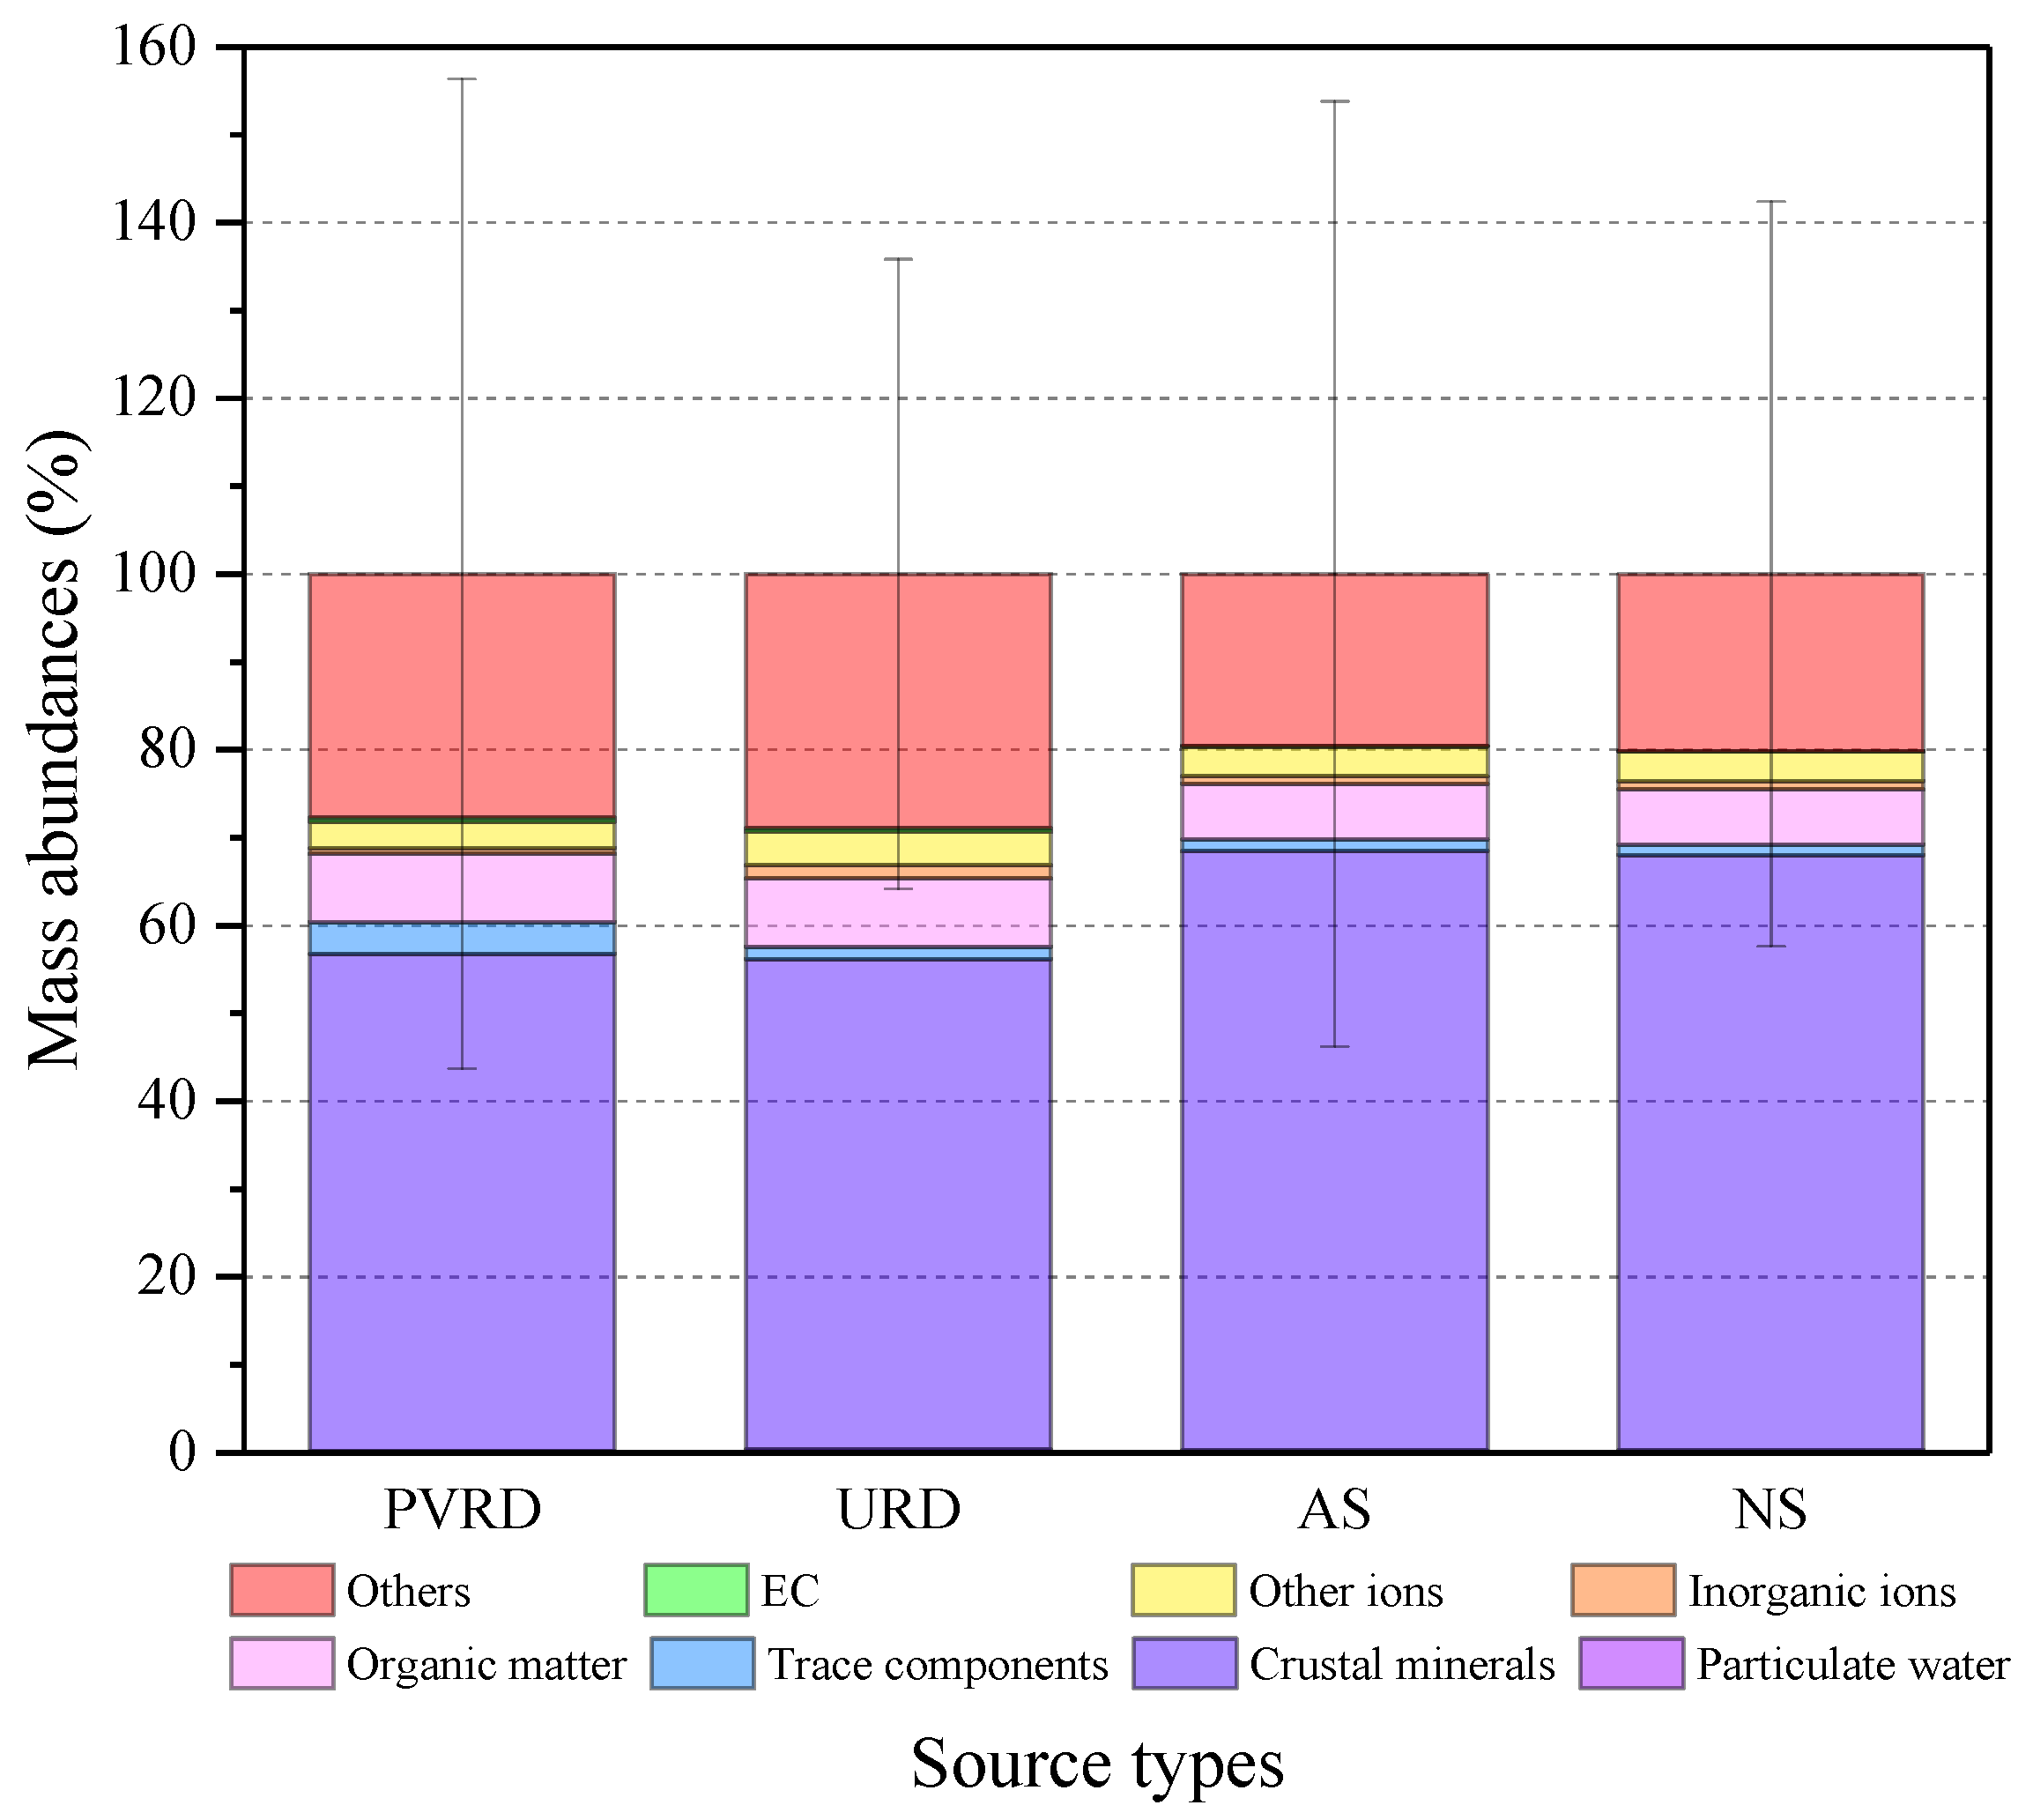
Contributions of the major components to PM10 have been derived from the elements, ions, OC, and EC (Figure 3). To better account for the emission features, eight major constituents in profiles were estimated: particulate water, crustal minerals, trace components, organic matter, inorganic ions, other ions, elemental carbon and others. The seven constituents composed of multiple species were calculated as follows:
(1)
Particulate water on PM was associated with hygroscopic species such as nitrates, sulfates and some organic species [36]. Murillo et al. [37] calculated particulate water associated with PM2.5 from Salamanca by multiplying 0.32 to the sum of NH4+ and SO42−, whereas Frank [38] used the value of 0.24. The ratio of 0.28 was used in this study, which is the median of the values from two researches.
(2)
Crustal minerals were expressed as 1.89Al + 2.14 Si + 1.4Ca + 1.2K + 1.43Fe + 1.67Ti, assuming the common oxide forms of Al2O3, SiO2, CaO, K2O, Fe2O3 and TiO2 [39,40]. The IMPROVE recommended soil formula expressed minerals as the sum of the oxides of Al, Si, Ca, Ti and Fe, and other unmeasured compounds were compensated by multiply a factor of 1.16. However, the factor of 1.16 was thought to overestimate crustal fraction [41]. Thus, the first formula was used in our research.
(3)
Trace components were determined as sum of trace elements (All elements except for Al, Si, Ca, K, Fe and Ti) and their oxides such as Na2O, CuO, PbO2 and so on. The oxides were calculated by multiplying trace element abundances by corresponding ratios. Each ratio of the element was obtained from research of Reff et al. [42].
(4)
Organic matter (OM) was calculated by multiplying OC abundance by ratio of OM/OC. Chow et al. [41] found that multipliers varied from 1.2 to 2.6 depending on the extent of OM oxidation and secondary organic aerosol formation. In this study, the values of 1.4 and 1.8 were applied for urban and non-urban sites, respectively.
(5)
SO42−, NO3 and NH4+ are summed without weighting factors for inorganic ions [43].
(6)
The other ions include Na+, Mg2+, Ca2+, K+, F and Cl.
(7)
Others, the remaining mass of PM, may be attributed to unknown sources, measurement errors and improper multipliers.
Results of group divisions for eight major species in four different sources are shown in Figure 3. Overall, crustal minerals and others comprised the majority of geological sources, accounting for 56%–68% and 20%–29%, respectively. The results were relatively consistent as Cheng et al. [30] reported in dust of PM10–2.5 near a Hong Kong roadway. Crustal minerals of urban paved road and resuspended dust were ~17% lower while others were ~50% higher than that of agricultural and natural soil, which indicated more anthropogenic influence on urban sites. Organic matter showed comparable mean mass abundances: 7.8% ± 3.2%, 7.8% ± 2.0%, 6.4% ± 3.3% and 6.3% ± 1.1% for PVRD, URD, AS and NS, respectively. EC abundances were lowest in NS (0.004% ± 0.009%) while Inorganic ions fraction were most abundant in URD (1.49% ± 1.06%). These results agreed well with studies in other regions of the world [15,16,17,19], and indicated that human activity-related factors, such as vehicle exhaust, can greatly modify the chemical characteristics of entrained crustal material from sources affected by these activities.

3.3. Enrichment Factor

The observed elemental abundances in this study and the composition of local background soil (Table S3) were compared to determine the magnitude and patterns of soil enrichments. The soil background values are from samples collected in local region as described by the Ministry of Environmental Protection [44]. Enrichment factors (EFs), which are calculated relative to composition of upper continental crust (UCC), have been commonly used in aerosol studies [18,23,45]. The EF method can determine whether the elemental concentrations were relatively enriched or not. EFs were calculated by:
Enrichment   Factor ( X ) = [ C o n c e n t r a t i o n ( X ) C o n c e n t r a t i o n ( R e f e r e n c e ) ] s a m p l e [ C o n c e n t r a t i o n ( X ) C o n c e n t r a t i o n ( R e f e r e n c e ) ] c r u s t a l
where X refers to the concentration of the element interest, and reference element refers to the concentration of crustal soil. Al was used as the reference element, based on previous studies that identified a minimal traffic-associated increment for Al [46].
The EFs calculated for each element in this study are shown in Figure 4. The following definitions are applied: 1 < EF < 10 is minimal enrichment; 10 < EF < 100 is moderate enrichment [47]; and EF > 100 is considerable enrichment. If EF approaches reliable, crustal material is probably the dominant source for dust from southwest China. As Figure 4 shows, the EFs were <10 for the crustal-related elements (Na, Mg, Si, K, Ca, Ti, Mn and Fe), which is comparable to Cao et al. [23] who reported in Chinese Loess Plateau. Compared with the crustal elements, the EFs for Cu, Se, Sr and Ba of all the four source types are 1~2 orders of magnitude higher, indicating the influence of anthropogenic pollution sources. EFs for Zn, Sn, Cr, Pb, Tl and Be exceeded 10, and even exceeded amounts up to 1000 in urban paved road dust profiles. As coal and biofuels are the dominant energy sources for residents and industries in this region, the combustion-related elements such as Se, Sn and Tl were highly enriched. Local vehicle emissions may increase the abundances of elements such as Zn, Cu, Pb and Sn [10,48,49].

4. Comparison of Chemical Composition with Other Regions

To better understand the representativeness of the profiles established in this study, we compared them with previously reported source profiles for geological sources. The source profiles were extracted from the USEPA SPECIATE 4.5 database and other published literature. Profiles included fugitive dust from California (profile numbers 3481 and 4180) [9,50], Chicago (profile number 3982) [51], Arizona [15], Mexico [52], and several Chinese cities [14,18,19,20,21,24,33,47].
For urban paved road dust in southwestern China, all species in our study were comparable with other profiles, except for Ca, SO42− and NO3. Their mean mass abundances were 0.3~0.8, 1.3~3.3 and 2.0~6.7 times those in other profiles. The relatively high SO42− may be associated with the acid rain [53,54]. NO3 in agricultural soil was nearly one order of magnitude higher than other studies. Over use of nitrogen fertilizer may result in high NO3 and soil acidification in southwestern China. Until now, only two studies have investigated the source profiles of urban resuspended dust: Zhao et al. [33] in six northern Chinese cities, and Kong et al. [19] in Dongying. The mass abundance of species in this study was similar to those in previous studies. The major compositions were Si, Al, Ca, OC, Fe, Mg and K.
Elemental ratios can be considered as makers to trace the origin of fugitive dust [14,24,55]. In this study, the ratios of Si, K, Ca, Ti, Mn, Fe, Zn, As, and Pb to Al in geological sources from different urban, loess and desert regions [14,23,30,56] are exhibited in Table S4. All the Si/Al ratios in fugitive dust are lower than the values of PM10 in loess and desert samples from Chinese loess plateau, Taklimakan desert, and Xinjiang Gobi. These ratios in geological sources from southwestern China are lower than those from other regions and similar to ambient sample near a Hong Kong roadway. Fe/Al has a low ratio, from 0.13 to 0.56, in this study in comparison with that reported in other researches, whereas the Ca/Al ratios were at the same levels compared with the desert regions of Taklimakan and Xinjiang Gobi. The high Ca/Al ratios of urban road dust may indicate heavy influence from anthropogenic emissions such as construction activities. Ca/Al ratios can be taken as a tracer to distinguish the geological sources from urban or non-urban areas. Shen et al. [14] used this ratio to trace the sources of urban dust from local or long distance transportation. Mn/Al and K/Al ratios in this study were comparable with those of dust samples from the northern Chinese cities, Chinese loess and desert, which indicates Mn and Al might be mainly from crustal minerals. Zn/Al and Pb/Al in urban geological sources are much higher than those in non-urban areas while As/Al are relatively consistent. High elemental ratios are observed in aerosol samples near a roadway from Hong Kong.

5. Conclusions

In this study, we used the profile-compositing method to analyze the individual and composite geological dust profiles from southwest China. Correlation, t-test and R/U ratios were used to quantify similarity and difference among source profiles. These approaches can also be used for data quality control for other related studies.
Obvious differences were found among four geological source profiles. Zn, V, Sn and EC marked urban paved road dust; Al, Si, K+ and NH4+ abundances were most distinctive in the agricultural soil; and Al and Si marked natural soil. Urban resuspended dust was marked by SO42−.
The results of EF analysis indicate that crustal material is the dominant contributor to the four source types. EFs for Cu, Se, Sr and Ba showed that these elements were influenced by anthropogenic pollution sources. Toxic species such as Tl and Be were highly enriched in the urban paved road dust.
Elemental ratios were taken to highlight the features of geological sources from southwest China by comparing with dust samples from northern urban areas, loess and desert. Low Si/Al and Fe/Al ratios can be used as markers to trace geological sources from southwest China. High Pb/Al and Zn/Al ratios observed in urban areas demonstrated that urban geological sources were influenced seriously by non-crustal sources.
As geological source profiles in southwestern Chinese cities are limited, more samples are needed to acquire to verify and compare the reliability of the results presented here. In addition, further study is needed to focus on the chemical composition of geological dust samples in different size fractions such as PM2.5 and TSP.

Supplementary Materials

The following are available online at https://www.mdpi.com/2073-4433/7/11/146/s1. Table S1: Statistical measures for similarities and difference among geological source profiles from southwest China, Table S2: Composite geological source profiles (percentage of PM10 mass) from southwest China, Table S3: Environmental background values for elements in surface soil from south-west regions of China, Table S4: Elemental ratios in geological sources from different urban, loess and desert regions.

Acknowledgments

This research is supported by the special fund for basic work of Ministry of Science and Technology in China (2013FY112700). We sincerely thank Merched AZZI and Hai Yu from Commonwealth Scientific and Industrial Research Organization (CSRIO) affiliated Australian Government for improving the quality of this paper.

Author Contributions

Wen Yang and Xinhua Wang carried out collection of samples; Zhipeng Bai and Bin Han gave revision suggestions for this manuscript; Xueyan Zhao and Yayong Liu carriedout the data analysis; Wenjie Zhang and Yayong Liu defined the research theme and finished this manuscript.

Conflicts of Interest

The authors declare no conflict of interest.

References

  1. Huang, R.J.; Zhang, Y.; Bozzetti, C.; Ho, K.F.; Cao, J.J.; Han, Y.; Daellenbach, K.R.; Slowik, J.G.; Platt, S.M.; Canonaco, F. High secondary aerosol contribution to particulate pollution during haze events in China. Nature 2014, 514, 218–222. [Google Scholar] [CrossRef] [PubMed]
  2. Liu, B.; Song, N.; Dai, Q.; Mei, R.; Sui, B.; Bi, X.; Feng, Y. Chemical composition and source apportionment of ambient PM2.5 during the non-heating period in Taian, China. Atmos. Res. 2015, 170, 23–33. [Google Scholar] [CrossRef]
  3. Tao, J.; Zhang, L.; Ho, K.; Zhang, R.; Lin, Z.; Zhang, Z.; Lin, M.; Cao, J.; Liu, S.; Wang, G. Impact of PM2.5 chemical compositions on aerosol light scattering in Guangzhou—The largest megacity in South China. Atmos. Res. 2014, 135–136, 48–58. [Google Scholar] [CrossRef]
  4. Chan, C.K.; Yao, X. Air pollution in mega cities in China. Atmos. Environ. 2008, 42, 1–42. [Google Scholar] [CrossRef]
  5. Zhang, Q.; He, K.; Huo, H. Policy: Cleaning China’s air. Nature 2012, 484, 161–162. [Google Scholar] [PubMed]
  6. Chinese State Council. Atmospheric Pollution Prevention and Control Action Plan. Available online: http://www.gov.cn/zwgk/2013-09/12/content_2486773.htm (accessed on 16 November 2016). (In Chinese)
  7. Cao, J.; Xu, H.; Xu, Q.; Chen, B.; Kan, H. Fine particulate matter constituents and cardiopulmonary mortality in a heavily polluted Chinese city. Environ. Health Perspect. 2012, 120, 373–378. [Google Scholar] [CrossRef] [PubMed]
  8. Cao, J.J.; Shen, Z.X.; Chow, J.C.; Watson, J.G.; Lee, S.C.; Tie, X.X.; Ho, K.F.; Wang, G.H.; Han, Y.M. Winter and summer PM2.5 chemical compositions in fourteen Chinese cities. J. Air Waste Manag. 2012, 62, 1214–1226. [Google Scholar] [CrossRef]
  9. Chow, J.C.; Watson, J.G.; Ashbaugh, L.L.; Magliano, K.L. Similarities and differences in PM10 chemical source profiles for geological dust from the San Joaquin Valley, California. Atmos. Environ. 2003, 37, 1317–1340. [Google Scholar] [CrossRef]
  10. Pant, P.; Baker, S.J.; Shukla, A.; Maikawa, C.; Pollitt, K.J.G.; Harrison, R.M. The PM10 fraction of road dust in the UK and India: Characterization, source profiles and oxidative potential. Sci. Total Environ. 2015, 530–531, 445–452. [Google Scholar] [CrossRef] [PubMed]
  11. Alam, K. Particulate matter and its source apportionment in Peshawar, Northern Pakistan. Aerosol Air Qual. Res. 2015, 15, 634–647. [Google Scholar] [CrossRef]
  12. Pernigotti, D.; Belis, C.A.; Spanò, L. SPECIEUROPE: The European data base for PM source profiles. Atmos. Pollut. Res. 2016, 7, 307–314. [Google Scholar] [CrossRef]
  13. Simon, H.; Bhave, P.V.; Swall, J.L.; Frank, N.H.; Malm, W.C. Determining the spatial and seasonal variability in OM/OC ratios across the US using multiple regression. Atmos. Chem. Phys. 2010, 11, 2933–2949. [Google Scholar] [CrossRef] [Green Version]
  14. Shen, Z.; Jian, S.; Cao, J.; Zhang, L.; Qian, Z.; Lei, Y.; Gao, J.; Huang, R.J.; Liu, S.; Yu, H. Chemical profiles of urban fugitive dust PM2.5 samples in Northern Chinese cities. Sci. Total Environ. 2016, 569–570, 619–626. [Google Scholar] [CrossRef] [PubMed]
  15. Upadhyay, N. Size-differentiated chemical composition of re-Suspended soil dust from the desert southwest United States. Aerosol Air Qual. Res. 2015, 15, 387–398. [Google Scholar] [CrossRef]
  16. Matawle, J.L. Characterization of PM2.5 source profiles for traffic and dust sources in Raipur, India. Aerosol Air Qual. Res. 2015, 15, 2537–2548. [Google Scholar] [CrossRef]
  17. Wang, X.; Chow, J.C.; Kohl, S.D.; Percy, K.E.; Legge, A.H.; Watson, J.G. Characterization of PM2.5 and PM10 fugitive dust source profiles in the Athabasca oil sands region. J. Air Waste Manag. 2015, 65, 1421–1433. [Google Scholar] [CrossRef] [PubMed]
  18. Han, J. Chemical caracterizations of PM10 profiles for major emission sources in Xining, northwestern China. Aerosol Air Qual. Res. 2014, 14, 1017–1027. [Google Scholar]
  19. Kong, S. Similarities and differences in PM2.5, PM10 and TSP chemical profiles of fugitive dust sources in a coastal oilfield city in China. Aerosol Air Qual. Res. 2014, 14, 2017–2028. [Google Scholar] [CrossRef]
  20. Kong, S.; Ji, Y.; Lu, B.; Chen, L.; Han, B.; Li, Z.; Bai, Z. Characterization of PM10 source profiles for fugitive dust in Fushun—A city famous for coal. Atmos. Environ. 2011, 45, 5351–5365. [Google Scholar] [CrossRef]
  21. Ho, K.F.; Lee, S.C.; Chow, J.C.; Watson, J.G. Characterization of PM10 and PM2.5 source profiles for fugitive dust in Hong Kong. Atmos. Environ. 2003, 37, 1023–1032. [Google Scholar] [CrossRef]
  22. Bhaskar, V.S.; Sharma, M. Assessment of fugitive road dust emissions in Kanpur, India: A note. Transp. Res. Part D Transp. Environ. 2008, 13, 400–403. [Google Scholar] [CrossRef]
  23. Cao, J.J.; Chow, J.C.; Watson, J.G.; Wu, F.; Han, Y.M.; Jin, Z.D.; Shen, Z.X.; An, Z.S. Size-differentiated source profiles for fugitive dust in the Chinese Loess Plateau. Atmos. Environ. 2008, 42, 2261–2275. [Google Scholar] [CrossRef]
  24. Zhang, Q.; Shen, Z.; Cao, J.; Ho, K.F.; Zhang, R.; Bie, Z.; Chang, H.; Liu, S. Chemical profiles of urban fugitive dust over Xi’an in the south margin of the Loess Plateau, China. Atmos. Pollut. Res. 2014, 5, 421–430. [Google Scholar] [CrossRef]
  25. Zhang, X.Y.; Wang, Y.Q.; Zhang, X.C.; Guo, W.; Niu, T.; Gong, S.L.; Yin, Y.; Zhao, P.; Jin, J.L.; Yu, M. Aerosol monitoring at multiple locations in China: Contributions of EC and dust to aerosol light absorption. Tellus Ser. B Chem. Phys. Meteorol. 2008, 60, 647–656. [Google Scholar] [CrossRef]
  26. Fang, M.; Chan, C.K.; Yao, X. Managing air quality in a rapidly developing nation: China. Atmos. Environ. 2009, 43, 79–86. [Google Scholar] [CrossRef]
  27. Zhao, Q.; He, K.; Rahn, K.A.; Ma, Y. Dust storms come to central and southwestern China, too: Implications from a major dust event in Chongqing. Atmos. Chem. Phys. 2010, 10, 139–146. [Google Scholar] [CrossRef]
  28. Li, R. Multi-satellite observation of an intense dust event over southwestern China. Aerosol Air Qual. Res. 2015, 15, 263–270. [Google Scholar] [CrossRef]
  29. Ren, L.; Zhou, Z.; Zhao, X.; Wen, Y.; Yin, B.; Bai, Z.; Ji, Y. Source apportionment of PM2.5 and PM10 in urban areas of Chongqing. Res. Environ. Sci. 2014, 27, 1387–1394. [Google Scholar]
  30. Cheng, Y.; Lee, S.; Gu, Z.; Ho, K.; Zhang, Y.; Huang, Y.; Chow, J.C.; Watson, J.G.; Cao, J.; Zhang, R. PM2.5 and PM10–2.5 chemical composition and source apportionment near a Hong Kong roadway. Particuology 2015, 18, 96–104. [Google Scholar] [CrossRef]
  31. Wu, B.; Shen, X.; Cao, X.; Yao, Z.; Wu, Y. Characterization of the chemical composition of PM2.5 emitted from on-road China III and China IV diesel trucks in Beijing, China. Sci. Total Environ. 2016, 551–552, 579–589. [Google Scholar] [CrossRef] [PubMed]
  32. Watson, J.G.; Chow, J.C.; Houck, J.E. PM2.5 chemical source profiles for vehicle exhaust, vegetative burning, geological material, and coal burning in Northwestern Colorado during 1995. Chemosphere 2001, 43, 1141–1151. [Google Scholar] [CrossRef]
  33. Zhao, P.; Feng, Y.; Zhu, T.; Wu, J. Characterizations of resuspended dust in six cities of North China. Atmos. Environ. 2006, 40, 5807–5814. [Google Scholar] [CrossRef]
  34. Gupta, A.K.; Karar, K.; Srivastava, A. Chemical mass balance source apportionment of PM10 and TSP in residential and industrial sites of an urban region of Kolkata, India. J. Hazard. Mater. 2007, 142, 279–287. [Google Scholar] [CrossRef] [PubMed]
  35. Kang, D.; Pang, S. The leaching pattern of aluminium from soils collected from southwestern China by acid rain. Acta Sci. Circumst. 1987, 2, 013. [Google Scholar]
  36. Malm, W.C.; Schichtel, B.A.; Pitchford, M.L. Uncertainties in PM2.5 gravimetric and speciation measurements and what we can learn from them. J. Air Waste Manag. 2011, 61, 1131–1149. [Google Scholar]
  37. Murillo, J.H.; Ramos, A.C.; García, F.Á.; Jiménez, S.B.; Cárdenas, B.; Mizohata, A. Chemical composition of PM2.5 particles in Salamanca, Guanajuato Mexico: Source apportionment with receptor models. Atmos. Res. 2012, 107, 31–41. [Google Scholar] [CrossRef]
  38. Frank, N.H. Retained nitrate, hydrated sulfates, and carbonaceous mass in federal reference method fine particulate matter for six eastern U.S. cities. J. Air Waste Manag. Assoc. 2006, 56, 500–511. [Google Scholar] [CrossRef] [PubMed]
  39. Macias, E.S.; Zwicker, J.O.; Ouimette, J.R.; Hering, S.V.; Friedlander, S.K.; Cahill, T.A.; Kuhlmey, G.A.; Richards, L.W. Regional haze case studies in the southwestern U.S—I. Aerosol chemical composition. Atmos. Environ. 1981, 15, 1971–1986. [Google Scholar] [CrossRef]
  40. Ni, T. Spatial and temporal variation of chemical composition and mass closure of ambient PM10 in Tianjin, China. Aerosol Air Qual. Res. 2013, 13, 1832–1846. [Google Scholar] [CrossRef]
  41. Chow, J.C.; Lowenthal, D.H.; Chen, L.W.A.; Wang, X.; Watson, J.G. Mass reconstruction methods for PM2.5: A review. Air Qual. Atmos. Health 2015, 8, 243–263. [Google Scholar] [CrossRef] [PubMed]
  42. Reff, A.; Bhave, P.V.; Simon, H.; Pace, T.G.; Pouliot, G.A.; Mobley, J.D.; Houyoux, M. Emissions inventory of PM2.5 trace elements across the United States. Environ. Sci. Technol. 2009, 43, 5790–5796. [Google Scholar] [CrossRef] [PubMed]
  43. Chow, J.C.; Watson, J.G.; Fujita, E.M.; Lu, Z.; Lawson, D.R.; Ashbaugh, L.L. Temporal and spatial variations of PM2.5 and PM10 aerosol in the Southern California air quality study. Atmos. Environ. 1994, 28, 2061–2080. [Google Scholar] [CrossRef]
  44. Protection, M.O.E.; Centre, N.E.M. Background Values of Soil Elements in China; China Environmental Science Press: Beijing, China, 1990. [Google Scholar]
  45. Zhang, N.; Cao, J.; Liu, S.; Zhao, Z.Z.; Xu, H.; Xiao, S. Chemical composition and sources of PM2.5 and TSP collected at Qinghai Lake during summertime. Atmos. Res. 2014, 138, 213–222. [Google Scholar] [CrossRef]
  46. Birmili, W.; Allen, A.G.; Bary, F.; Harrison, R.M. Trace metal concentrations and water solubility in size-fractionated atmospheric particles and influence of road traffic. Environ. Sci. Technol. 2006, 40, 1144–1153. [Google Scholar] [CrossRef] [PubMed]
  47. Chen, J.; Wang, W.; Liu, H.; Ren, L. Determination of road dust loadings and chemical characteristics using resuspension. Environ. Monit. Assess. 2012, 184, 1693–1709. [Google Scholar] [CrossRef] [PubMed]
  48. Xu, H.M.; Cao, J.J.; Ho, K.F.; Ding, H.; Han, Y.M.; Wang, G.H.; Chow, J.C.; Watson, J.G.; Khol, S.D.; Qiang, J.; et al. Lead concentrations in fine particulate matter after the phasing out of leaded gasoline in Xi’an, China. Atmos. Environ. 2012, 46, 217–224. [Google Scholar] [CrossRef]
  49. Han, B.; Bai, Z.; Ji, H.; Guo, G.; Wang, F.; Shi, G.; Li, X. Chemical characterizations of PM10 fraction of paved road dust in Anshan, China. Transp. Res. Part D Transp. Environ. 2009, 14, 599–603. [Google Scholar] [CrossRef]
  50. Chow, J.C.; Watson, J.G.; Lowenthal, D.H.; Countess, R.J. Sources and chemistry of PM10 aerosol in Santa Barbara County, CA. Atmos. Environ. 1996, 30, 1489–1499. [Google Scholar] [CrossRef]
  51. Watson, J.G.; Chow, J.C.; Kohl, S.D.; Kuhns, H.D.; Robinson, N.F.; Frazier, C.A.; Etyemezian, V. Annual Report for the Robbins Particulate Study: October 1996 through September 1997; Report No. 7100.4F3; Desert Research Institute: Las Vegas, NV, USA, 1999. [Google Scholar]
  52. Vega, E.; Mugica, V.; Reyes, E.; Sánchez, G.; Chow, J.C. Chemical composition of fugitive dust emitters in Mexico City. Atmos. Environ. 2001, 35, 4033–4039. [Google Scholar] [CrossRef]
  53. Han, G.; Wu, Q.; Tang, Y. Acid rain and alkalization in southwestern China: Chemical and strontium isotope evidence in rainwater from Guiyang. J. Atmos. Chem. 2012, 68, 139–155. [Google Scholar] [CrossRef]
  54. Zhao, D.; Xiong, J.; Yu, X.; Chan, W.H. Acid rain in southwestern China. Atmos. Environ. 1988, 22, 349–358. [Google Scholar]
  55. Arimoto, R.; Zhan, X.Y.; Heubert, B.J. Chemical composition of atmospheric aerosols from Zhenbeitai, China, and Gosan, South Korea, during ACE-Asia. J. Geophys. Res. 2004, 109. [Google Scholar] [CrossRef]
  56. Zhang, R.; Cao, J.; Tang, Y.; Arimoto, R.; Shen, Z.; Wu, F.; Han, Y.; Wang, G.; Zhang, J.; Li, G. Elemental profiles and signatures of fugitive dusts from Chinese deserts. Sci. Total Environ. 2014, 472, 1121–1129. [Google Scholar] [CrossRef] [PubMed]
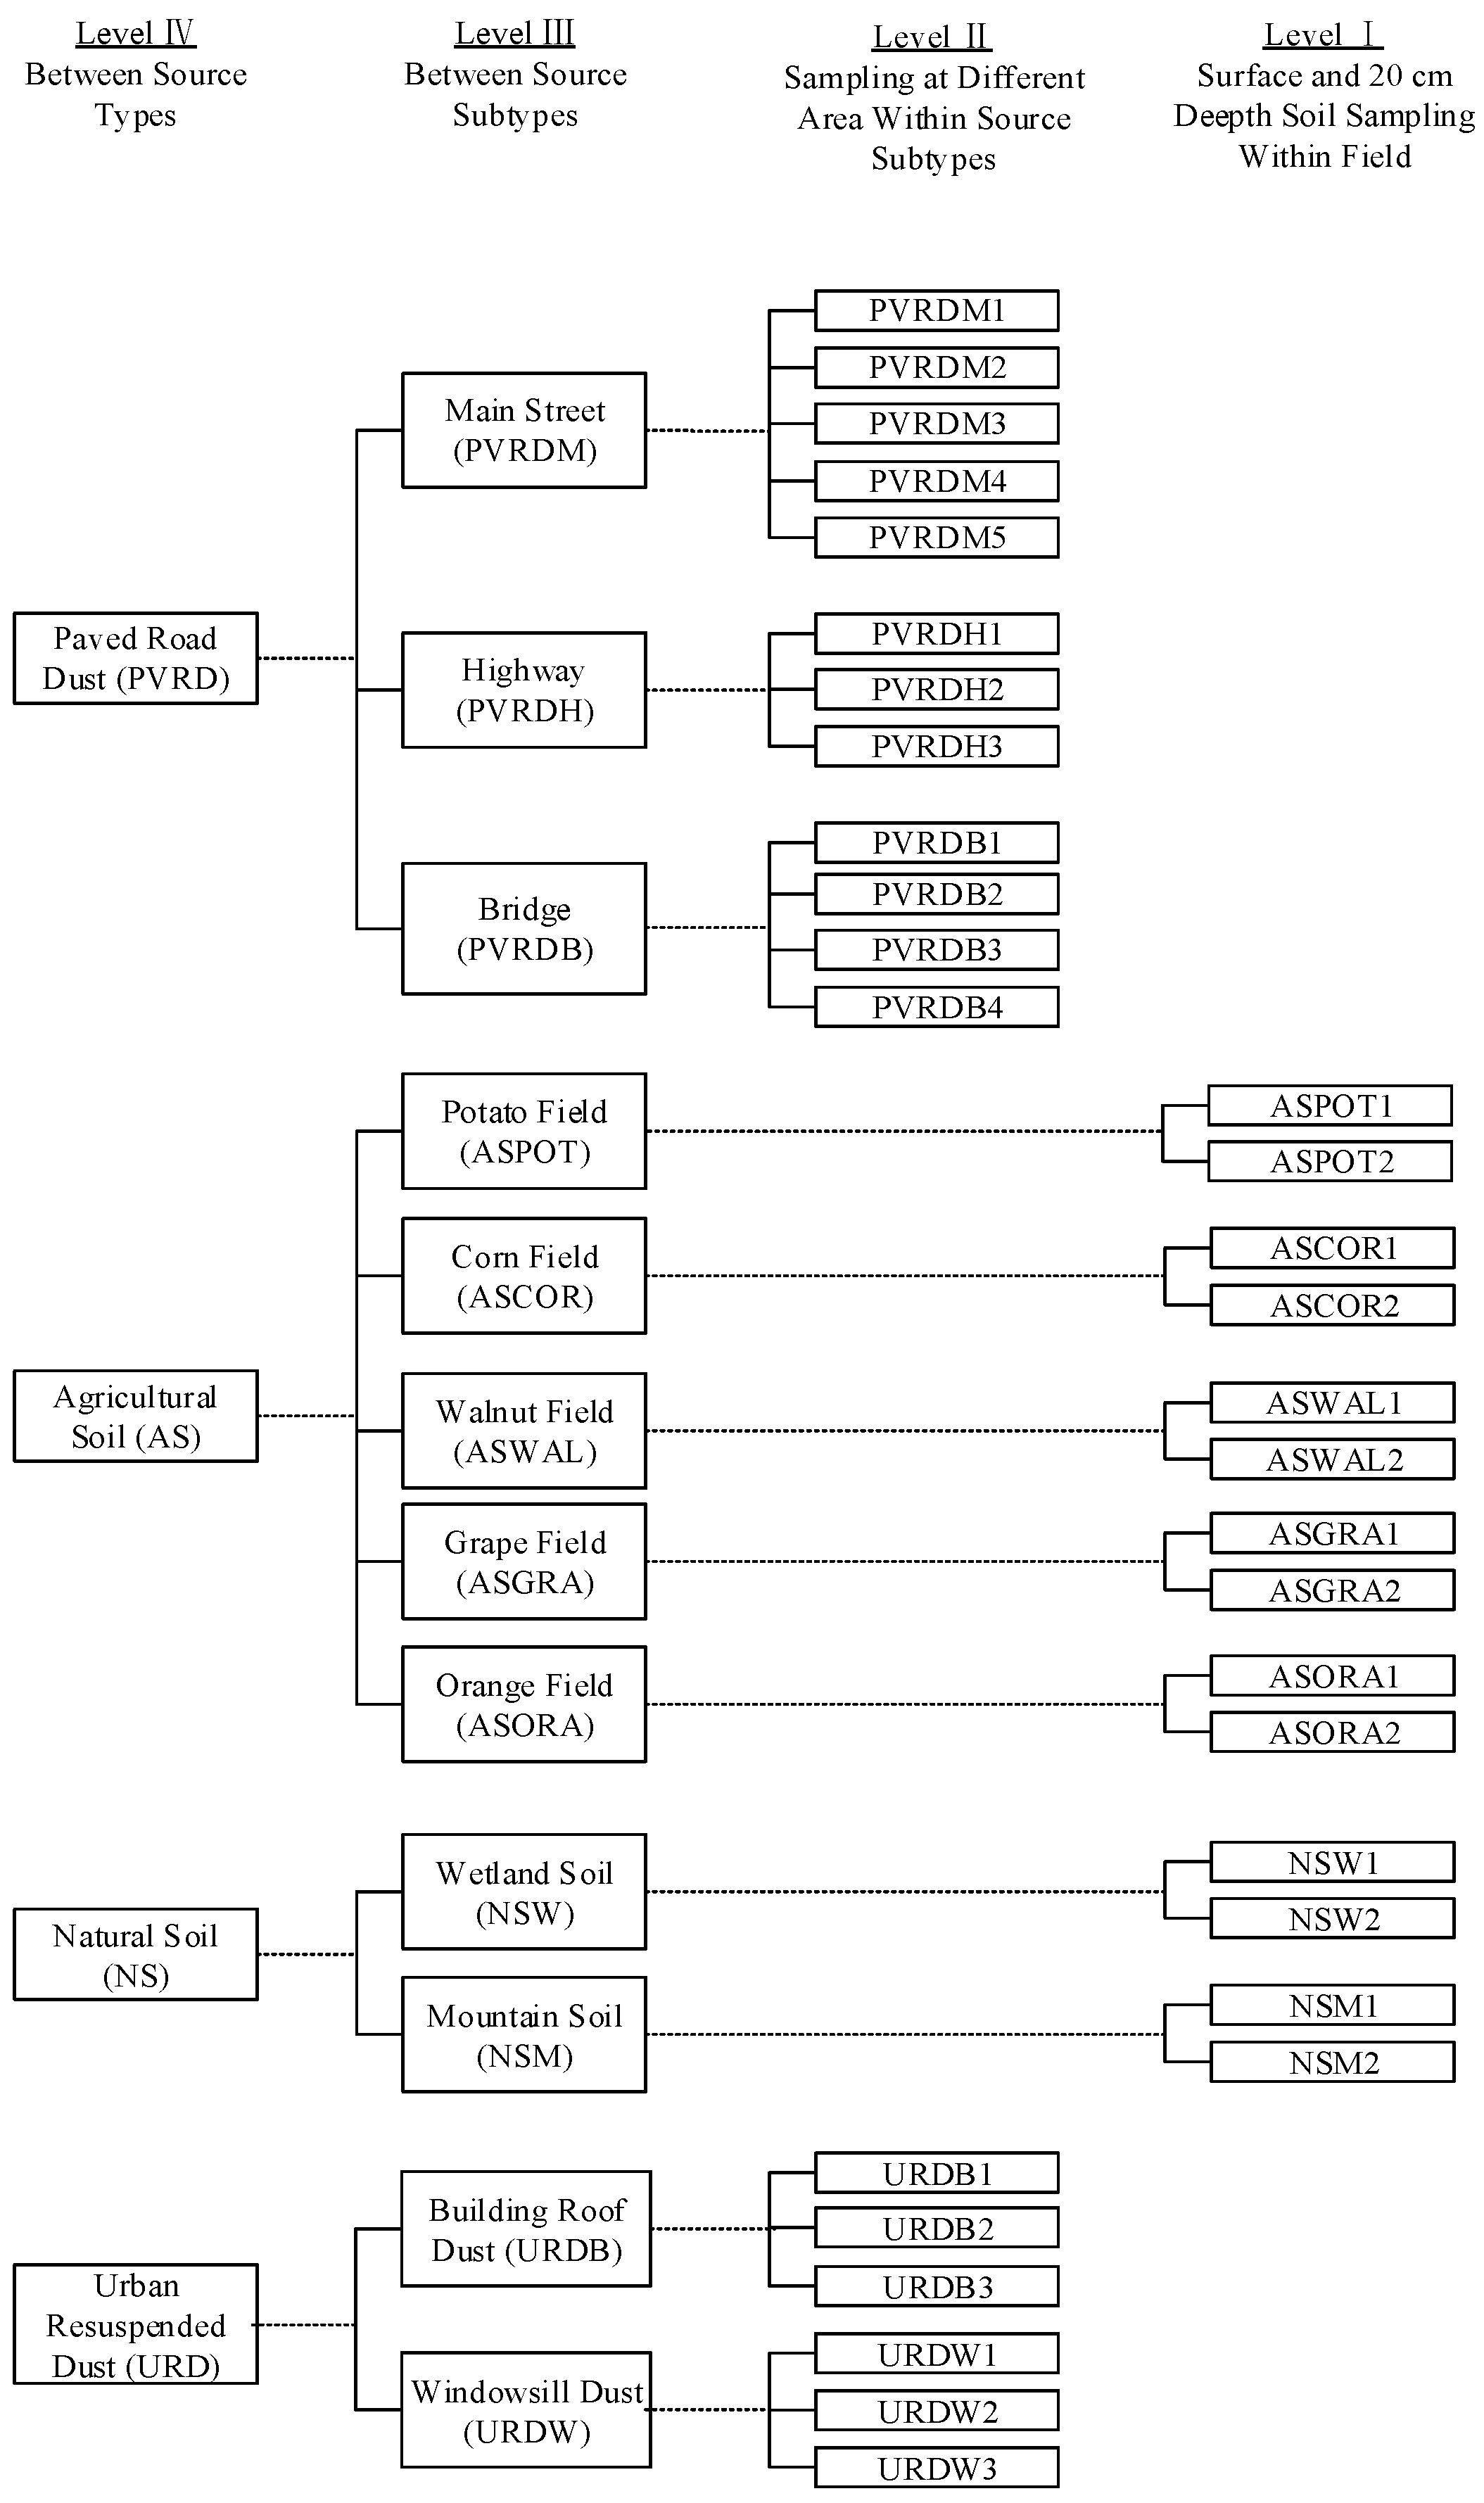
Figure 1. Source profile-compositing scheme for testing within-source and between-source variability. Source profile abbreviations for each level are given in parentheses.
Atmosphere 07 00146 g001
Figure 2. Geological source profiles of paved road dust, urban resuspended dust, natural soil and agricultural soil from southwestern regions of China. The height of each bar indicates the percentage of the corresponding chemical species to PM10. The position of each short line shows the variability in percentage composition, which includes measurement errors and source variabilities.
Atmosphere 07 00146 g002
Figure 3. Major components for geological sources of urban paved road dust (PVRD), urban resuspended dust (URD), agricultural soil (AS) and natural soil (NS) from southwestern regions of China. Error bars represent the total propagated error calculated from the standard deviation of samples within each source type for each chemical component; the definition of each component can be found under the heading “Contributions of the major components”.
Atmosphere 07 00146 g003
Figure 4. Elemental enrichment factors for geological sources of urban paved road dust (PVRD), urban resuspended dust (URD), agricultural soil (AS) and natural soil (NS) from southwestern regions of China. Al is used as reference.
Atmosphere 07 00146 g004
Table 1. Summary of source types of geological dust samples.
Source TypeSource SubtypeTotal Number of SamplesNumber of Different Depths
Surface20 cm Depth
Urban paved roadUrban main street55-
Highway road33-
Bridge44-
Agricultural soilPotato field211
Corn field211
Walnut field211
Grape211
Orange211
Natural soilWetland soil211
Mountain soil211
Resuspended dustroof of buildings33-
Window sills33-
Total 32257